Article

Thermal Behaviour of a Carbonatic Clay: A Multi-Analytical Approach

1
Electron Microscopy Center, Babeş-Bolyai University, 5-7 Clinicilor Str., 400006 Cluj-Napoca, Romania
2
Department of Physics, Babeş-Bolyai University, 1 Kogălniceanu Str., 400084 Cluj-Napoca, Romania
3
Institute of Interdisciplinary Research on Bio-Nano-Sciences, Babeș-Bolyai University, 1 Kogălniceanu Str., 400084 Cluj-Napoca, Romania
4
Division Geography and Geology, Paris Lodron University, 34 Hellbrunner Str., A-5020 Salzburg, Austria
5
Department of Geology, Babeş-Bolyai University, 1 Kogălniceanu Str., 400084 Cluj-Napoca, Romania
*
Author to whom correspondence should be addressed.
20 June 1943 Innsbruck–16 March 2025 Salzburg.
Minerals 2025, 15(4), 390; https://doi.org/10.3390/min15040390
Submission received: 11 February 2025 / Revised: 20 March 2025 / Accepted: 2 April 2025 / Published: 7 April 2025

Abstract

:
A Miocene carbonatic clay quarried in Transylvania (Romania) has been used for more than 100 years for the production of traditional ceramic ware, bricks, and tiles. To investigate the mineralogical and microstructural changes of this clay when heated between 700 °C and 1200 °C, a combination of polarized light optical microscopy, X-ray powder diffraction, scanning electron microscopy coupled with energy dispersive X-ray spectrometry, and Fourier transform infrared spectroscopy was applied. Primary mineral phases such as illite, muscovite, feldspar, carbonate, Fe oxyhydroxides, and quartz undergo a gradual thermal alteration and form, besides a glassy phase, a wide range of minerals such as gehlenite, clinopyroxene, feldspar, maghemite, hematite, mullite, and α-cristobalite. These firing phases can be regarded as ‘ceramic markers’. A comparison between the data obtained by several methods is discussed. The combination of the optical appearance and the microstructure on one side, and the specific associations of primary phases and ceramic markers on the other side, can be used as a ‘ceramic thermometer’ in estimating the firing temperature for ancient ceramics.

Graphical Abstract

1. Introduction

Argillaceous rocks or mudstones, commonly called ‘clays’, have been deeply involved in the history of humankind since the Late Paleolithic–Early Neolithic [1,2], in particular in the production of ceramics, “the first technological revolution in the human history” [3]. Objects made of ceramic material, such as pottery, statuettes, bricks, and tiles, bear information which can be used in archaeometry as well as in mineralogical and petrological studies. A wealth of literature deals with the mineralogical, chemical, and physical processes which are involved in the transformation of a mixture of clay and temper (e.g., ash, sand, shells, straw, chamotte etc.) into a coherent, strong, and insoluble ceramic body. The ceramic technology includes several stages, from extraction and preparation of the raw materials, modelling and shaping, surface treatment, decoration, painting and glazing, to drying and finally firing. Among these, of utmost importance for deciphering the technological level of an ancient society are the firing conditions.
The firing issues related to clay-based ceramics can be solved in several ways. The simplest is to study the ceramic sherds based on the assumption that mineralogical, physical, and chemical characteristics are the result of the technology applied to clayey raw materials. Another way is the experimental one, when ceramic clays are heated [4,5,6,7]. Special attention is given to the clays that can be used for ceramics without tempering because the latter significantly influence the final ceramic microstructure and composition [5,8,9,10,11,12]. Since prehistory, the illitic clays, either carbonatic or non-carbonatic, have been the most used material in producing pottery. Among many types of clays, the carbonatic ones have been most used for experiments because they are highly reactive and may produce upon heating a large range of Si-Ca, Si-Al-Ca, and Si-Al-Ca-Fe firing phases, such as wollastonite, gehlenite, clinopyroxenes, larnite, monticellite, garnet, and feldspars, among others. These firing minerals, as well as the newly-formed glassy phase, play a crucial role in connecting the clay components into a coherent ceramic material [13].
A large range of analytical methods can be applied to study the compositional and structural changes undergone by clays and to solve technological issues such as firing conditions for both modern and ancient ceramics [14]. Each of these analytical methods, taken alone, has advantages as well as limitations. For example, by means of optical microscopy (OM), essential information on the optical characteristics, mineralogical composition, granulometry, and texture are obtained [15,16,17]. Nevertheless, the results are limited by microscope resolution/magnification, the small size of the particles, and the covering effect of the finely distributed Fe compounds. The X-ray powder diffraction (XRPD) helps in identifying the mineral species, but it is not equally useful for low crystallinity and amorphous phases (for nomenclature and details, see [18,19,20,21]). Scanning electron microscopy coupled with energy dispersive X-ray spectrometry (SEM-EDX) is used to obtain data on the physical state and chemistry of a thin surface layer [22,23]. Being able to identify the vibrational frequencies of atomic bonds, the Fourier transform infrared spectroscopy (FTIR) is useful in identifying the crystalline and amorphous phases occurring in low quantity, below 1 vol.% [24]. FTIR is widely used to study both clay minerals [25,26] and mineral phases occurring in the ceramic body [19,24,27,28,29,30,31,32]).
The aim of this study was to find, experimentally, which are the structural and compositional changes which take place in a common clay upon heating, and allow obtaining high quality fine wares. The carbonatic illitic clay was extracted from a single quarry and was used without any temper or additives which might alter the normal path of thermal changes. However, “there is still much to be done to clarify what happens to a ceramic paste when it is fired” [10]. A combination of OM, XRPD, SEM-EDX, and FTIR has been applied in order: (i) to ascertain the characteristic mineral association for each temperature interval, (ii) to investigate the evolution of mineralogy and microstructure with increasing temperature, (iii) to define a ‘ceramic thermometer’ which can be used for ancient ceramics, and (iv) to demonstrate the advantages and limitations of analytical methods used in the study.

2. Materials and Analytical Methods

The studied Miocene clay deposits outcrop in the eastern part of the Transylvanian Basin (Romania) as a thick layer of several tens of meters [33]. The clay is quarried in an open pit at Bodogaia (coordinates: 46°16′15.9″ N and 24°59′3.24″ E), a village located 17 km east of the city of Sighişoara, and transported a couple of km to a small village where a brick factory has been functioning since 1905. Minimal enhancement of the clay starts with a light grinding aimed to disintegrate the larger clay lumps. After mixing with water, the clay is passed through a 1 mm-sieve to separate out the coarse clasts. Following filtering at 15 bars pressure to remove the added water, the material is finally packed under vacuum in 2, 5 and 10 kg blocks. The processed clay has a greenish-grey colour, an excellent plasticity, and a low shrinkage rate. It fires red when there is a constant supply of fresh air at the top of the kiln (oxidising atmosphere). When the kiln is kept closed until the end of firing, the atmosphere is reducing and the pottery is black. This clay is used for hand-made rustic style bricks and traditional pottery, as well as for art modelling. Chemically, the enhanced raw clay contains ~52 wt.% SiO2, 15 wt.% Al2O3, 6 wt.% FeOTOT, 2 wt.% MgO, 3 wt.% K2O, 1 wt.% Na2O, and 1 wt.% TiO2. The loss of ignition is 13 wt.% [7]. As the limit between carbonatic and non-carbonatic clays is conventionally established at 6 wt% CaO [23], our Miocene clay (having 7 wt.% CaO) may be classified as (low)-carbonatic.
For the experiments, the raw clay was hand-shaped into nine briquettes, 5 × 5 × 1 cm in size, which were left for a couple of days to dry at room temperature. Subsequently the briquettes were heated in an electric Nabertherm furnace (Institute of Interdisciplinary Research on Bio-Nano-Sciences, Babeş-Bolyai University Cluj-Napoca), from 700 °C to 1200 °C, with a 10 °C/min rate and 2 h soaking time. The material of the heated clay briquettes is regarded here as ‘ceramics’. The original greenish-grey colour of the raw clay changed upon heating into light reddish brown at 700 and 800 °C, red at 900 and 1000 °C, and again to reddish brown at 1100 °C [7]. Heated for 10 min at 1200 °C, the whole clay briquette melted, then solidified into a black glassy mass of ‘ceramic slag’ [34].
From a lump of raw clay impregnated with epoxy resin to avoid disintegration, as well as from each of the nine heated briquettes, a few mm thick slice was cut with a diamond saw in order to prepare standard petrographic thin sections for OM. The thin sections were investigated with an Axio Imager.A2m Zeiss transmitted light polarizing microscope (Electron Microscopy Center at Babeş-Bolyai University Cluj-Napoca). The images were captured with a Zen 2011 Axio high resolution digital video camera.
A few grams of each sample, hand-milled in an agate mortar, were analysed with a Bruker D8 Advance X-ray diffractometer with Bragg-Brentano geometry (Department of Geology, Babeş-Bolyai University in Cluj-Napoca). The equipment worked at 40 kV and 40 mA, with CuKα1 radiation (λ = 1.5418 Å), a Ni filter, and a LynxEye one-dimensional detector. The data were collected between 5° and 65° 2θ, with 0.02° 2θ step interval and 2 s/step counting time. The mineral identification was based on the Bruker’s Diffrac.Eva 2.1 software and the International Centre for Diffraction Data 2016 database [35]. Corundum NIST SRM1976a (US National Institute of Standards and Technology reference material [36]) served as lab internal standard. Oriented and ethylene glycol-treated raw clay sample were also subject to XRPD in order to distinguish between chlorite and smectite.
The rough surface of small chips taken from each sample was coated with a 20 nm thick layer of Au using a BALTEC-SCD-005 sputter. The JSM-6610 LV scanning electron microscope (University of Belgrade—Faculty of Mining and Geology) worked at an acceleration potential of 20 kV, a 5–10 µm diameter spot, and 50 s live time. The spectra were obtained by an Oxford X-Max energy dispersive spectrometer. The detection limit for most elements was ~0.1 wt.%.
The FTIR spectroscopy was performed at room temperature, with a Bruker Equinox 55 spectrophotometer (Institute of Interdisciplinary Research on Bio-Nano-Sciences at Babeş-Bolyai University Cluj-Napoca). Three milligrams of each powdered sample were mixed with 250 mg of spectroscopically-pure KBr, and analysed immediately after preparation. No hydration risk was encountered and consequently no supplementary thermal treatment was necessary. The spectra were recorded with a 2 cm−1 resolution, in the 400 cm−1 to 4000 cm−1 range. The experimental spectra were checked with fitted spectra using five and six component bands. The interpretation of FTIR data and the identification of mineral phases are based on [37,38,39,40,41,42], as well as the relevant literature.

3. Results

Firstly, the results obtained for the raw clay will be presented, in order to obtain a general image of the composition and structure of the starting material. The data obtained from the heated clay briquettes by using the same analytical methods as those involved in the raw material investigation will follow.

3.1. Raw Clay

3.1.1. Optical Microscopy

A groundmass of undifferentiated fine-grained phyllosilicates, as well as larger lamellae of muscovite, chlorite, and biotite, are the main mineral components of the raw clay (Figure 1a). The clay mineral species (the term ‘clay mineral’ refers to phyllosilicate minerals and to minerals which impart plasticity to clay and which harden upon drying or firing” [43]) could not be identified solely by OM, thus XRPD (Figure 1b) was also involved. Microscopically, quartz occurs as subangular grains, less than 20 μm in size. Micritic carbonate (<5 μm) is unevenly dispersed in the clay mass. Sparite carbonate (up to ~100 μm in size) is rarely found. Primary feldspar (feldsparp = Fspp) occurs as plagioclase and K-feldspar, about 20–25 μm in size. Brown pellets consisting of Fe oxyhydroxides, as well as rare grains of heavy minerals such as zircon, garnet, apatite, monazite and amphibole are also present. Sandstone, mudstone, biotite schist, quartzite, gneiss, and andesite clasts are extremely rare. The raw clay components are below 1 mm in size, as a result of grinding and sieving.

3.1.2. X-Ray Powder Diffraction

All diffraction peaks displayed in Figure 1b are sharp and narrow, reflecting the crystalline state of the material composing the raw clay. The strongest peaks belong to quartz (3.4 Å, 4.3 Å, and 2.2 Å). The peaks at 10 Å, 5 Å, and 4.5 Å are common for illite and muscovite; therefore, they are treated together as ‘illite-muscovite’. Feldspar (3.3 Å and 6.3 Å), calcite (3.0 Å and 2.1 Å), dolomite (2.9 Å), and biotite (3.4 Å) occur as well. The small 14.1 Å peak can be assigned to chlorite.

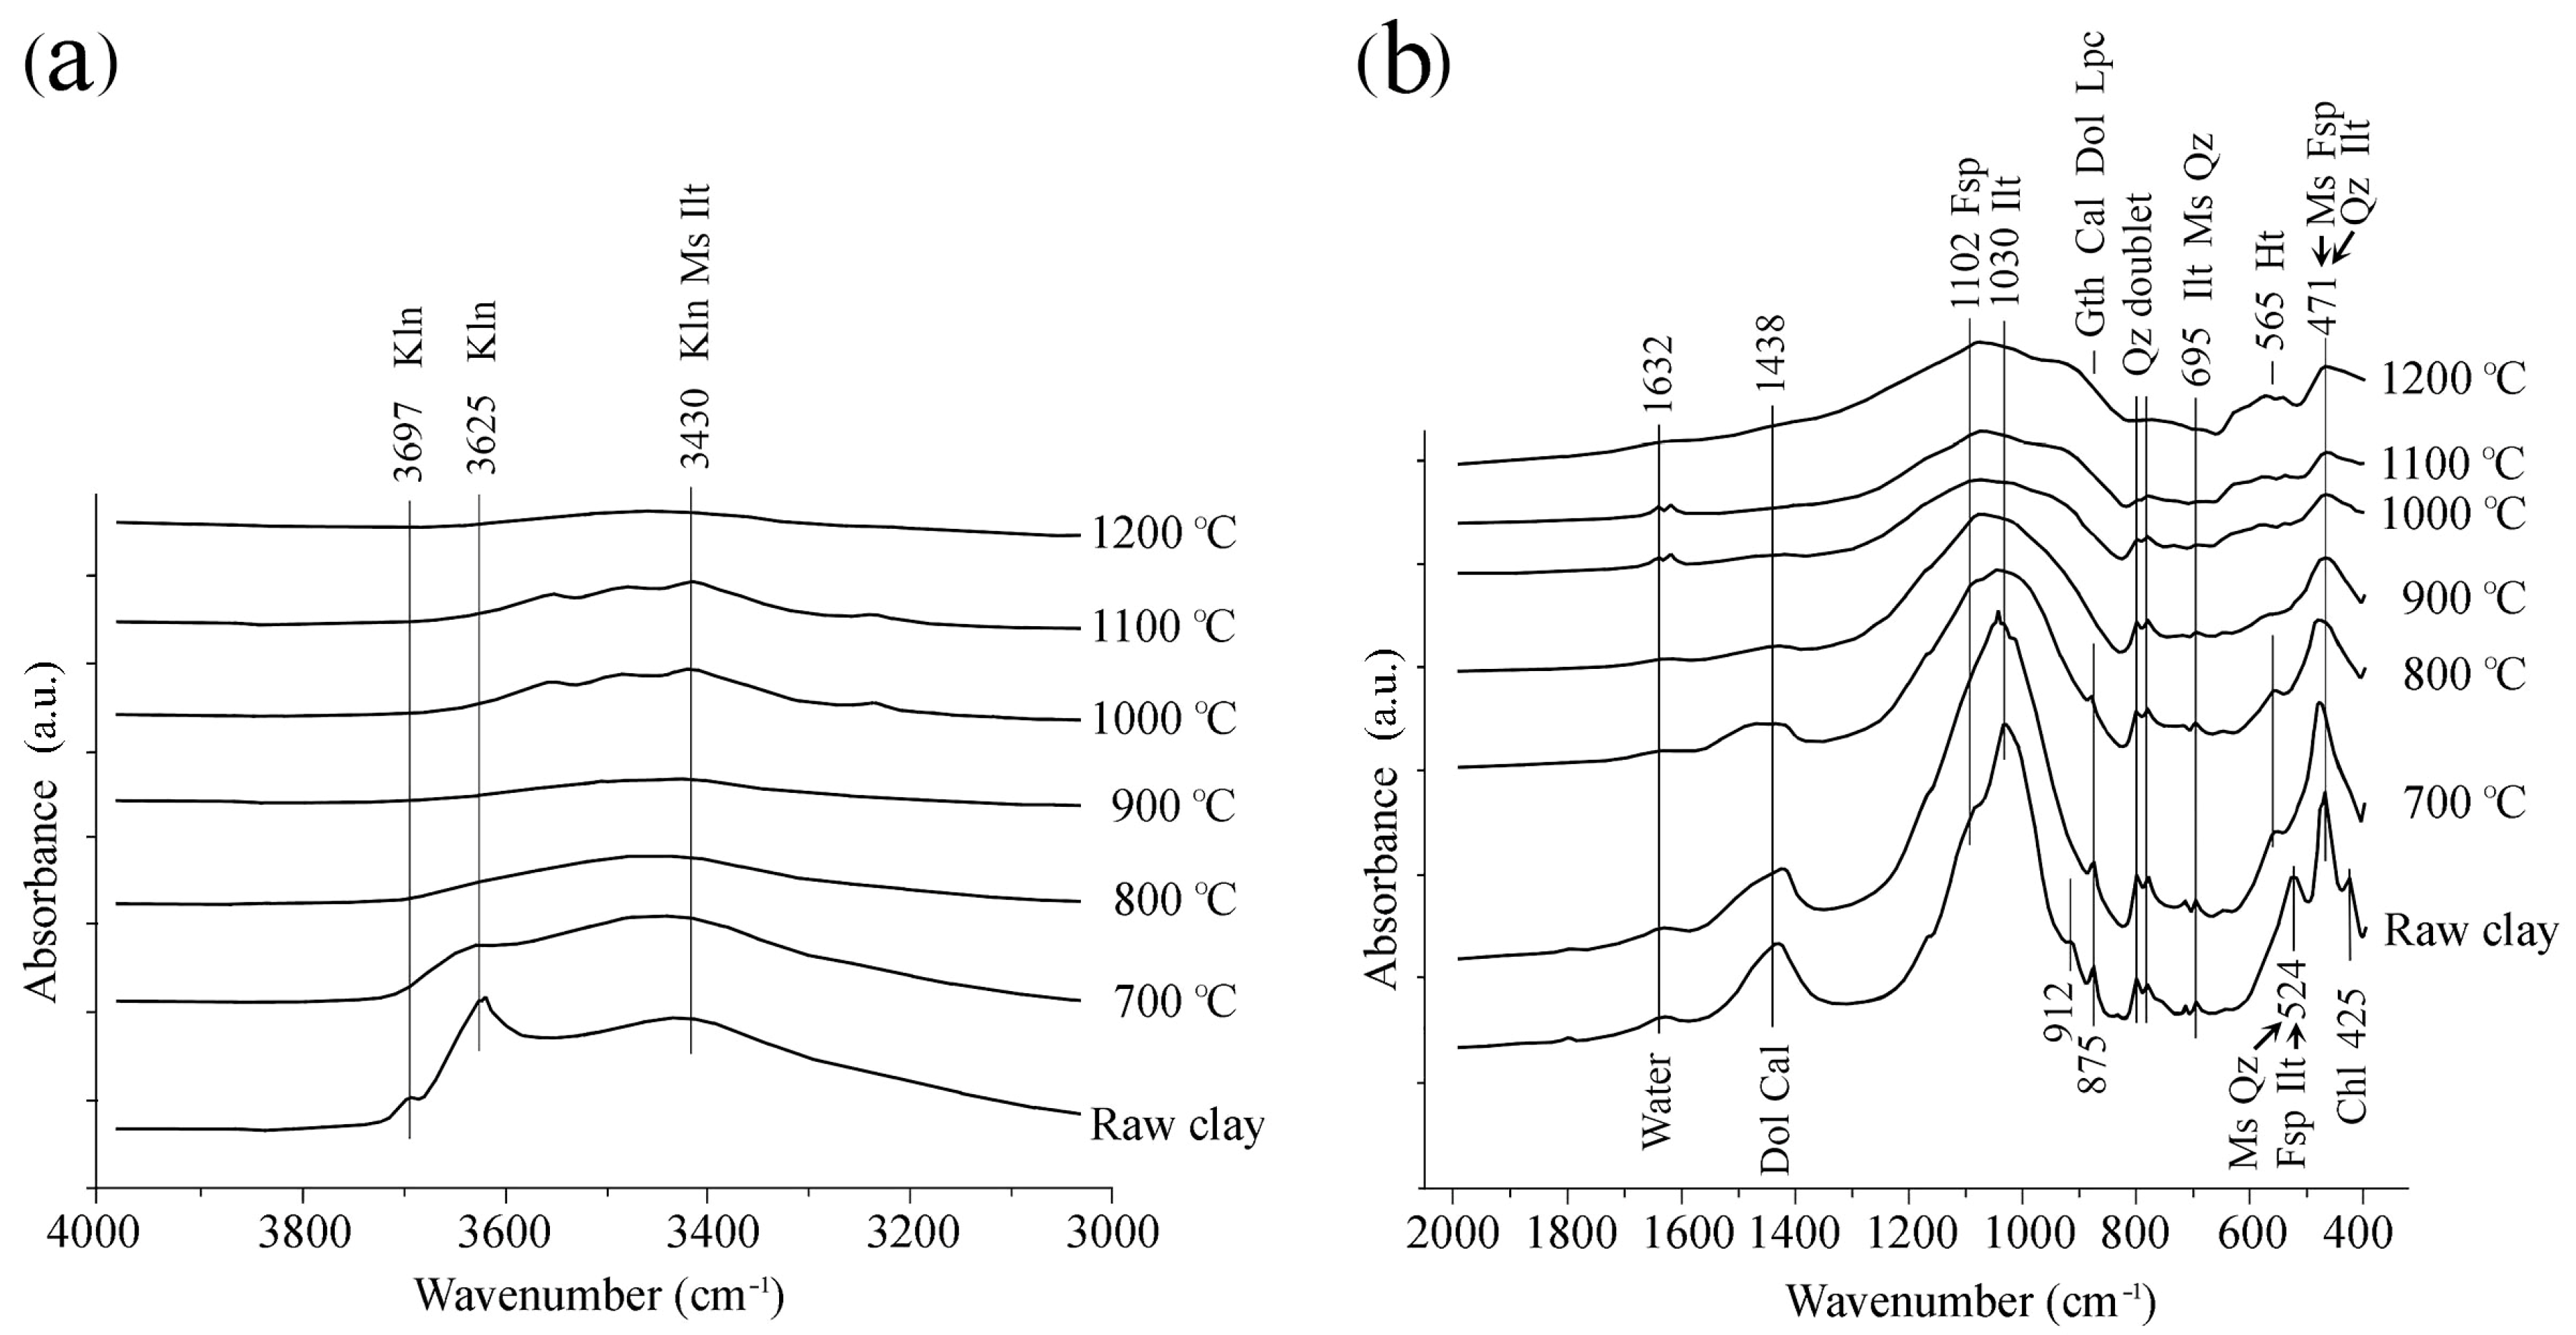
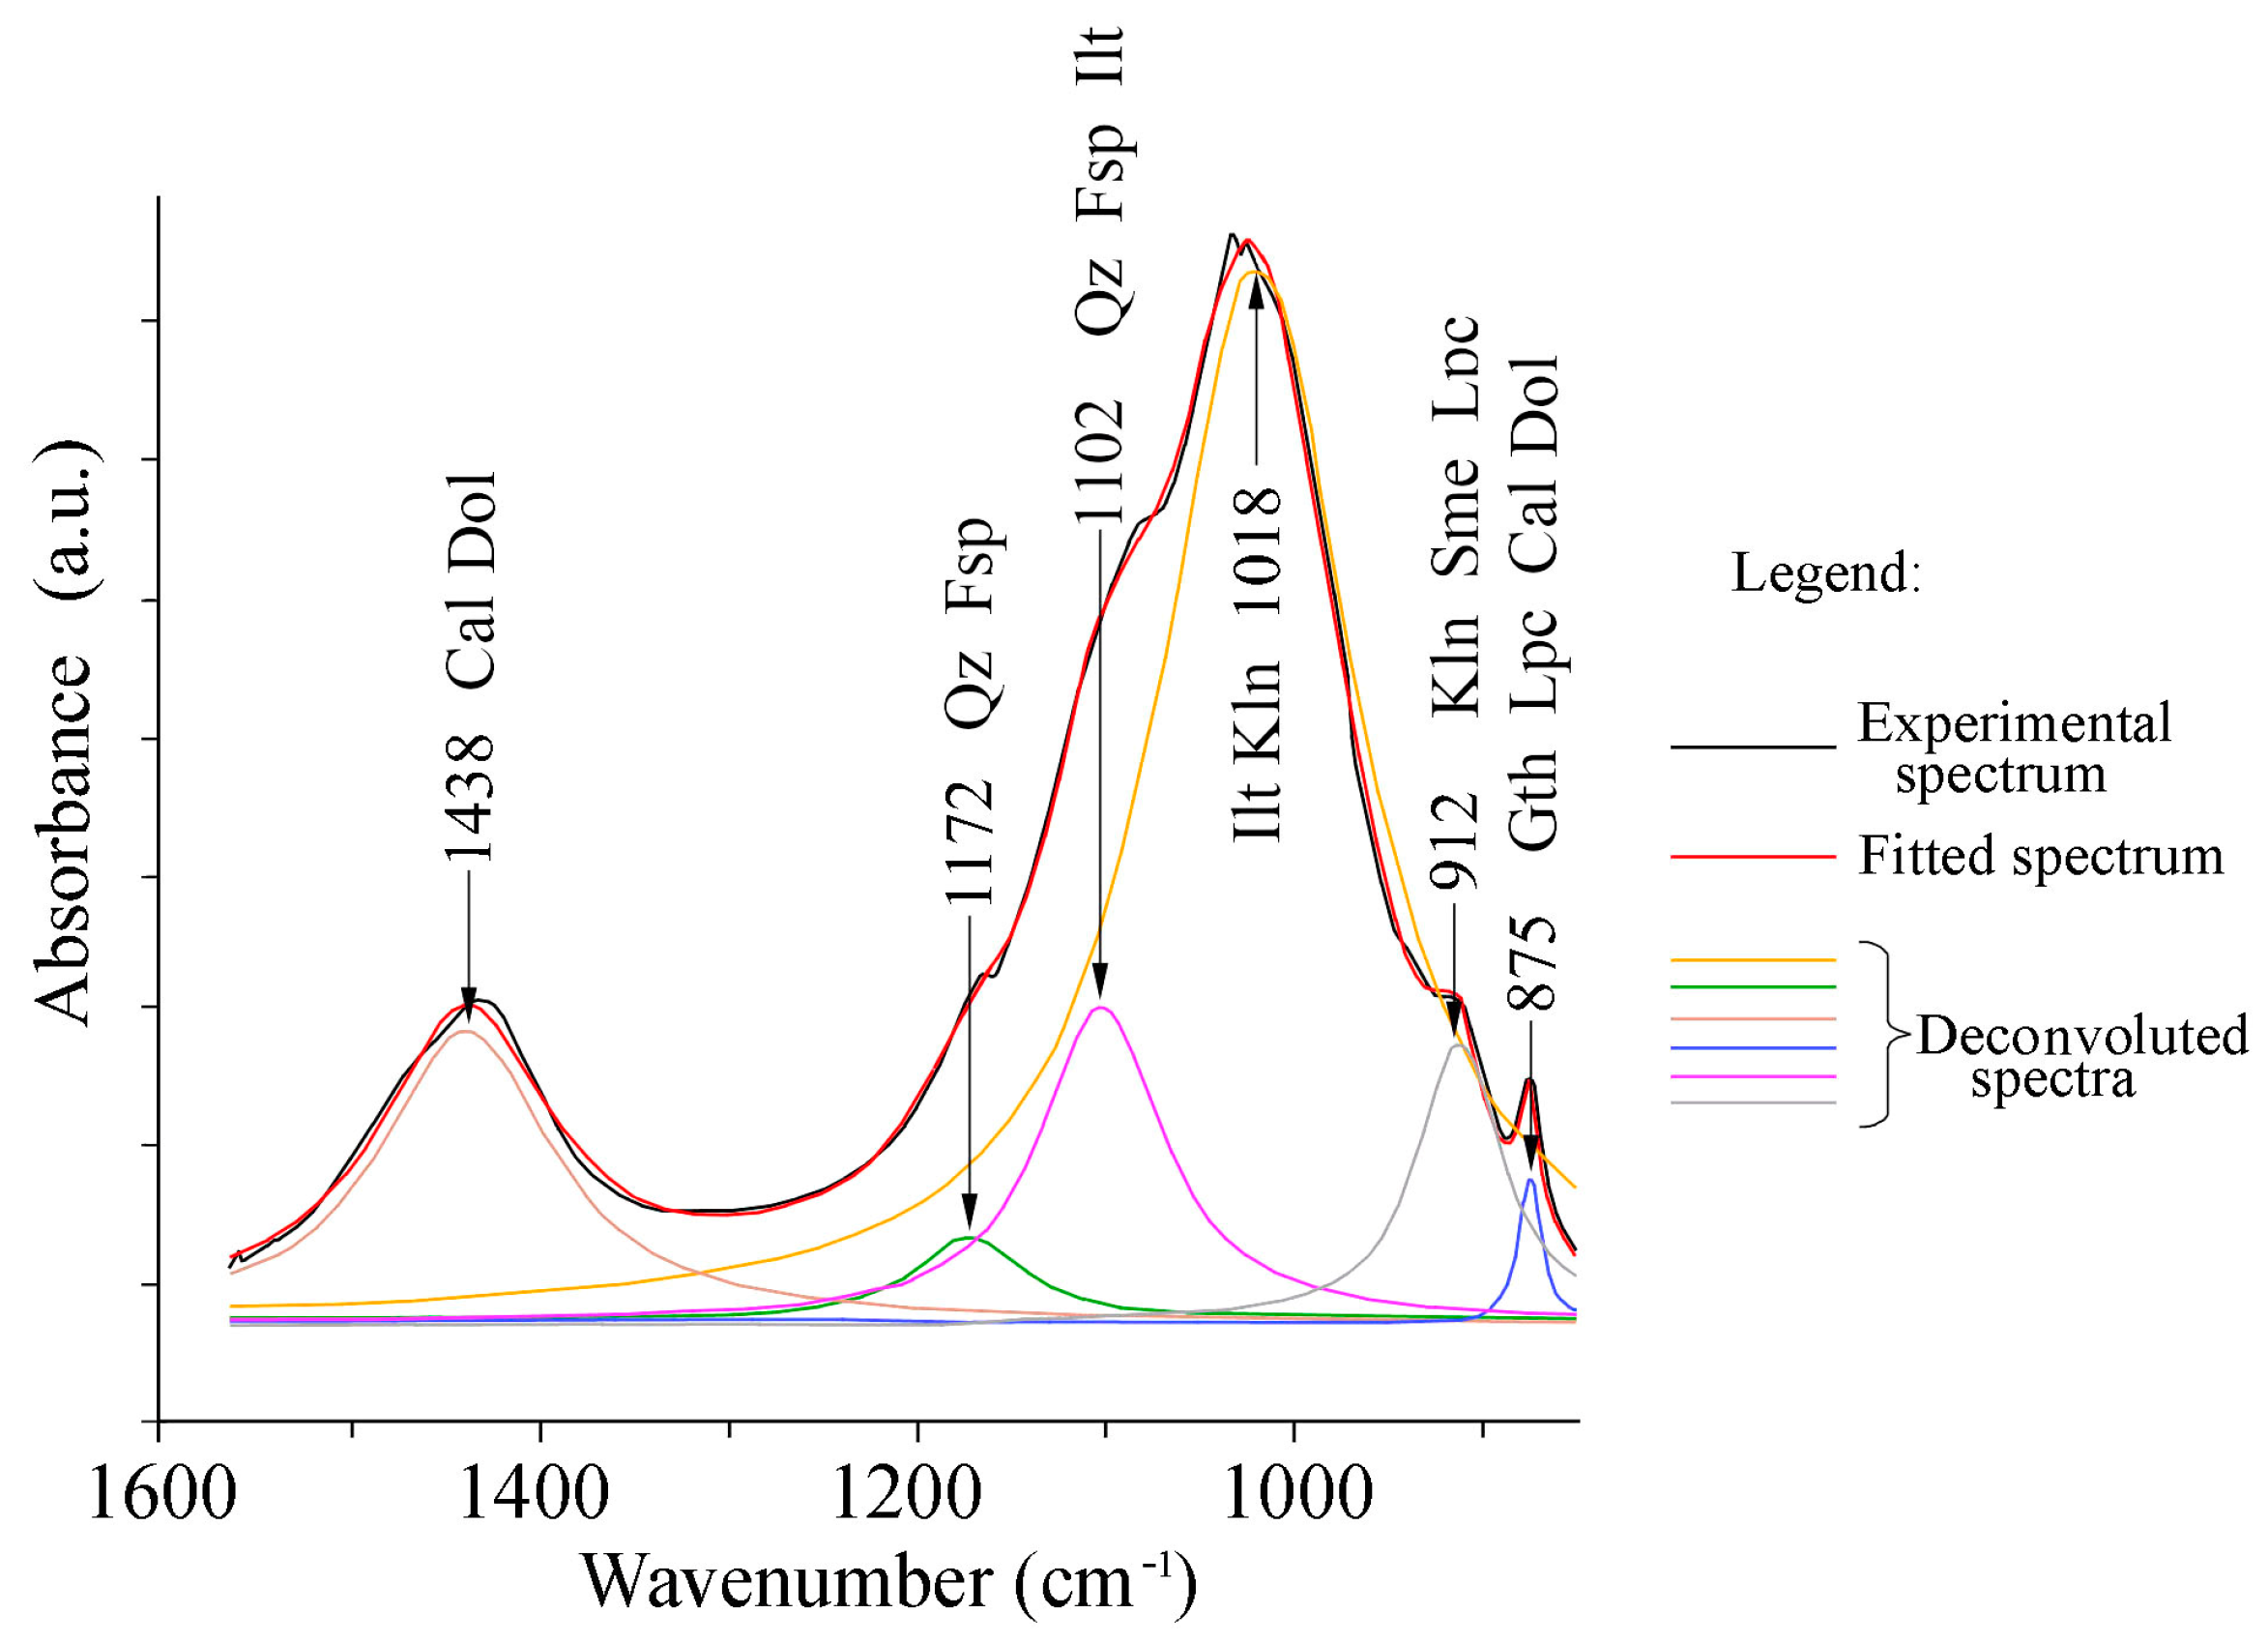
3.1.3. FTIR Spectroscopy

The FTIR absorption bands shown in Figure 2a,b originate from Si–O, Si–O–Si, Si–O–Al, Si–OH, Al–OH, and C–O vibrations [37,38,39,40,41,42,45,46,47,48,49,50,51] from various mineral phases (Table S1). Roughly, the signals can be grouped in four domains of frequency: (i) from 3700 to 3400 cm−1, (ii) from 1200 to 875 cm−1, (iii) from 800 to 625 cm−1, and (iv) from 550 to 425 cm−1.
The main mineral phases are the same as those found by OM and XRD, i.e., quartz, feldspar, and carbonate, besides illite-muscovite. The FTIR allowed illite and kaolinite, but not muscovite and chlorite, to be identified.
The deconvolution of the most intense and sharp signal centred at 1030 cm−1 is due to Si-O-Al stretching vibrations and reveals the main contribution of illite, quartz, feldsparp and less kaolinite to the composition of the raw clay (Figure 3). The characteristic doublet at 798–779 cm−1, as well as the signals at 524 cm−1 and 471 cm−1, are assigned to the Si-O stretching bands of quartz [27,52]. The vibrations of other minerals are recorded at 1102 cm−1, 524 cm−1 and 471 cm−1 (feldspar [53]); and at 1438 cm−1 and 875 cm−1 (carbonate [25,54]). The iron compounds are goethite and lepidocrocite, with vibrations at 912 cm−1 and 875 cm−1 [55]. The presence of kaolinite is shown also by signals at ~3697 and 3625 cm−1 [56]. The OH stretching bands are weak, except that at 3625 cm−1, which might include also signals produced by absorbed water.

3.2. Heated Clay

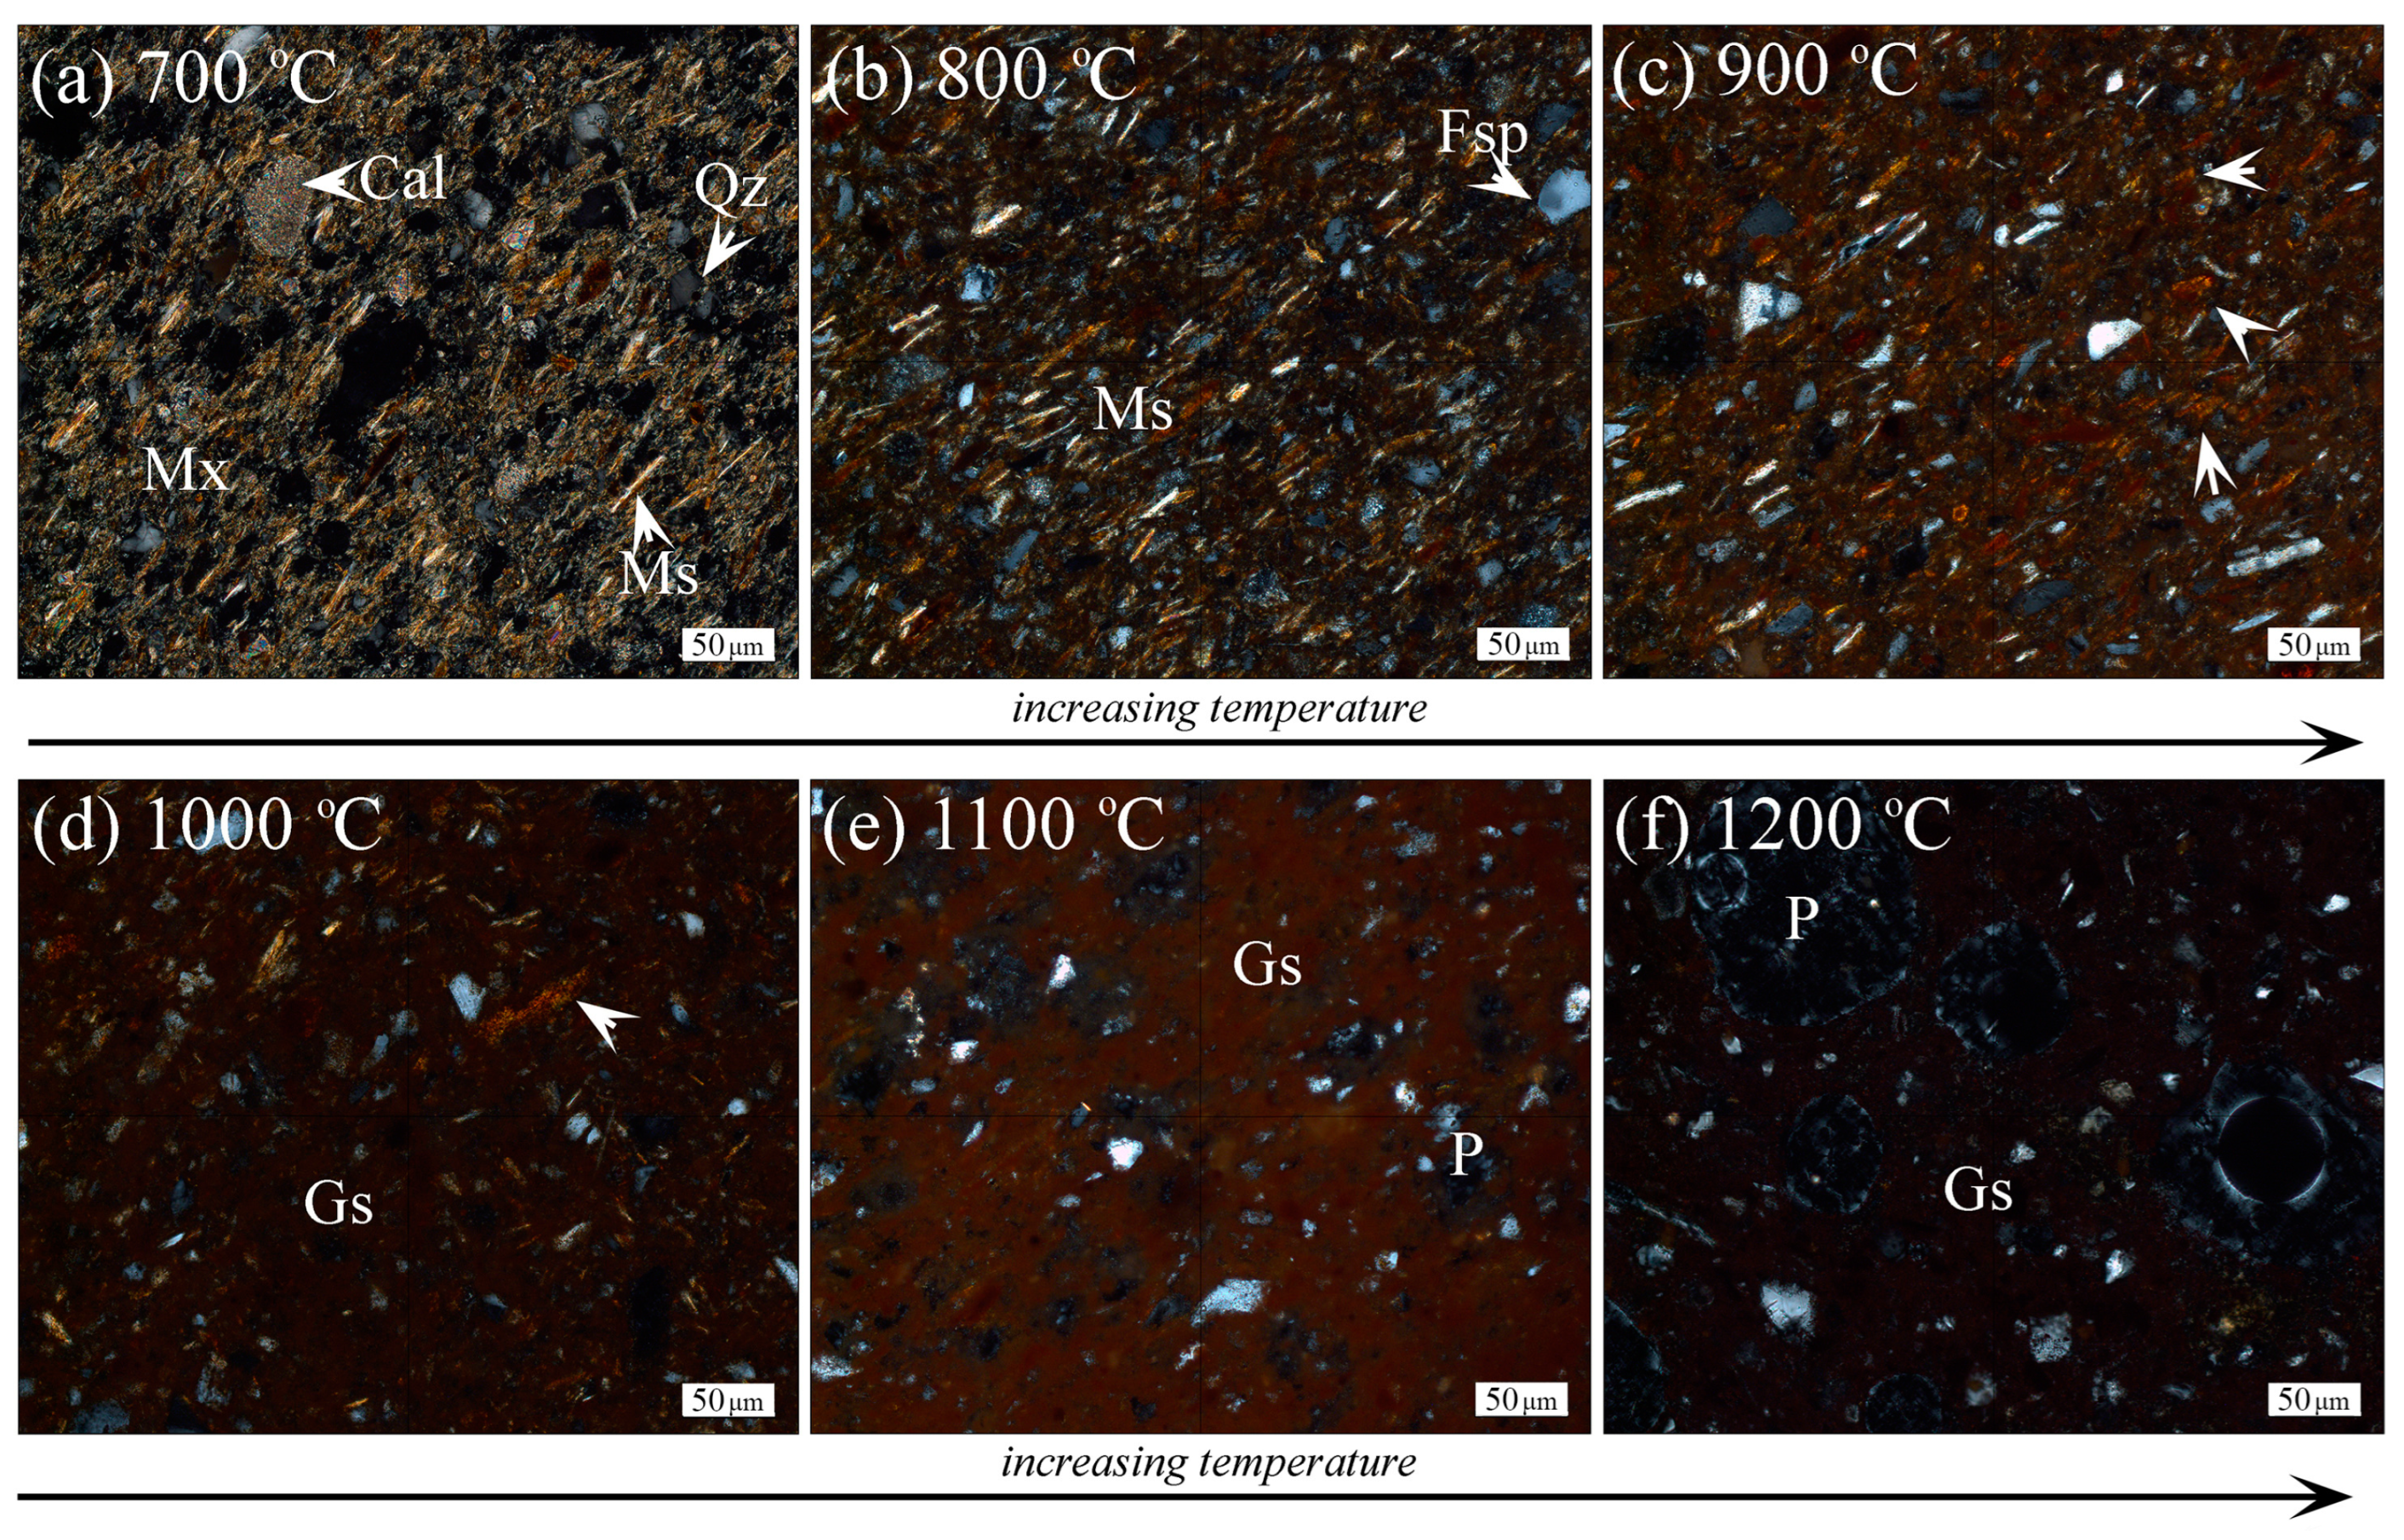
3.2.1. Optical Microscopy

For the microscopic description of the heated clay (i.e., ceramics), we follow here [16,57,58], who defined ‘matrix’ as those parts of the ceramic body containing only particles smaller than ~15–20 μm. The ‘clasts’ or ‘macroclasts’ are non-plastic components larger than 15–20 μm. The matrix consists of clay minerals, muscovite, chlorite, and some biotite, as well as ‘micro-clasts’ i.e., tiny grains of quartz, feldsparp, carbonate, and Fe compounds. The polarized light microphotos (Figure 4a–f) display a gradual change of the both the matrix and clasts, with increasing temperature.
At 700 °C, the matrix is still microcrystalline and consequently highly birefringent (Figure 4a). Quartz, illite, muscovite, feldsparp, chlorite, biotite, and carbonates are not yet essentially affected by heating. Very thin, isotropic rims formed at the contact between phyllosilicates reflect a ‘low degree’ of sintering [59,60].
At 800 °C, the matrix consists of a mix of birefringent and low birefringent areas (Figure 4b). The latter mark the beginning of the collapse of illite and muscovite structure. Quartz, feldspar, illite, muscovite, rare chlorite, and biotite, as well as fine grains of carbonate are still easily distinguishable. Grains of plagioclase (feldsparp) are overgrown by newly-formed K-feldspar (feldsparh), a process characteristic for heating at temperatures over 800–850 °C [61,62]. The overall colour of the ceramic body is reddish, most likely due to a finely-distributed iron-rich phase.
At 900 °C, the isotropic areas are prevalent due to advanced collapse of the crystalline structure of most of the phyllosilicates and beginning of extended vitrification. Still, quartz, feldsparp, and Fe-rich pellets, as well as scarce mica (muscovite and biotite), are present. A notable change is marked by the occurrence of bright orange small clusters with high relief and polycrystalline microstructure (Figure 4c), which can be related to newly formed phases such as gehlenite and pyroxene, coloured by Fe trapped in their structure [63].
Heated up to 1000 °C, the ceramic body shows a predominantly isotropic matrix (Figure 4d). Small grains of quartz and feldspar (most-likely primary and probably also newly-formed) are identifiable. The patchy appearance of some of the feldspar is due to their forming during heating [62]. “Ghost relics” of micas, showing only a slight contour, are characteristic.
At 1100 °C (Figure 4e), the matrix has a reddish colour, an overall vitreous appearance, and is optically completely isotropic. Dark brown spots replace the former Fe-pellets. The brownish-orange patches with diffuse rims observed in the glassy matrix are most likely relics of firing minerals such as gehlenite and clinopyroxene, coloured by Fe [63]. Quartz is relatively frequent. Feldsparp grains show melting at the rims, whereas feldsparh has a patchy appearance. The grains showing low refractive index and very low birefringence are probably α-cristobalite, a high temperature silica polymorph. The pores are irregular, larger, and more frequent than in ceramic material obtained at lower temperatures. The increased porosity is due to a gaseous phase released upon decomposition processes.
The vitreous material formed at 1200 °C (Figure 4f) is completely isotropic and contains isolated and very small fragments of quartz and feldspar (probably both primary and newly-formed). The pores are large and numerous.

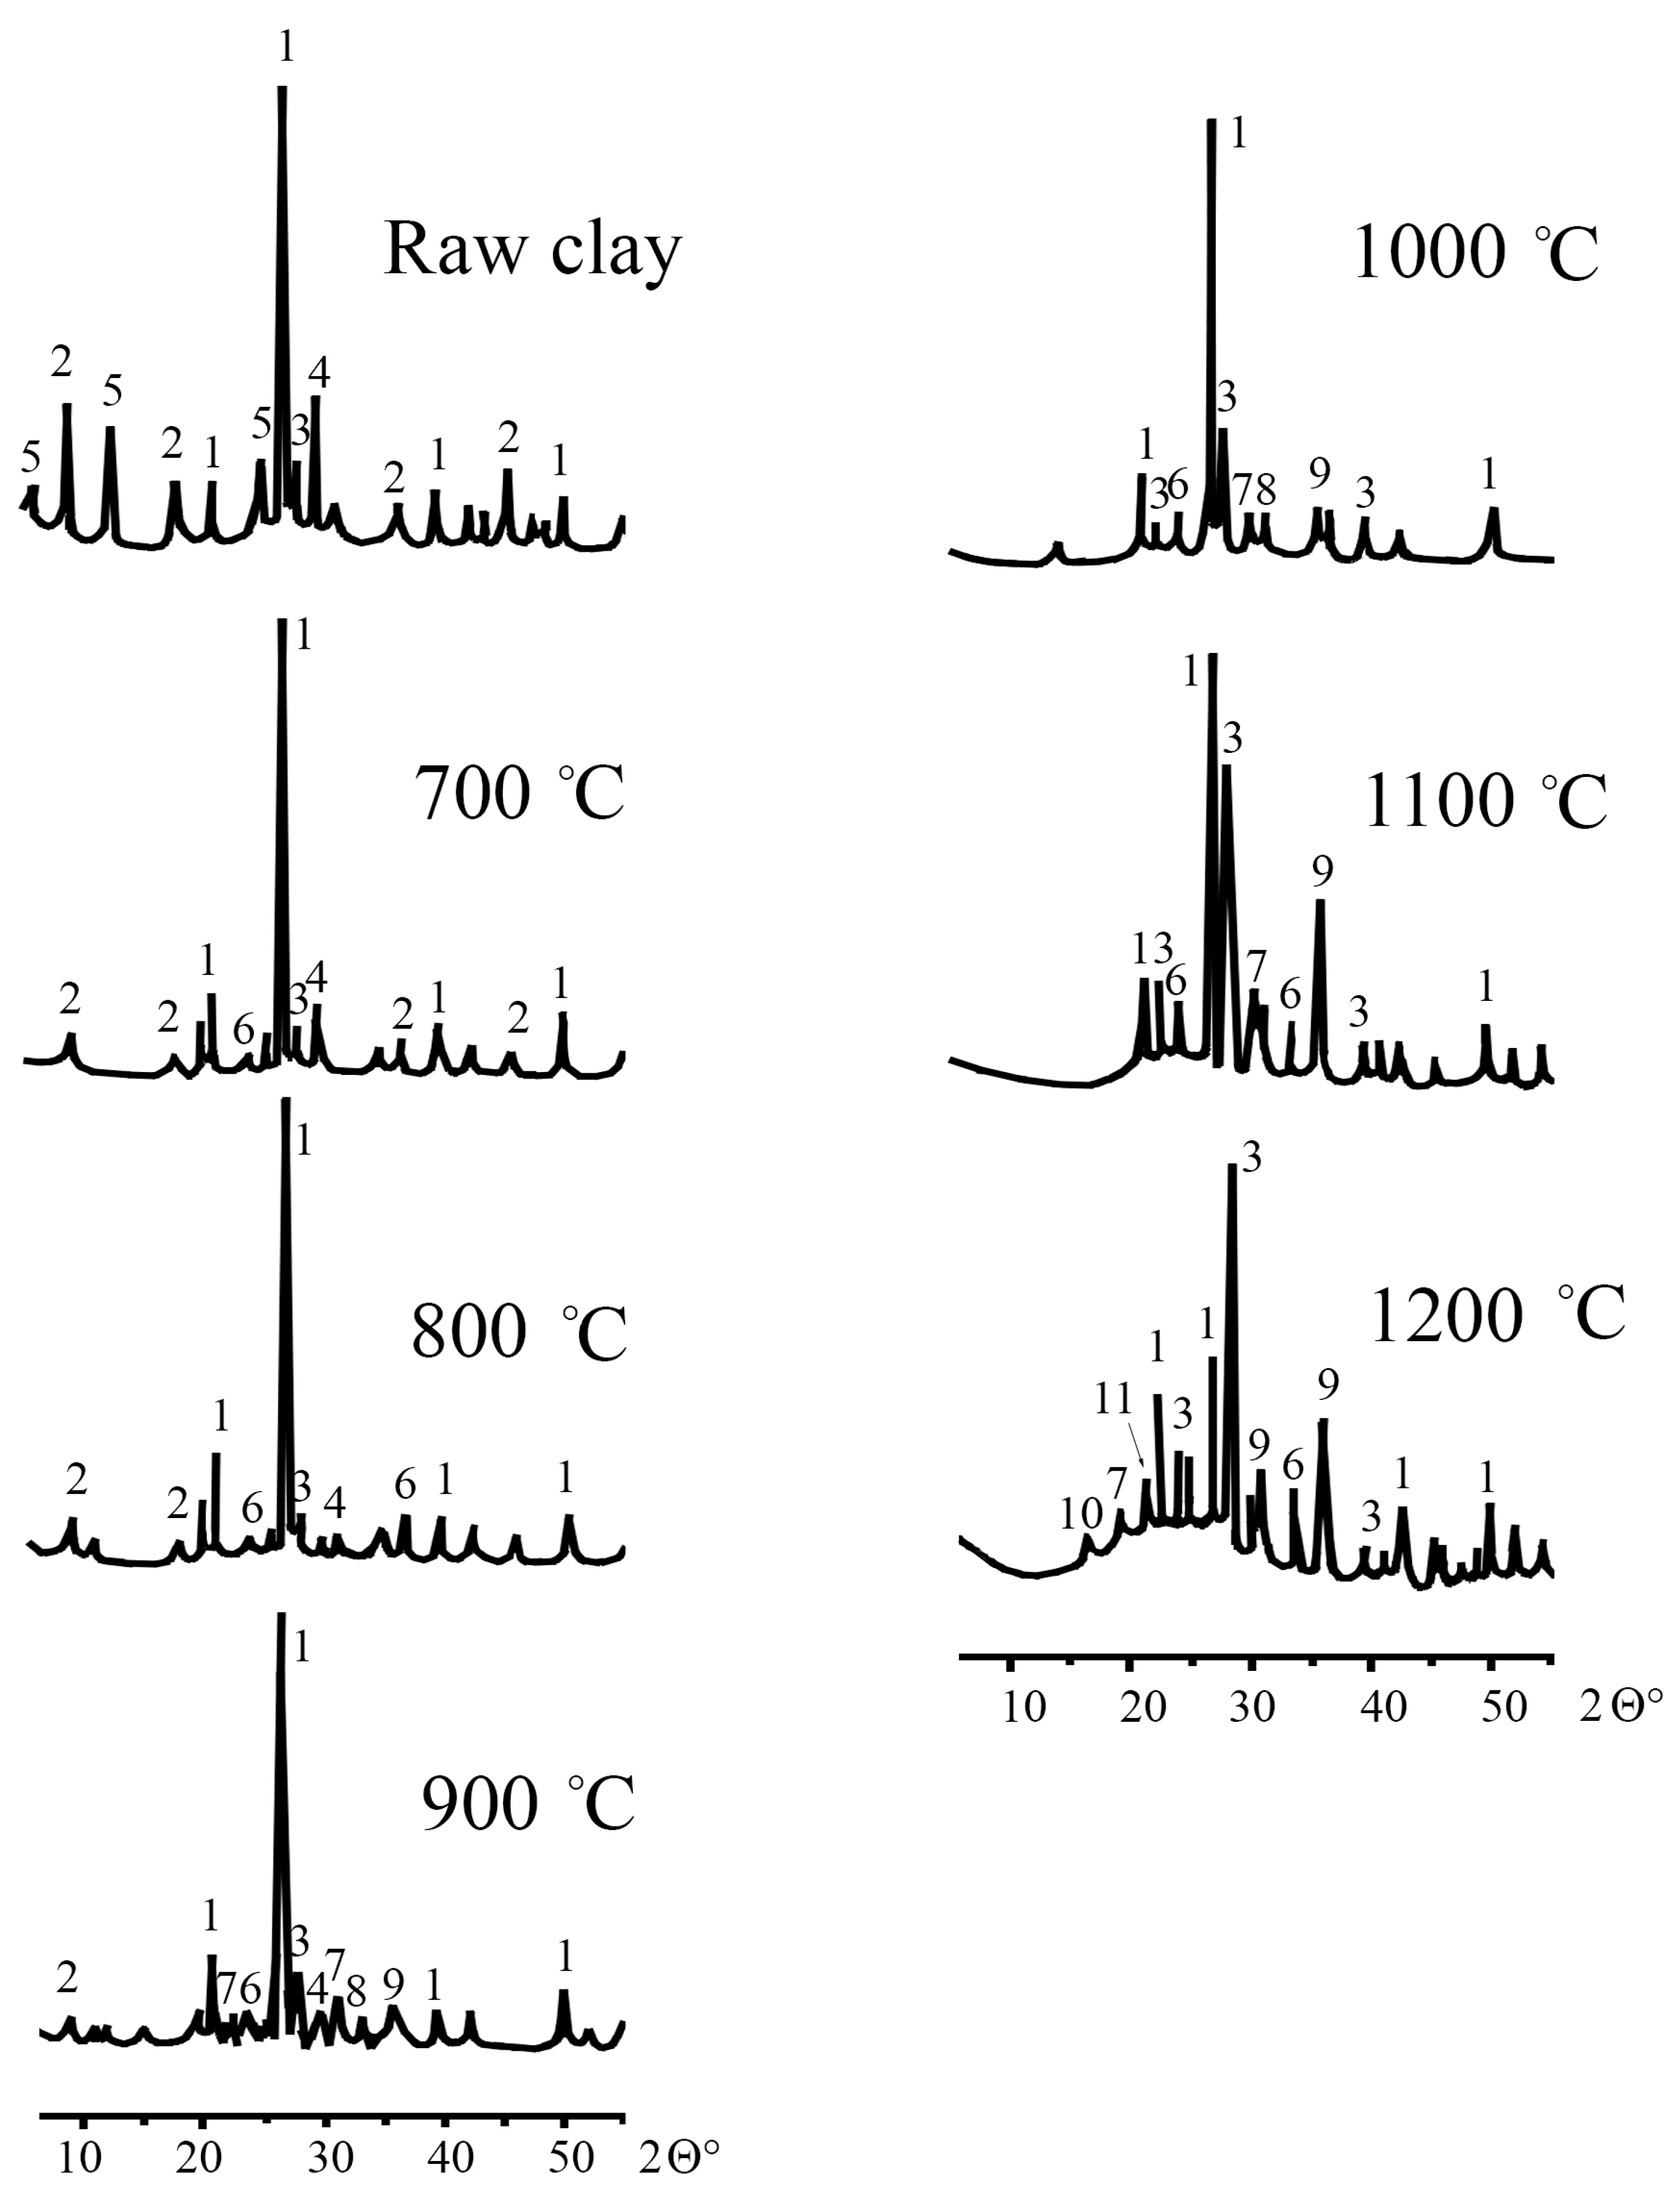
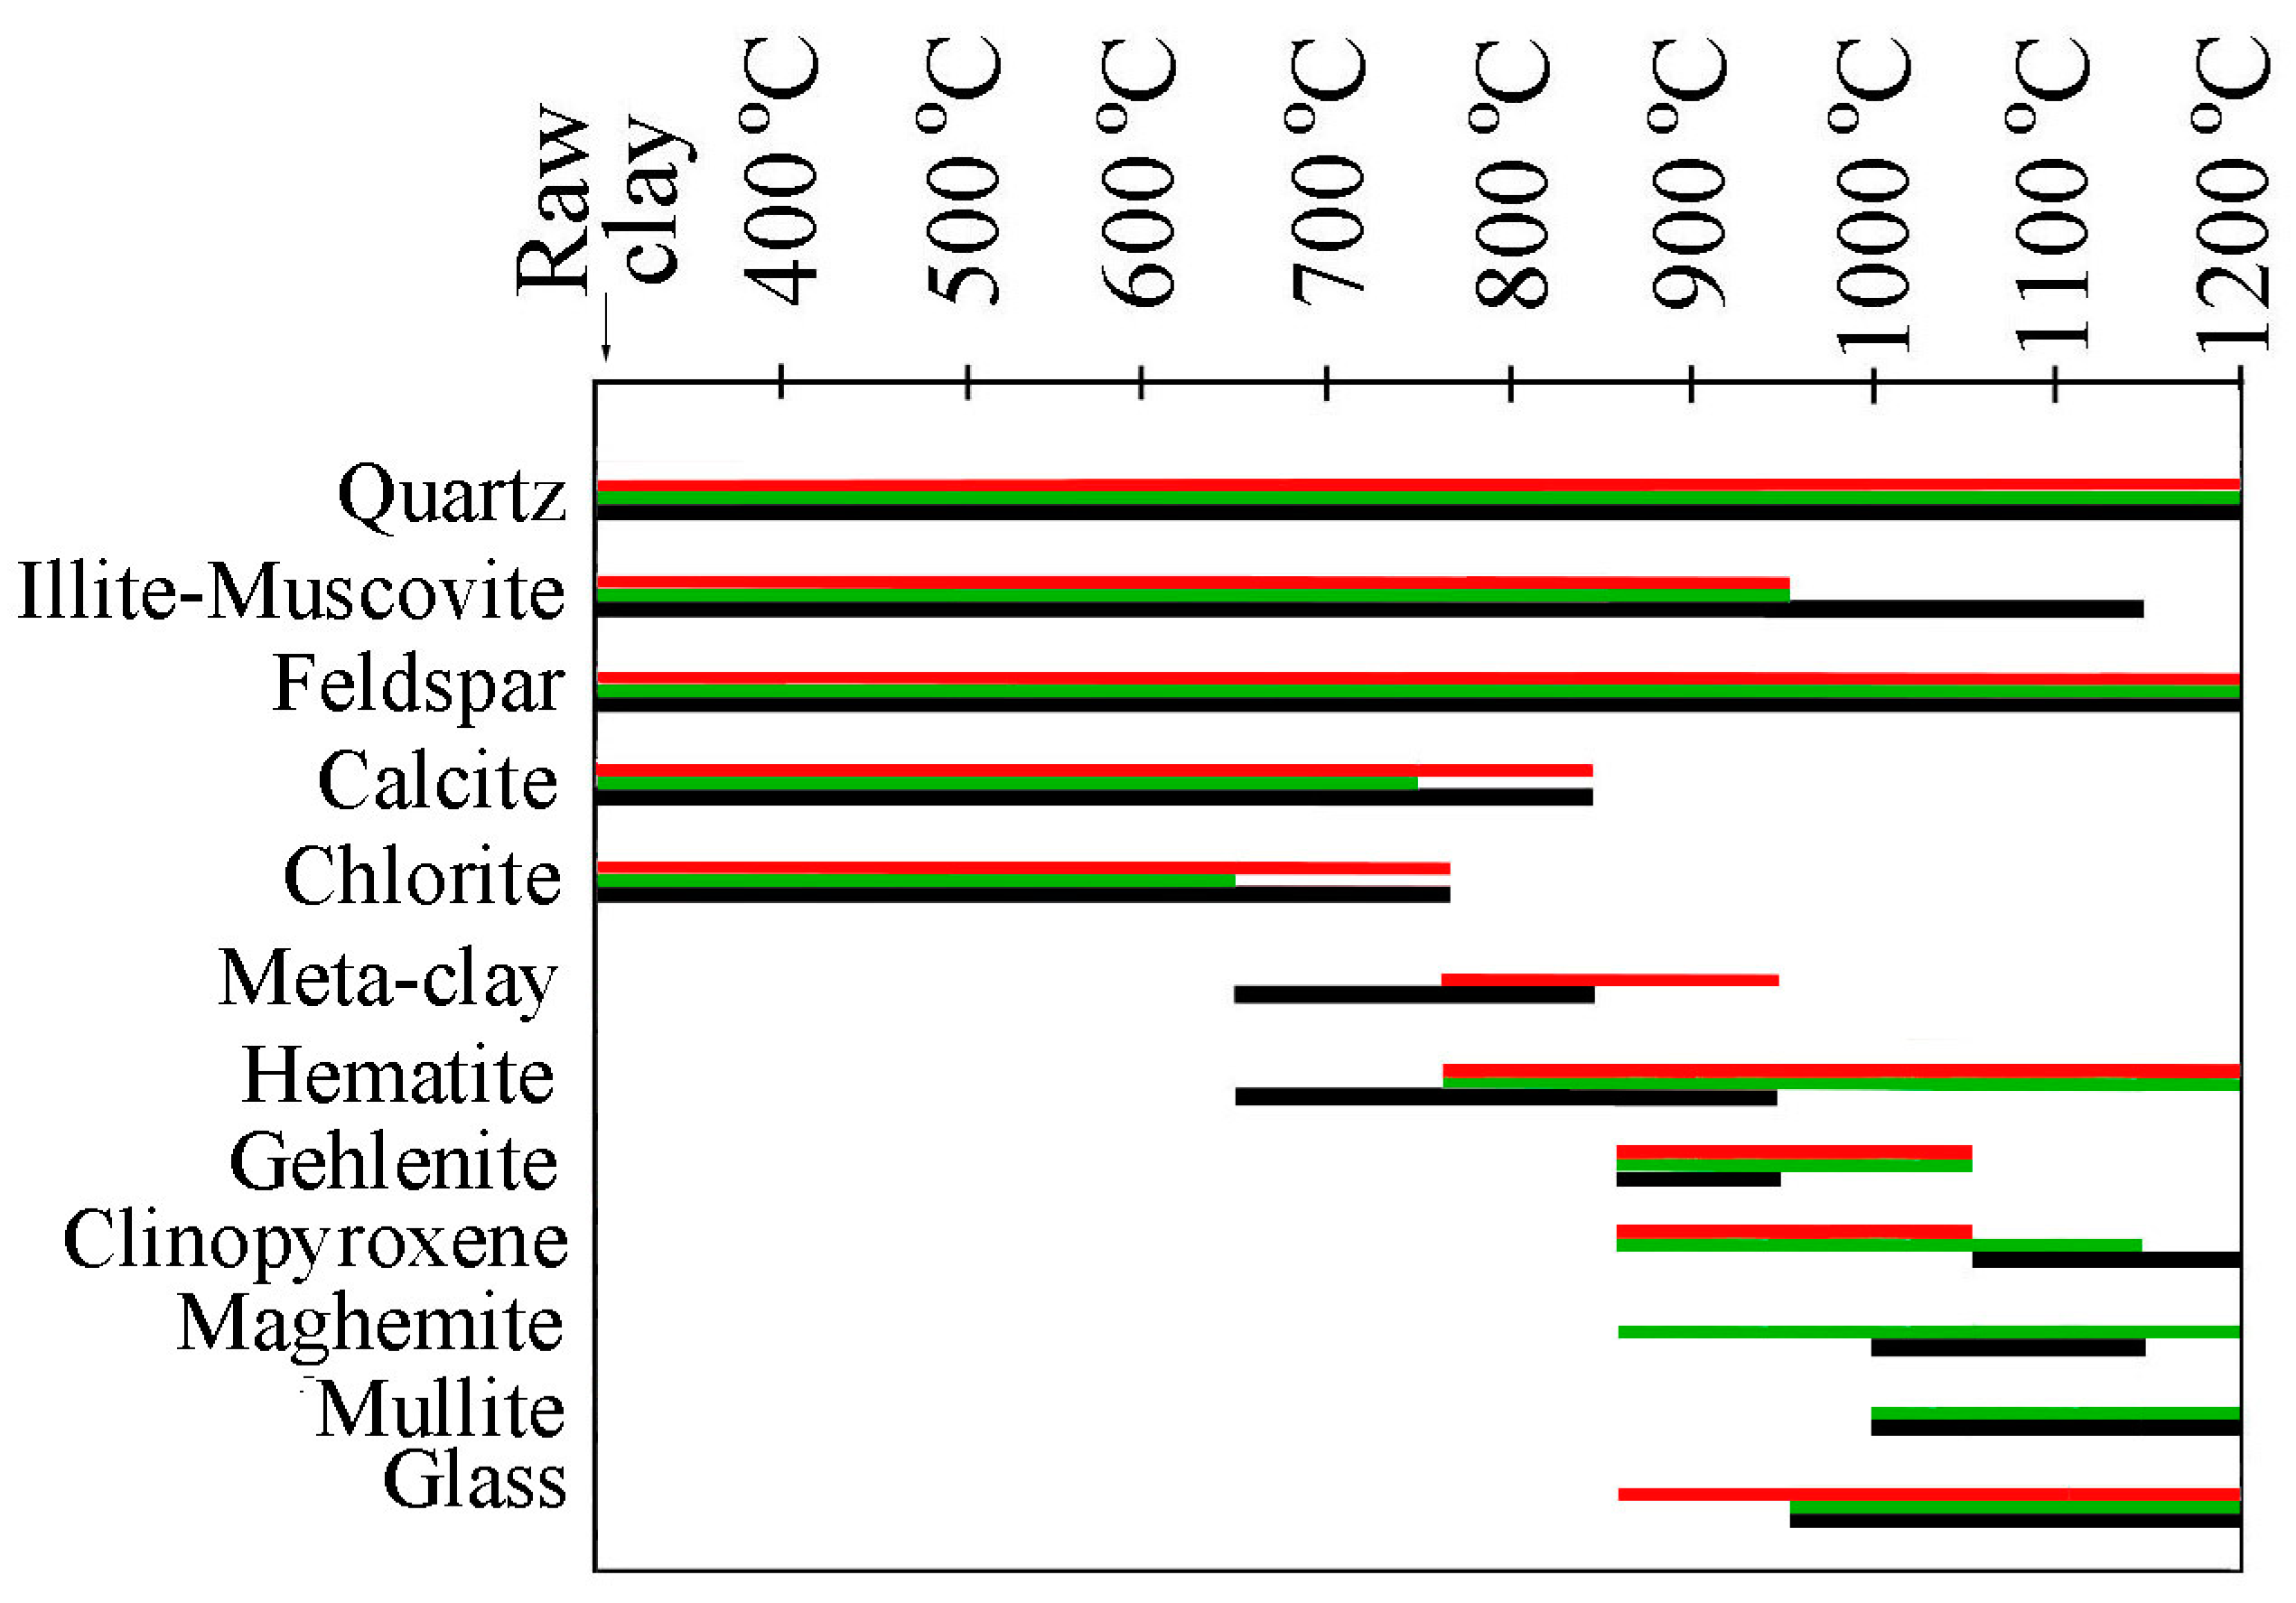
3.2.2. X-Ray Powder Diffraction
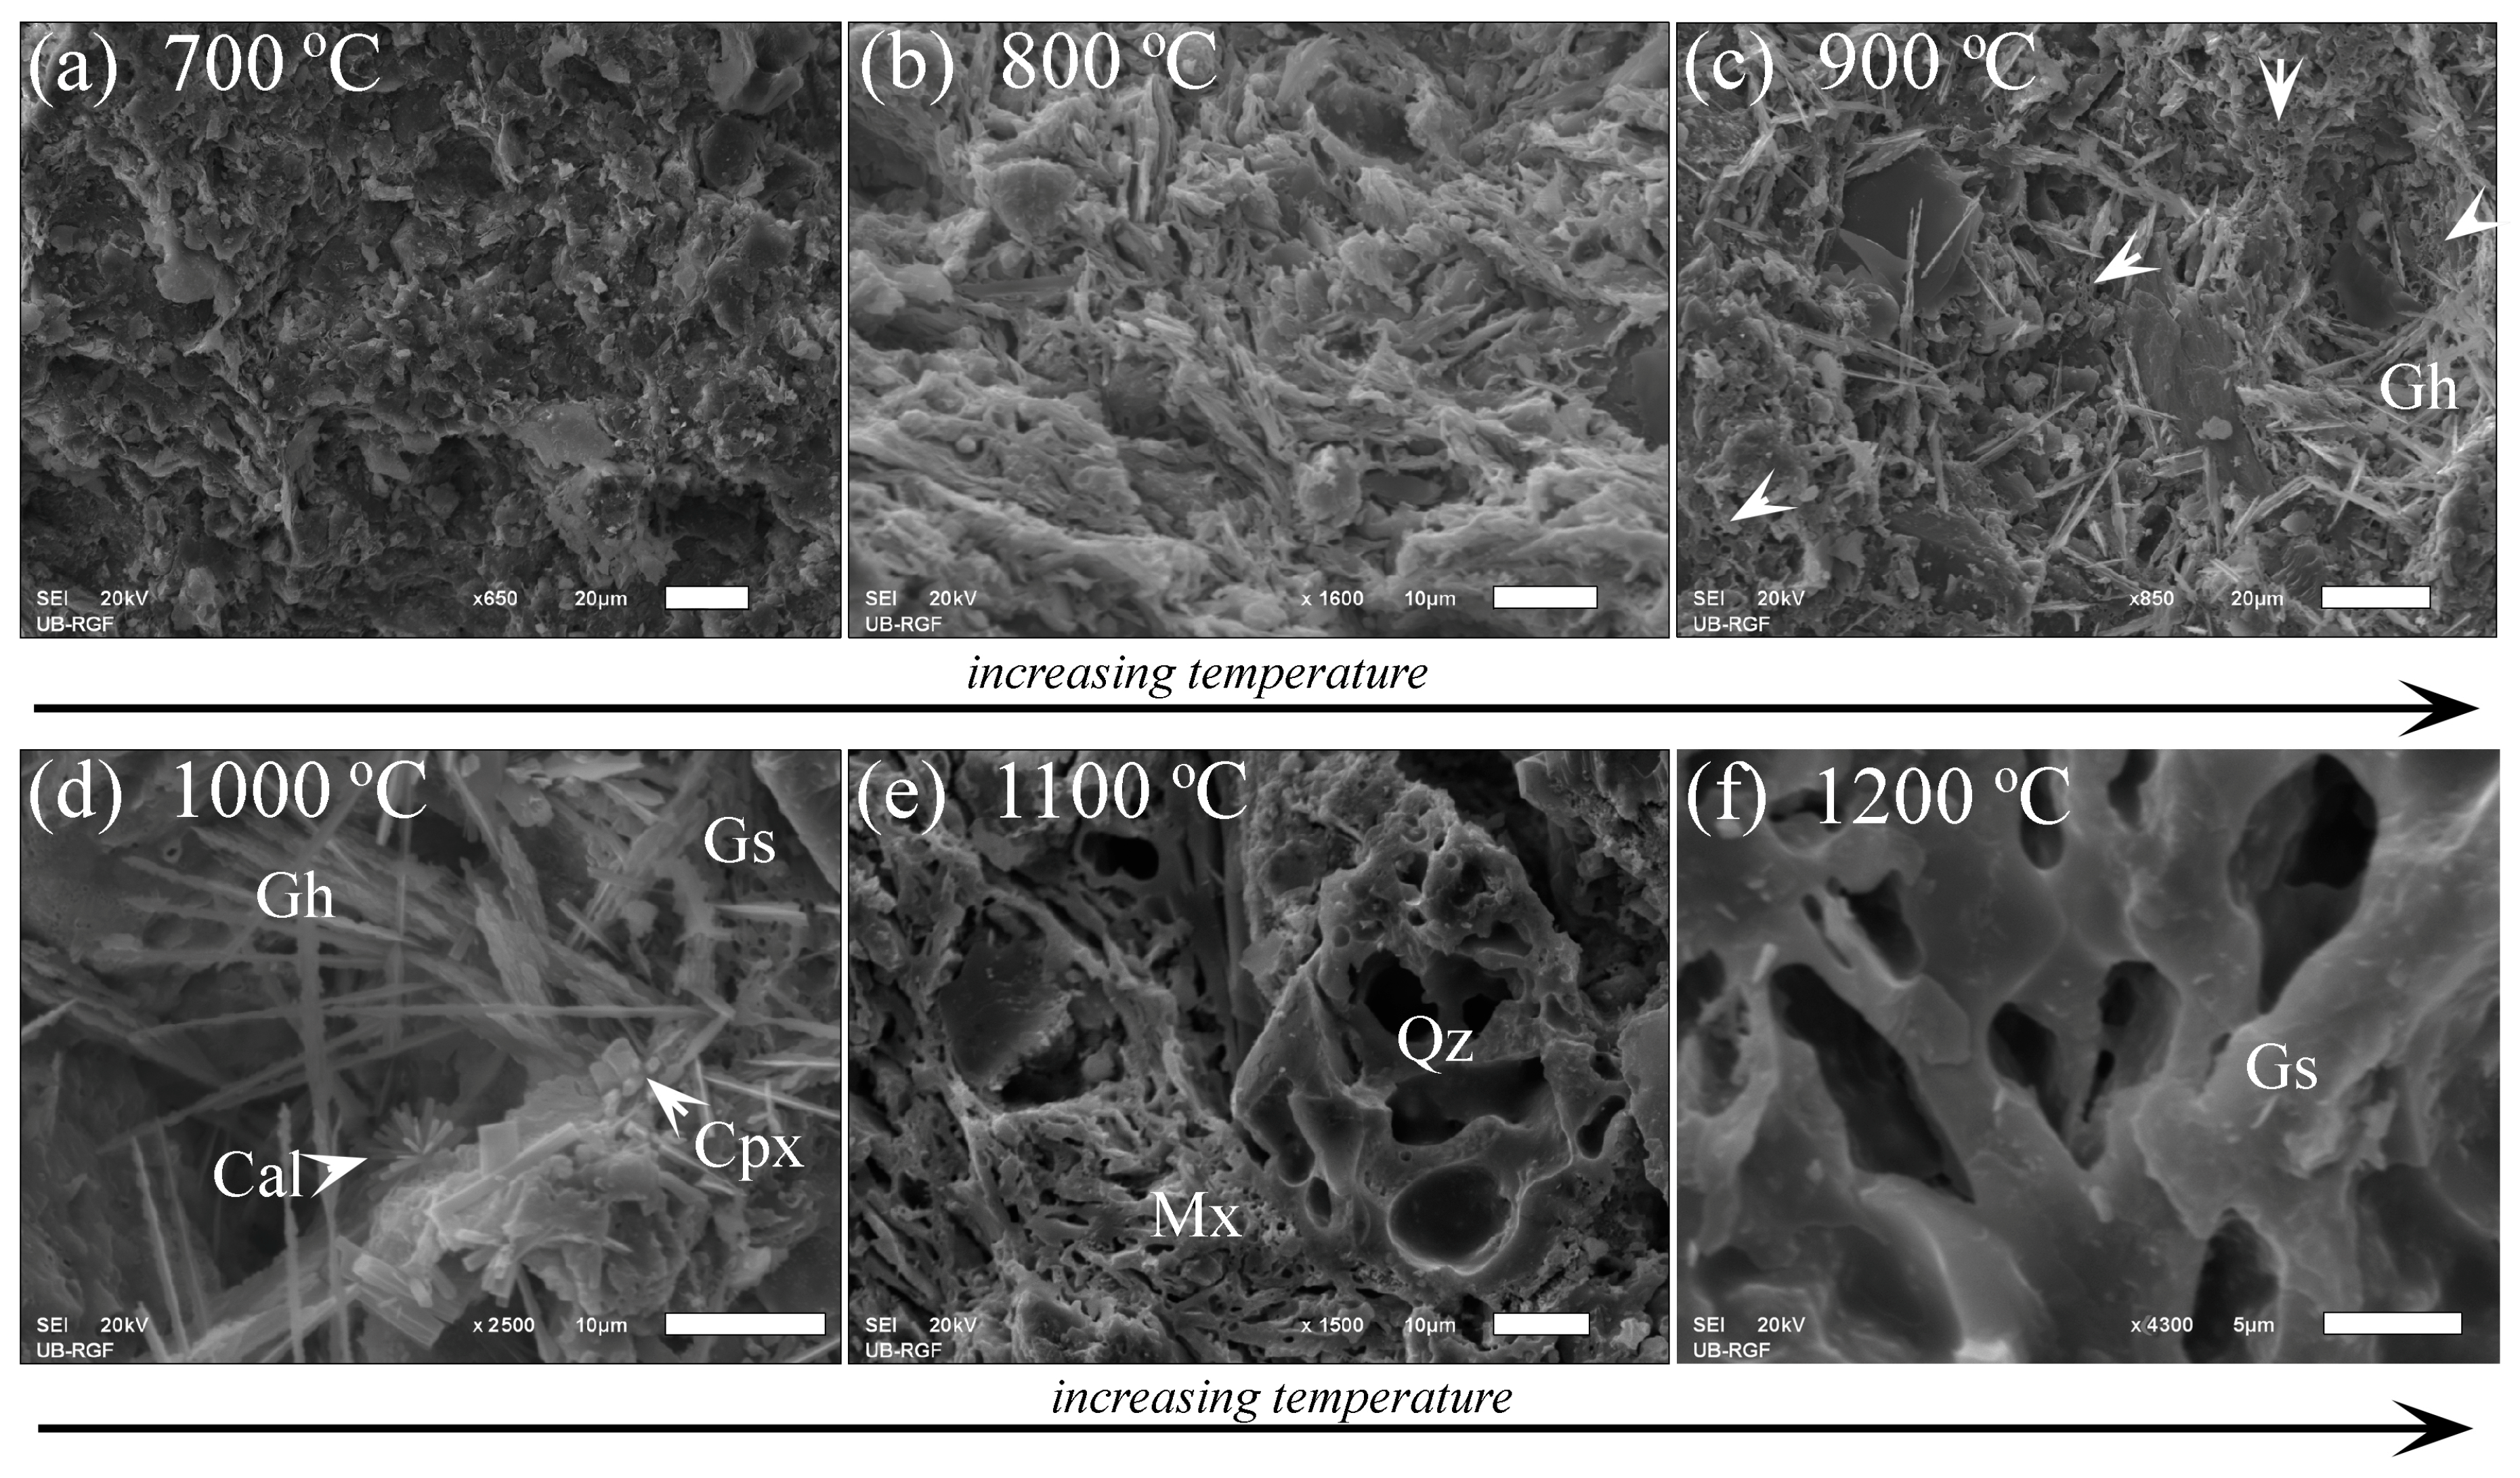
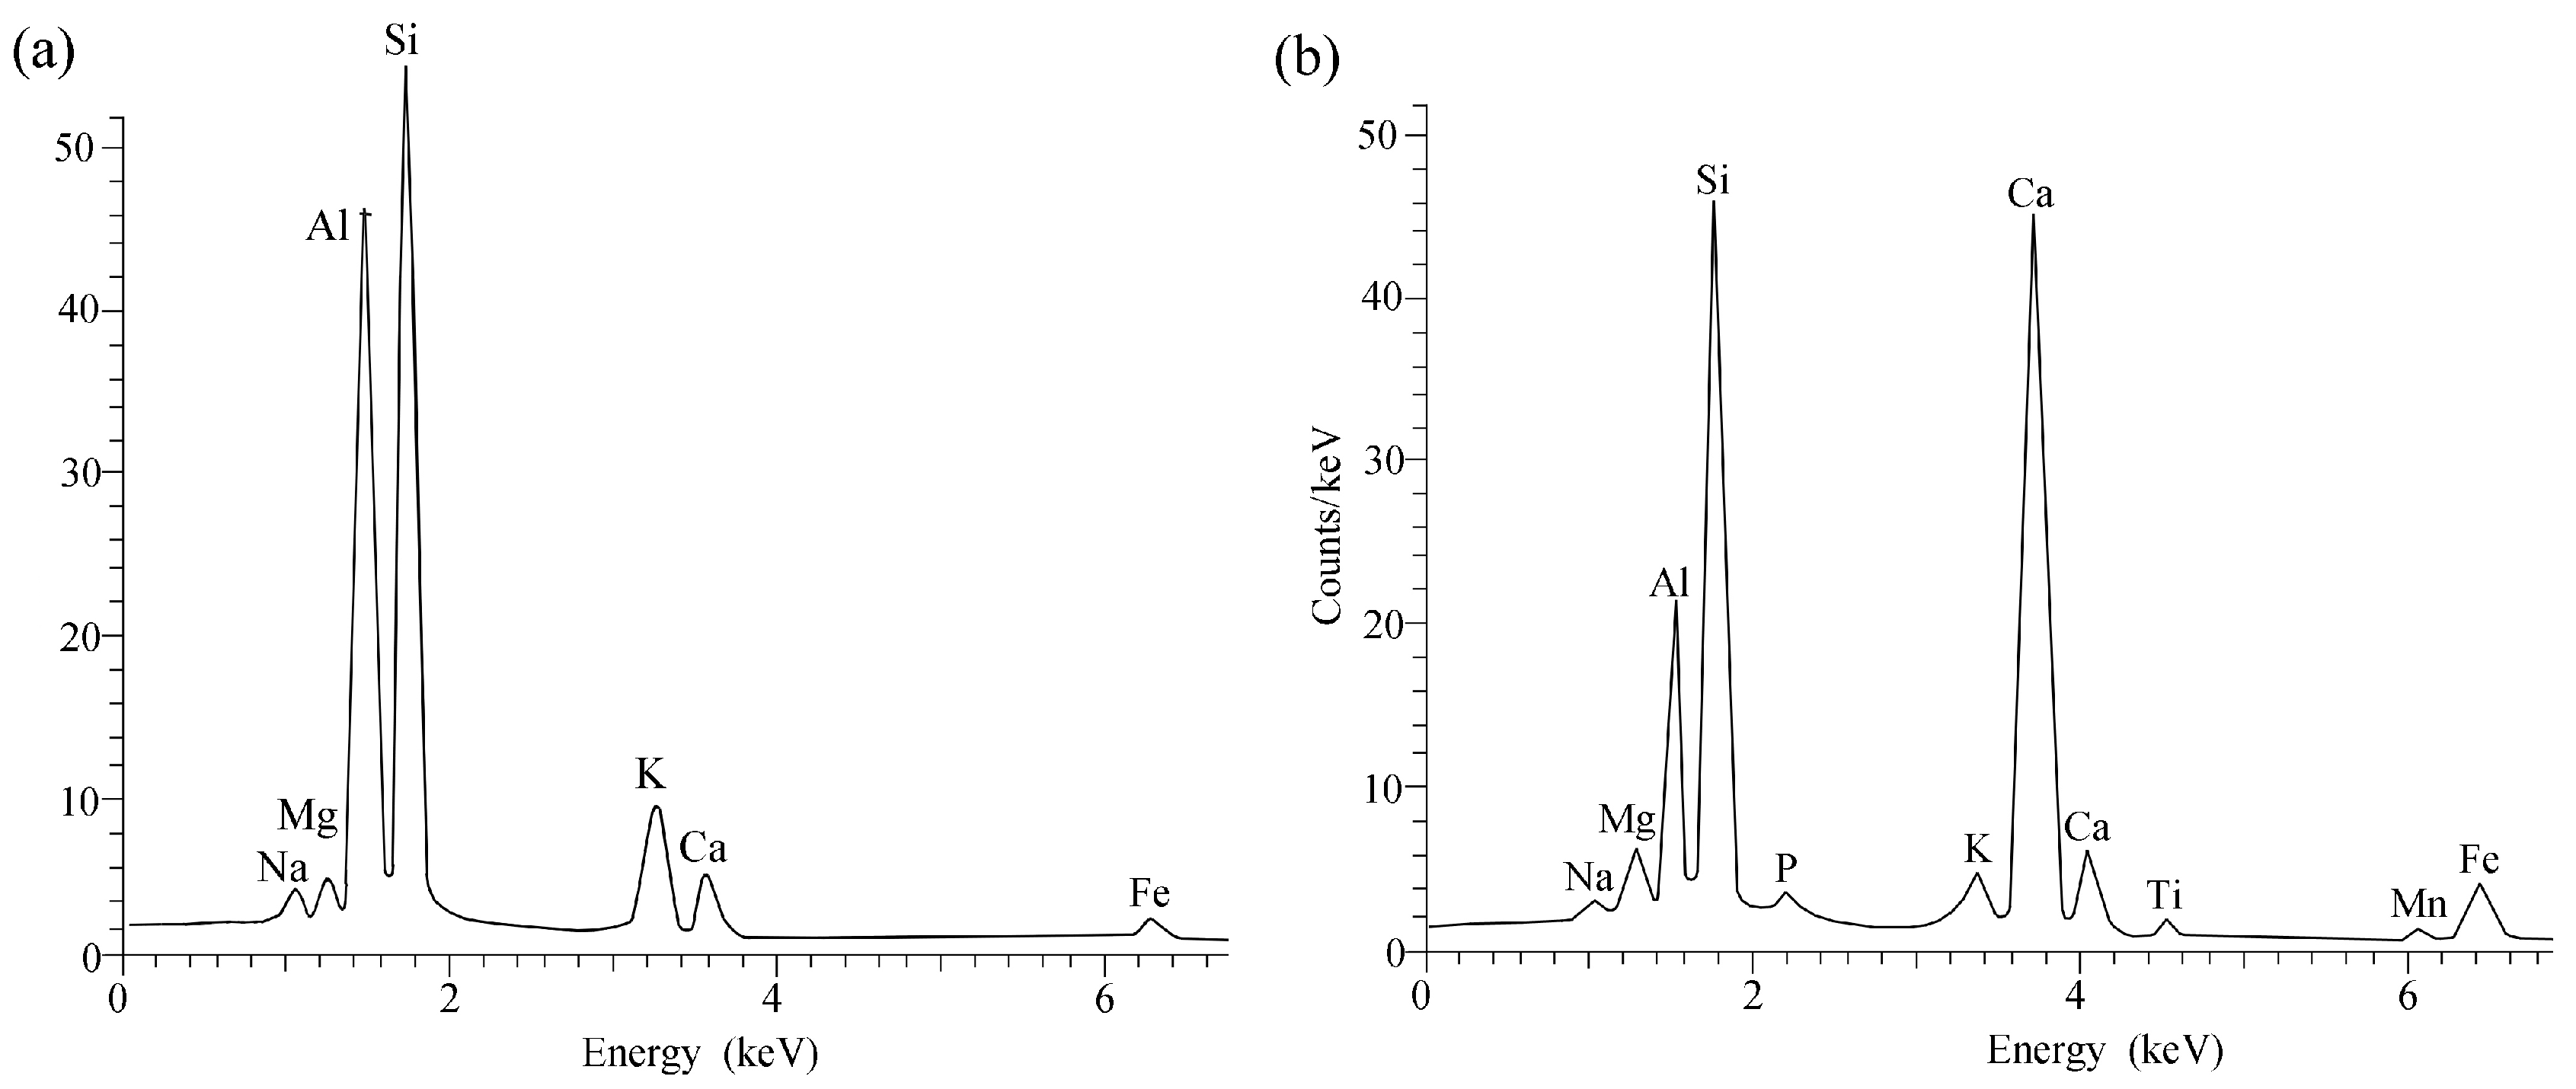
The XRPD patterns of the heated clay (Figure 5) show both primary minerals (quartz, illite-muscovite, feldsparp, calcite, chlorite, dolomite, and biotite), and numerous firing minerals (gehlenite, clinopyroxene, feldsparh, hematite, maghemite, mullite, and α-cristobalite), as well as glass. The most important peaks belong to quartz, followed by illite-muscovite, feldspar, and calcite.
The 3.4, 4.3, 2.5, and 2.2 Å peaks of quartz dominate the diffractograms and remain almost unchanged up to 1000 °C, when they start to decrease in intensity, due to melting, chemical reactions as well as transformation into α-cristobalite (4.1 Å).
The 10, 5, 4.5, 2.5, 2.1, and 1.9 Å peaks which may be assigned to ‘illite-muscovite’ (Figure 1b) gradually decrease in intensity, up to complete disappearance between 900 and 1000 °C, when it records irreversible structural changes [64] and breaks down into alumina-rich and silica-rich domains [65]. Chlorite was not identified anymore in the briquette fired at 800 °C. The 3.4 Å peak of primary feldspar remains unchanged up to 900 °C. Starting with 1000 °C, this peak spectacularly increases, most likely due to the newly-formed feldspar.
Calcite (3.0 Å, 2.1 Å, and 1.9 Å) and dolomite (2.9 Å and 2.2 Å) X-ray patterns show obvious alteration upon heating. At 800 °C, the calcite peak is low in intensity, whereas the dolomite peak does not appear anymore. At 900 °C, the carbonates are replaced by newly formed phases, such as gehlenite (1.9 Å) and clinopyroxene (2,9 and 3.0 Å). After 1000 °C the reaction between gehlenite and quartz led to the formation of feldspar [66]. The hematite (2.7 Å) and maghemite (2.5 Å) peaks were identified in the clay heated at 800 °C and 900 °C, respectively, and their intensity slowly increases with temperature. At 1100 °C, α-cristobalite peaks (4.1 Å) occur as well. Small amounts of mullite (3.4 Å–3.5 Å) were detected at 1100 °C and 1200 °C. The diffractograms of the material heated over 900 °C show a lump between 20 and 35 °2θ, due to amorphous material and glass.

3.2.3. SEM-EDX

The secondary electron images (Figure 6a–f) and energy dispersive spectra (Figure 7a,b) offer detailed information on the microstructure and mineralogy of the heated clay. The gradual thermal changes affecting the matrix range from: (i) ‘low sintering’—when phyllosilicate and aplastic particles are glued together at intergranular boundary [67]—and (ii) ‘incipient vitrification’—with thin filaments of glassy material occurring in isolated places—to (iii) ‘partial vitrification’—when there are frequent and areas with a glassy material—and finally (iv) ‘advanced vitrification’—where large parts of the ceramic body are transformed into a porous, net-like, filamentous vitreous material, with a smooth surface. The clay heated at 1200 °C (Figure 6f) records a so-called ‘continuous vitrification’ [23].
The samples heated at 700 and 800 °C show a microcrystalline structure, with phyllosilicates sintered together by narrow areas of unstructured material (Figure 6a,b). Between 900 and 1100 °C, the increased amount of glass and formation of new minerals are main processes. Gehlenite and clinopyroxene occur in the voids left by carbonate decomposition or are randomly distributed in the ceramic mass. Gehlenite forms tabular to needle-like crystals with a skeletal appearance, whereas clinopyroxene occurs as isometric grains (Figure 6c,d). The gehlenite and clinopyroxene crystal morphologies are similar to those described by [68].
At 1000 °C (Figure 6d), the increased amount of gehlenite is accompanied, besides clinopyroxene, by small prismatic crystals of feldsparh and needle-like crystals with Al-Si composition, most likely mullite. In between these phases there are bouquets of calcite crystals, resulting from recarbonation during cooling [69]. At 1100 °C, only ‘ghosts’ of former quartz (partly melted), muscovite, and feldsparp are preserved (Figure 6e). At 1200 °C, the ceramic consists of a mass of glassy filaments (Figure 6f).
Various amounts of Ca, Mg, and Fe, as displayed by the ED spectrum in Figure 7a, were measured in the K-rich alumosilicate matrix, as well in the glass. Both the matrix and the glass may contain a small amount of P. The variable amount of each element in the ED spectra of the newly-formed phases indicates complex compositions, and possible solid solutions. For example, the distribution of elements in the needle-like and isometric crystals shown in Figure 6d is compatible with gehlenite (Figure 7b) and clinopyroxene, respectively. The intermediate composition of Ca-rich plagioclase with some K content (1000 °C) is in agreement with their formation by firing [62].

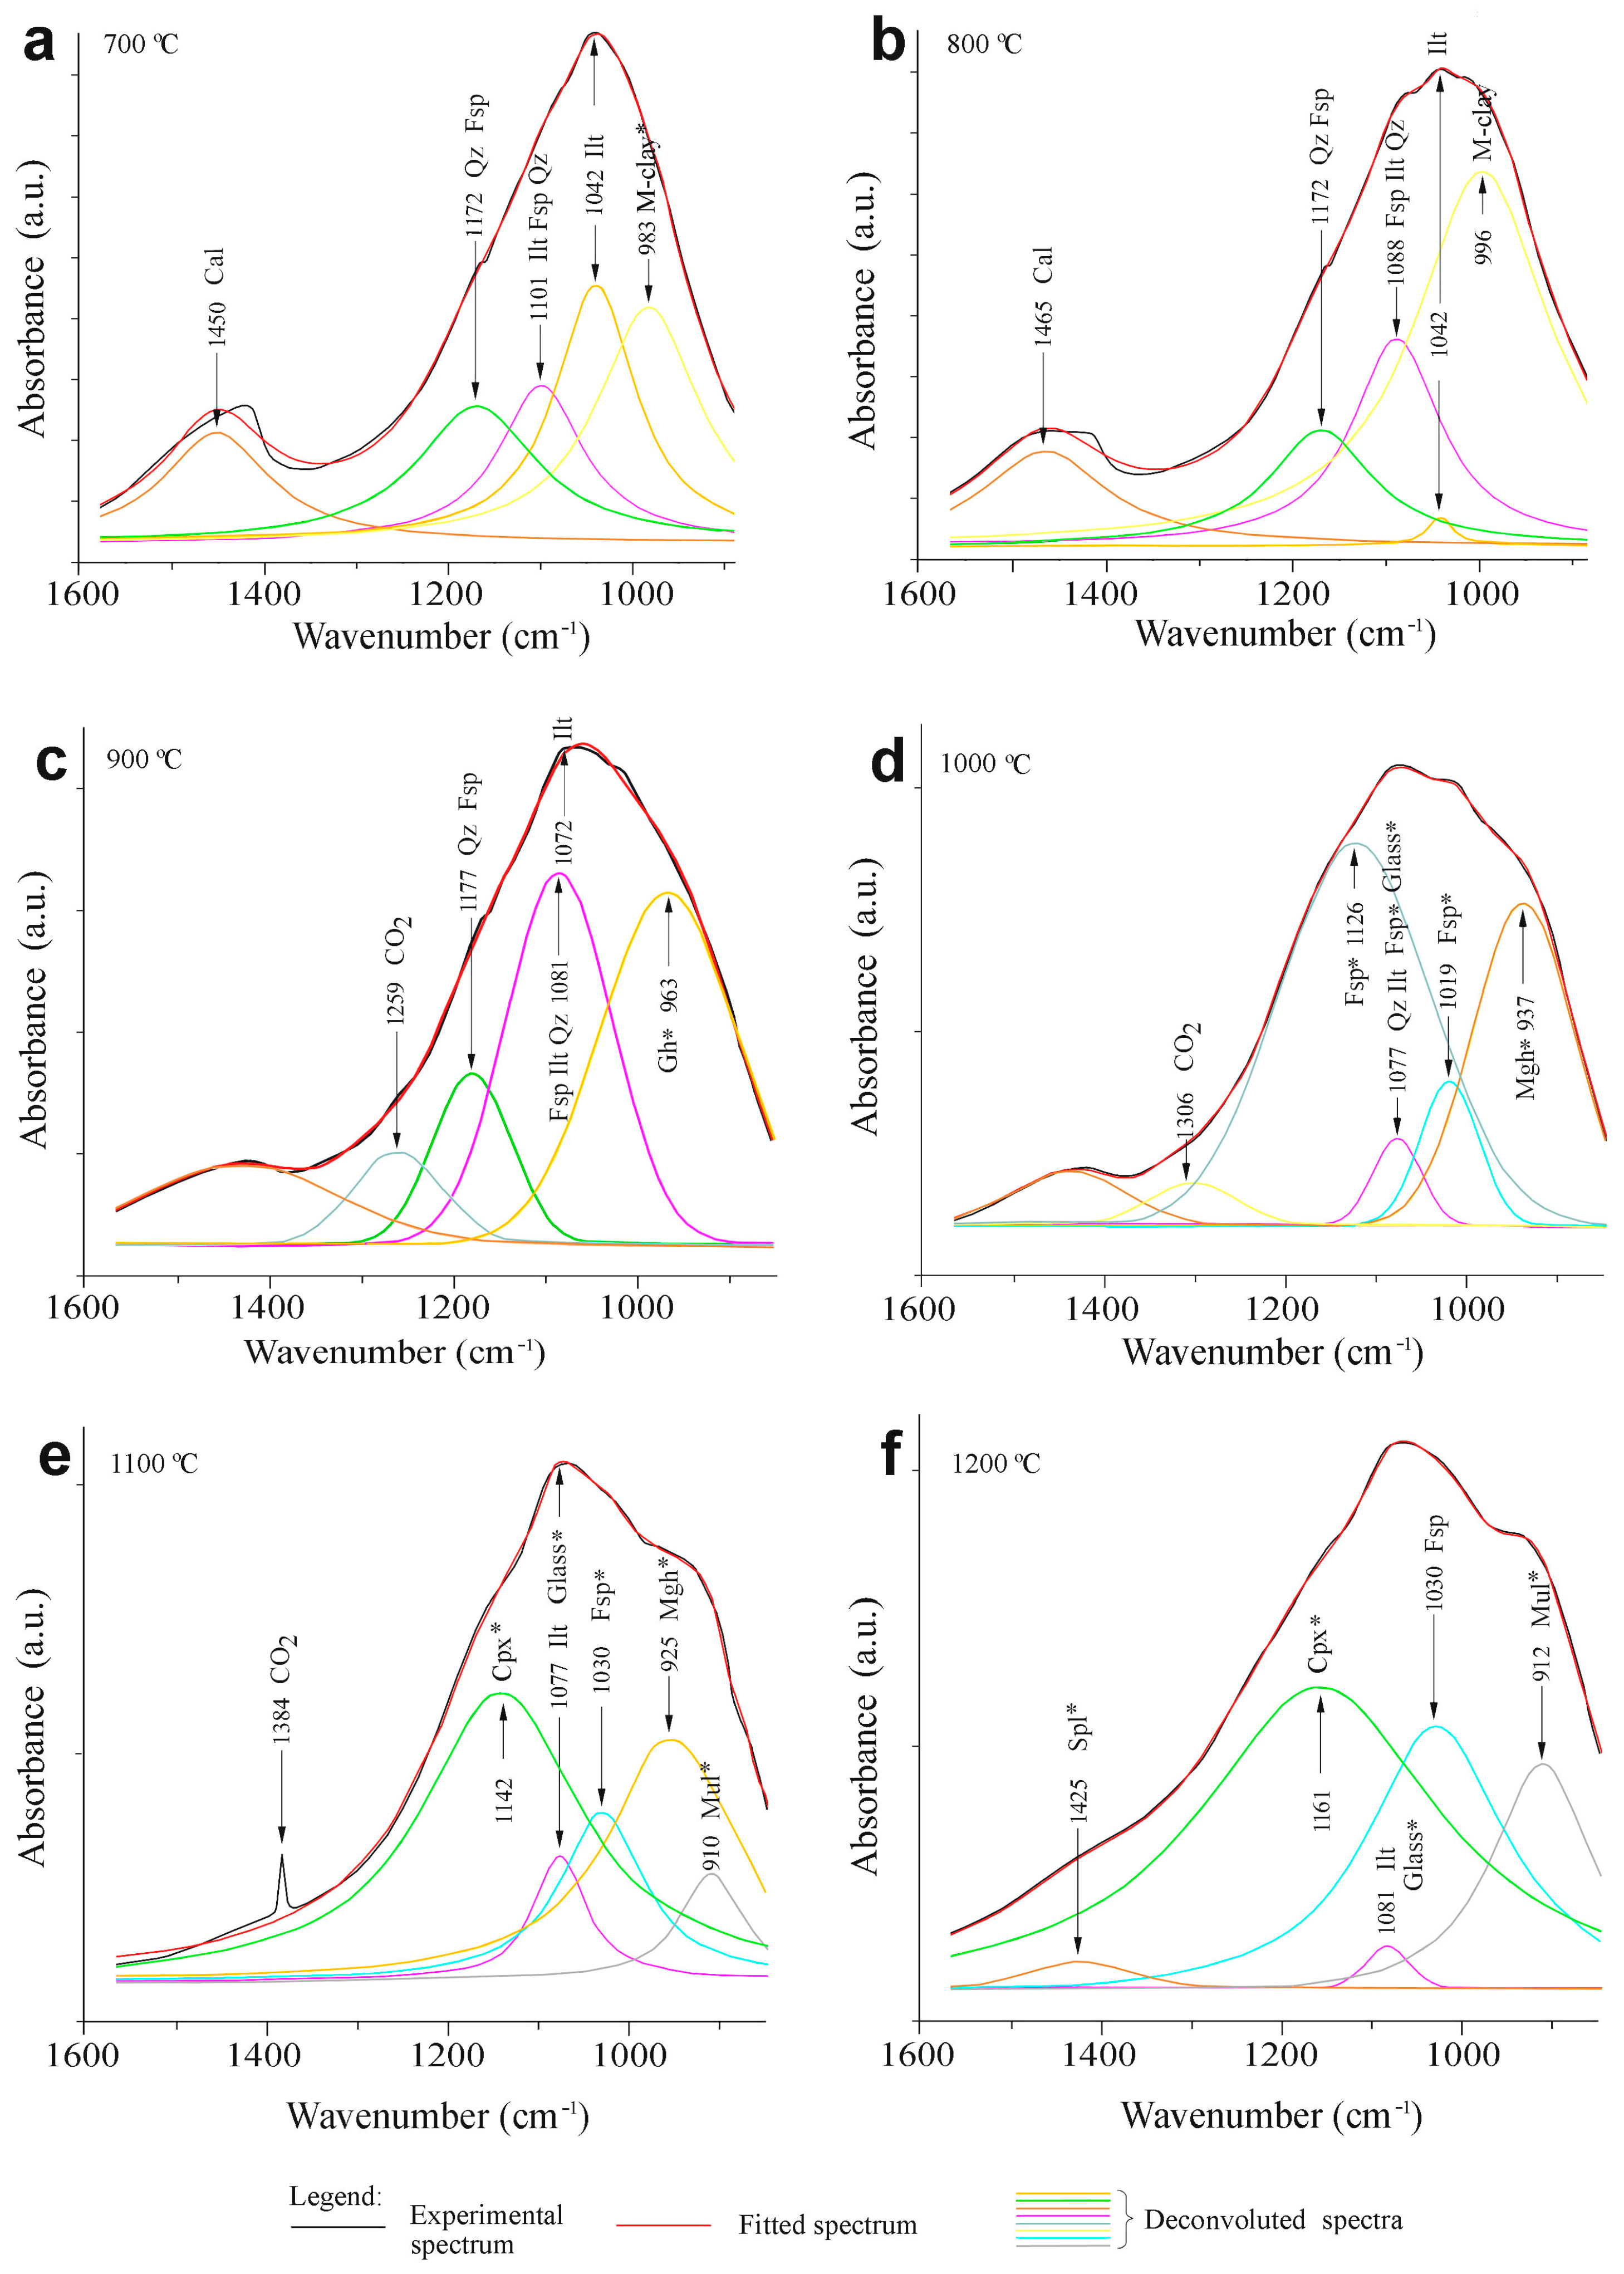
3.2.4. FTIR Spectroscopy

In the following section, the thermal evolution of the FTIR signals and the assignment of mineral phases from the heated clay will be presented in detail. A gradual flattening coupled with widening, as well as the shifting of the main signals is observed in the spectra collected from the heated clay and displayed in Figure 2a,b and Figure 8a–f. The large band of Si-O stretching vibrations centred at 1030 cm−1, is related to the main component of the clay i.e., illite, and appears at all heating temperatures.
The deconvolution for the 1600–850 cm−1 interval (Figure 8a–f) is in good agreement with the experimental and fitted spectra. Several newly-formed mineral phases were identified in the FTIR spectra of the heated clay: meta-clay (Si-O vibrations), hematite, gehlenite, feldsparh, clinopyroxene, maghemite, mullite and glass (Figure 8a–f). The meta-clay is a ‘pseudoamorphous phase’ [52] which may have been formed already at 700 °C from a predominant illite-like clay mineral. Hematite appears before 700 °C, as a result of Fe-oxihydroxides and chlorite transformation. At 1200 °C, part of hematite transforms into spinel (1425 cm−1 signal).
The bands at 1126, 1029, and 1019 cm−1, visible only between 1000 and 1200 °C (Figure 8d–f), can be linked to feldsparh formed by reaction between gehlenite and quartz. Figure 2b displays there a signal at 471 cm−1, related to Si–O, Al–O deformation in several minerals such as illite-muscovite, feldspar, and quartz. This band gradually flattens and broadens with increasing temperature.
The quartz doublet at 798 and 779 cm−1 at 1000 °C coalescences into a single band (Figure 2b), which reflects the melting and formation of glass [70]. The quartz signals at 1172, 1101, and 524 cm−1 shift towards higher wave numbers and strongly diminish after 1100 °C. This is in agreement with the reducing of quartz grains size (OM), the diminishing of quartz peaks (XRPD), and their melting (SEM). Quartz melts and ‘dissolves’ into the matrix, it is consumed in reactions with calcite and clay minerals, and also transforms into α-cristobalite.
The 875 cm−1 band disappearing between 800 and 900 °C (Figure 2a,b) marks the destruction of calcite and dolomite [18]. The other calcite main signal, at 1438 cm−1, flattens progressively and is no longer found at 900 °C (Figure 8b). Thus, an interval between 800 and 850 °C can be assigned to decomposition of primary calcite and forming of CaO—lime. The 1259, 1306, and 1384 cm−1 signals recorded above 900 °C (Figure 8c–e) can be assigned to recarbonation of lime [69].

4. Discussion

Subject of a wealth of papers, e.g., ref. [10] and references therein, the firing constraints of the clay-based ceramics, in particular the ancient one, rely basically on thermal changes which include dehydration, dehydroxylation, structural breakdown, chemical reaction, recrystallisation, and forming new phases [10,65,71,72]. Each of these processes stretches over various temperature intervals, which may overlap.
Despite the low amount, the small grain size, the non-stoichiometric composition and often the deformed crystalline structure, the newly-formed phases may be regarded as ‘ceramic markers’ [73] and can be used in inferring technological constraints of ceramics [74]. Nevertheless, the temperature values given in the literature for the formation of the ceramic markers are stretched over large intervals. For example, gehlenite is thought to start forming at 800 °C [13,75], 850 °C [73], 900 °C [4], between 800 and 900 °C [76], or after 900 °C [18]. Onset of clinopyroxene formation is also recorded at various temperatures, i.e., 825 °C [77], 850 °C [78,79,80], and 900 °C [76]. The values given for the upper stability limit for these firing phases vary also largely. In a similar way, different formation/disappearance temperatures are recorded for hematite, feldspar, mullite, and α-cristobalite, among others. They may form successively or concomitantly, but may exist only within certain temperature limits.
Besides the technological choices such as kiln type, heating/cooling gradient, firing atmosphere, timing, loading or the location within the kiln, there are a high number of other variables influencing the final composition and the structure of a ceramic body. Among these variables, the most important are the mineralogy and chemistry of the raw materials, their homogeneity, possible mixing and refinement, the size of the components and the presence of temper. Thus, the resulting ceramic body may show an extremely wide range of possible compositions and structures.
Table S2 displays the correspondence between the optical characteristics of the matrix (Figure 4), the pattern of the illite-muscovite XRPD peaks (Figure 5), and the appearance of the ceramic body as seen in SEM images (Figure 6). Up to 800 °C, the ceramic material—still highly birefringent—shows sharp peaks corresponding to a crystalline structure. However, “the most significant textural and mineralogical changes are observed in samples with carbonates when fired at T > 800°C” [15].
The main physical and chemical reactions upon heating are linked to the phyllosilicates, e.g., illite and muscovite. As the temperature increases, after losing water (dehydration), the phyllosilicates start to dehydroxylate before 650–700 °C [72], and their structure collapses and grades into an amorphous state. Small amounts of glass occur around 800 °C [22]. The increase of the amount of glass at T > 900 °C is in good agreement with previous studies [75,81,82,83]. The illite-muscovite XRPD peaks diminish in intensity and disappear above 900 °C (see also [84]). At 1100 °C and 1200 °C, only FTIR shows small amounts of illite (Figure 8e,f), most likely present as relics trapped in the glassy mass.
Maghemite could not be detected by OM, but XRPD shows the presence of its peaks between 900 °C and 1200 °C. The FTIR recorded maghemite only at 1000 °C and 1100 °C. Although it can nucleate earlier [4,85], hematite was not detected by XRPD and FTIR before 800 °C, possibly due to its small grain size and low amount. The reddish hue of the matrix argues for the presence of hematite starting with 700 °C and its persistence up to 1200 °C.
The most significant reactions involve carbonates. The micrite carbonate (mostly calcite) decomposes already at 800–850 °C. To react and form Ca-Al-Si minerals (gehlenite, clinopyroxene and feldspar in our case), a temperature high enough to also decompose the clay minerals—the source for Si and Al [86]—is necessary. The minerals resulting from the reaction between calcite, clay minerals, and quartz have a high impact in assessing the firing temperature.
Illite and muscovite in contact with quartz leads to the formation of K-feldspar [58,62] as well as some mullite after 900 °C. This is in agreement with the obvious increase of the XRPD peaks at 1000 °C (Figure 5). Formation of K-feldspar after 800–850 °C [61,62] is proved also by primary feldspar grains overgrown by K-feldspar coronas (Figure 4b).
As gehlenite and clinopyroxene have been found at 900 °C, most likely they start to form before, e.g., between 800 °C [13] and 850 °C (see also [71,72,73,79,80,87]). According to [83], gehlenite results by the reaction between illite and calcite, whereas clinopyroxene (diopside, augite, hedenbergite) may form by reaction between calcite, dolomite, and quartz. Gehlenite and clinopyroxene can be found until a maximum temperature of 950–1000 °C [52]. Nevertheless, traces of clinopyroxene have been detected by FTIR in the clay heated at 1100 °C and 1200 °C. The disappearance of gehlenite over 1000 °C can be explained in two ways: it reacts with quartz, resulting in wollastonite and feldspar anorthite [83], or it reacts with the Si-Al melt resulting from decomposition of clay minerals, and thus leading also to feldspar anorthite [83]. However, no traces of wollastonite have been detected by any of the techniques used. The large-scale formation of feldspar is also marked by the strong increase of the 3.4 Å XRPD peak of feldspar with 1100 °C. Most feldspar detected above 1000 °C (Figure 5) is most likely have been formed by the reaction between calcite and illite, not from gehlenite.
Feldspar is an important primary component of the raw clay and its 1172 cm−1 band remains almost unchanged upon heating until after 900 °C (Figure 8a–c). The 1101 cm−1 band, which shifts towards lower wavenumber (1088 cm−1) and disappears beyond 1100 °C, is related to newly-formed feldspar. The newly-formed Ca-rich feldspar (anorthite) on muscovite expenses, feldspar, and small amounts of mullite and feldspar may appear also before 1000 °C (Figure 5).
Quartz is partly consumed by melting and by reactions with illite and calcite. Only the XRPD (Figure 5) recorded the transformation of quartz into α-cristobalite 1100 °C (see also [83]).
The FTIR investigation show that it is complementary to other techniques, e.g., XRPD. The reducing of the intensity of FTIR bands and their shift with increasing temperature is to be expected (see also [41,45]). The structural changes of the illite-like clay mineral as observed by means of FTIR cover a wide range of temperatures. The large band centred at 1030 cm−1 which is intense and narrow at 700 °C, with increasing temperature flattens and shifts to higher wavelengths (1082 cm−1). The destruction of muscovite, evidenced by the diminishing of the 3430 and 471 cm−1 signals, takes place at higher temperatures, specifically between 900 °C and 1100 °C. The band at 3430 cm−1 (Figure 2a,b), which was still recorded from the OH vibrations at higher temperatures (1200 °C), can be due to the short time of heating [80], which allowed relic illite and muscovite to be trapped in the glass. Chlorite survived only until 800 °C.
The above-described processes are well illustrated by the secondary electron images obtained by SEM. Mineral phases and glass have been identified and their association and distribution proved to be specifically related to the temperature. Due to the compositional inhomogeneity of the clay (Figure 1a), the ‘ceramic markers’ resulting upon firing are unevenly distributed in the heated clay mass, some of them being found mainly in the voids left by the decomposed carbonate. An unstructured material ranging from intergranular sintered material up to a glassy material connects primary compounds as well as the ceramic markers.
Despite some differences, which are due to the method and the amount and size of the components, the data obtained by several methods are consistent (Figure 9) and correlates well. This allows drawing an indicative frame in estimating the firing temperature undergone by a clay-based ceramic body (Table S2).

5. Conclusions

The combination of various analytical techniques contributes to a better understanding of small-scale processes occurring in a carbonatic clay when heated up to 1200 °C. The resulting ceramic body consists of a sintered-to-glassy network that glues together both relics of primary and newly formed minerals. The weight of various phases as detected by different techniques may slightly differ. Some of the methods (FTIR) revealed the survival of phyllosilicates at high temperature (1100 °C). Overall, the most significant structural and mineralogical changes and the formation/disappearance of the ‘ceramic markers’ are recorded within the 850 °C to 950 °C temperature interval.
The corroboration of the optical characteristics and microstructure of the matrix on one side, and certain associations of primary phases and ‘ceramic markers’ on the other side, may be used as a ‘ceramic thermometer’ in inferring the technological conditions for clay-based archaeological ceramics. Even more, this particular clay bears a high potential as a reference material for ethno-archaeological experiments.

Supplementary Materials

The following supporting information can be downloaded at: https://www.mdpi.com/article/10.3390/min15040390/s1, Table S1: Raw and heated clay. Wavenumber (in cm−1), infrared bands (vibrations), and mineral assignment; based on [45,46,47,48,49,50,51]; Table S2: Summary of phase characteristics for heated clay briquettes obtained from carbonatic illitic clay, as determined by multi-analytical investigation. Shadowed rows mark intervals with the most significant thermal changes.

Author Contributions

Conceptualization: C.I., V.H. and V.S.; data curation: C.I.; formal analysis: C.I., V.H., V.S. and Á.G.; funding acquisition, C.I., Á.G.; methodology, C.I. and V.H. (OM, SEM), V.S. (FTIR), Á.G. (XRPD); C.I. and V.H. are responsible for OM and SEM data acquisition and interpretation of results, V.S. is responsible for FTIR data acquisition and interpretation of results, and Á.G. is responsible for XRPD sample preparation, data acquisition, and interpretation of results. C.I. and V.H. wrote the original and revised manuscript. All authors have read and agreed to the published version of the manuscript.

Funding

The study was financed by the UEFISCDI/CNCS projects PN-II-ID-PCE-2011-3-0881 (FTIR data) and PN-III-ID-PCE-2016-0229 (OM, XRPD, SEM-EDX investigations, as well as the manuscript editing) granted to C.I., in the framework of the Excellence Research Program of the Romanian Ministry of Education and Research. C.I. and Á.G. also acknowledge support of the Babeş-Bolyai University (Grants ACG 31119/2024 and AGC30938/2024, respectively).

Data Availability Statement

The data presented in this study are partly available in Supplementary Material; all other data are available on request from the corresponding author.

Acknowledgments

Suzana Erić from University of Belgrade is thanked for the help with SEM-EDX investigations, and Monica Mereu from Babeş-Bolyai University Cluj-Napoca for the computer-assisted graphics. The anonymous reviewers are sincerely thanked for their comments and suggestions which significantly helped to improve the quality of the manuscript.

Conflicts of Interest

The authors declare no conflicts of interest. The funders had no role in: (i) the design of the study; (ii) the collection, analyses, or interpretation of data; (iii) the writing of the manuscript, or (iv) the decision to publish the results.

Abbreviations

The following abbreviations are used in this manuscript:
Cmclay minerals
Qz quartz
Cbmmicrite carbonate
Cbssparite carbonate
Msmuscovite
Fspfeldspar
Calcalcite
Ilit-Msillite-muscovite
Chlchlorite
Btbiotite
Doldolomite
Klnkaolinite
Gthgoethite
Lpclepidocrocite
Gsglass
Ppore
Mxmatrix
Ghgehlenite
Crsα-cristobalite
Cpxclinopyroxene
Mghmaghemite
Hthematite
Iltillite
Mulmullite
Splspinel
M-claymeta-clay
Fsppprimary feldspar
Fsphnewly-formed feldspar

References

  1. Vandiver, P.B.; Soffer, O.; Klima, B.; Svoboda, J. The origins of ceramic technology at Dolni Vĕstonice, Czechoslovakia. Science 1989, 246, 1002–1008. [Google Scholar] [CrossRef]
  2. Shelach, G. On the invention of pottery. Science 2012, 336, 1644–1645. [Google Scholar] [CrossRef]
  3. Maniatis, Y. The emergence of ceramic technology and its evolution as revealed with the use of scientific techniques. In From Mine to Microscope: Advances in the Study of Ancient Technology; Shortland, A.J., Freestone, I.C., Rehren, T., Eds.; Oxbow Books: Oxford, UK, 2009; pp. 11–27. [Google Scholar]
  4. Maniatis, Y.; Simopoulos, A.; Kostikas, A. Moessbauer study of the effect of calcium content on iron oxide transformations in fired clays. J. Am. Cer. Soc. 1981, 64, 263–269. [Google Scholar] [CrossRef]
  5. Müller, N.S.; Vekinis, G.; Kilikoglou, V. Impact resistance of archaeological ceramics: The influence of firing and temper. J. Archaeol. Sci. Rep. 2006, 7, 519–525. [Google Scholar] [CrossRef]
  6. Tămăşan, M.; Mocuţa, H.; Ionescu, C.; Simon, V. Structural changes induced in mineral clays by high temperature heat treatments. Stud. Univ. Babes Bolyai Phys. 2009, 54, 3–8. [Google Scholar]
  7. Ionescu, C.; Hoeck, V.; Gruian, C.; Simon, V. Insights into the EPR characteristics of heated carbonate-rich illitic clay. Appl. Clay Sci. 2014, 97–98, 138–145. [Google Scholar] [CrossRef]
  8. Tite, M.S.; Kilikoglou, V.; Vekinis, G. Strength, toughness and thermal shock resistance of ancient ceramics, and their influence on technological choice. Archaeometry 2001, 43, 301–324. [Google Scholar] [CrossRef]
  9. Hein, A.; Müller, N.; Day, P.M.; Kilikoglou, V. Thermal conductivity of archaeological ceramics: The effect of inclusions, porosity and firing temperature. Thermochim. Acta 2008, 480, 35–42. [Google Scholar] [CrossRef]
  10. Gliozzo, E. Ceramic technology. How to reconstruct the firing process. Archaeol. Antropol. Sci. 2020, 12, 260. [Google Scholar] [CrossRef]
  11. Neff, H.; Bishop, L.; Sayre, E.V. Simulation approach to the problem of tempering in compositional studies of archaeologial ceramics. J. Archaeol. Sci. 1988, 15, 159–172. [Google Scholar] [CrossRef]
  12. Grifa, C.; Cultrone, G.; Langella, A.; Mercurio, M.; De Bonis, A.; Sebastián, E.; Morra, V. Ceramic replicas of archaeological artefacts in Benevento area (Italy): Petrophysical changes induced by different proportions of clays and temper. Appl. Clay Sci. 2009, 46, 231–240. [Google Scholar] [CrossRef]
  13. Cultrone, G.; Rodriguez-Navarro, C.; Sebastian, E.; Cazalla, O.; De la Torre, M.J. Carbonate and silicate phase reactions during ceramic firing. Eur. J. Miner. 2001, 13, 621–634. [Google Scholar] [CrossRef]
  14. Heimann, R. Firing technologies and their possible assessment by modern analytical method. In Archaeological Ceramics; Olin, J.S., Franklin, A.D., Eds.; Smithsonian Institution Press: Washington, DC, USA, 1982; pp. 89–96. [Google Scholar]
  15. Shepard, A.O. Ceramics for the Archaeologist. Carnegie Institute: Washington, DC, USA, 1976; p. 414. [Google Scholar]
  16. Maggetti, M. Phase analysis and its significance for technology and origin. In Archaeological Ceramics; Olin, J.S., Franklin., A.D., Eds.; Smithsonian Institution Press: Washington, DC, USA, 1982; pp. 121–133. [Google Scholar]
  17. Degryse, P.; Braekmans, D. Petrography: Optical Microscopy. In The Oxford Handbook of Archaeological Ceramic Analysis; Hunt, A.M.W., Ed.; Oxford University Press: Oxford, UK, 2017; pp. 288–304. [Google Scholar]
  18. Shoval, S. Mineralogical changes upon heating calcitic and dolomitic marl rocks. Thermochim. Acta 1988, 135, 243–252. [Google Scholar] [CrossRef]
  19. Shoval, S. Using FT-IR spectroscopy for study of calcareous ancient ceramics. Opt. Mater. 2003, 24, 117–122. [Google Scholar] [CrossRef]
  20. Heimann, R. X-ray powder diffraction (XRPD). In The Oxford Handbook of Archaeological Ceramic Analysis; Hunt, A.M.W., Ed.; Oxford University Press: Oxford, UK, 2017; pp. 288–304. [Google Scholar] [CrossRef]
  21. Miras, A.; Galán, E.; González, I.; Romero-Baena, A.; Martín, D. Mineralogical evolution of ceramic clays during heating. An ex/in situ X-ray diffraction method comparison study. Appl. Clay Sci. 2018, 161, 176–183. [Google Scholar] [CrossRef]
  22. Tite, M.S.; Maniatis, Y. Examination of ancient pottery using the scanning electron microscope. Nature 1975, 257, 122–123. [Google Scholar] [CrossRef]
  23. Maniatis, Y.; Tite, M.S. Technological examination of Neolithic-Bronze Age pottery from central and southeast Europe and from the Near East. J. Archaeol. Sci. 1981, 8, 59–76. [Google Scholar] [CrossRef]
  24. Shoval, S. Fourier transform infrared spectroscopy (FT-IR) in archaeological ceramic analysis. In The Oxford Handbook of Archaeological Ceramic Analysis; Hunt, A.M.W., Ed.; Oxford University Press: Oxford, UK, 2017; pp. 288–304. [Google Scholar] [CrossRef]
  25. Madejová, J.; Komadel, P. Baseline studies of the clay minerals society source clays: Infrared methods. Clays Clay Miner. 2001, 49, 410–432. [Google Scholar] [CrossRef]
  26. Madejová, J. FTIR techniques in clay mineral studies. Vibr. Spectr. 2003, 31, 1–10. [Google Scholar] [CrossRef]
  27. De Benedetto, G.E.; Laviano, R.; Sabbatini, L.; Zambonin, P.G. Infrared spectroscopy in the mineralogical characterization of ancient pottery. J. Cult. Herit. 2002, 3, 177–186. [Google Scholar] [CrossRef]
  28. Barone, G.; Crupi, V.; Galli, S.; Majolino, D.; Migliardo, P.; Venuti, V. Spectroscopic investigation of Greek ceramic artefacts. J. Mol. Str. 2003, 651–653, 449–458. [Google Scholar] [CrossRef]
  29. Barone, G.; Crupi, V.; Longo, F.; Majolino, D.; Mazzoleni, P.; Tanasi, D.; Venuti, V. FT-IR spectroscopic analysis to study the firing processes of prehistoric ceramics. J. Mol. Struct. 2011, 993, 147–150. [Google Scholar] [CrossRef]
  30. Shoval, S.; Beck, P. Thermo-FTIR spectroscopy analysis as a method of characterizing ancient ceramic technology. J. Therm. Anal. Calorim. 2005, 82, 609–616. [Google Scholar]
  31. Kaufhold, S.; Hein, M.; Dohrmann, R.; Ufer, K. Quantification of the mineralogical composition of clays using FTIR spectroscopy. Vibr. Spectr. 2012, 59, 29–39. [Google Scholar] [CrossRef]
  32. Germinario, C.; Cultrone, G.; De Bonis, A.; Izzo, F.; Langella, A.; Mercurio, M.; Morra, V.; Santoriello, A.; Siano, S.; Grifa, C. The combined use of spectroscopic techniques for the characterisation of Late Roman common wares from Benevento (Italy). Measurement 2018, 114, 515–525. [Google Scholar] [CrossRef]
  33. Răileanu, G.; Marinescu, F.; Popescu, A. Geological Map of Romania, 1:200000 Scale; Geological Institute of Romania: Bucharest, Romania, 1968. [Google Scholar]
  34. Hoeck, V.; Ionescu, C.; Metzner-Nebelsick, C.; Nebelsick, L.D. Mineralogy of the ceramic slags from the Bronze Age funerary site in Lăpuş, NW Romania. Geol. Quat. 2012, 56, 649–664. [Google Scholar] [CrossRef]
  35. International Centre for Diffraction Data. Available online: https://www.icdd.com (accessed on 8 October 2024).
  36. US National Institute of Standards and Technology Reference Material. Available online: www.nist.gov/programs-projects/powder-diffraction-srms (accessed on 8 October 2024).
  37. Moenke, H. Spektralanalyse von Mineralien und Gesteinen; Akademische Verlagsgesellschaft Geest & Portig K.G.: Leipzig, Germany, 1962; p. 222. [Google Scholar] [CrossRef]
  38. Moenke, H. Silica, the three-dimensional silicates, borosilicates, and beryllium silicates. In The Infrared Spectra of Minerals; Farmer, V.C., Ed.; Mineralogical Society of London: London, UK, 1974; pp. 365–382. [Google Scholar] [CrossRef]
  39. Farmer, V.C. Vibrational spectroscopy in mineral chemistry. In The Infrared Spectra of Minerals; Farmer, V.C., Ed.; Mineralogical Society of London: London, UK, 1974; Monograph 4; pp. 1–10. [Google Scholar] [CrossRef]
  40. Farmer, V.C. The layer silicates. In The Infrared Spectra of Minerals; Farmer, V.C., Ed.; Mineralogical Society of London: London, UK, 1974; Monograph 4; pp. 331–363. [Google Scholar] [CrossRef]
  41. Freund, F. Ceramics and thermal transformations of minerals. In The Infrared Spectra of Minerals; Farmer, V.C., Ed.; Mineralogical Society of London: London, UK, 1974; Monograph 4; pp. 465–482. [Google Scholar] [CrossRef]
  42. Kiefer, S.W. Thermodynamics and lattice vibrations of minerals: 2. Vibrational characteristics of silicates. Rev. Geophys. Space Phys. 1979, 17, 20–34. [Google Scholar] [CrossRef]
  43. Guggenheim, S.; Martin, R.T. Definition of clay and clay mineral: Joint report of AIPEA and CMS nomenclature committees. Clay Miner. 1995, 30, 257–259. [Google Scholar] [CrossRef]
  44. Warr, L.N. IMA–CNMNC approved mineral symbols. Miner. Mag. 2021, 85, 291–320. [Google Scholar] [CrossRef]
  45. Chester, R.; Elderfiel, H. An infrared study of clay minerals, 2. The identification of kaolinite-group clays in deep-sea sediments. Chem. Geol. 1973, 12, 281–288. [Google Scholar] [CrossRef]
  46. Rochester, C.H.; Topham, S.A. Infrared study of surface hydroxyl groups on goethite. J. Chem. Soc. Faraday Trans. 1 1979, 75, 591–602. [Google Scholar]
  47. Skogby, H.; David, R.; Bell, D.R.; Rossman, G.R. Hydroxide in pyroxene: Variations in the natural environment. Am. Miner. 1990, 75, 764–774. [Google Scholar]
  48. Weckler, B.; Lutz, H.D. Lattice vibration spectra. Part XCV. Infrared spectroscopic studies on the iron oxide hydroxides goethite (α), akaganéite (β), lepidocrocite (γ), and feroxyhite (δ). Eur. J. Solid State Inorg. Chem. 1998, 35, 531–544. [Google Scholar] [CrossRef]
  49. Vargas, M.A.; Diosa, J.E.; Mosquera, E. Data on study of hematite nanoparticles obtained from Iron(III) oxide by the Pechini method. Data Brief 2019, 25, 104183. [Google Scholar] [CrossRef]
  50. Deju, R.; Mazilu, C.; Stanculescu, I.; Tuca, C. Fourier transform infrared spectroscopic characterization of thermal treated kaolin. Rom. Rep. Phys. 2020, 72, 806. [Google Scholar]
  51. Sočo, E.; Domoń, A.; Papciak, D.; Michel, M.M.; Pająk, D.; Cieniek, B.; Azizi, M. Characteristics of Adsorption/Desorption Process on Dolomite Adsorbent in the Copper(II) Removal from Aqueous Solutions. Materials 2023, 16, 4648. [Google Scholar] [CrossRef]
  52. Shoval, S.; Yadin, E.; Panczer, G. Analysis of thermal phases in calcareous Iron Age pottery using FT-IR and Raman spectroscopy. J. Therm. Analys. Calorim. 2011, 104, 515–525. [Google Scholar] [CrossRef]
  53. Hlavay, J.; Jonas, K.; Elek, S.; Inczedy, J. Characterization of the particle size and the crystallinity of certain minerals by IR spectrophotometry and other instrumental methods—II. Investigations on quartz and feldspar. Clays Clay Miner. 1978, 26, 139–143. [Google Scholar] [CrossRef]
  54. Fabbri, B.; Gualtieri, S.; Shoval, S. The presence of calcite in archaeological ceramics. J. Eur. Ceram. Soc. 2014, 34, 1899–1911. [Google Scholar] [CrossRef]
  55. Delineau, T.; Allard, T.; Muller, J.-P.; Barges, O.; Yvon, J.; Cases, J.-M. FTIR Reflectance vs. EPR studies of structural iron in kaolinites. Clays Clay Miner. 1994, 42, 308–320. [Google Scholar] [CrossRef]
  56. Vaculícová, L.; Plevová, E. Identification of clay minerals and micas in sedimentary rocks. Acta Geodynam. Geomater. 2005, 2, 167–175. [Google Scholar]
  57. Maggetti, M. Mineralogisch-petrographische Untersuchung des Scherbenmaterials der urnenfelderzeitlichen Siedlung Elchinger Kreuz, Ldkr. Neu-Ulm/Donau. Kat. Prähistorischen Staatssamml. 1979, 19, 141–172. [Google Scholar]
  58. Ionescu, C.; Hoeck, V.; Ghergari, L. Electron microprobe analysis of ancient ceramics: A case study from Romania. Appl. Clay Sci. 2011, 53, 466–475. [Google Scholar] [CrossRef]
  59. Gliozzo, E.; Fortina, C.X.; Memmi Turbanti, I.; Turchiano, M.; Volpe, G. Cooking and painted ware from San Giusto (Lucera, Foggia): The production cycle, from the supply of raw materials to the commercialization of products. Archaeometry 2005, 47, 13–29. [Google Scholar] [CrossRef]
  60. Ionescu, C.; Hoeck, V.; Simon, V. Effect of the temperature and the heating time on the composition of an illite-rich clay: An XRPD study. Studia Univ. Babeș-Bolyai Phys. 2011, 56, 69–78. [Google Scholar]
  61. Duminuco, P.; Messiga, B.; Riccardi, M.P. Firing process of natural clays: Some microtextures and related phase compositions. Thermochim. Acta 1998, 321, 185–190. [Google Scholar] [CrossRef]
  62. Ionescu, C.; Hoeck, V. Firing-induced transformations in Copper Age ceramics from NE Romania. Eur. J. Miner. 2011, 23, 937–958. [Google Scholar] [CrossRef]
  63. Molera, J.; Pradell, T.; Vendrell-Saz, M. The colours of Ca-rich ceramic pastes: Origin and characterization. Appl. Clay Sci. 1998, 13, 187–202. [Google Scholar] [CrossRef]
  64. Carroll, D.L.; Kemp, T.F.; Bastow, T.J.; Smith, M.E. Solid-state NMR characterisation of the thermal transformation of a Hungarian white illite. Solid State Nucl. Magn. Reson. 2005, 28, 31–43. [Google Scholar] [CrossRef]
  65. Drachman, S.R.; Roc, G.E.; Smith, M.E. Solid state NMR characterisation of the thermal transformation of Fuller‘s Earth. Solid State Nucl. Magn. Reson. 1997, 9, 257–267. [Google Scholar] [CrossRef]
  66. Amadori, M.L.; Pallante, P.; Fermo, P.; Emami, M.A.; Chaverdi, A.A.; Callieri, P.; Matin, E. Advances in Achaemenid brick manufacturing technology: Evidence from the monumental gate at Tol-e Ajori (Fars, Iran). Appl. Clay Sci. 2018, 152, 131–142. [Google Scholar] [CrossRef]
  67. Bordia, R.K.; Kang, S.-J.L.; Olevsky, E.A. Current understanding and future research directions at the onset of the next century of sintering science and technology. J. Am. Cer. Soc. 2017, 100, 2314–2352. [Google Scholar] [CrossRef]
  68. Gál, Á.; Ionescu, C.; Bajusz, M.; Codrea, V.A.; Hoeck, V.; Barbu-Tudoran, L.; Simon, V.; Mureşan-Pop, M.; Csók, Z. Composition, technology and provenance of Roman pottery from Napoca (Cluj-Napoca, Romania). Clay Miner. 2018, 53, 621–641. [Google Scholar] [CrossRef]
  69. Shoval, S.; Gaft, M.; Beck, P.; Kirsh, Y. Thermal behaviour of limestone and monocrystalline calcite tempers during firing and their use in ancient vessels. J. Therm. Analys. 1993, 40, 263–273. [Google Scholar] [CrossRef]
  70. Berna, F.; Behar, A.; Shahack-Gross, R.; Berg, J.; Boaretto, E.; Gilboa, A.; Sharon, I.; Shalev, S.; Shilstein, S.; Yahalom-Mack, N.; et al. Sediments exposed to high temperatures: Reconstructing pyrotechnological processes in late Bronze and Iron Age Strata at Tel Dor (Israel). J. Archaeol. Sci. 2007, 34, 358–373. [Google Scholar] [CrossRef]
  71. Guggenheim, S.; Chang, Y.-W.; van Groos, K. Muscovite dehydroxylation: High-temperature studies. Am. Mineral. 1987, 72, 537–550. [Google Scholar]
  72. Abbott, R.N. Energy calculations on the dehydroxylation of muscovite. Can. Miner. 1994, 32, 87–92. [Google Scholar]
  73. Padeletti, G.; Fermo, P. A scientific approach to the attribution problem of renaissance ceramic productions based on chemical and mineralogical markers. Appl. Phys. A 2010, 100, 771–784. [Google Scholar] [CrossRef]
  74. Viani, A.; Cultrone, G.; Sotiriadis, K.; Ševčík, R.; Šašek, P. The use of mineralogical indicators for the assessment of firing temperature in fired-clay bodies. Appl. Clay Sci. 2018, 163, 108–118. [Google Scholar] [CrossRef]
  75. Dondi, M.; Ercolani, G.; Guarini, G.; Marsigli, M.; Venturi, I. Evolluzione della microstruttura durante la cottura rapida di impasti per piastrelle porose. Ceramurgia 1995, 25, 301–314. [Google Scholar]
  76. Trindade, M.J.; Dias, M.I.; Coroado, J.; Rocha, F. Mineralogical transformations of calcareous rich clays with firing: A comparative study between calcite and dolomite rich clays from Algarve, Portugal. Appl. Clay Sci. 2009, 42, 345–355. [Google Scholar] [CrossRef]
  77. Maritan, L.; Nodari, L.; Mazzoli, C.; Milano, A.; Russo, U. Influence of firing conditions on ceramic products: Experimental study on clay rich in organic matter. Appl. Clay Sci. 2006, 31, 1–15. [Google Scholar] [CrossRef]
  78. Dondi, M.; Ercolani, G.; Fabbri, B.; Marsigli, M. An approach to the chemistry of pyroxenes formed during firing of Ca-rich silicate ceramics. Clay Miner. 1999, 33, 443–445. [Google Scholar] [CrossRef]
  79. Rathossi, C.; Pontikes, Y. Effect of firing temperature and atmosphere on ceramics made of NW Peloponnese clay sediments: Part II. Chemistry of pyrometamorphic minerals and comparison with ancient ceramics. J. Eur. Ceram. Soc. 2010, 30, 1853–1866. [Google Scholar] [CrossRef]
  80. De Bonis, A.; Cultrone, G.; Grifa, C.; Langella, A.; Morra, V. Clays from the Bay of Naples (Italy): New insight on ancient and traditional ceramics. J. Eur. Ceram. Soc. 2014, 34, 3229–3244. [Google Scholar] [CrossRef]
  81. Maritan, L.; Mazzoli, C.; Nodari, L.; Russo, U. Second Iron Age grey pottery from Este (northeastern Italy): Study of provenance and technology. Appl. Clay Sci. 2005, 29, 31–44. [Google Scholar] [CrossRef]
  82. Khalfaoui, A.; Hajjaji, M. A chloritic-illitic clay from Morocco: Temperature–time–transformation and neoformation. Appl. Clay Sci. 2009, 45, 83–89. [Google Scholar] [CrossRef]
  83. Grapes, R. Pyrometamorphism; Springer: Berlin/Heidelberg, Germany, 2011; p. 365. [Google Scholar]
  84. Bauluz, B.; Mayayo, M.J.; Yuste, A.; Fernnadez-Nieto, C.; Gonzalez Lopez, J.M. TEM study of mineral transformation in fired carbonated clays: Relevance to brick making. Clay Miner. 2004, 39, 333–344. [Google Scholar] [CrossRef]
  85. Nodari, L.; Marcuz, E.; Maritan, L.; Mazzoli, C.; Russo, U. Hematite nucleation and growth in the firing of carbonate-rich clay for pottery production. J. Eur. Ceram. Soc. 2007, 27, 4665–4673. [Google Scholar] [CrossRef]
  86. Maggetti, M.; Heimann, R.B. Bildung und Stabilität von Gehlenit in römischer Feinkeramik. Schweiz. Miner. Petrogr. Mitt. 1979, 59, 413–417. [Google Scholar]
  87. Hajjaji, M.; Kacim, S. Clay-calcite mixes: Sintering and phase formation. British Ceram. Trans. 2004, 103, 29–32. [Google Scholar] [CrossRef]
Figure 1. Raw clay composition: (a) Polarized-light microphoto showing a mass of fined-grained clay minerals (Cm) embedding fine grains of quartz (Qz), micrite carbonate (Cbm), sparite carbonate (Cbs), muscovite lamellae (Ms) and Fe-rich pellets (Fe) crossed polarizers. (b) X-ray diffractogram displaying peaks of quartz, feldspar (Fsp), calcite (Cal), illite-muscovite (Ilt-Ms), chlorite (Chl), biotite (Bt), and dolomite (Dol). Mineral abbreviations according to [44] are used throughout this paper.
Minerals 15 00390 g001
Figure 2. FTIR spectra of raw and heated clay in 4000 cm−1 to 3000 cm−1 (a), and 2000 cm−1 to 400 cm−1 (b) domains. Abbreviations as previously stated; additionally: Ilt for illite; Kln for kaolinite, Gth for goethite, Lpc for lepidocrocite; Cpx for clinopyroxene; Ht for hematite.
Minerals 15 00390 g002
Figure 3. Deconvoluted FTIR spectrum of raw clay, in 1600–850 cm−1 range and according mineral assignement.
Minerals 15 00390 g003
Figure 4. Polarized-light microphotos of clay briquettes heated: (a) at 700 °C: Birefringent matrix (Mx) containing clay minerals (yellow elongated grains), muscovite, quartz and calcite; (b) at 800 °C: Mixture of birefringent (lighter areas) and low birefringent matrix (darker areas), embedding micas and a plagioclase grain (dark grey) overgrown by K-feldspar; (c) at 900 °C: Formation of orange clusters; (d) at 1000 °C: Relics of quartz, muscovite and biotite (white arrows) in a mostly isotropic matrix; (e) at 1100 °C: Partly melted quartz grains in a glass (Gs) incorporating hematite and probably maghemite; (f) at 1200 °C: Glass and relics of quartz (white spots). Crossed polarizers for all images. Abbreviations as previously stated; additionally: Mx for matrix; Gs for glass; P for pores. Parallel orientation of lamellar minerals as seen in (ac) is due to the pressure applied when shaping the clay briquettes.
Minerals 15 00390 g004
Figure 5. X-ray diffractograms of the raw clay and clay briquettes heated between 700 and 1200 °C. Legend: 1—quartz, 2—illite-muscovite, 3—feldspar, 4—carbonate, 5—chlorite, 6—hematite, 7—clinopyroxene, 8—gehlenite, 9—maghemite, 10—mullite, 11—α-cristobalite.
Minerals 15 00390 g005
Figure 6. Secondary electron images (SEM) of heated clay samples, showing mineralogy and microstructure of heated clay: (a) Phyllosilicates displaying a low degree of sintering, at 700 °C; (b) sintering and incipient vitrification, at 800 °C; (c) partly glassy matrix (indicated by white arrows), with voids containing needle-like crystals of gehlenite, at 900 °C; (d) gehlenite, clinopyroxene, and calcite, at 1000 °C; (e) various vitrification stages of the matrix embedding partly melted quartz, at 1100 °C; (f) detailed image of glassy filaments formed at 1200 °C. Abbreviations as previously stated. Value of scale bars (white lines at bottom-right of each image) is: 20 μm for (a,c), 10 μm for (b,d,e), and 5 μm for (f).
Minerals 15 00390 g006
Figure 7. ED spectra of illitic matrix (a) and gehlenite (b) in clay briquettes heated at 1000 °C.
Minerals 15 00390 g007
Figure 8. FTIR spectra of heated clay in the 1600–850 cm−1 range. Experimental, fitted, and deconvoluted spectra at 700 °C (a), 800 °C (b), 900 °C (c), 1000 °C (d), 1100 °C (e), and 1200 °C (f). Abbreviations as previously stated; additionally: M-clay for meta-clay; Spl for spinel. Newly-formed phases are marked by (*).
Minerals 15 00390 g008
Figure 9. Comparative chart showing sequential presence of compounds as differently recorded by OM (red bar), XRPD (green bar), and FTIR (black bar), in raw and heated clay.
Minerals 15 00390 g009
Disclaimer/Publisher’s Note: The statements, opinions and data contained in all publications are solely those of the individual author(s) and contributor(s) and not of MDPI and/or the editor(s). MDPI and/or the editor(s) disclaim responsibility for any injury to people or property resulting from any ideas, methods, instructions or products referred to in the content.

