Abstract
Despite previous studies investigating selenium (Se) redox reactions in the presence of semiconducting minerals, Se redox reactions mediated by galena (PbS) are poorly understood. In this study, the redox chemistry of Se on galena is investigated over a range of environmentally relevant Eh and pH conditions (+0.3 to −0.6 V vs. standard hydrogen electrode, SHE; pH 4.6) using a combination of electrochemical, spectroscopic, and computational approaches. Cyclic voltammetry (CV) measurements reveal one anodic/cathodic peak pair at a midpoint potential of +30 mV (vs. SHE) that represents reduction and oxidation between HSeO3− and H2Se/HSe−. Two peak pairs with midpoint potentials of −400 and −520 mV represent the redox transformation from Se(0) to HSe− and H2Se species, respectively. The changes in Gibbs free energies of adsorption of Se species on galena surfaces as a function of Se oxidation state were modeled using quantum-mechanical calculations and the resulting electrochemical peak shifts are (−0.17 eV for HSeO3−/H2Se, −0.07 eV for HSeO3−/HSe−, 0.15 eV for Se(0)/HSe−, and −0.15 eV for Se(0)/H2Se). These shifts explain deviation between Nernstian equilibrium redox potentials and observed midpoint potentials. X-ray photoelectron spectroscopy (XPS) analysis reveals the formation of Se(0) potentials below −100 mV and Se(0) and Se(−II) species at potentials below −400 mV.
1. Introduction
While a vital nutrient at low concentrations, the capacity of selenium (Se) to act as a toxic contaminant has been evinced by cases such as the Kesterson reservoir in California where high concentrations of Se in sediments and aquatic systems have led to increased wildlife mortality rates and birth defects [1,2]. Owing to the chemical similarity to sulfur (S), such hazardous accumulations in the environment are often linked to the weathering of coal [3] and Se-bearing sulfide minerals [4,5]. Moreover, long-lived radionuclides of Se (e.g., 79Se) can be introduced to the environment where effluents are generated from spent nuclear fuel or reprocessing this fuel [6].
The mobility and fate of Se in the environment is highly dependent on the oxidation state which dictates factors such as sorption affinities and solubility [4]. For example, Se(VI) and Se(IV) species are dominant under oxidizing conditions and are not only more bioavailable and toxic than reduced forms, but also more soluble granting them greater mobility [4] (Figure 1). Under reducing conditions, Se is found as various Se(−II) species in addition to insoluble Se(0). While Se(−II) can occur as soluble H2Se/HSe− species, it also occurs as insoluble metallic selenides such as clausthalite (PbSe) or ferroselite (FeSe2), and as an incorporated species in a number of sulfides.
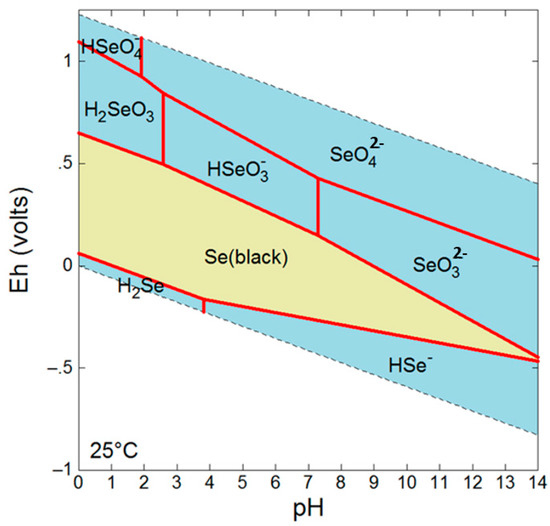
Figure 1.
Eh-pH diagram for Se at 10 mM, 25 °C.
Semiconducting minerals are not only naturally occurring in the environment but are also viable electron sources and sinks and allow for “conducting” electrons between redox-active species adsorbed some nm away from each other [7,8,9,10,11,12,13,14,15]. Consequently, interactions between contaminants and semiconducting minerals pose the chance for mobilization or immobilization by mediating redox reactions which alter the speciation of the contaminant and therefore its behavior [16]. With a band gap of 0.4 eV [17], galena (PbS) is not only a viable semiconducting mineral, but also one that offers particular geochemical relevance as a plausible substrate for Se interactions due to the common accumulations of Se in sulfide minerals [4,5,18].
To date, the geologic occurrence and distribution of Se in sulfide mineral-rich conditions have been reported [2,3,5]. In the literature, however, electrochemical investigations of Se redox transformation have mainly been limited to interactions with materials such as gold (Au) [19,20,21,22,23,24,25], platinum (Pt) [26,27], and silver (Ag) [22,28], offering little geochemical relevance. The role of natural semiconducting minerals such as pyrite (FeS2) and magnetite (Fe3O4) in Se redox cycling has been experimentally investigated [29,30,31,32]; however, the research approach has been limited to batch experiments combined with spectroscopic analysis, and, especially, little is known about interactions between Se and galena.
The goal of the present study is to identify Se redox reactions mediated by galena surfaces over a range of environmentally relevant Eh and pH conditions (+0.3 to −0.6 V; pH 4.6) and to characterize the effect of galena as a mediating substrate on those reactions. Results from this study will provide implications for the fate and mobility of Se in the environment not only by identifying the specific physicochemical conditions under which speciation changes occur, but also by accounting for how those conditions deviate from expected theoretical conditions. Finally, this paper aims to demonstrate a useful combination of experimental and theoretical techniques and, for these purposes, electrochemical, spectroscopic and computational approaches have been used as outlined below.
Cyclic voltammetry (CV) measurements were performed using a galena electrode and the collected data were analyzed to identify specific redox species responsible for electric signals at given pH and Eh. The use of electrochemical preparation allows the ability to quantify various redox parameters such as reduction potential, chemical reversibility, and the oxidants and reductants participating in specific reactions. It is important to note that in all experiments performed in this study, galena is not the primary electron donor in the reduction processes described, but rather transmits electrons from and to the electrochemical setup. In addition, galena catalyzes the reaction by helping in the dehydration of absorbing species from solution and by the potential overlap of orbitals between the mineral surface and the redox-active orbitals of the absorbing species. Even if a Se-reducing electron originates from an S 3p orbital (i.e., Sulfur 3p orbital), the missing S 3p electron will be replaced by an electron from the electrode.
The adsorption modes of Se species with different oxidation states on galena slabs were simulated based on molecular orbital modeling. Energetic contributions of adsorption are included in evaluating Se redox transformation mediated by galena and deviation between equilibrium reduction potentials and observed midpoint potentials are determined using calculated adsorption Gibbs free energies. Finally, X-ray photoelectron spectroscopy (XPS) was employed to acquire direct evidence for Se redox reactions catalyzed by the galena electrode by determining the composition ratios of different Se species on the galena surface.
2. Methods
2.1. Sample Characterization
Galena sourced from Missouri was characterized using scanning electron microscope-energy dispersive X-ray spectroscopy (SEM-EDS) using a 15 kV accelerating voltage and a 112.6 µA beam current (Figure 2). In addition to lead (Pb) and S, copper (Cu) impurities were detected which is commonly found in galena originating from Missouri [33,34,35]. The dominant form of powdered galena is cubic, which represents cleaving along (100) planes.
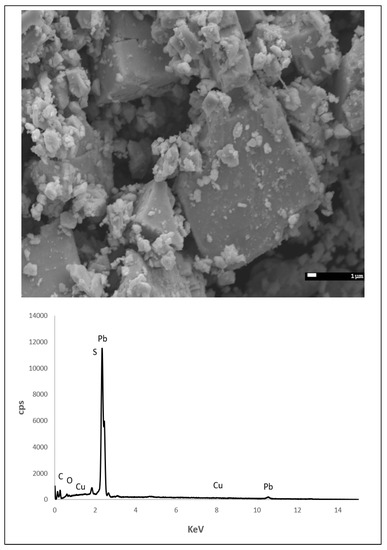
Figure 2.
Scanning electron microscope-energy dispersive X-ray spectroscopy (SEM-EDS) image of powdered galena (above) and the resulting spectrum (below). In addition to Pb and S, Cu was detected which is an impurity commonly reported for galena sourced from Missouri.
2.2. Voltammetry
Voltammetry was conducted in a conventional three-electrode cell controlled by an Princeton Applied Research EG&G model 263A potentiostat with Powersuite software. A Pt counter electrode (Sigma Aldrich) and Ag/AgCl reference electrode were used (CH Instruments); however, all potentials quoted in this study are with respect to the SHE. A powder microelectrode (PME) was used as the working electrode which acts effectively as a cleaved mineral electrode of greater surface area [36]. The increased surface area on a relatively small volume allows for relatively fast reaction kinetics which is important for redox processes in cyclic voltammetry that happen at a second to minute timescale. A PME was prepared by conventional glass blowing techniques and was composed of a Pt wire encased in soda lime glass with the Pt wire exposed flush to the end of the electrode. A cavity of 100 µm diameter (dictated by the diameter of the Pt wire) and a ~20 µm depth was made by etching the exposed Pt in aqua regia (~80 °C) for ~2.5 h [37]. The cavity was packed by tapping the electrode in galena powdered in an agate mortar and pestle, and the powder was removed from the cavity after use via sonication.
Unless otherwise stated, voltammetry was performed on freshly powdered, pristine galena in 10 mM Na2SeO3 + 100 mM NaCl adjusted to pH 4.6 at 50 mV/s initiating from the open circuit potential (OCP) in the positive-going direction. The OCP (~110 mV ± 5 mV) was monitored for 30 s before initiating each scan. Solutions of any pH were adjusted using HCl and NaOH. All reagents (excluding galena) were obtained from Sigma Aldrich. Solutions and were sparged with argon (Ar) gas for 30 min prior to voltammetry to remove dissolved oxygen.
On voltammograms, anodic and cathodic peaks are denoted with an “A” and “C”, respectively. The midpoint potential (Emid) of the anodic (EA) and cathodic (EC) peaks comprising a redox couple was defined as Emid = (EA + EC). Peak areas and peak currents were obtained using the Origin8.5 plotting software (OriginLab Corporation, Northhampton, USA). For these purposes, peaks were defined by either the two major inflection points or local minima or maxima bounding the peak of interest determined using a Savitzky–Golay smoothing function for first and second derivatives. Using these bounds, peak areas were obtained through integration and peak currents by subtracting the apparent peak current from that occurring along its baseline. Unless otherwise stated, peak charges and potentials are taken from the final cycle of cyclic voltammograms.
2.3. X-Ray Photoelectron Spectroscopy (XPS)
XPS spectra were obtained using a Kratos Axis Ultra X-ray photoelectron spectrometer with a monochromatized Al Kα source (1486.6 eV) primed to 8 mA and 14 kV at no more than 5 × 10⁻⁷ Torr. Core spectra obtained using a 20 eV pass energy with 0.1 eV resolution were calibrated with respect to the C 1s spectrum of adventitious carbon of each respective sample assuming a binding energy of 284.8 eV. Peak fitting and calculation of atomic ratios were performed using CasaXPS 2.3.17 software (Casasoftware Ltd, Teignmouth, UK) and the relative sensitivity factors provided by [38]. Due to the small diameter of the PME, XPS analysis was conducted on bulk galena electrodes prepared by mounting cleaved galena (polished to 1200 grit) to a copper wire via conductive silver paste (Ted Pella Inc., Redding, CA, USA) and insulated with non-conductive epoxy (Loctite). Bulk electrodes were polarized at potentials of interest (see Section 3.2) for 30 min in solution containing 10 mM Na2SeO3 + 100 mM NaCl and adjusted to pH 4.6. After polarization, bulk electrodes were stored in an anaerobic glove bag (5% H2 + 95% N2) for no more than two hours before being transferred into the spectrometer where evacuation could begin. Samples were not rinsed or further treated at any point after polarization. Analytical grade Na2SeO4, Na2SeO3, and Se0 reagents (Sigma Aldrich) were used as reference standard materials.
2.4. Calculation of Adsorption
The Gaussian 09 package was used to model the atomic structures and adsorption energies of possible surface species based on molecular orbital calculation. All calculations were made at B3LYP [39,40] and LANL2DZ [41,42,43] level. B3LYP is a hybrid method of density functional theory (DFT, to included electron correlation) and Hartree–Fock (HF, to approximate electron exchange well) approach. In order to approximate polarization due to bonding additional polarization functions were added (extra basis functions containing no electrons). LANL2DZ uses an all-electron description for atoms of the first row elements and small-core relativistic effective-core potentials (RECP) of inner electrons, combined with double-zeta functions for the valence electrons of heavier atoms of elements such as S, Se, and Pb [44]. These computational parameters have been successfully applied to calculating systems involving galena or Se molecules [44,45,46].
Modeling adsorbate structures on galena (Fm3m space group) was performed on a 4 × 4 × 2 atoms PbS cluster. This cluster represents the {100} surfaces of galena in good agreement with the SEM-EDS observations (Figure 2). One layer of the cluster was allowed to relax while the edge atoms on that layer were fixed in order to minimize edge effects that are inherent to the cluster size [46]. For the aim at calculating energetics of adsorption reactions occurring in aqueous phases, hydration was simulated by imposing the solute in a cavity within the solvent reaction field (SCRF) based on a PCM (Polarizable Continuum Model [47]) solvation model.
The adsorption Gibbs free energy is calculated from the computed Gibbs free energies of the chemical species (X), the galena slab and the species adsorbed on the slab (PbS≡X) as described in Equation (1):
In Equation (1), Gibbs free energies are obtained by adding vibrational contributions (cpT to obtain the enthalpy and −TΔS to include vibrational entropy). These contributions were obtained from frequency calculations on the optimized structure) to the molecular/electronic energy. Entropy changes due to hydration were included in the PCM solvation model.
3. Results
CV measures current as a function of electrochemical potential and was used here to characterize redox transformations between species with different Se oxidation states as mediated by the galena powder in the working electrode (Section 3.1). Resulting electrochemical signals were used to evaluate reduction potentials of possible redox pairs and the amounts of species changing their oxidation state within a given reduction or oxidation peak.
3.1. Cyclic Voltammetry of Galena with and without Se(IV)
CV was performed in the scan range of −0.65 to +0.3 V using the galena PME in the absence of Se to establish any voltammetric signatures contributed by reactions involving the Pt and galena electrode materials (Figure 3a). In the absence of Se, the PME with galena present in the cavity exhibits a cathodic peak at −440 mV (labeled C0 in Figure 3a). This peak is likely indicative of the reduction of oxidized surface elemental S via the following reaction taken from [48,49,50]:
S0 + 2H+ + 2e− → H2S.
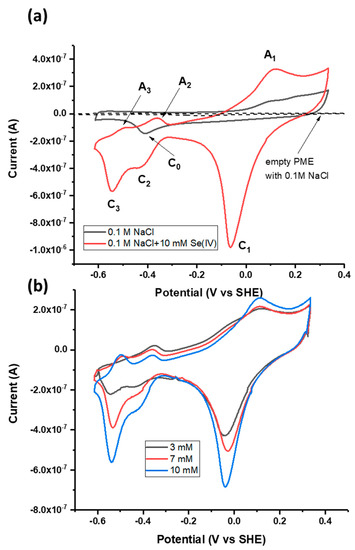
Figure 3.
(a) Cyclic voltammograms of the powder microelectrode (PME) with no galena powder packed in the cavity scanned in 0.1 M NaCl pH 4.6, the PME with galena powder packed in the cavity scanned in 0.1 M NaCl pH 4.6, and the PME packed with galena powder scanned in 0.1 M NaCl + 10 mM Na2SeO3 pH 4.6. (b) Cyclic voltammograms of galena in 0.1 M NaCl pH 4.6 with varying concentrations of Se(IV) (see inset). For both (a) and (b), scans were initiated from the OCP in the positive direction at 50 mV/s. The final (20th) cycle of each scan is displayed.
CV performed in the scan range of −0.65 to +0.3 V using the galena PME and Se(IV) (added as Na2SeO3) present in solution exhibited three anodic peaks and three cathodic peaks denoted A1 to A3 and C1 to C3 (Figure 3a). The observation of peaks A1 to A3 and C1 to C3 in the scan with Se(IV) present in solution and their clear distinction from the features of the scan performed in the absence of Se attributes these peaks to Se redox reactions. The contribution of Pt to the total electrochemical signal can be considered minute because the galena component of the PME produces electrical signals of current one order of magnitude greater than that of the empty PME (Figure 3a).
Association of these CV peaks with Se redox reactions was also substantiated by the fact that the reduction peaks C1, C2, and C3 increase in current magnitude with increasing Se(IV) concentration (Figure 3b). While the peak current of A1 increased with Se concentration, anodic peaks A2 and A3 showed negative current with varying Se concentration but do not necessarily increase with the concentration. One possible reason is that Se reduction is dominant over negative potential ranges and decreases overall current even upon anodic scans below 0.0 V. Upon the measurement using the galena PME, the intersection between the anodic scans with and without Se(IV) occurs at about 0 to −0.1 V (Figure 3a,b) where there is transition between reductive and oxidative processes involving Se(IV) and its reduced products. Similar observations on anodic scans leading to negative current are also reported from studies regarding Se reduction measured using Au electrodes [19,51].
It should be noted that peaks A2, A3, C2 and C3 were not attributed to the hydrogen (H) evolution on Pt (or galena), i.e., the redox transformation between H and H+ and their adsorption/desorption. Typical CV patterns of this one-electron transfer process showed near chemical reversibility (i.e., comparable areas of cathodic and anodic peaks) and separation of the corresponding peaks is as small as 59 mV [52] which was not the case for the current-potential region involving A2, A3, C2 and C3. Furthermore while these reactions are commonly observed from measurements in strong acid solutions, the voltammetric signature from H evolution is unlikely to contribute to an observable degree under the current experimental conditions where the concentration of Se is higher than that of protons by a factor of two or three. Given the same pH of 4.6 in each case, any H evolution occurring in scans performed in the presence of Se would have been observed in those in the absence of Se.
While galena can, as a redox catalyst, influence the kinetics of the reaction, the formation of bonding of different Se species with the galena surface can lead to a variation on the peak position [46]. We address such energetic contribution of adsorption using quantum-mechanical calculations (Section 3.3). It is important to note that in this electrochemical system, the ultimate source and sink for electrons is the electrode, i.e., the potentiostat with electrons being transferred by the platinum wire and galena powder, and not, e.g., the S 3p orbitals of galena.
3.2. Peak Pairing and Assignment to Se Redox Transformations
Prior to peak quantification and reaction assignment, it was necessary to pair oxidation and reduction peaks to specific Se redox transformation mediated by galena. To aid pairing the Se-related peaks, linear sweep voltammetry (LSV) was used to limit scans to a single direction rather than including a reverse scan such as with CV. This allowed us to examine individual oxidation and reduction processes observed in narrow scan ranges.
Successive linear sweeps were performed in the negative-going (i.e., cathodic) and positive-going (anodic) direction over a potential range from +300 to −100 mV. In separate scans on fresh galena powder, growth of C1 was observed with successive cathodic sweeps (Figure 4a) while no noticeable feature was observed with anodic sweeps performed over the same potential range. However, the growth of A1 is observed with anodic sweeps scanned after successive cathodic sweeps producing C1 are performed on the same galena powder (Figure 4b). These results indicate that A1 involved the reversible reaction of C1 constituting a redox couple (denoted with C1/A1). The peak potentials of A1/C1 were observed at +120/−60 mV (Figure 3a). Figure 5 shows cathodic linear sweeps over a potential range from −265 mV to −615 mV. The measurements exhibited growth of one broad, large peak with the first few sweeps which evolved into peak C2 and C3 in later sweeps. Peak A2 and A3 were assigned to the reverse reaction of C2 and C3 constituting redox couples C2/A2 and C3/A3 due to their later emergences upon anodic scans with progressive CV cycling. The peak potentials of A2/C2 are observed at −360/−440 mV, and of A3/C3 at −500/−540 mV (Figure 3a).
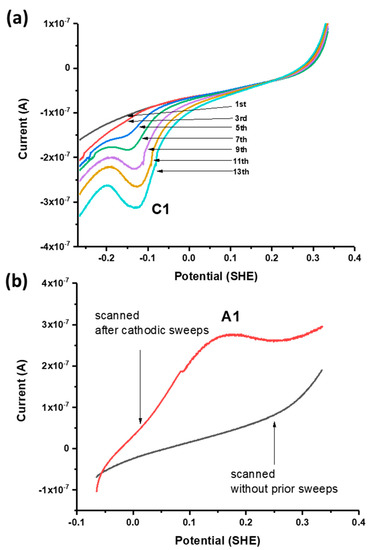
Figure 4.
(a) Successive negative-going linear sweeps of galena in 10 mM Na2SeO3 + 0.1 M NaCl pH 4.6 at 50 mV/s. (b) Positive-going linear sweeps of separate galena powders in 10 mM Na2SeO3 + 0.1 M NaCl pH 4.6 at 50 mV/s performed without prior voltammetry (black) and after the cathodic scans shown in (a) were performed (red) whereupon A1 emerges. The emergence of A1 only after C1 is produced indicates that it is the reverse reaction of C1.
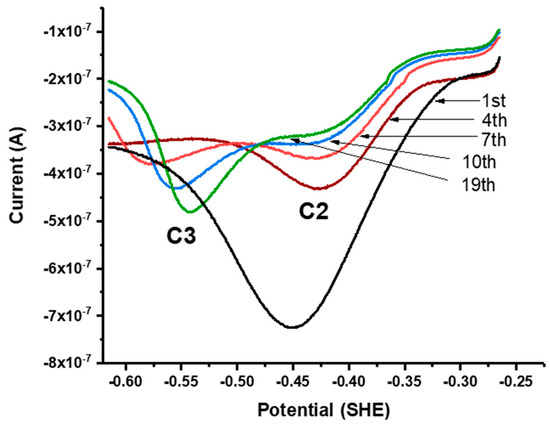
Figure 5.
Successive linear sweeps of galena in 10 mM Na2SeO3 + 0.1 M NaCl pH 4.6. Sweeps were scanned from −265 mV to −615 mV at 50 mV/s. The measurements exhibit growth of one broad, large peak with the first few sweeps, which evolves into peak C2 and C3 in later sweeps.
Given peak potentials of a redox couple, Emid can be defined allowing a first-order approximation of a reduction potential. For peak assignment, the observed Emid is compared with the equilibrium reduction potentials of Se redox pairs. The Nernst equation defines the deviation of the equilibrium reduction potential from the standard reduction potential as a function of pH and the concentrations of the reductants and the oxidants:
where E is the equilibrium reduction potential, E0 is the standard reduction potential, n is the number of electrons transferred, dictated by the reaction stoichiometry, and this ratio is multiplied by the log of the reaction quotient.
The Nernst equations and the standard reduction potentials of Se redox pairs relevant to the experimental conditions of this study are summarized in Table 1. In Table 2, the equilibrium reduction potentials are estimated for a solution pH of 4.6 and the presumed concentrations of relevant selenium species. Since HSeO3− is the most dominant Se(IV) species at pH 4.6 (pka1 = 2.7 and pka2 = 8 for H2SeO3), it is reasonable to assume that the initial Se(IV) concentration (0.01 M) is approximately equal to [HSeO3−]. In the bulk solution (50 mL), the concentration of other Se species would be minute because they can only be produced from the Se(IV) redox reactions occurring by means of the galena PME. One constraint on the Se(−II) species is considered that the ratio of [HSe−] to [H2Se] is 5 at pH 4.6 (pka1 = 3.9 for H2Se). The equilibrium reduction potentials in Table 2 are calculated where [HSe−] = 5 × 10⁻⁶ M, [H2Se] = 10−6 M, and [SeO42−] = 10−6 M.

Table 1.
Redox potential equations and standard redox potentials for possible redox reactions of Se(IV) as a function of pH and the concentrations of oxidants and reductants.
Table 2.
Equilibrium redox potentials of Se redox transformation pairs at pH 4.5 and those values corrected for the adsorption contributions to the redox potentials.
For the C1/A1 couple, Emid was defined at +0.03 V and the best agreement with the equilibrium reduction potentials (Table 2) is found for the redox pairs HSeO3−/H2Se and HSeO3−/HSe−. The Emid values of C2/A2 and C3/A3 were defined at −0.4 and −0.52 V which were close to the equilibrium potentials of Se(0)/H2Se and Se(0)/HSe−. Further specification was limited because the equilibrium potentials of these two redox pairs estimated at pH 4.6 are nearly the same (≈ −0.49 V). Quantification on peak shifts caused by the different binding energies of Se species with the galena surface aids in assigning these peaks to specific redox pairs (Section 3.3).
3.3. Adsorption of Se Species on Galena
Adsorption is needed for a dissolved species to remain in contact with a solid surface and occurs before electrons are transferred between the electrode surface and the chemical species. Interaction between a mineral surface and a chemical species can be an important parameter in quantifying the thermodynamics of electron transfer mediated by a mineral surface in that it can cause deviation from theoretical equilibrium redox potentials within a few hundred mV [46,54,55,56]. Here, energetic contributions of adsorption to Se redox thermodynamics were calculated using the computational code, Gaussian 09. Comparison between the observed midpoint potential and the equilibrium redox potential (Section 3.2) was further explored and it was examined whether consistency between the observed and the theoretical reduction potentials is improved with correction for the adsorption contributions to the reduction potentials.
The adsorbate structures shown in Figure 6 are the most likely reaction products according to the calculations presented in this study. The bidentate mode of HSeO3− on galena includes the oxygen bond with surface Pb (Pb–O = 2.4 Å) and attractive interaction between H and surface S (Figure 6a,b). The ∆Gads of HSeO3−, following a frequency analysis, on galena was calculated to be −69 kJ/mol. Interaction of HSe− with the galena surface was in a monodentate mode (Figure 6c). The calculated Se–Pb distance is 3.0 Å and the ∆Gads is −30 kJ/mol. H2Se weakly interacts with the galena surface (Se–Pb of 3.5 Å) which is indicated by the positive ∆Gads (= +29 kJ/mol) (Figure 6d). This also indicates that reduction of Se(IV) to H2Se, especially at pH values more acidic than the experimental one of 4.6, would lead to the release of H2Se into solution while HSe- is calculated to stay adsorbed to the galena surface.
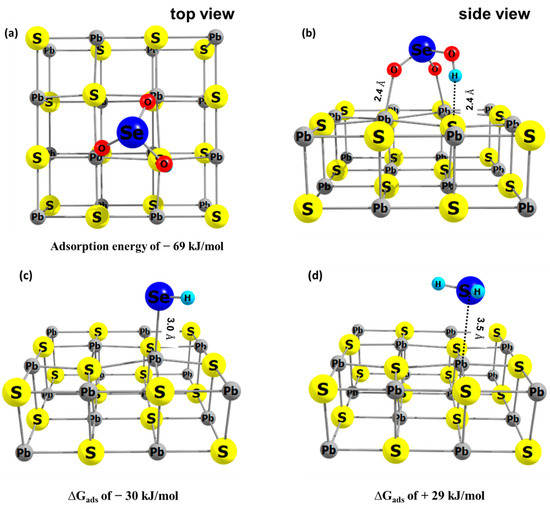
Figure 6.
The energy optimized geometry of adsorbate on galana (100) surface, (a,b) HSeO3− (c) HSe− and (d) H2Se, with their calculated adsorption Gibbs free energies. In this study, the redox transformation of Se is mediated by galena and therefore adsorption of the Se species is an important contribution to the redox transformation.
The energetic contribution of adsorption on galena to redox thermodynamics was evaluated from calculating the difference in Gibbs free energy between the redox half reaction for dissolved species (Equation (4)) and one for adsorbed species (Equation (5)). This difference (Equation (6)) was equivalent to the reaction involving the oxidant adsorbed on galena (PbS≡Ox) and the dissolved reductant (Red) as reactants and the adsorbed galena (PbS≡Red) and the dissolved oxidant (Ox) as products (Figure 7). In turn, this reaction equation corresponds to the subtraction of the oxidant adsorption equation (Equation (7)) from the reductant adsorption equation (Equation (8)).
Ox + ne− ↔ Red
PbS≡Ox + ne− ↔ PbS≡Red
PbS≡Ox + Red ↔ PbS≡Red + Ox
PbS + Ox ↔ PbS≡Ox
PbS + Red ↔ PbS≡Red
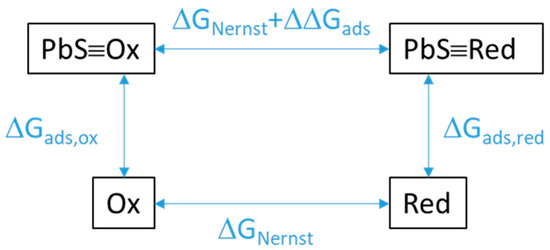
Figure 7.
Schematic of the energy shift of a redox reaction as a result of the redox species being adsorbed (PbS≡Ox, Pbs≡Red) rather than being in solution (Ox, Red). ΔΔGads is the difference in the Gibbs free energies of adsorption of the oxidized vs. reduced species. ΔGNernst is the expected energy of reaction from the Nernst equation by multiplying the Nernst potential E by −nF.
The change in redox potential by adsorption (∆V) is related to the difference in the adsorption Gibbs free energies as described in Figure 7 and Equation (9):
Overall, the computed contribution of adsorption to redox thermodynamics ranges from −0.05 to −0.18 V which indicates the shift of the redox potential position to more negative values than the theoretically derived equilibrium redox potentials (Table 2). The midpoint potentials of Se-attributed redox transformations measured from galena CVs (Section 3.1 and Section 3.2) are in good agreement with reduction potentials corrected for the adsorption contributions and support peak assignment: the observed midpoint potential of C1/A1 (= 0.03 V) was very close to the corrected redox potentials for the redox couples of HSeO3−/H2Se (−0.01 V) and HSeO3−/HSe− (0.05 V); the midpoint potential of C2/A2 (−0.40 V) is comparable to the corrected reduction potential of Se(0)/HSe− (−0.34 V) while that of C3/A3 (−0.52 V) is close to the corrected reduction potential of Se(0)/H2Se (−0.64 V).
To sum up, based on evaluation of equilibrium reduction potentials (Section 3.2) and the adsorption contribution to the selenium redox thermodynamics on galena (Section 3.3), the observed CV peaks were assigned to individual redox pairs and the intimate growth of peak C2 and C3 observed during the linear cathodic scans (Figure 5) was attributed to the reduction of Se(0) to Se(−II) in association with selenide speciation.
3.4. XPS Measurements
XPS spectra were obtained to identify the products of Se redox transformation mediated by galena. For this purpose, bulk galena electrodes were polarized for 30 min in solution containing 10 mM Na2SeO3 + 0.1 M NaCl adjusted to pH 4.6. The potential was held at two potential values −0.125 V and −0.49 V corresponding to approximate peak positions of C1 and C2 observed with cyclic voltammetry.
Core scans for the Se 3d peak are presented in Figure 8. Galena polarized at −0.125 V yields peaks that indicate the presence of Se(IV) and Se(0) with 3d 5/2 spin−orbit split peaks located at 58.4 and 55.0 eV, respectively (Figure 8a and Table 3). The peak observed at 55.0 eV was attributed to Se(0) which is in agreement with the standard value of 55.2 eV and within the range of 54.8 to 56.3 eV [32,57] commonly reported for Se(0). The proportion of Se oxidation states are 51%/49% for Se(0)/Se(IV). From the galena electrode polarized at −0.49 V, the Se core scans reveal three peaks attributed to Se(IV) at 58.3 eV, Se(0) at 54.4 eV and Se(−II) species at 52.8 eV (Figure 8b and Table 3). Formation of a red film on the galena electrode was macroscopically observable after it was held at a potential of −0.49 V for 30 min which is evidence of Se(0) as reported from previous studies [30,58,59]. The peak at 52.8 eV indicates the formation of Se(−II) species such as HSe− and H2Se in good agreement with the peak assignment of peak C2. This Se 3d 5/2 peak is within a range of binding energies typically reported for Se(−II) compounds [32]. The relative proportions of Se oxidation states are 29%/32%/39% for Se(−II)/Se(0)/Se(IV), respectively.
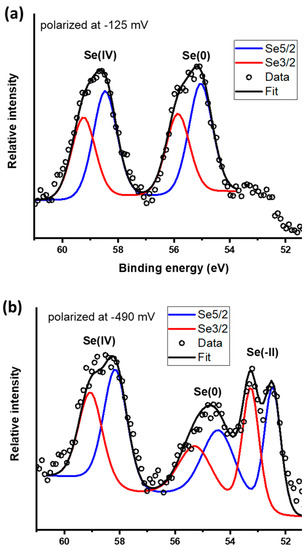
Figure 8.
X-ray photoelectron spectroscopy (XPS) core scans for Se 3d spectra on the galena electrodes potential held at (a) −125 mV and (b) −490 mV.
Table 3.
Se 3d spectra of the galena electrodes polarized for 30 minutes at −125, and −490 mV. Relative percentages of species with different Se oxidation states for the redox conditions. The reaction solution was prepared using 10 mM Na2SeO3 and 0.1 M NaCl at pH 4.6.
4. Discussion
4.1. Possible Forms and Behavior of Products of Se Reduction Mediated by Galena
The electrochemical and spectroscopic data presented in this study reveal the formation of Se(0) at potentials below + 30 mV (i.e., the mid potential of C1/A1) and of protonated Se(−II) below −400 mV. Here, possible forms and behavior of Se(0) and Se(−II) at the galena−solution interface are discussed.
The binding energies of Se(0) shown on the XPS spectra of the galena surfaces polarized at −0.125 V and −490 V deviate by ~0.6 eV which indicates that Se(0) produced at these negative potentials are likely to be in different forms. Se(0) occurs in various forms including red monoclinic Se(0) and grey (or black) trigonal Se(0) [58,59,60]. The Se0 spin-orbit splits for the −0.125 V sample are very close to those for grey Se(0) (Table 3). Additionally, a red film characteristic of Se(0) formation was observed on galena bulk electrodes after a potential hold at −490 mV for 30 minutes (Section 3.4). These observations suggest possible reduction potential-dependent regions of stability for a particular type of Se(0) in agreement with Espinosa et al. [61] reporting red Se0 formation on carbon paste electrodes only if potentials were scanned below −0.2 V. This possibility is also accordant with X-ray absorption spectroscopic (XAS) data reported by Scheinost and Chalet [62] reporting grey and red Se(0) as products of Se(IV) reduction in the presence of Fe-bearing minerals.
A red film was observed on galena bulk electrodes after a potential hold at −490 mV for 30 minutes (Section 3.4) which is characteristic of the Se(0) formation. A number of electrochemical studies have attributed the formation of Se(0) to the comproportionation between Se(IV) and Se(−II) species [25,28,61]. When Se(−II) species (HSe− and H2Se) are produced at C1 to C3, subsequent comproportionation reactions can proceed in Se(IV)-containing solutions (Equations (10) and (11)):
HSeO3− + 2HSe− + 3H+ → 3Se0 + 3H2O
HSeO3− + 2H2Se + H+ → 3Se0 + 3H2O
By comparing the charge (in Coulombs) passed by the reverse peak (CR) to the forward peak (CF) of a redox couple, a charge ratio is obtained where CR/CF = 1 for an ideal, Nernstian reaction. Electron charges of a given peak are obtained by integrating the current of a peak over the applied voltage and dividing the result by the scan rate. As of the final cycle of Figure 3a, the C1/A1, C2/A2, and C3/A3 couples have charge ratios of ~0.27, ~0.44, ~0.14, respectively. The CR/CF < 1 for all three couples indicates that the anodic scanning is capable of reoxidizing only a limited amount of the cathodic product of their respective reactions. One possible explanation on the limited chemical reversibility is that oxidation of Se(0) produced from the reduction processes mediated by galena is slow and irreversible. Another possibility is the loss of a fraction of cathodically produced H2Se to the solution (and maybe gas) phase which has been reported in a number of studies employing CV coupled with electrochemical quartz crystal microbalance [20,22,24,25].
The stability of Se(−II) species increases at more negative potentials where Se(0) is reduced further into HSe− and H2Se as inferred from the peak assignment of peak C2 and C3 (Section 3.2 and Section 3.3). From voltammetry, a fraction of H2Se produced via C3 diffuses away from the reacting volume around the electrode surface and the rest is retained on the surface as indicated by the low CF/CR of ~0.14 and the positive ∆Gads. Retention of otherwise soluble H2Se would be due to the presence of red Se(0) due to its capability of strongly adsorbing Se(−II) species [59].
4.2. Geochemical Implications
In this study, electrochemical measurements are used to evaluate possible Se redox processes mediated by galena under reducing (Eh +0.3 to −0.6 V) and acidic (mainly, a pH of 4.6) conditions. HSeO3− is the dominant Se species with an oxidation state of +IV and is found redox-active under these conditions. The cyclic voltammetry measurements combined with XPS analysis reveal the potential-dependent reduction of Se(IV) to Se(0) and further to a mixed phase of Se(0) and Se(−II) at the galena surface where Se(0) is the main product of Se reduction under intermediate reducing conditions (Eh = −125 mV) while the formation of HSe− and H2Se results from reduction of Se(0) at highly reducing conditions (−440 to −490 mV).
Equilibrium redox potentials (and potentials adjusted for adsorption contributions) and limited chemical reversibility of redox pairs Se0/HSe− and Se0/H2Se observed with cyclic voltammetry indicate that protonated Se(−II) species would be the dominant products of Se(IV) reduction. Since Pb(II) is generated from mineral dissolution in environmental systems involving galena, the formation of Pb(II)/Se(−II) solids such as clausthalite (PbSe) is likely to occur in such settings where the adsorbed/dissolved Se(−II) species are produced from Se reduction which subsequently react with Pb(II).
The abiotic reduction of redox-sensitive elements can be mediated by a semiconducting mineral surface when the reduction is coupled with the oxidation of other species on the surface [37,63]. While in the electrochemical part of this study, electron transfer is triggered by applying an electrical potential, the mineral surface oxidation or the adsorption of reductants from solution to the surface plays an equivalent role in natural systems [64]. In a system where acidic dissolution of galena occurs in the presence of dissolved Se(IV), adsorbed or structural S(−II) species such as H2S and HS− may be possible sources for electrons being transferred through the galena surface to Se(IV). Similar mechanisms have been suggested from previous studies where reductants are sourced from the main constituent ions of the mineral catalyst [62,65].
5. Conclusions
One important finding from our computational modeling for Se species adsorbed on galena is that Se redox thermodynamics is influenced by interaction with the galena surface, revealing shifts in observed redox potentials relative to equilibrium redox potentials and our modeling evaluation suggests that this is caused by the contribution of adsorption Gibbs free energies. Specifically, the redox potential is calculated to shift towards more negative or positive values by 70 to 180 mV, depending on the ΔG changes of adsorption of different Se redox reactions mediated via the galena surface (Table 2).
Our experimental and computational results contribute toward a fundamental understanding of the catalysis of redox transformations occurring at the mineral surface and is critical in evaluating Se fate and mobility in the environments. The computational approaches of this study have broad applications and can be applied to future studies that aim at accounting for energetic variations caused by interaction of chemical species with mineral surfaces, for instance, upon electrochemical and spectroscopic measurements.
Author Contributions
P.C. was primarily responsible for the electrochemical measurements with help from K.Y. and Y.K. XPS measurements were the responsibility of P.C., Y.K., and M.C.M., Y.K. and U.B. performed the computational work and U.B. had an advisory function over the entire project.
Funding
This research was funded by the U.S. National Science Foundation, Division of Earth Sciences, Grant No. EAR-1223976. Y.K. acknowledges support from Samsung Scholarship.
Conflicts of Interest
The authors declare no conflict of interest.
References
- Dubrovsky, N.M.; Neil, J.M.; Fujii, R.; Oremland, R.; Hollibaugh, J. Influence of Redox potential on selenium distribution in ground-water, Mendota, western San-Joaquin Valley, California. US Geol. Surv. Open File Rep. 1990, 90138, 24. [Google Scholar]
- Wu, L. Review of 15 years of research on ecotoxicology and remediation of land contaminated by agricultural drainage sediment rich in selenium. Ecotoxicol. Environ. Saf. 2004, 57, 257–269. [Google Scholar] [CrossRef]
- Naftz, D.L.; Rice, J.A. Geochemical processes controlling selenium in ground water after mining, Powder River Basin, Wyoming, USA. Appl. Geochem. 1989, 4, 565–575. [Google Scholar] [CrossRef]
- Clark, S.K.; Johnson, T.M. Selenium stable isotope investigation into selenium biogeochemical cycling in a lacustrine environment: Sweitzer Lake, Colorado. J. Environ. Qual. 2010, 39, 2200–2210. [Google Scholar] [CrossRef] [PubMed]
- Yudovich, Y.E.; Ketris, M. Selenium in coal: A review. Int. J. Coal Geol. 2006, 67, 112–126. [Google Scholar] [CrossRef]
- Martínez-Torrents, A.; Giménez, J.; Martínez-Lladó, X.; de Pablo, J.; Casas, I. Incorporation of selenium (IV) and selenium (VI) on uranyl peroxide. J. Radioanal. Nucl. Chem. 2015, 303, 153–159. [Google Scholar] [CrossRef]
- Bott, A.W. Electrochemistry of semiconductors. Curr. Sep. 1998, 17, 87–92. [Google Scholar]
- Rosso, K.M.; Becker, U. Proximity effects on semiconducting mineral surfaces II: Distance dependence of indirect interactions. Geochim. Cosmochim. Acta 2003, 67, 941–953. [Google Scholar] [CrossRef]
- Arumugam, K.; Renock, D.; Becker, U. The basis for reevaluating the reactivity of pyrite surfaces: Spin states and crystal field d- orbital splitting energies of bulk, terrace, edge, and corner Fe( II) ions. PCCP 2019, 21, 6415–6431. [Google Scholar] [CrossRef]
- Renock, D.; Becker, U. A first principles study of the oxidation energetics and kinetics of realgar. Geochim. Cosmochim. Acta 2010, 74, 4266–4284. [Google Scholar] [CrossRef]
- Becker, U.; Rosso, K.M.; Hochella, M.F. The proximity effect on semiconducting mineral surfaces: A new aspect of mineral surface reactivity and surface complexation theory? Geochim. Cosmochim. Acta 2001, 65, 2641–2649. [Google Scholar] [CrossRef]
- Skomurski, F.N.; Shuller, L.C.; Ewing, R.C.; Becker, U. Corrosion of UO2 and ThO2: A quantum-mechanical investigation. J. Nucl. Mater. 2008, 375, 290–310. [Google Scholar] [CrossRef]
- Taylor, S.D.; Becker, U.; Rosso, K.M. Electron Transfer Pathways Facilitating U(VI) Reduction by Fe(II) on Al- vs Fe-Oxides. J. Phys. Chem. C 2017, 121, 19887–19903. [Google Scholar] [CrossRef]
- Taylor, S.D.; Marcano, M.C.; Rosso, K.M.; Becker, U. An experimental and ab initio study on the abiotic reduction of uranyl by ferrous iron. Geochim. Cosmochim. Acta 2015, 156, 154–172. [Google Scholar] [CrossRef][Green Version]
- Grundl, T.J.; Haderlein, S.; Nurmi, J.T.; Tratnyek, P.G. Introduction to Aquatic Redox Chemistry. In Aquatic Redox Chemistry; Tratnyek, P.G., Grundl, T.J., Haderlein, S.B., Eds.; American Chemical Society: Columbus, OH, USA, 2011; Volume 1071, pp. 1–632. [Google Scholar]
- Gorski, C.A.; Nurmi, J.T.; Tratnyek, P.G.; Hofstetter, T.B.; Scherer, M.M. Redox behavior of magnetite: Implications for contaminant reduction. Environ. Sci. Technol. 2009, 44, 55–60. [Google Scholar] [CrossRef]
- Pridmore, D.; Shuey, R. The electrical resistivity of galena, pyrite, and chalcopyrite. Am. Mineral. 1976, 61, 248–259. [Google Scholar]
- Renock, D.; Becker, U. A first principles study of coupled substitution in galena. Ore Geol. Rev. 2011, 42, 71–83. [Google Scholar] [CrossRef]
- Bougouma, M.; Van Elewyck, A.; Steichen, M.; Buess-Herman, C.; Doneux, T. Selenium electrochemistry in choline chloride–urea deep eutectic electrolyte. J. Solid State Electrochem. 2013, 17, 527–536. [Google Scholar] [CrossRef]
- Cabral, M.F.; Pedrosa, V.A.; Machado, S.A.S. Deposition of selenium thin layers on gold surfaces from sulphuric acid media: Studies using electrochemical quartz crystal microbalance, cyclic voltammetry and AFM. Electrochim. Acta 2010, 55, 1184–1192. [Google Scholar] [CrossRef]
- Ivandini, T.A.; Einaga, Y. Electrochemical detection of selenium (IV) and (VI) at gold-modified diamond electrodes. Electrocatalysis 2013, 4, 367–374. [Google Scholar] [CrossRef]
- Kowalik, R. Microgravimetric studies of selenium electrodeposition onto different substrates. Arch. Metall. Mater. 2014, 59, 871–877. [Google Scholar] [CrossRef]
- Maranowski, B.; Strawski, M.; Osowiecki, W.; Szklarczyk, M. Study of selenium electrodeposition at gold electrode by voltammetric and rotating disc electrode techniques. J. Electroanal. Chem. 2015, 752, 54–59. [Google Scholar] [CrossRef]
- Solaliendres, M.; Manzoli, A.; Salazar-Banda, G.; Eguiluz, K.; Tanimoto, S.; Machado, S. The processes involved in the Se electrodeposition and dissolution on Au electrode: The H2Se formation. J. Solid State Electrochem. 2008, 12, 679–686. [Google Scholar] [CrossRef]
- Wei, C.; Myung, N.; Rajeshwar, K. A combined voltammetry and electrochemical quartz crystal microgravimetry study of the reduction of aqueous Se (IV) at gold. J. Electroanal. Chem. 1994, 375, 109–115. [Google Scholar] [CrossRef]
- Feliu, J.; Gómez, R.; Llorca, M.; Aldaz, A. Electrochemical behavior of irreversibly adsorbed selenium dosed from solution on Pt (h, k, l) single crystal electrodes in sulphuric and perchloric acid media. Surf. Sci. 1993, 289, 152–162. [Google Scholar] [CrossRef]
- Santos, M.C.; Machado, S.A. Microgravimetric, rotating ring-disc and voltammetric studies of the underpotential deposition of selenium on polycrystalline platinum electrodes. J. Electroanal. Chem. 2004, 567, 203–210. [Google Scholar] [CrossRef]
- Kazacos, M.S.; Miller, B. Studies in selenious acid reduction and CdSe film deposition. J. Electrochem. Soc. 1980, 127, 869–873. [Google Scholar] [CrossRef]
- Curti, E.; Aimoz, L.; Kitamura, A. Selenium uptake onto natural pyrite. J. Radioanal. Nucl. Chem. 2013, 295, 1655–1665. [Google Scholar] [CrossRef]
- Han, D.S.; Batchelor, B.; Abdel-Wahab, A. Sorption of selenium (IV) and selenium (VI) onto synthetic pyrite (FeS2): Spectroscopic and microscopic analyses. J. Colloid Interface Sci. 2012, 368, 496–504. [Google Scholar] [CrossRef]
- Martinez, M.; Gimenez, J.; De Pablo, J.; Rovira, M.; Duro, L. Sorption of selenium (IV) and selenium (VI) onto magnetite. Appl. Surf. Sci. 2006, 252, 3767–3773. [Google Scholar] [CrossRef]
- Naveau, A.; Monteil-Rivera, F.; Guillon, E.; Dumonceau, J. Interactions of aqueous selenium (− II) and (IV) with metallic sulfide surfaces. Environ. Sci. Technol. 2007, 41, 5376–5382. [Google Scholar] [CrossRef] [PubMed]
- Kim, B.S.; Hayes, R.; Prestidge, C.; Ralston, J.; Smart, R.S.C. Scanning tunnelling microscopy studies of galena: The mechanism of oxidation in air. Appl. Surf. Sci. 1994, 78, 385–397. [Google Scholar] [CrossRef]
- Laajalehto, K.; Kartio, I.; Heinonen, M.; Laiho, T. Temperature Controled Photoelectron Spectroscopic Investigation of Volatile Species on PbS (100) Surface. Jpn. J. Appl. Phys. 1999, 38, 265. [Google Scholar] [CrossRef]
- Wittstock, G.; Kartio, I.; Hirsch, D.; Kunze, S.; Szargan, R. Oxidation of galena in acetate buffer investigated by atomic force microscopy and photoelectron spectroscopy. Langmuir 1996, 12, 5709–5721. [Google Scholar] [CrossRef]
- Cha, C.S.; Li, C.M.; Yang, H.; Liu, P. Powder microelectrodes. J. Electroanal. Chem. 1994, 368, 47–54. [Google Scholar] [CrossRef]
- Renock, D.; Mueller, M.; Yuan, K.; Ewing, R.C.; Becker, U. The energetics and kinetics of uranyl reduction on pyrite, hematite, and magnetite surfaces: A powder microelectrode study. Geochim. Cosmochim. Acta 2013, 118, 56–71. [Google Scholar] [CrossRef]
- Moulder, J.F. Handbook of X-ray Photoelectron Spectroscopy: A Reference Book of Standard Spectra for Identification and Interpretation of XPS Data; Physical Electronics Division, Perkin-Elmer Corporation: Waltham, MA, USA, 1992. [Google Scholar]
- Becke, A.D. Density-functional thermochemistry. III. The role of exact exchange. J. Chem. Phys. 1993, 98, 5648–5652. [Google Scholar] [CrossRef]
- Lee, C.; Yang, W.; Parr, R.G. Development of the Colle-Salvetti correlation-energy formula into a functional of the electron density. Phys. Rev. B 1988, 37, 785. [Google Scholar] [CrossRef]
- Dunning Jr, T.H. Gaussian basis sets for use in correlated molecular calculations. I. The atoms boron through neon and hydrogen. J. Chem. Phys. 1989, 90, 1007–1023. [Google Scholar] [CrossRef]
- Dunning, T.H.; Hay, P.J. Gaussian basis sets for molecular calculations. In Methods of Electronic Structure Theory; Springer: Berlin/Heidelberg, Germany, 1977; pp. 1–27. [Google Scholar]
- Wadt, W.R.; Hay, P.J. Ab initio effective core potentials for molecular calculations. Potentials for main group elements Na to Bi. J. Chem. Phys. 1985, 82, 284–298. [Google Scholar] [CrossRef]
- Urban, D.R.; Wilcox, J. A theoretical study of properties and reactions involving arsenic and selenium compounds present in coal combustion flue gases. J. Phys. Chem. A 2006, 110, 5847–5852. [Google Scholar] [CrossRef] [PubMed]
- Anderson, B.; Becker, U.; Helean, K.; Ewing, R. Perrhenate and pertechnetate behavior on iron and sulfur-bearing compounds. In Proceedings of the symposium on Scientific Basis for Nuclear Waste Management XXX, Boston, MA, USA, 27 November 2006. [Google Scholar]
- Becker, U.; Hochella Jr, M.F.; Vaughan, D.J. The adsorption of gold to galena surfaces: Calculation of adsorption/reduction energies, reaction mechanisms, XPS spectra, and STM images. Geochim. Cosmochim. Acta 1997, 61, 3565–3585. [Google Scholar] [CrossRef]
- Tomasi, J.; Mennucci, B.; Cammi, R. Quantum mechanical continuum solvation models. Chem. Rev. 2005, 105, 2999–3093. [Google Scholar] [CrossRef] [PubMed]
- Gardner, J.; Woods, R. A study of the surface oxidation of galena using cyclic voltammetry. J. Electroanal. Chem. Interfacial Electrochem. 1979, 100, 447–459. [Google Scholar] [CrossRef]
- Higgins, S.; Hamers, R. Spatially-resolved electrochemistry of the lead sulfide (galena)(001) surface by electrochemical scanning tunneling microscopy. Surf. Sci. 1995, 324, 263–281. [Google Scholar] [CrossRef]
- Pritzker, M.; Yoon, R. A voltammetric study of galena immersed in acetate solution at pH 4.6. J. Appl. Electrochem. 1988, 18, 323–332. [Google Scholar] [CrossRef]
- Huang, B.M.; Lister, T.E.; Stickney, J.L. Se adlattices formed on Au (100), studies by LEED, AES, STM and electrochemistry. Surf. Sci. 1997, 392, 27–43. [Google Scholar] [CrossRef]
- Bard, A.J.; Faulkner, L.R.; Leddy, J.; Zoski, C.G. Electrochemical methods: Fundamentals and applications; Wiley: New York, NY, USA, 1980; Volume 2. [Google Scholar]
- Bouroushian, M. Electrochemistry of the Chalcogens. In Electrochemistry of Metal Chalcogenides; Springer: Berlin/Heidelberg, Germany, 2010; pp. 57–75. [Google Scholar]
- Bylaska, E.J.; Salter-Blanc, A.J.; Tratnyek, P.G. One-electron reduction potentials from chemical structure theory calculations. In Aquatic Redox Chemistry; ACS Publications: Washington, DC, USA, 2011; pp. 37–64. [Google Scholar]
- Pavitt, A.S.; Bylaska, E.J.; Tratnyek, P.G. Oxidation potentials of phenols and anilines: Correlation analysis of electrochemical and theoretical values. Environ. Sci. Process. Impacts 2017, 19, 339–349. [Google Scholar] [CrossRef]
- Salter-Blanc, A.J.; Bylaska, E.J.; Johnston, H.J.; Tratnyek, P.G. Predicting reduction rates of energetic nitroaromatic compounds using calculated one-electron reduction potentials. Environ. Sci. Technol. 2015, 49, 3778–3786. [Google Scholar] [CrossRef]
- Rupp, H.; Weser, U. X-ray photoelectron spectroscopy of some selenium containing amino acids. Bioinorg. Chem. 1975, 5, 21–32. [Google Scholar] [CrossRef]
- Chen, Y.-W.; Li, L.; D’Ulivo, A.; Belzile, N. Extraction and determination of elemental selenium in sediments—A comparative study. Anal. Chim. Acta 2006, 577, 126–133. [Google Scholar] [CrossRef] [PubMed]
- Nuttall, K.L.; Allen, F.S. Hydrogen selenide ion adsorption to colloidal elemental selenium. Inorg. Chim. Acta 1984, 89, 199–201. [Google Scholar] [CrossRef]
- Scheinost, A.C.; Kirsch, R.; Banerjee, D.; Fernandez-Martinez, A.; Zaenker, H.; Funke, H.; Charlet, L. X-ray absorption and photoelectron spectroscopy investigation of selenite reduction by FeII-bearing minerals. J. Contam. Hydrol. 2008, 102, 228–245. [Google Scholar] [CrossRef] [PubMed]
- Espinosa, A.; Tascón, M.; Vázquez, M.; Batanero, P.S. Electroanalytical study of selenium (+ IV) at a carbon paste electrode with electrolytic binder and electroactive compound incorporated. Electrochim. Acta 1992, 37, 1165–1172. [Google Scholar] [CrossRef]
- Scheinost, A.C.; Charlet, L. Selenite reduction by mackinawite, magnetite and siderite: XAS characterization of nanosized redox products. Environ. Sci. Technol. 2008, 42, 1984–1989. [Google Scholar] [CrossRef] [PubMed]
- Yuan, K.; Renock, D.; Ewing, R.C.; Becker, U. Uranium reduction on magnetite: Probing for pentavalent uranium using electrochemical methods. Geochim. Cosmochim. Acta 2015, 156, 194–206. [Google Scholar] [CrossRef]
- Kim, Y.; Yuan, K.; Ellis, B.R.; Becker, U. Redox reactions of selenium as catalyzed by magnetite: Lessons learned from using electrochemistry and spectroscopic methods. Geochim. Cosmochim. Acta 2017, 199, 304–323. [Google Scholar] [CrossRef]
- Kang, M.; Chen, F.; Wu, S.; Yang, Y.; Bruggeman, C.; Charlet, L. Effect of pH on aqueous Se (IV) reduction by pyrite. Environ. Sci. Technol. 2011, 45, 2704–2710. [Google Scholar] [CrossRef]


© 2019 by the authors. Licensee MDPI, Basel, Switzerland. This article is an open access article distributed under the terms and conditions of the Creative Commons Attribution (CC BY) license (http://creativecommons.org/licenses/by/4.0/).