Abstract
Compact geared servo drives are a common part of modern industrial automation; thus, their proper modelling is a necessary part for the application and control design. The presented paper focuses on the mathematical model of the cycloidal gearbox, which is used in the compact actuator with a permanent magnet synchronous motor. A measurement procedure to obtain the necessary gearbox parameters is presented along with its mathematical model. A new approach was used to model the stiction and nonlinear gearbox friction behaviour in all four quadrants. A simulation of the actuator with the modelled gearbox is described and its results are compared with the real system measurement. Obtained results show a high match between simulation and experimental results and confirm the correctness of the simulation model.
1. Introduction
Modern industry is based on automation and robotic technology, creating very complex systems with a large number of drives and mechanical gearings. Therefore, it is desirable to integrate more machine parts into single replaceable units. A great example is the integration of mechanical gears, an electric motor, a position sensor, and, optionally, a brake into a single electric actuator. It is nothing unusual to even combine multiple actuators into a more complex modular positioning unit or to attach more sensors to the actuator or its output shaft for some special applications.
In precise industry machines, such as industrial robots, positioning tables, CNC machines, or some medical devices, a compact solution is needed, as the mounting space is often very limited (i.e., the actuator should be placed directly into the robotic joint). Altogether, this compact solution should deliver high-output torque within a low-speed operation, high positioning accuracy, and high torsional stiffness, and should withstand high tilting torques. Three different gearbox types can be used in such a compact design to meet all of the foregoing requirements: namely, the planetary, harmonic, or cycloidal gearbox.
The planetary gearbox is a mechanically simple, reliable, and compact solution with a low manufacturing price. It is capable of delivering high torques and of withstanding tilting stress. However, compared to the harmonic and cycloidal gearboxes, and assuming a similar gear ratio, it is significantly bulkier and provides much less precision regarding the output position. Moreover, there is a higher backlash, compared to other types of precise gearboxes.
The harmonic gearbox is very simple from the construction point of view, as it consists of three main parts—a wave generator, a flexible spline, and a circular spline. It is very compact and precise; however, due to the technologically demanding manufacturing process of the flexible spline, it is more expensive than the planetary gearbox. However, the planetary gearbox requires an optional additional output bearing to withstand the tilting stress, which takes up some more mounting space and increases the overall price of the gearbox.
Compared to the previous two types of gearboxes, the mechanical construction of the cycloidal gearbox is much more complex, due to the use of an eccentric shaft with cycloidal wheels, needles, transformation elements, bearings, and other mechanical components. This mechanical complexity increases the overall price but delivers a high torsional stiffness, high positioning precision, and, due to the implemented axial and radial bearing system, the gearbox offers high load capacity, which includes axial forces and tilting moment. On the other hand, these properties are accompanied by a highly nonlinear friction characteristic. Regardless of the gearbox type, the sizing of the compact geared actuator and its parts, such as the electric motor or brake, requires knowledge of the gearbox characteristics.
The efficiency and friction curve are fundamental characteristics of the gearbox. Friction has a significant impact on the proper sizing of the electric motor and affects the control of the actuator. The implementation of friction compensation in the control structure improves the dynamics and positioning accuracy of the actuator. Moreover, friction decreases the motor torque needed for dynamic braking; thus, faster braking can be achieved. This is very important in collaborative robotics or automated guided vehicle propulsion. The model of the gearbox, considering the friction characteristic, can be used in the precise output torque control. Various approaches for the modelling of the efficiency and friction of gearboxes can be found in the following literature:
- for planetary gears: [1,2,3,4,5,6,7,8,9];
- for cycloidal gears: [10,11,12,13,14];
- for harmonic gears: [15,16].
The analytical model of a planetary gearbox is presented in [1], and the relationship between the power transmitted through the gearbox and the speed ratio has been found. The proposed method enables the evaluation of efficiency with conventional programming languages. The optimisation methods to achieve the best possible efficiency of a planetary gearbox were applied in [2], resulting in a mathematical model with eight design variables and eighteen constraint conditions. The experimental results in [3] show that the spin power loss of a planetary gearbox increased with the increasing number of planets, and that it is not viable to change the number of planets to improve the efficiency of the gearbox. The simple Simulink model was presented in [5], with the estimation of viscous friction. The finite element method was applied to investigate the level of stress and deformation of a planetary gearbox in [6]. The aim was to improve the efficiency of the drive; however, an analytical model of the gearbox was not provided.
An efficiency study of a cycloidal gearbox for robotic applications can be found in [10], where it was shown that manufacturing deficiencies increase the stress and losses in particular mechanical spots of the gearbox. An efficiency adjustment of cycloidal drives based on the varying circumference of cycloids was presented in [11]. The developed model predicted a large range of efficiencies across various torque ratios and roller constraints. The quantitative analysis of meshing power losses in the cycloidal gearbox was provided in [12], where the formula for gear meshing efficiency was proposed for a load-dependent type of losses. The improvement in the efficiency for cycloidal gearbox and its comparison with other types of gearboxes was shown in [13]. Various methods of analytical efficiency calculation, based on theoretical mathematical models of cycloidal gearboxes, and the determination of power losses and friction due to contact of gearbox-specific elements, were presented in [14]. The modelling of the harmonic drive was presented in [15]. The resulting model reproduced dynamic responses of the gearbox with acceptable precision. The parameters of the model were determined by an analysis of the harmonic-drive system; however, the model performance was highly sensitive to transmission properties. The novel approach to modelling harmonic drive transmission can be found in [16], where the proposed model captures the nonlinear stiffness and hysteresis behaviour of the harmonic gearbox.
The complexity of the high-precision gearboxes caused by the nonlinear friction characteristic makes it very difficult to analytically derive an accurate model of the gearbox. In addition, it is almost impossible to construct two gearboxes with identical parameters; thus, every high-precision gear has unique properties. Therefore, the direct measurement of the gearbox efficiency by employing a torque transducer provides the most accurate information about the efficiency and performance of a specific gear.
In this paper, efficiency and friction have been studied for a PMSM machine and cycloidal gearbox integrated into a single actuator. Compared to previous studies based on the experimental measurement-based modelling [10,16,17], the model of the gearbox was developed from the measured dataset of speeds and torques. The efficiency of the actuator is calculated for all four quadrants of the torque–speed area, and the nonlinear friction characteristic is modelled by a unique exponential function. The complex gearbox friction model, incorporating the friction characteristic and the stiction, is introduced and experimentally verified.
2. Experimental Setup for the Measurement of Actuator Characteristics
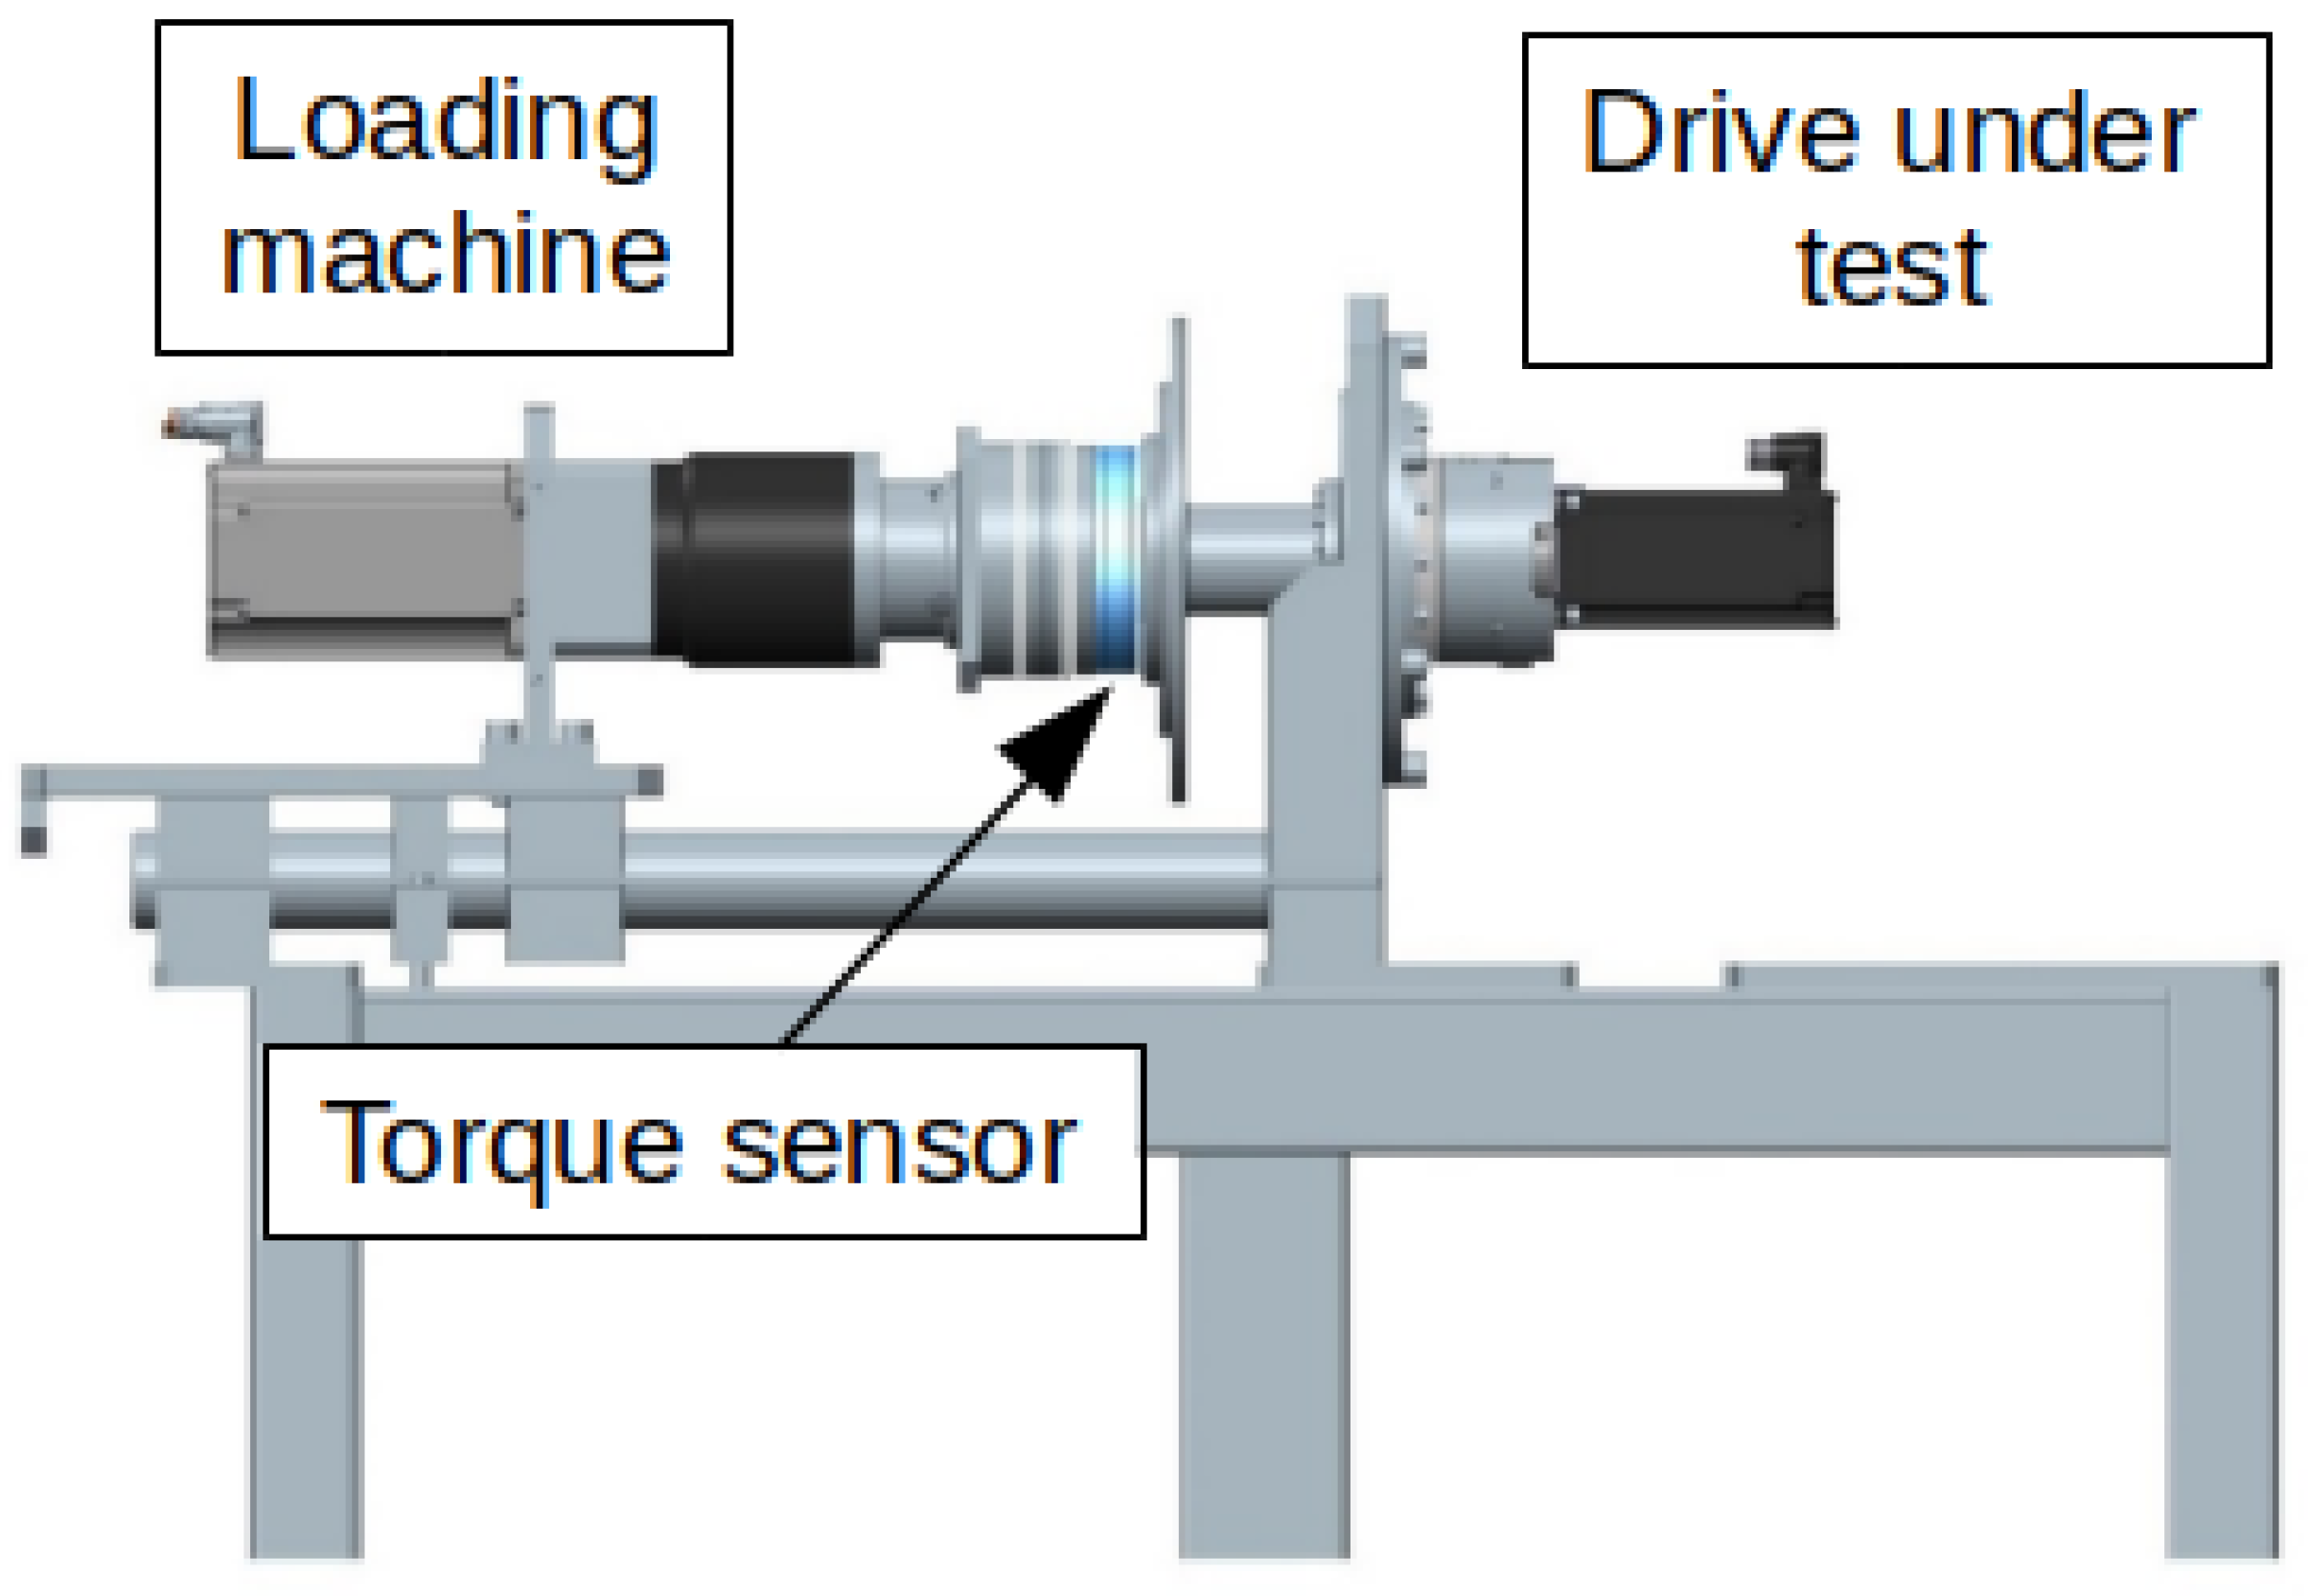
The analysed actuator with the cycloidal gear (denoted as DUT—drive under test; parameters can be found in Appendix A) was measured on a test bench as shown in Figure 1. The DUT was loaded by another electric drive (denoted as LM—loading machine). A planetary gearbox was used on the output of the LM, so the LM did not have to be unnecessarily large and the machine with the lower rated torque could be employed. This reduced the cost of the experimental setup and reduced the space requirements.
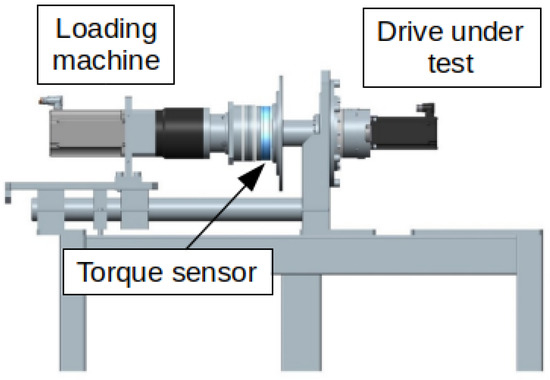
Figure 1.
Experimental setup for the measurements and tests.
Both drives, DUT and LM, were fed by industrial SIEMENS Sinamics S120 servo drives with a single SIMOTION control unit. The actual torque on the common output shaft was measured by the torque transducer Magtrol TF213. The measurement range was 500 Nm with 0.1% accuracy. The sensor was mounted directly on the DUT output flange, and on the other side, it was connected via flexible coupling to the LMs planetary gearbox output shaft. The electric output of the sensor was connected to and evaluated by the SIMOTION control system.
The motor torque cannot be measured directly, as the motor is an inseparable part of the compact actuator. Moreover, in the final application, it is not desirable to use a torque sensor either. Therefore, the motor torque was evaluated by the servo drive from the motor current. Nevertheless, considering the use of the mathematical model in the actuator control, it is advantageous to model the relationship between the actuator output torque and the motor torque, which is calculated by the motor control system. Here, it is not important to analyse the efficiency of the motor and gearbox separately; thus, the efficiency of the motor is included in the gearbox efficiency.
To sum up, the measured variables were:
- the actual motor speed of DUT;
- the actual motor torque of DUT (derived from the motor current as the internal value of the servo drive);
- the actual torque on the output shaft.
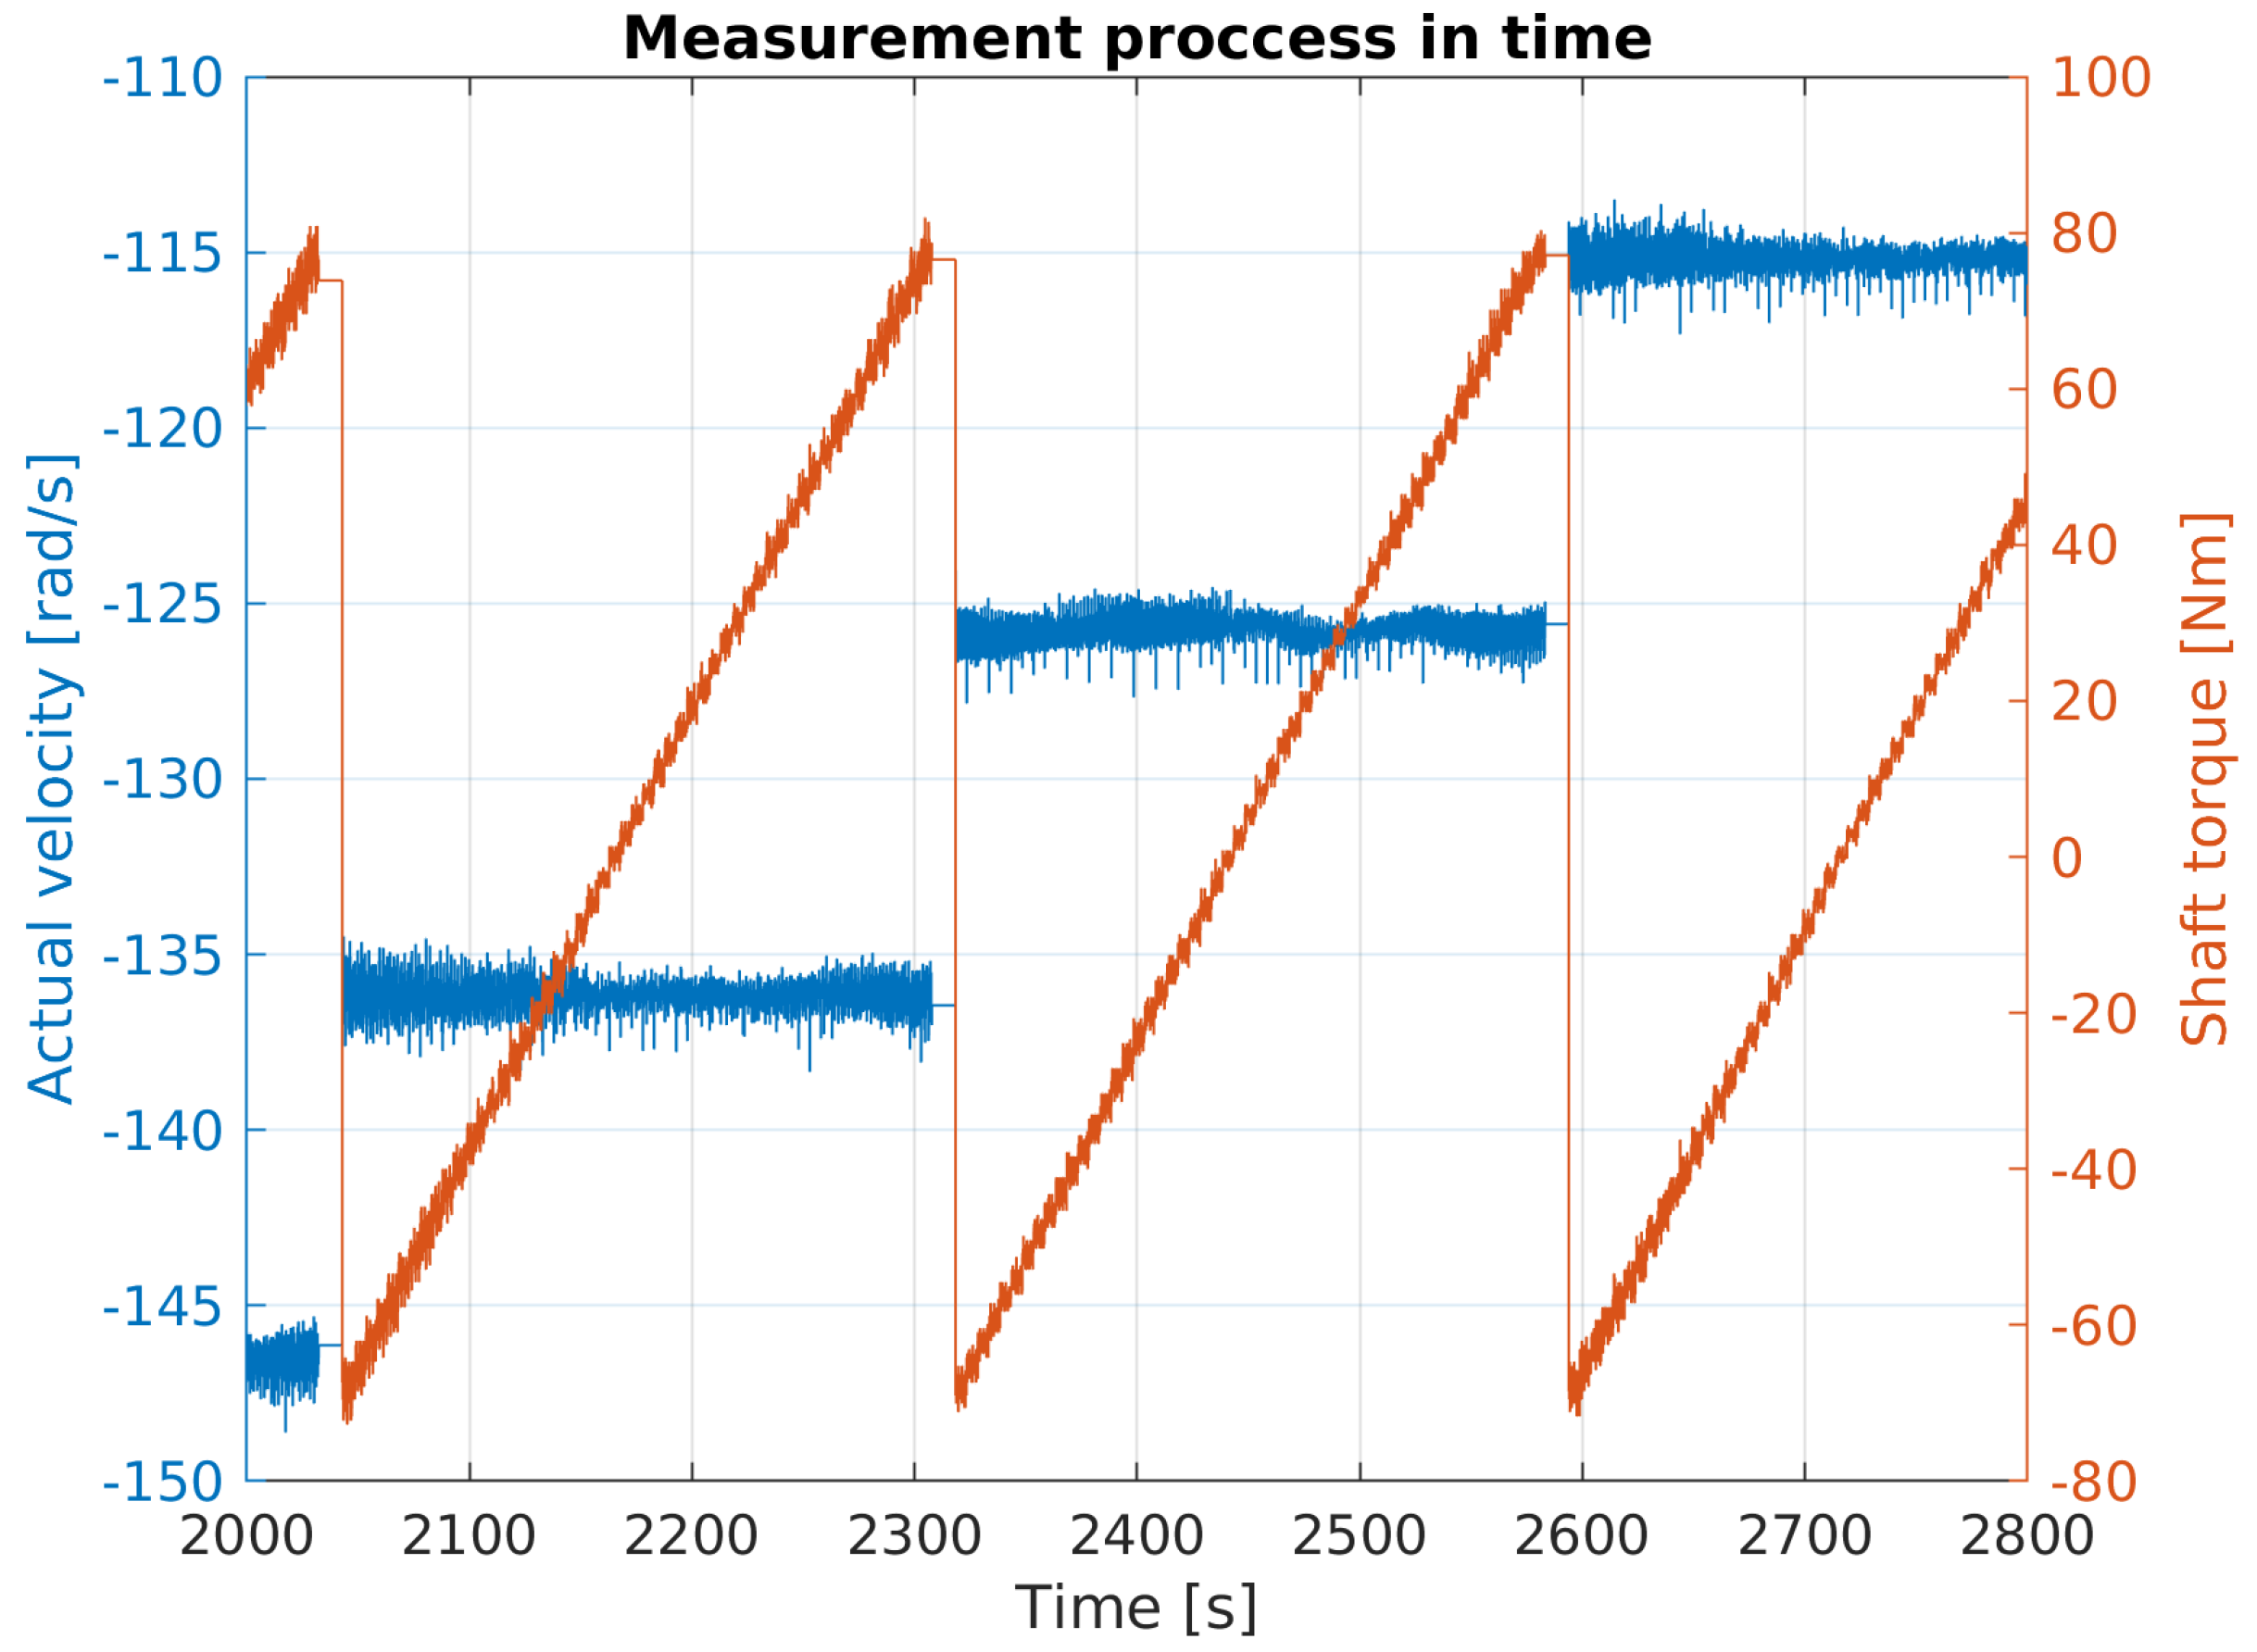
The measurement process was based on an incremental step-change of load torque from negative to positive values during the constant speed operation of DUT, where each step lasted for 5 s. This step-change of load torque was repeated for various speed values, from −2000 rpm to 2000 rpm, with a 100 rpm step. A similar testing profile was used in [10]. The applied testing profile is shown in Figure 2 with a 100 ms sampling time; the figure displays 1000 s from more then 3 h. Using this approach, all speed–torque quadrants were covered with approximately 50 samples, taken in each operating point.
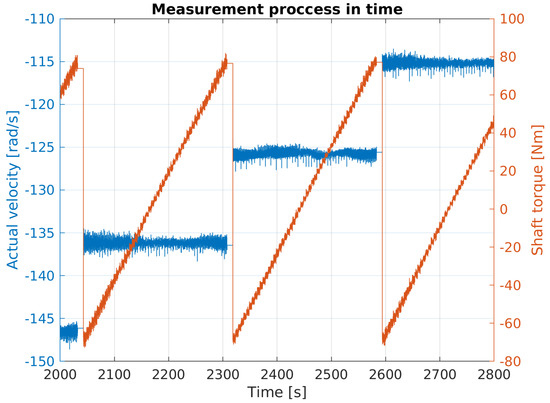
Figure 2.
A testing profile for the measurement of the gearbox friction characteristic.
The range of the measurement parameters was determined by the operating range of DUT. The measured data for each torque–speed combination were averaged to obtain a single value of speed and torque for each operating point.
It is important to mention that the friction depends significantly on the actual temperature of the gearbox. However, the actual temperature inside the gearbox is difficult to monitor; thus, only the temperature on the gearbox housing is measured usually. The housing temperature can be, as such, considered to be only an informative value due to the thermal inertia of the gearbox. The actual temperature of the gearbox components inside the housing can vary significantly, compared to the housing temperature. Therefore, the actuator was pre-heated to a steady operating temperature to prevent the temperature influence on the friction measurement. The temperature of the actuator can be considered constant during the measurement.
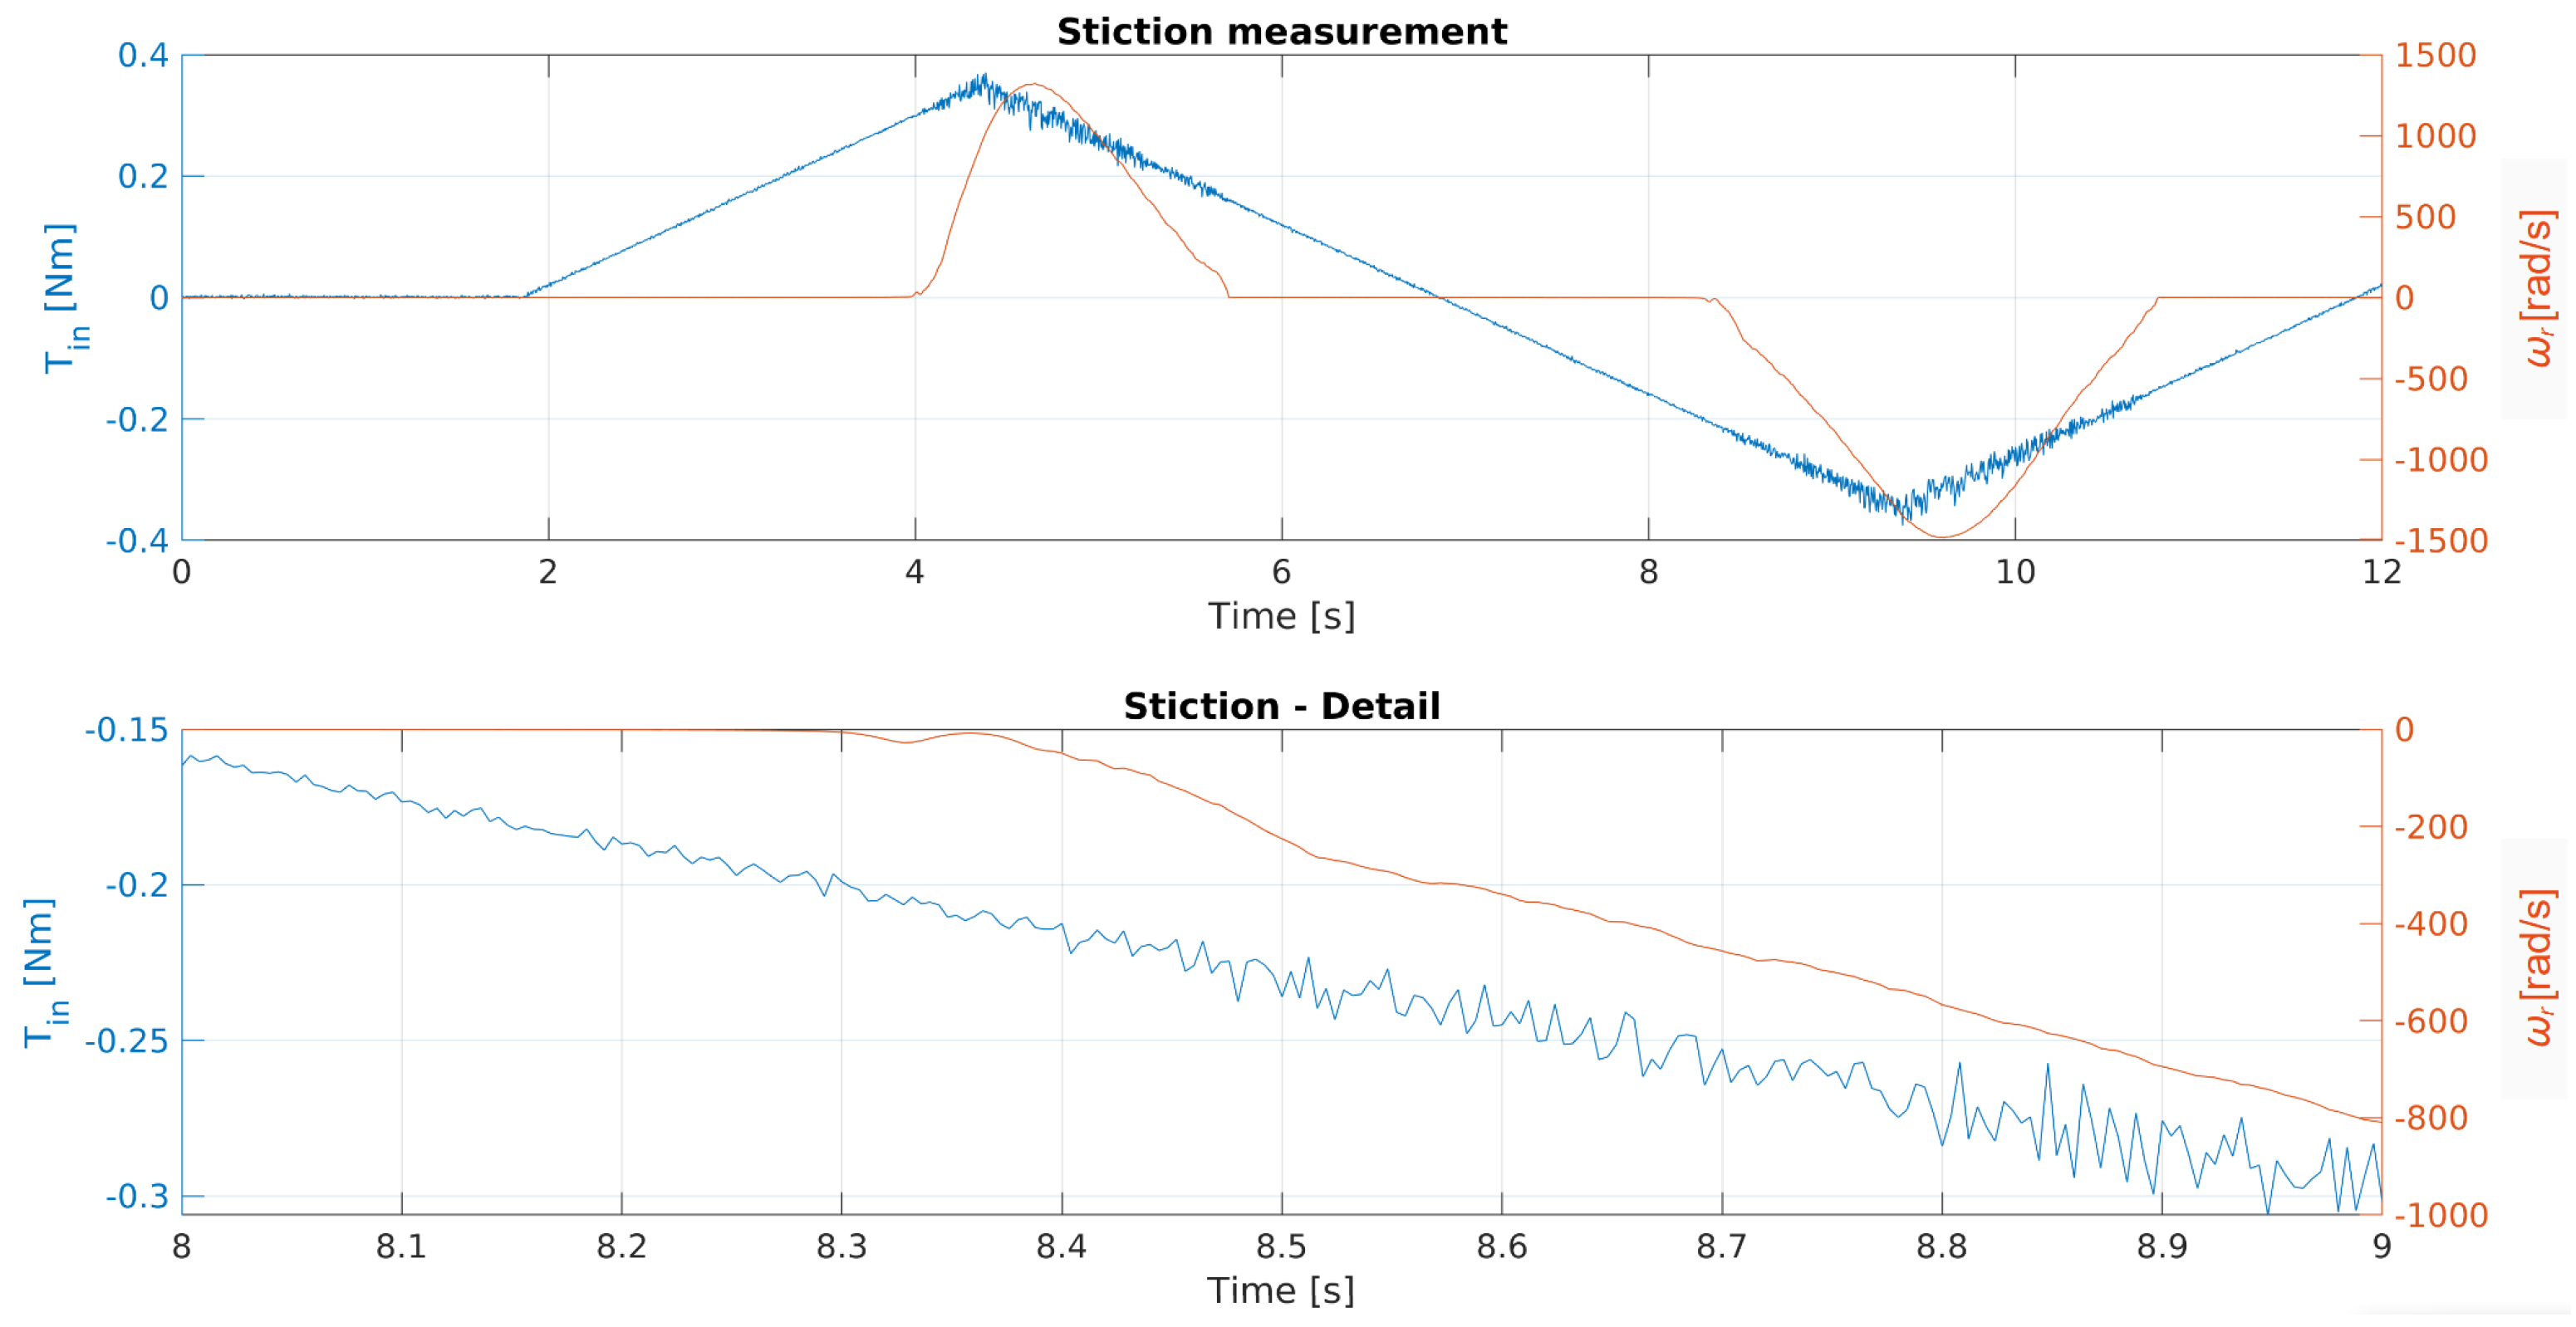
3. Stiction
Stiction is the phenomenon in which friction limits the movement of the rotor until sufficient torque is applied [18]. After that, the rotor starts to rotate and the friction drops below a static friction value level. Then, with the speed increase, the other friction components rise to the friction characteristic, as described in Section 4 and Section 5.
The stiction measurement is performed using a slow torque up–down ramp; the observed values are the motor torque and the rotor speed (Figure 3). The stiction is determined as a value of torque in the instant in which the rotor starts its movement. To obtain an accurate value of the stiction, several points were measured and averaged.
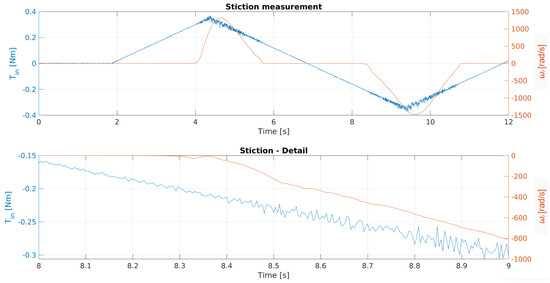
Figure 3.
A stiction measurement.
4. Gearbox Efficiency
The gearbox efficiency, in terms of torque conversion, is defined as:
where is the output torque, is the gearbox input torque, i is the gearbox ratio, and is the gearbox efficiency.
Assuming the gearbox operation in steady temperature, the gearbox efficiency depends on the actual speed and torque:
where is the input angular speed.
Using the measured and subsequently averaged data, the actuator efficiency is calculated as follows:
Note that Equation (3) was used only to calculate the efficiency from measured values. In practice, it is advantageous to relate the efficiency to the input torque (as defined in Equation (2) and later in Equation (9)), as it is easier to measure (the information may be read from the servo drive and no additional sensor is needed in the application). Therefore, all measurements results are related to input torque and speed.
A graphical representation of the measured data is in Figure 4. Red dots represent the efficiency in a negative speed direction, and blue dots stand for a positive direction.
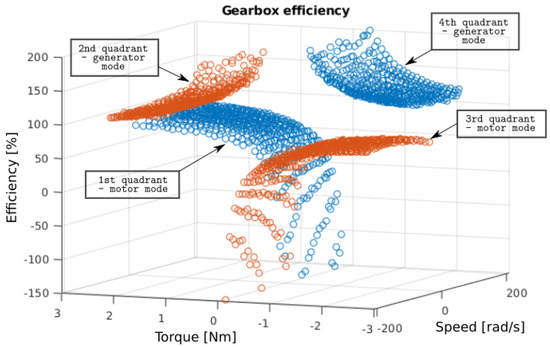
Figure 4.
Four-quadrant visualisation of efficiency points of the gearbox, obtained by experimental measurement.
The measured efficiency, as is depicted in Figure 4, varies notably in each quadrant. As it was expected, the efficiency is above 100% in generator mode, as Equation (3) has been used for the motor as well as the generator mode.
The efficiency approaches negative or positive infinity for motor torque values close to 0 Nm in all four quadrants. The main reason for this is the static friction (or stiction), as the gearbox itself can hold a certain load without any motor torque or even with low motor torque in the same direction.
A mathematical description of the measured efficiency is needed to build up a mathematical model for further usage in simulations and system control. However, as can be seen, there are large discontinuities present, i.e., the efficiency during the speed transition from the positive to negative direction within the same load can suddenly increase from 60% to 120%. Therefore, the mathematical approximation of the efficiency should be conducted separately for each quadrant. Nevertheless, using such an approximation in simulation or in drive control will cause undesired peaks during the transients between quadrants, as the efficiency value may suddenly change by more than tens of percents in the worst case. Thus, another approach to model the efficiency with the same dataset will be described in the next section.
5. Friction Characteristic
The main factor affecting the overall mechanical efficiency is the friction in the mechanics, which causes general mechanical losses . These mechanical losses are, in the most simple way, modelled only by viscous friction:
where B is the coefficient of a viscous friction. However, especially in cycloidal gearboxes, the friction coefficient is not constant. Instead, friction depends on actual angular velocity, load torque, and temperature. When assuming a constant temperature, friction losses can be defined as a nonlinear friction characteristic, as a function of angular velocity and input torque:
where is the friction characteristic.
Using this approach, the original mechanical equation (Equation (1)) can be expressed as follows:
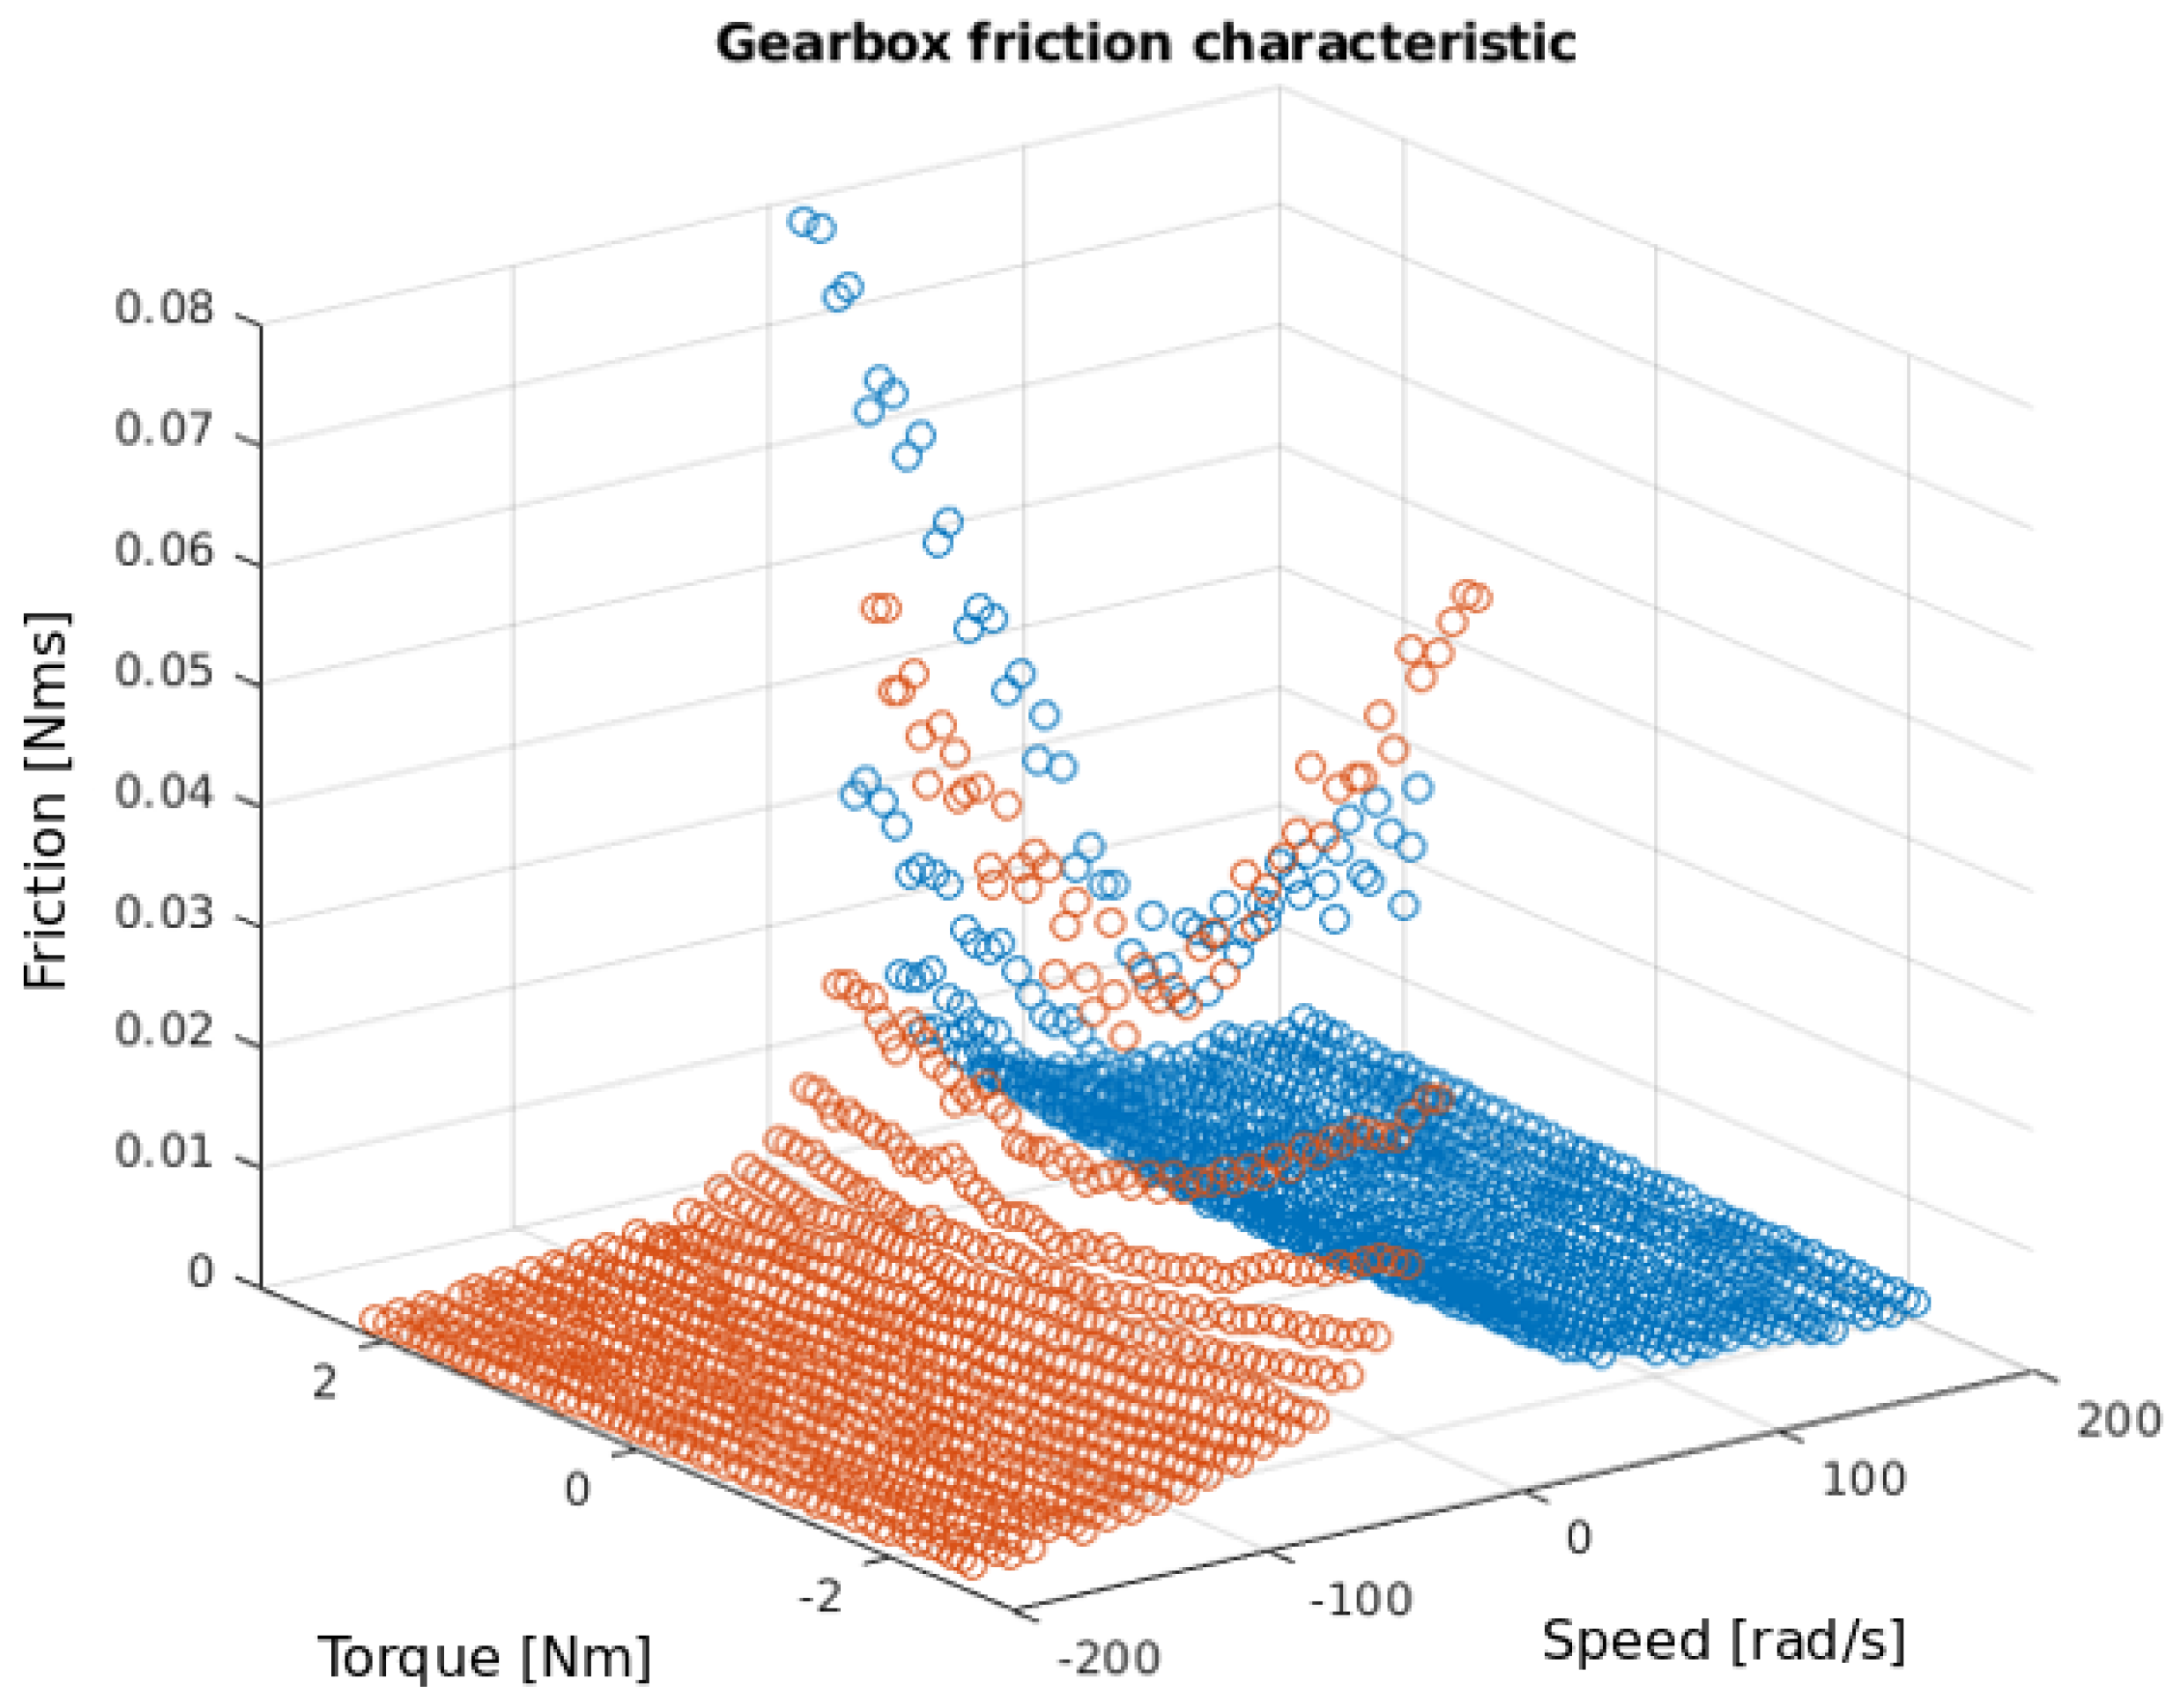
The friction characteristic can be determined, using the same measured data and Equation (6), as:
The determined friction characteristic is depicted in Figure 5 from the input (i.e., motor) shaft perspective, where red dots are from the negative speed region (e.g., 2nd and 3rd quadrant) and blue dots belong to the positive speed region (e.g., 1st and 4th quadrant). As can be seen, the friction characteristic does not contain large discontinuities, as was the case in Figure 4 for efficiency. Thus, it is sufficient to divide characteristics into two regions only—one each for positive and negative speed. This is needed for further data processing and mathematical approximations.
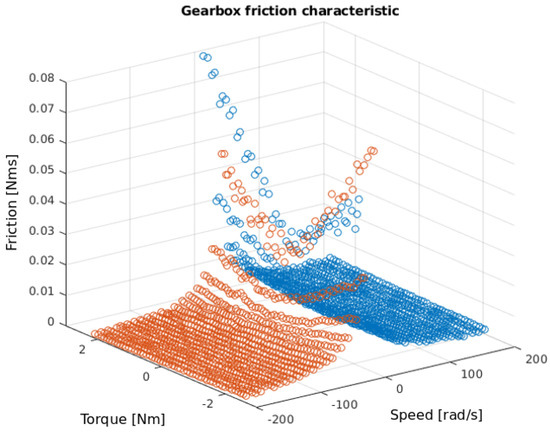
Figure 5.
Four-quadrant visualisation of friction points of the gearbox, obtained by experimental measurement (input shaft perspective).
At first, the measured friction was approximated for the points with the same load by the following exponential function:
Next, function parameters for every torque value were compared and plotted as a dependency on the torque. This way, the possible approximation of each parameter could be observable. It was apparently visible that parameter a showed a quadrature dependency in relation to input torque, that parameter b showed a linear dependency, and that parameters were almost constant over every torque value. Therefore, they were fitted using the MATLAB fit function. As a result, the following form of the approximation function was found:
where index stands for the positive speed interval, index stands for the negative speed interval, and are the coefficients of substitute functions, as described above and listed in Appendix A, Table A3. The graphical representation of the friction characteristic approximation is shown in Figure 6, where red circles represent measured values.
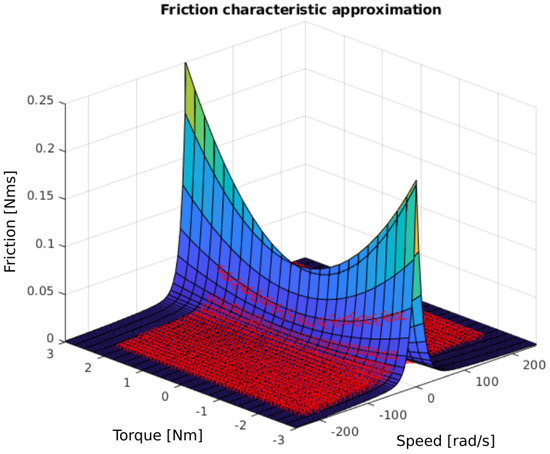
Figure 6.
A comparison of the measured and approximated friction characteristics of the actuator.
The function given by Equation (9) approximates the measured values, with the R-square value equal to 0.988 in this case. The equation used in the R-square evaluation is presented in Equation (10) with the sampled data and the calculated friction function for the same input data.
where n is the number of measured values and is the average value of the measured friction.
6. Simulation Model of the Servoactuator
The simulation model of the measured servoactuator consists of the electrical and the mechanical part, including the gearbox equations. The electrical part of the servoactuator is described by the following model in dq-coordinates:
where and are direct (field-generating) and quadrature (torque-generating) currents, R is the phase resistance, and are direct and quadrature inductances, is the motor torque constant, p is the number of pole pairs, and and are direct and quadrature voltages, respectively.
The mechanical part with the gearbox is described as follows:
where J is the system inertia calculated to the input side of the gearbox (e.g., motor side), is the load torque, is the stiction, is the stiction breakaway speed at which the stiction affects the motor, and is the output angular velocity. The stiction breakaway speed has a small value, selected by the trial-and-error method, to avoid current chattering at standstill.
Here, Equations (15) and (16) are divided into two cases to model the stiction effect, which is present when accelerating from zero speed and during speed direction transition. Firstly, the input torque must prevail over the stiction to start the movement. Then, when the rotor starts to rotate, friction function takes place.
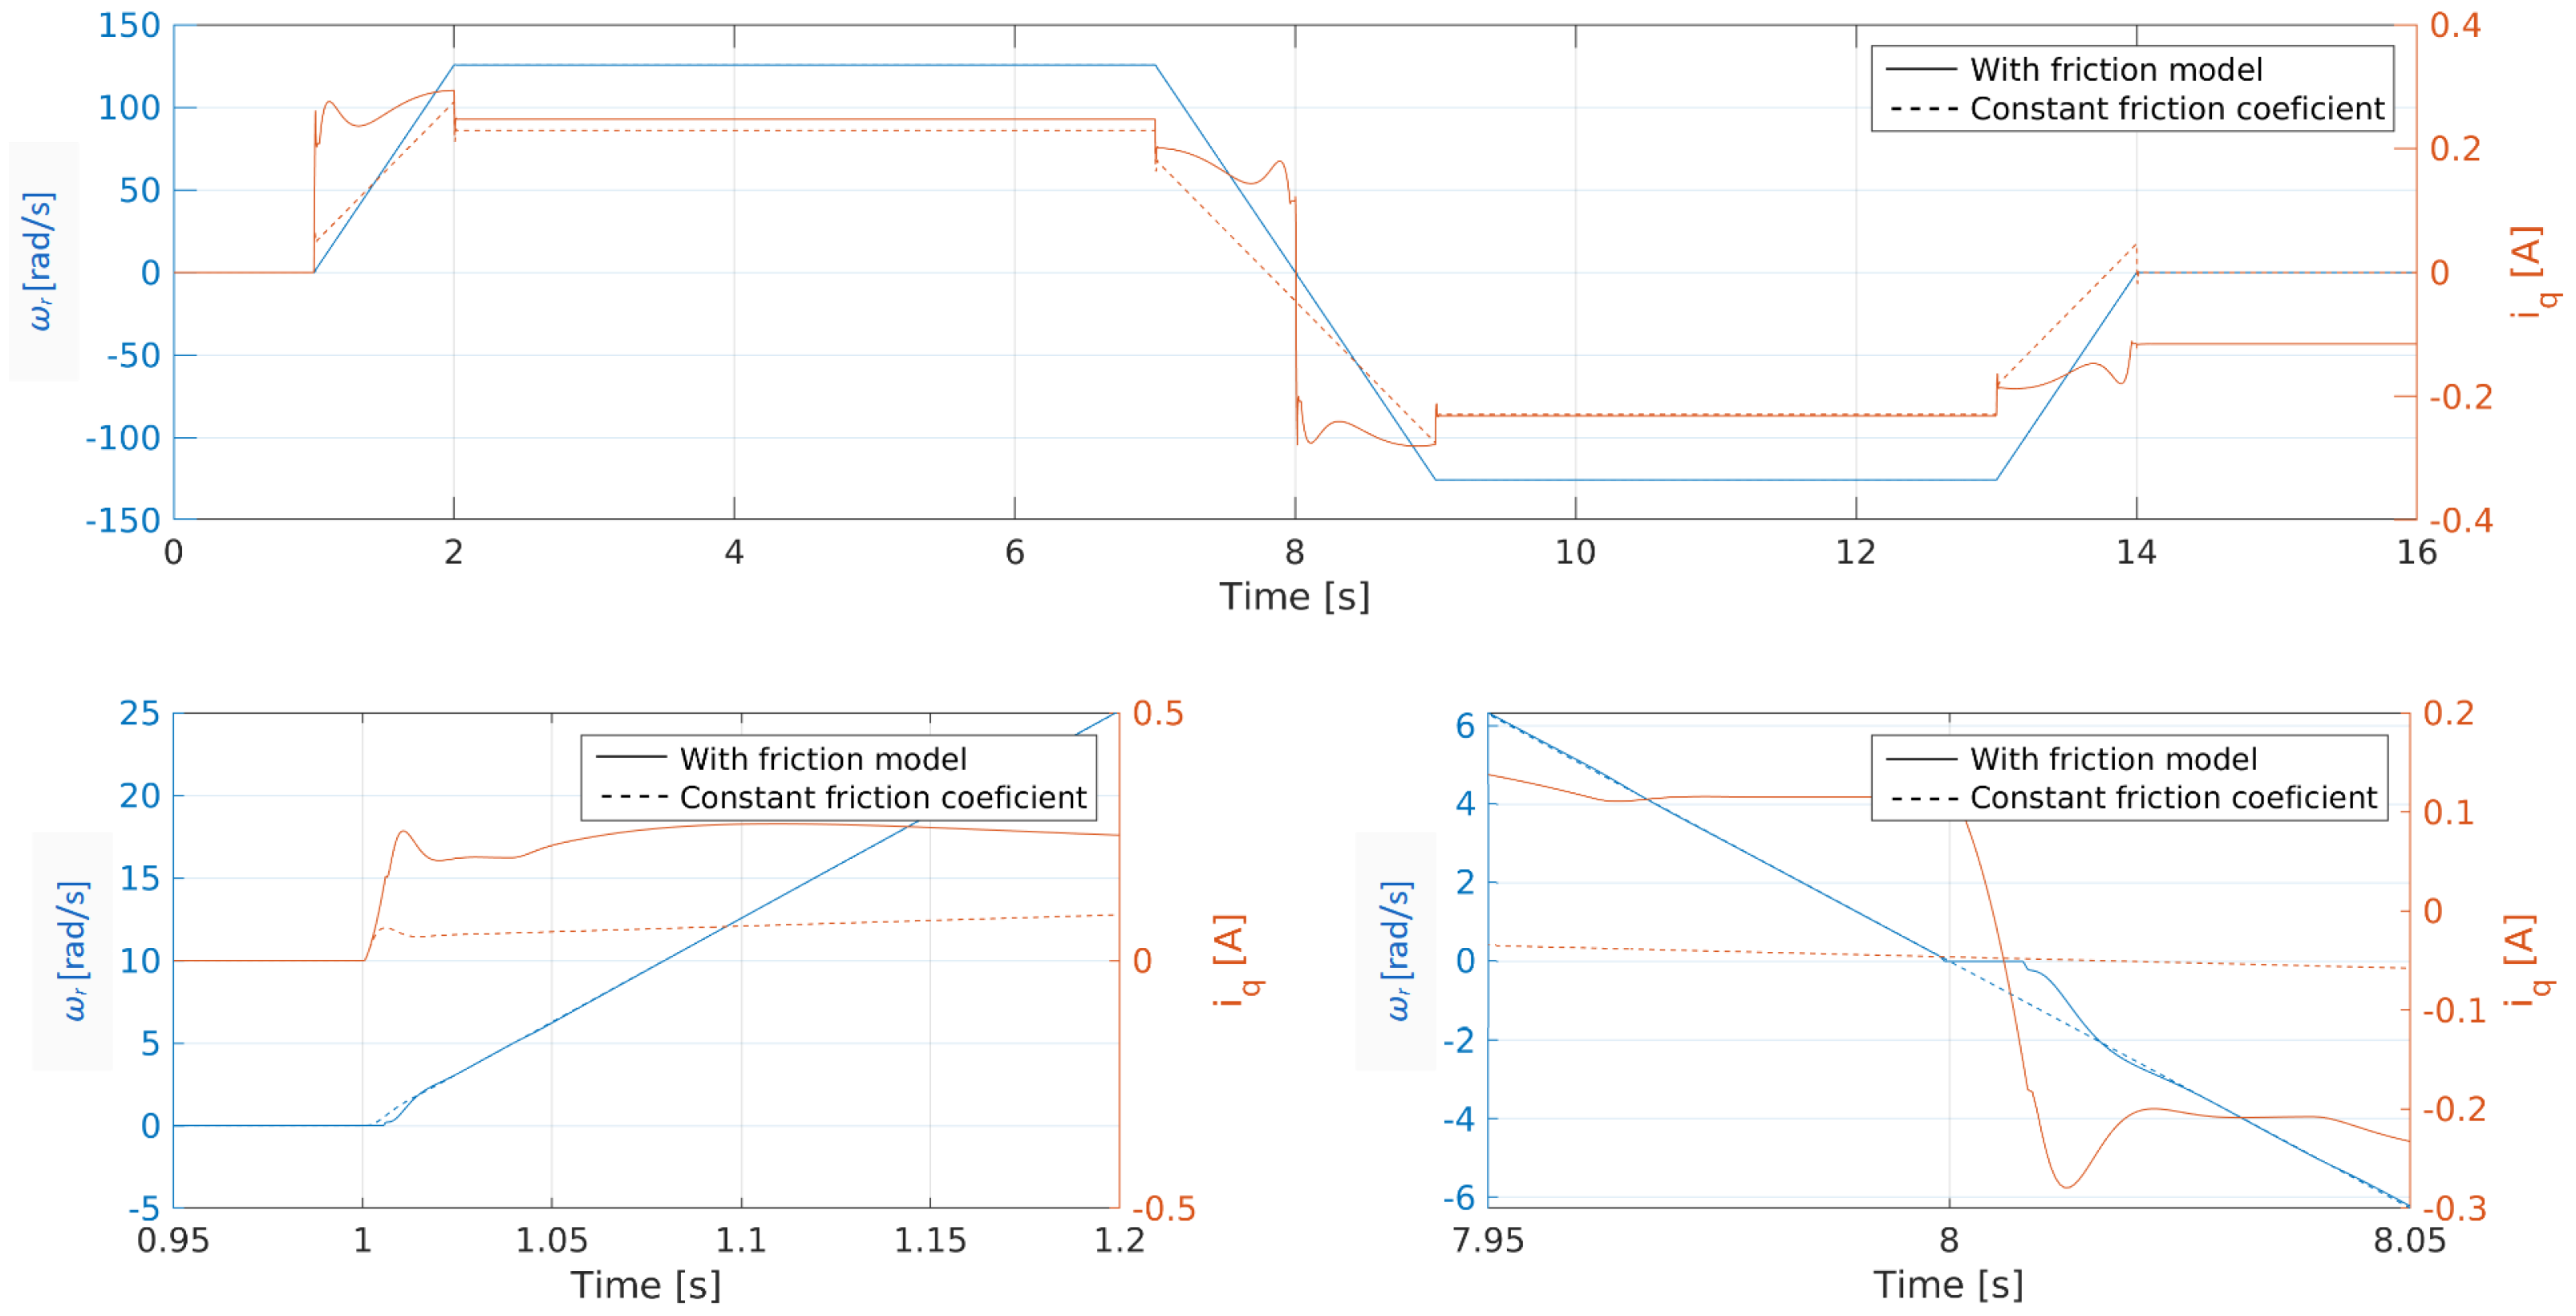
The mathematical model was simulated with the parameters listed in Appendix A, and the simulation results are shown in Figure 7. The simulation was performed for the complex gearbox model as well as for the simple friction model, according to Equation (4).
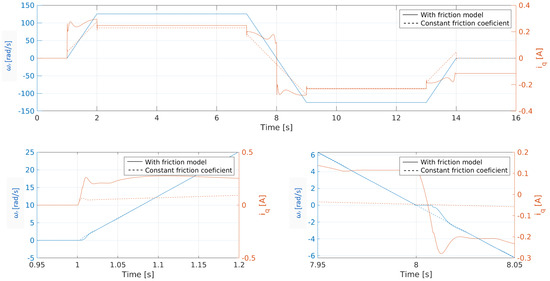
Figure 7.
A simulation of a simple movement of the actuator without load, where the angular velocity of the motor is blue and the torque-generating current is red. Continuous lines represent the simulation with the presented friction model, whereas dashed lines represent the simulation with the basic friction modelling. The upper plot shows the whole movement, the bottom-left plot shows the movement start in detail, and the bottom-right plot shows the stiction effect during speed transition.
The movement starts at the time by the torque-generating current peak, followed by a little drop. This is caused by the stiction described in Section 3. Next, the torque-generating current rises according to the acceleration and gearbox friction characteristics.
In transition, when the speed changes its direction (at the time s), the stiction effect is observable again. This causes a short steady-state phase with the zero speed, until the torque rises to a higher value, along with the stiction. The simple friction model given by Equation (4) significantly differs in transition, which can be observed in the waveform of the torque-generating current and the speed direction change.
At the end of the movement, in standstill operation with zero speed, the torque-generating current remains at a level which is not sufficient to move the rotor. This phenomenon is a consequence of the stiction, as the speed drops to zero at the moment when the motor torque drops under stiction.
7. Experimental Results
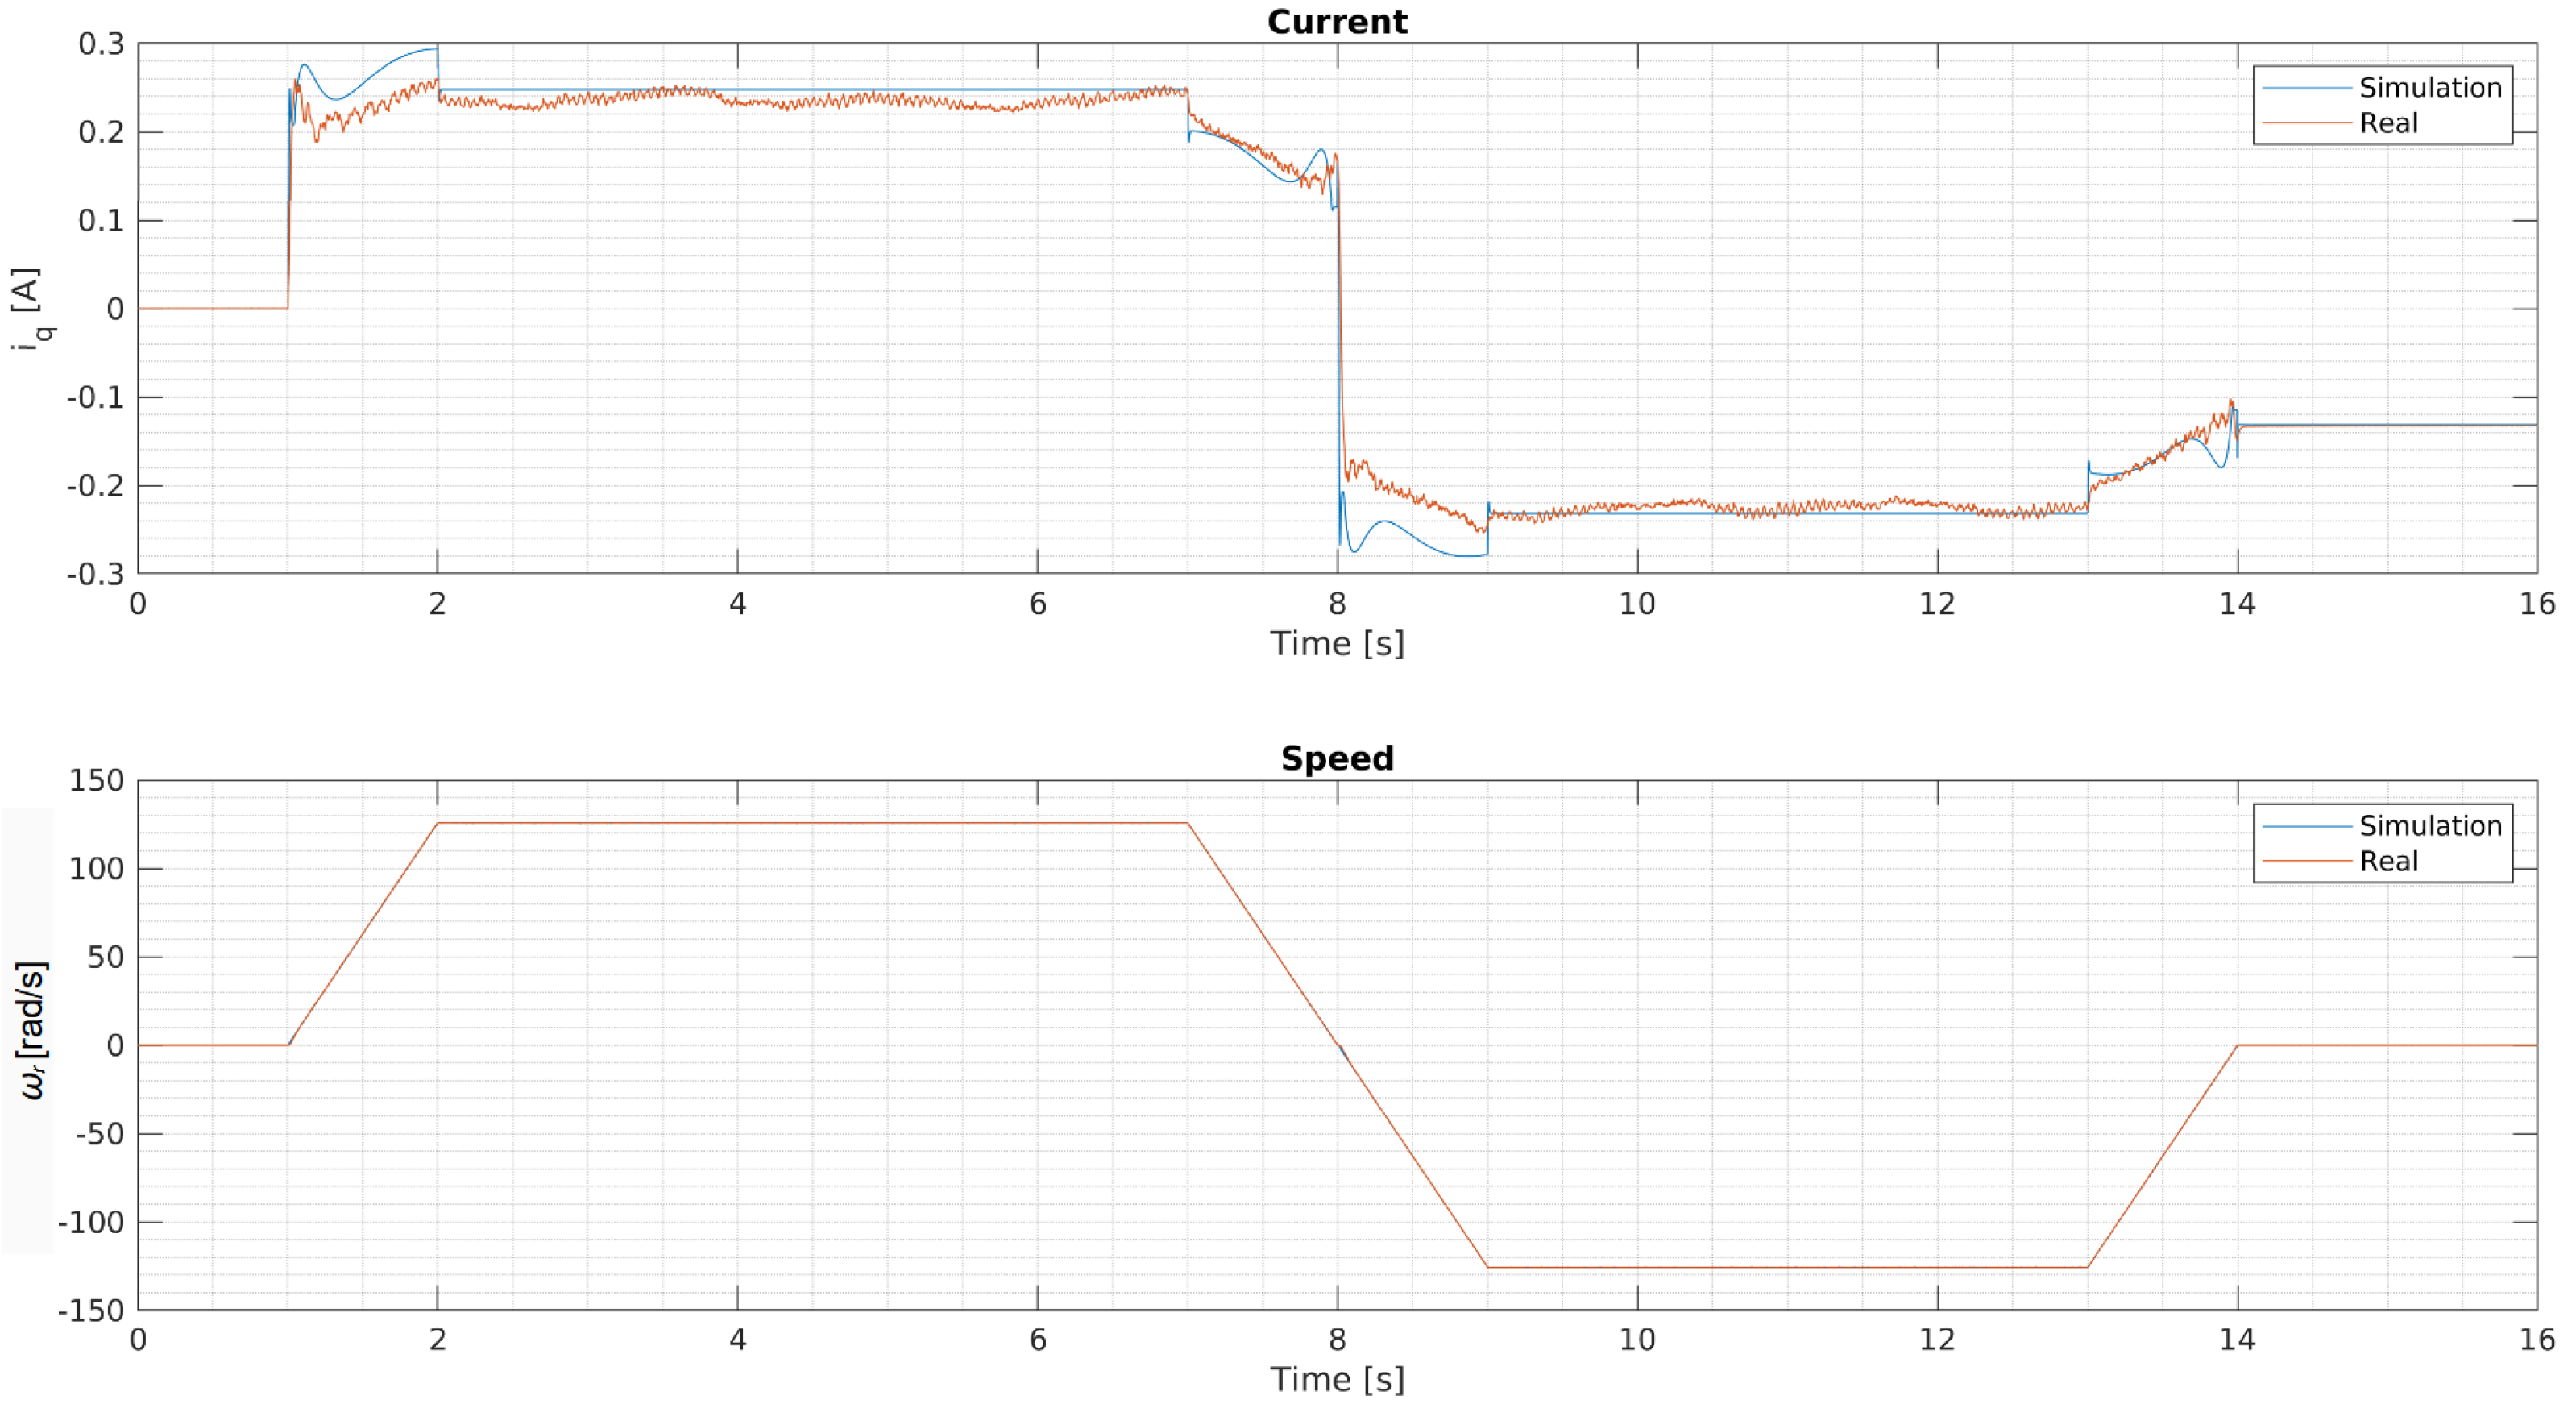
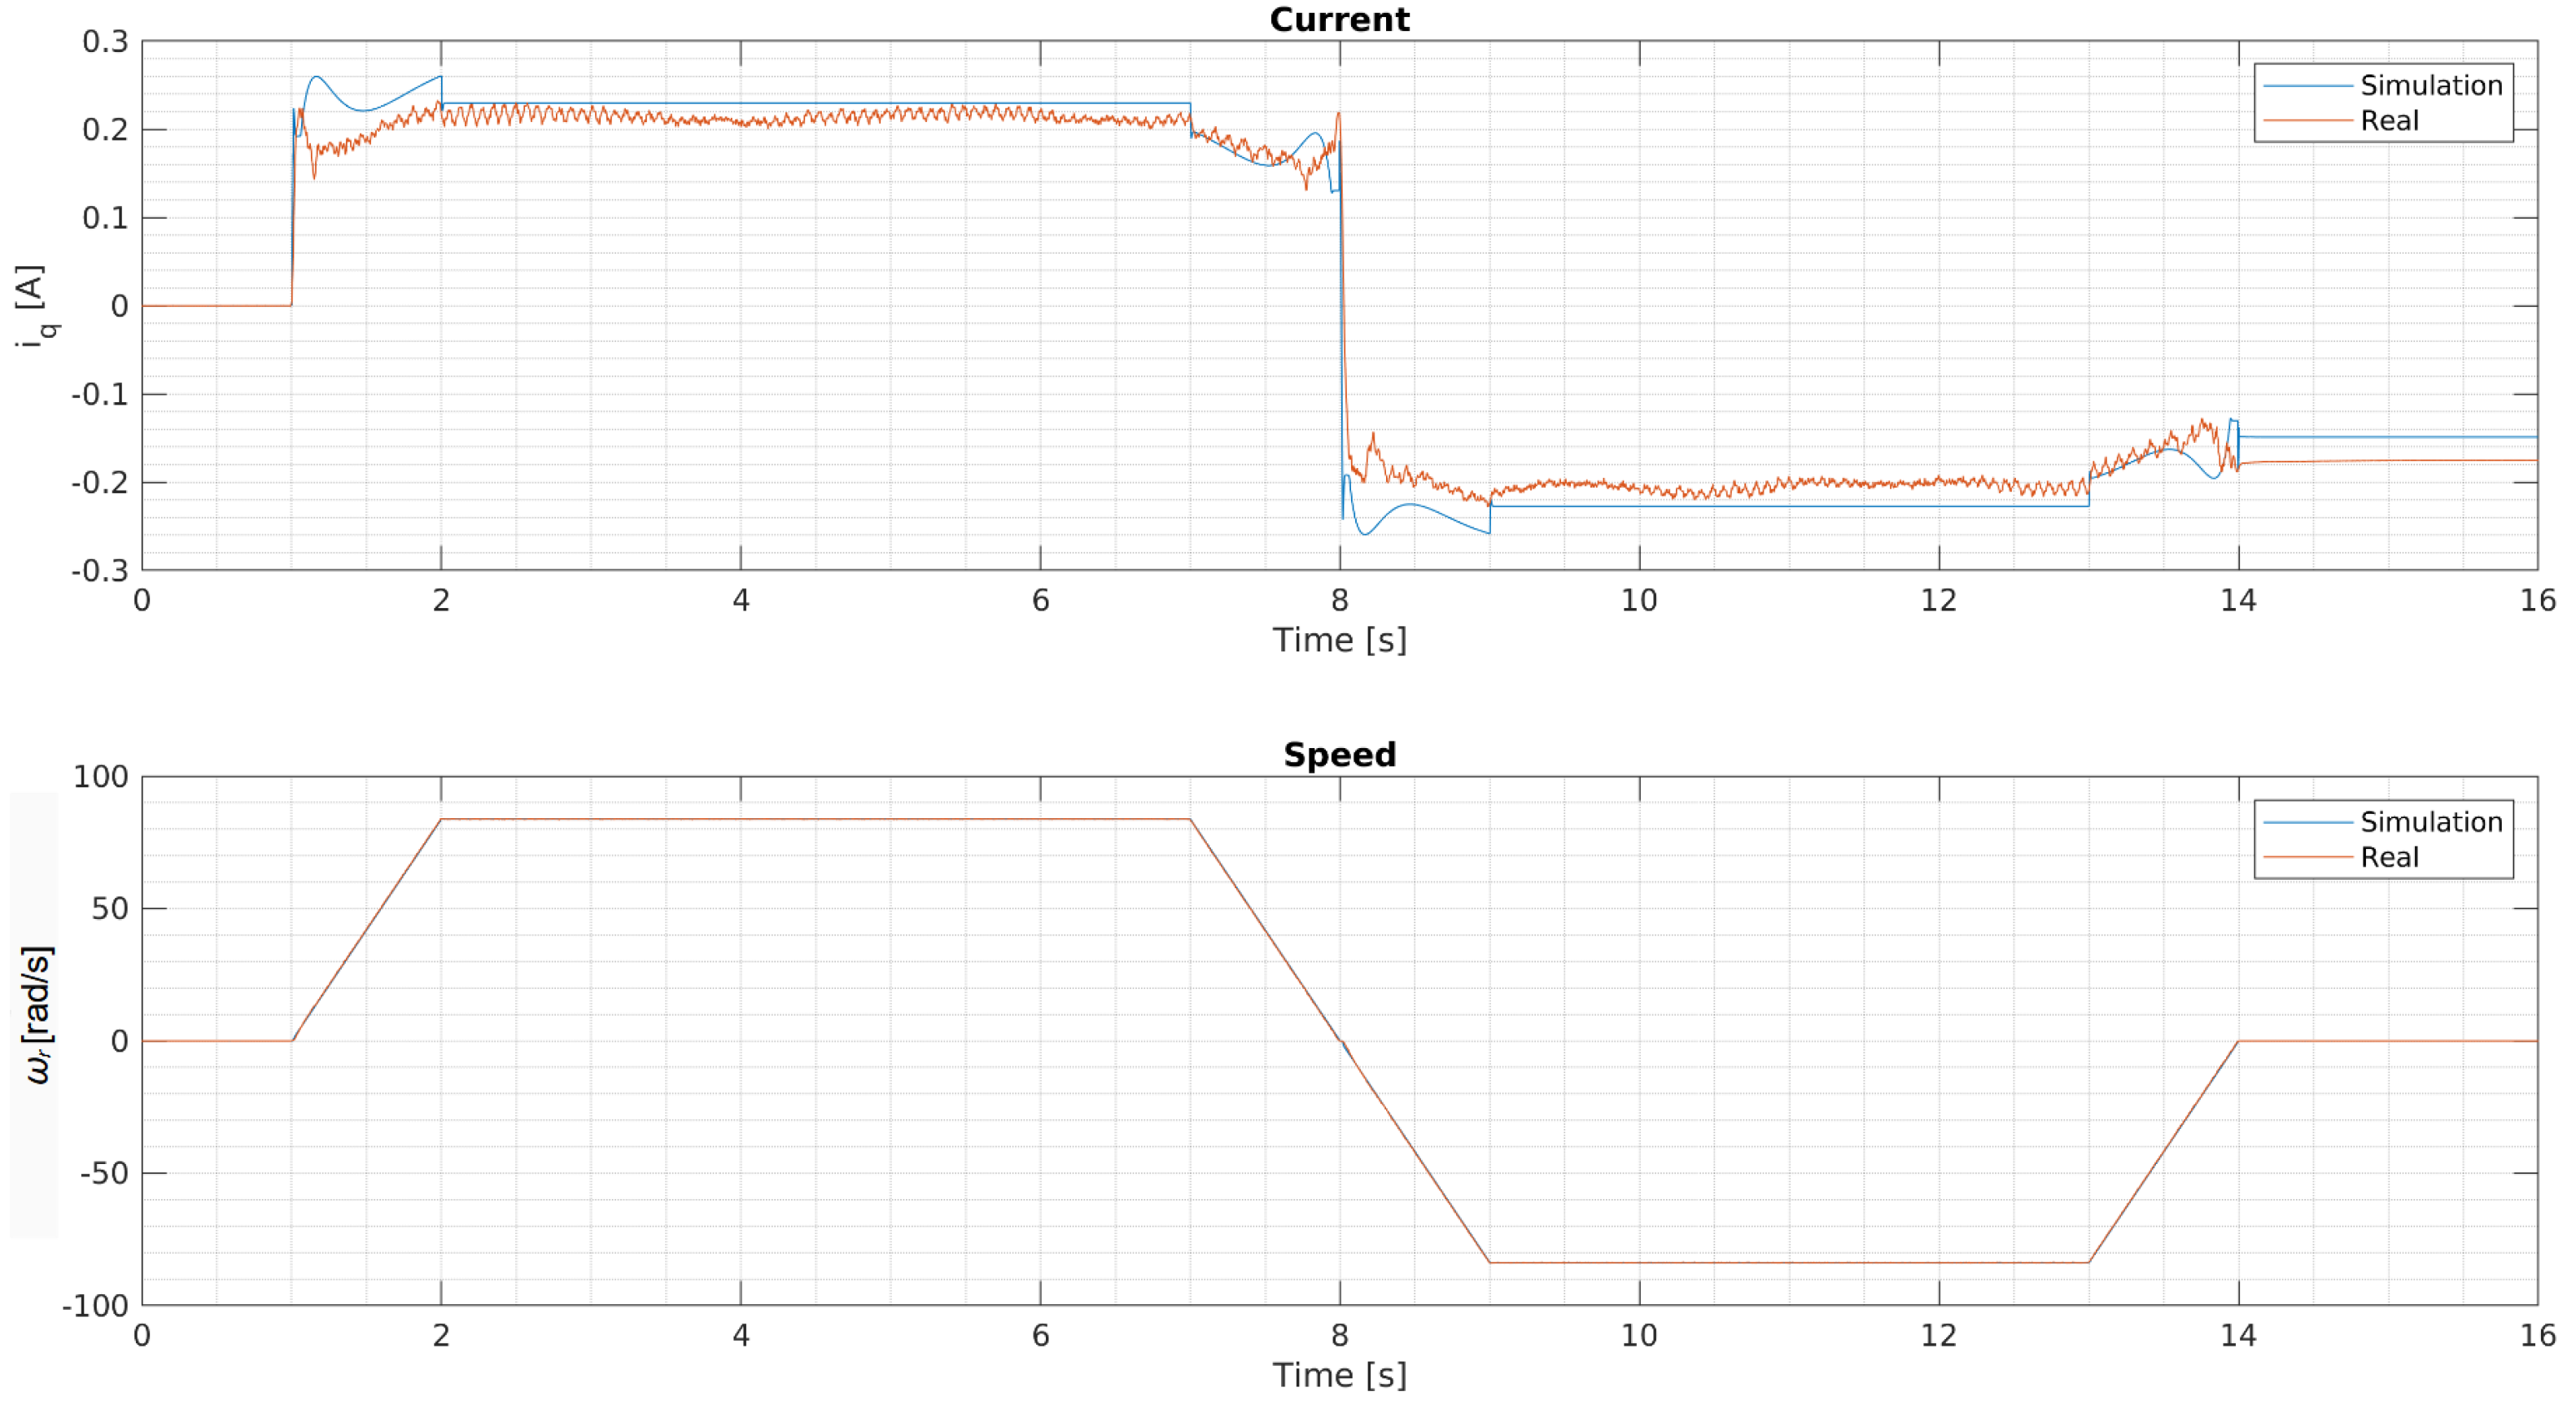
The same movement as in Figure 7 was performed by the actuator on the test bench. Results are compared with the simulation in Figure 8. Again, the torque-generating current and the angular velocity of the motor was observed. No load was applied during the experiment.
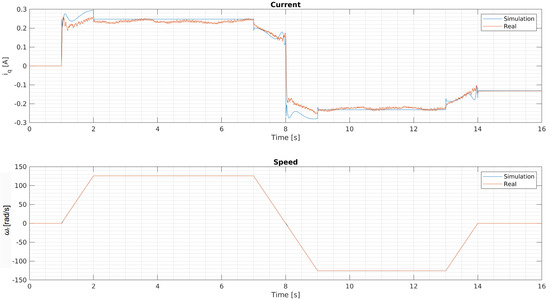
Figure 8.
A comparison of the simulation and the real measurement of the actuator movement without load. The upper plot shows the waveforms of torque-generating currents; the bottom plot shows the angular velocity.
It can be concluded that simulated waveforms match the responses of the real system. The differences in the transients are caused by inequalities of the characteristics over the mechanical revolution of the gearbox, as all mechanical parts are manufactured with some mechanical tolerance, which affects the mutual mechanical contact of internal gearbox components.
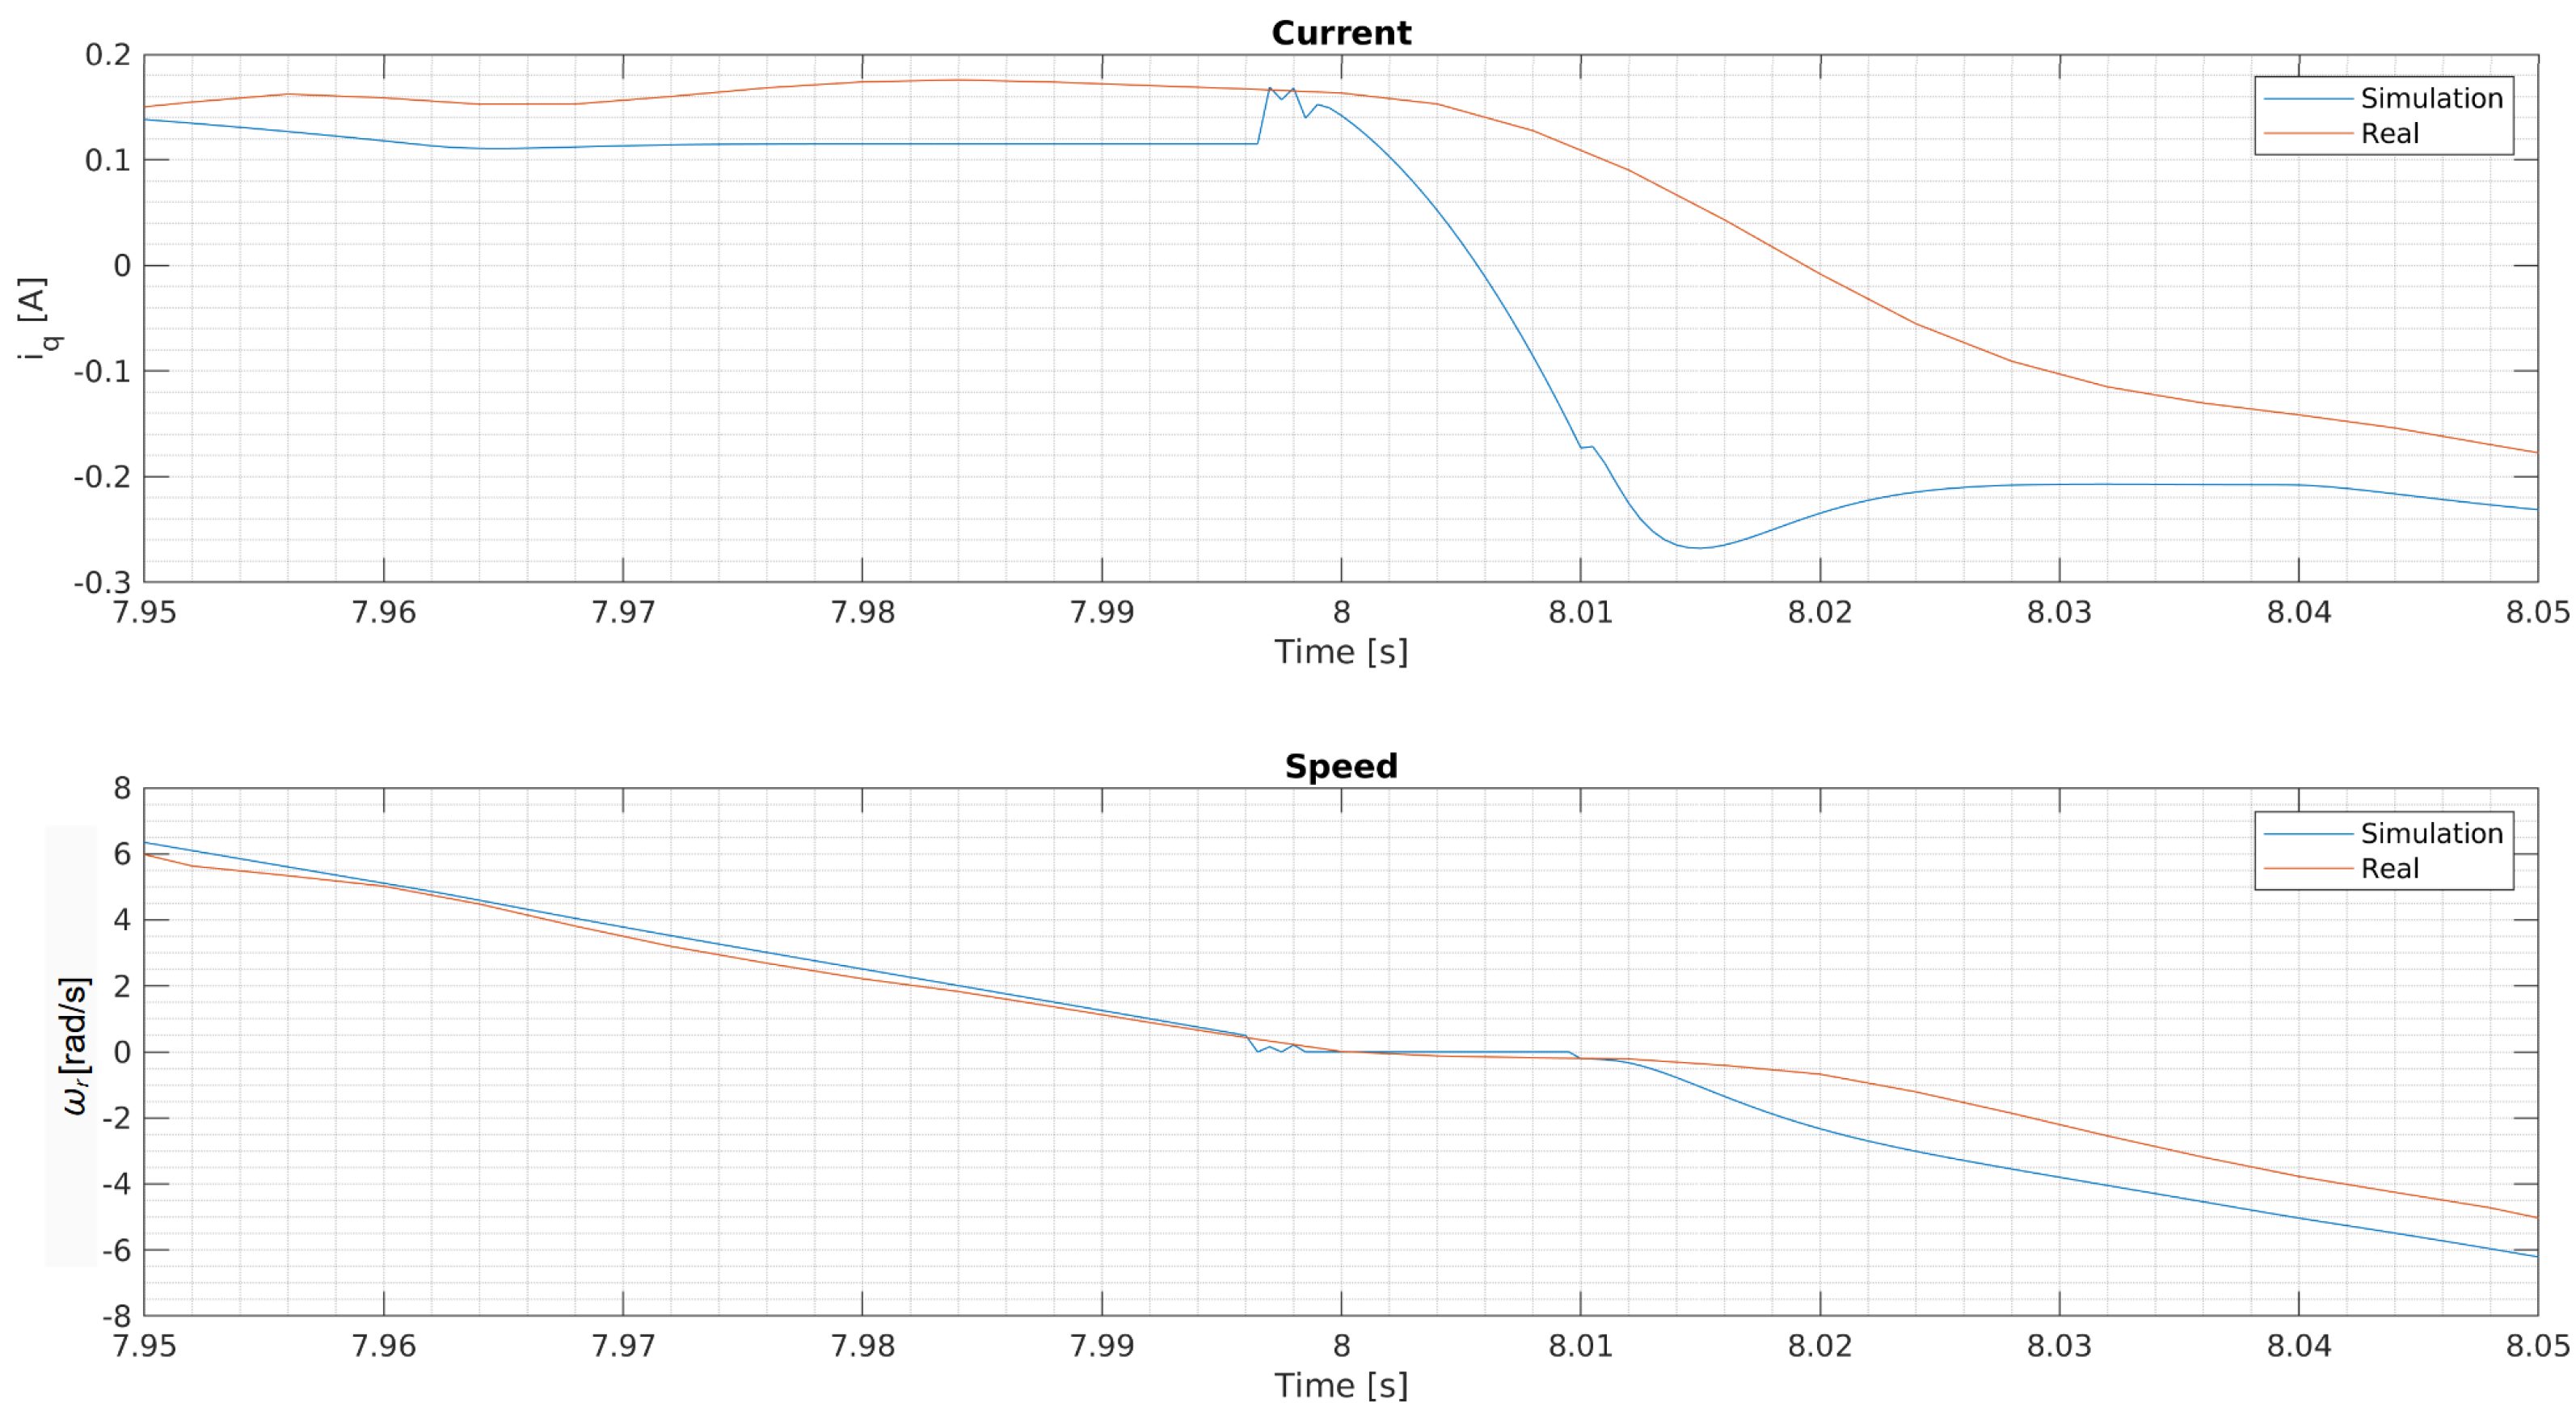
The model of stiction, causing current peaks, a small steady phase during speed direction change, and a non-zero current at standstill, are reproduced fairly. This can be observed in the detailed waveforms provided by Figure 9.
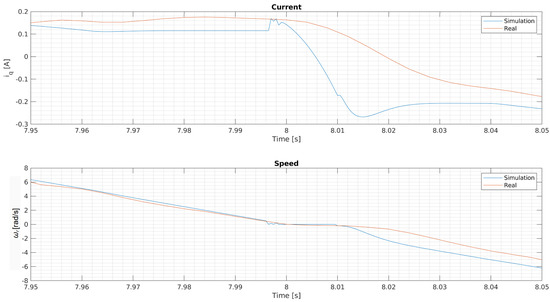
Figure 9.
A detail of the transition from positive to negative speed during actuator movement.
A comparison of the mathematical model and the real measurement for another speed value is shown in Figure 10. Here, the results are very close to each other as well.
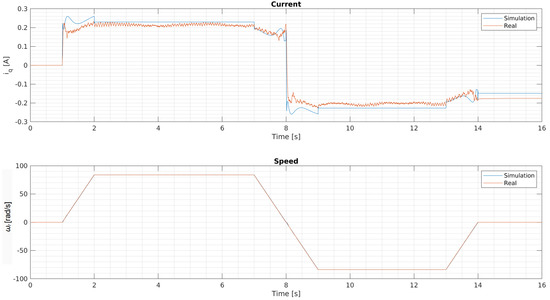
Figure 10.
A comparison of the simulation and the real measurement of the actuator movement without load, with 800 rpm as the speed setpoint.
8. Conclusions
The presented mathematical model of the gearbox was focused on modelling the friction in the cycloidal gearbox, attached to the permanent magnet synchronous motor in the compact actuator. The friction model is based on the new approach, considering the stiction phenomena and the nonlinear friction characteristic.
The mathematical model was verified by a comparison of the simulation with the real system—an actuator with a cycloidal gearbox. The results confirm that the designed mathematical model of gearbox has a high level of accuracy.
The model can be used in actuator or motor control to compensate for the friction, which can further improve the dynamic behaviour of the controlled system. Moreover, the model shows various aspects (e.g., current peaks during the motor speed-up or non-zero current at standstill) which have to be considered in the actuator and the whole system design. Finally, the model finds usage in the various model-based control techniques as well.
Although the accuracy of the model in the terms of friction is very high, the model does not cover the torsional stiffness and backlash, which are important for modelling positioning accuracy. However, the presented model can be used as the basis or as an input part of a more complex mechanical model of the cycloidal gearbox.
The disadvantage of the presented mathematical model is the fact that it is based on experimental data; thus, there is no rule for calculating parameters in the friction model. However, such a rule would be hard to establish. The main reason for this is that there can be significant differences between every gearbox produced. In reality, each cycloidal gearbox has its unique performance, thanks to the mechanical complexity of the gearbox and a lot of parameters affecting the gearbox performance during its production. Therefore, the authors suppose, to obtain general model parameters, a statistically significant amount of measurement and the determination of the parameters for a given product line should be performed and statistically evaluated.
Author Contributions
Conceptualisation, V.Š. and J.I.; methodology, V.Š.; software, J.I.; validation, M.H., D.P., and M.K.; formal analysis, K.K.; investigation, V.Š. and J.I.; resources, J.I. and K.K.; data curation, J.I.; writing—original draft preparation, V.Š.; writing—review and editing, K.K.; visualisation, J.I.; supervision, M.H. and F.Ď.; project administration, F.Ď. and M.K.; funding acquisition, M.H. and D.P. All authors have read and agreed to the published version of the manuscript.
Funding
This work was supported by the Slovak Research and Development Agency, under contract no. APVV-16-0355. This work was also supported by the Scientific Grant Agency of the Ministry of Education of the Slovak Republic, under the project VEGA 1/0493/19.
Data Availability Statement
The data presented in this study are available on request from the corresponding author.
Conflicts of Interest
The authors declare no conflict of interest.
Appendix A
The parameters of the measured actuator are summarised in Table A1. The controllers’ settings are given in Table A2. The parameters determined from measurements and used in the simulation are summarised in Table A3 and Table A4.

Table A1.
Parameters of the measured actuator.
Table A1.
Parameters of the measured actuator.
| Parameter | Symbol | Value | Unit |
|---|---|---|---|
| Rated voltage | 560 | V | |
| Rated current | 2.81 | A | |
| Phase resistance | R | 2.61 | |
| Direct inductance | 18.5 | mH | |
| Quadrature inductance | 18.5 | mH | |
| Torque constant | 1.25 | NmA | |
| Pole pairs | p | 5 | – |
| Gearbox ratio 1 | i | −32 | – |
1 The measured gearbox inverse of the direction of the rotation, which is represented by the negative sign before the gear ratio.
Table A2.
Controllers’ settings.
Table A2.
Controllers’ settings.
| Parameter | Symbol | Value | Unit |
|---|---|---|---|
| Current loop—Proportional gain | 30 | VA | |
| Current loop—Integral reset time | 1.1 | ms | |
| Speed loop—Proportional gain | 0.15 | Nms.rad | |
| Speed loop—Integral reset time | 25 | ms |
Table A3.
Friction characteristic model parameters.
Table A3.
Friction characteristic model parameters.
| Parameter | Value |
|---|---|
| 0.017 | |
| 0.0065 | |
| 0.0704 | |
| −0.0038 | |
| −0.0968 | |
| 0.0085 | |
| −0.0078 | |
| 0.014 | |
| −0.0035 | |
| 0.0713 | |
| 0 | |
| 0.1004 | |
| 0.0094 | |
| 0.0092 |
Table A4.
Stiction model parameters.
Table A4.
Stiction model parameters.
| Parameter | Symbol | Value | Unit |
|---|---|---|---|
| Stiction breakaway speed | 0.5 | s | |
| Stiction | 0.2 | Nm |
References
- Castillo, J.M.D. The analytical expression of the efficiency of planetary gear trains. Mech. Mach. Theory 2002, 37, 197–214. [Google Scholar] [CrossRef]
- Qimin, X.; Qili, X. Study on Optimal Design of Planetary Gear Reducer Based on Particle Swarm Algorithm and Matlab. In Proceedings of the 2010 Sixth International Conference on Semantics, Knowledge and Grids, Beijing, China, 1–3 November 2010; pp. 391–394. [Google Scholar] [CrossRef]
- Talbot, D.C.; Kahraman, A.; Singh, A. An Experimental Investigation of the Efficiency of Planetary Gear Sets. J. Mech. Des. 2012, 134, 021003. [Google Scholar] [CrossRef]
- Yao, W.S.; Lin, C.Y. Design of Active Continuous Variable Transmission Control System with Planetary Gear. Electronics 2022, 11, 986. [Google Scholar] [CrossRef]
- Kecskés, I.; Burkus, E.; Odry, P. Gear efficiency modeling in a simulation model of a DC gearmotor. In Proceedings of the 2018 IEEE 18th International Symposium on Computational Intelligence and Informatics (CINTI), Budapest, Hungary, 21–22 November 2018; pp. 000065–000070. [Google Scholar] [CrossRef]
- Mohsine, A.; Boudi, E.M.; El Marjani, A. Modeling and structural analysis of planetary gear of a wind turbine. In Proceedings of the 2016 International Renewable and Sustainable Energy Conference (IRSEC), Marrakech, Morocco, 14–17 November 2016; pp. 462–466. [Google Scholar] [CrossRef]
- Ngandu Kalala, G.; Chiementin, X.; Rasolofondraibe, L.; Boujelben, A.; Kilundu, B. Modeling Impulsive Ball Mill Forces Effects on the Dynamic Behavior of a Single-Stage Gearbox. Machines 2022, 10, 226. [Google Scholar] [CrossRef]
- Pennestri, E.; Freudenstein, F. The Mechanical Efficiency of Epicyclic Gear Trains. J. Mech. Des. 1993, 115, 645–651. [Google Scholar] [CrossRef]
- Pennestri, E.; Valentini, P.P. A Review of Formulas for the Mechanical Efficiency Analysis of Two Degrees-of-Freedom Epicyclic Gear Trains. J. Mech. Des. 2003, 125, 602–608. [Google Scholar] [CrossRef]
- Farrell, L.C.; Holley, J.; Bluethmann, W.; O’Malley, M.K. Cycloidal Geartrain In-Use Efficiency Study. In Proceedings of the 42nd Mechanisms and Robotics Conference, Quebec City, QC, USA, 26–29 August 2018. [Google Scholar] [CrossRef] [Green Version]
- Sensinger, J.W. Efficiency of High-Sensitivity Gear Trains, Such as Cycloid Drives. J. Mech. Des. 2013, 135, 071006. [Google Scholar] [CrossRef]
- Wang, R.; Gao, F.; Lu, M.; Liu, T. Meshing Efficiency Analysis of Modified Cycloidal Gear Used in the RV Reducer. Tribol. Trans. 2019, 62, 337–349. [Google Scholar] [CrossRef]
- Lee, K.; Hong, S.; Oh, J.H. Development of a Lightweight and High-efficiency Compact Cycloidal Reducer for Legged Robots. Int. J. Precis. Eng. Manuf. 2019, 21, 415–425. [Google Scholar] [CrossRef]
- Matejic, M.; Blagojevic, M.; Cofaru, I.I.; Kostic, N.; Petrovic, N.; Marjanovic, N. Determining efficiency of cycloid reducers using different calculation methods. In MATEC Web of Conferences, Proceedings of the 9th International Conference on Manufacturing Science and Education—MSE 2019 “Trends in New Industrial Revolution”, Sibiu, Romania, 5–7 June 2019; EDP Sciences: Ulys, France, 2019; Volume 290. [Google Scholar] [CrossRef] [Green Version]
- Tuttle, T.; Seering, W. A nonlinear model of a harmonic drive gear transmission. IEEE Trans. Robot. Autom. 1996, 12, 368–374. [Google Scholar] [CrossRef]
- Zhang, H.; Ahmad, S.; Liu, G. Modeling of Torsional Compliance and Hysteresis Behaviors in Harmonic Drives. IEEE/ASME Trans. Mechatron. 2015, 20, 178–185. [Google Scholar] [CrossRef]
- Wang, C.; Wang, S.R.; Wang, G.Q. A method for calculating gear meshing efficiency by measured data from gear test machine. Measurement 2018, 119, 97–101. [Google Scholar] [CrossRef]
- Lee, D.H.; Ahn, J.W. Dual Speed Control Scheme of Servo Drive System for a Nonlinear Friction Compensation. IEEE Trans. Power Electron. 2008, 23, 959–965. [Google Scholar] [CrossRef]


Publisher’s Note: MDPI stays neutral with regard to jurisdictional claims in published maps and institutional affiliations. |
© 2022 by the authors. Licensee MDPI, Basel, Switzerland. This article is an open access article distributed under the terms and conditions of the Creative Commons Attribution (CC BY) license (https://creativecommons.org/licenses/by/4.0/).