Article

Application of a Model-Based Method to the Online Detection of Rotating Rectifier Faults in Brushless Synchronous Machines

1
Electrical Engineering Department, E.T.S. Ingenieros Industriales, Universidad Politécnica de Madrid, 28006 Madrid, Spain
2
Energy and Fuels Department, E.T.S. Minas y Energía, Universidad Politécnica de Madrid, 28003 Madrid, Spain
*
Author to whom correspondence should be addressed.
Machines 2023, 11(2), 223; https://doi.org/10.3390/machines11020223
Submission received: 9 January 2023 / Revised: 31 January 2023 / Accepted: 1 February 2023 / Published: 3 February 2023

Abstract

:
Converters are one of the most sensible components of any power conversion system when it comes to electrical faults. Moreover, if these converters are used in a rotating system, as is the case with rotating rectifiers used in brushless synchronous machines, apart from also being exposed to mechanical effects and thus having a greater likelihood of failure, no access is available directly, causing a lack of available measurements for condition monitoring. This paper applies a model-based method to the online detection of open-diode faults, shorted-diode faults and exciter open-phase faults in the rotating rectifiers of brushless synchronous machines. The applied method relies on the comparison between the measured and the theoretical exciter field currents, the latter computed through a healthy machine model from the machine actual output values. The proposed protection strategy stands out for its computational simplicity and its non-invasiveness, which makes its industrial application straightforward without the need of any further equipment or adaptation. Its applicability has been verified through a double approach, on the one hand, through computer simulations, and, on the other hand, through experimental tests, achieving satisfactory results. The research conducted proves that with the proposed method, given reasonable measurement and model estimation typical errors of less than 5%, positive differences between the measured and the theoretical exciter field currents of more than 13%, 200% and 30% for open-diode faults, shorted-diode faults and exciter open-phase faults, respectively, are detectable with at least a 95% confidence interval.

1. Introduction

Brushless synchronous machines (BSM) have a consolidated role as electrical machines used for power generation and they are one of the most deployed technologies in small to medium generation sets in the industry. BSM power generation technologies are nowadays extended to a broad scope of applications in which the speed of dynamic response (AVR response and de-excitation capability) is not a tight requirement, such as standby back-up power generators, marine shipboard power generators, locomotive power generators, power supply systems for the oil and gas industry [1], uninterruptible power supply systems (UPS), etc. Furthermore, the scope of use of BSM includes the applications in which brush-slip ring sliding contacts are avoided, such as potentially explosive atmospheres.
Although static excitation still remains as the main technology choice when fast dynamic response or high initial response is desired, especially for large generators [2], some technical advances have enabled to place BSM as an alternative to static excitation, overcoming safety and maintenance issues related to brush-rings sliding and to spark production. These technical advances [3] include new embedded BSM topologies that allow the achievement of more compact systems, new types of rotor signal wireless communication technologies that enable better measurements of rotating field quantities and more reliable excitation control through remote-controlled power electronics, or new de-excitation systems [4] that make it possible to bring the dynamic response closer to the one achieved in static excitation.
The most basic and common structure of any BSM topology [5,6] is represented in Figure 1. These systems generally consist of two synchronous machines, on the one hand, an exciter machine, and, on the other hand, the main machine excited by the former one. Between the output of the exciter and the field winding of the main machine, a full-wave three-phase rotating diode rectifier is installed. The exciter armature, the rectifier and the field winding of the main machine rotate jointly on the same shaft, thus there is no access possible to these elements for monitoring purposes.
Industry standards for AC power generators include minimum requirements regarding electrical fault protection [7]. In the case of BSM, different types of faults may occur throughout the excitation system. Because the most characteristic element in BSM is the rotating rectifier, specific consideration shall be given to diode faults [8,9], which have been reported to be frequent in the industry. These faults are habitually fast, usually either as a consequence of a shock coming from the grid side of the machine or as a result of the semiconductor service life end.
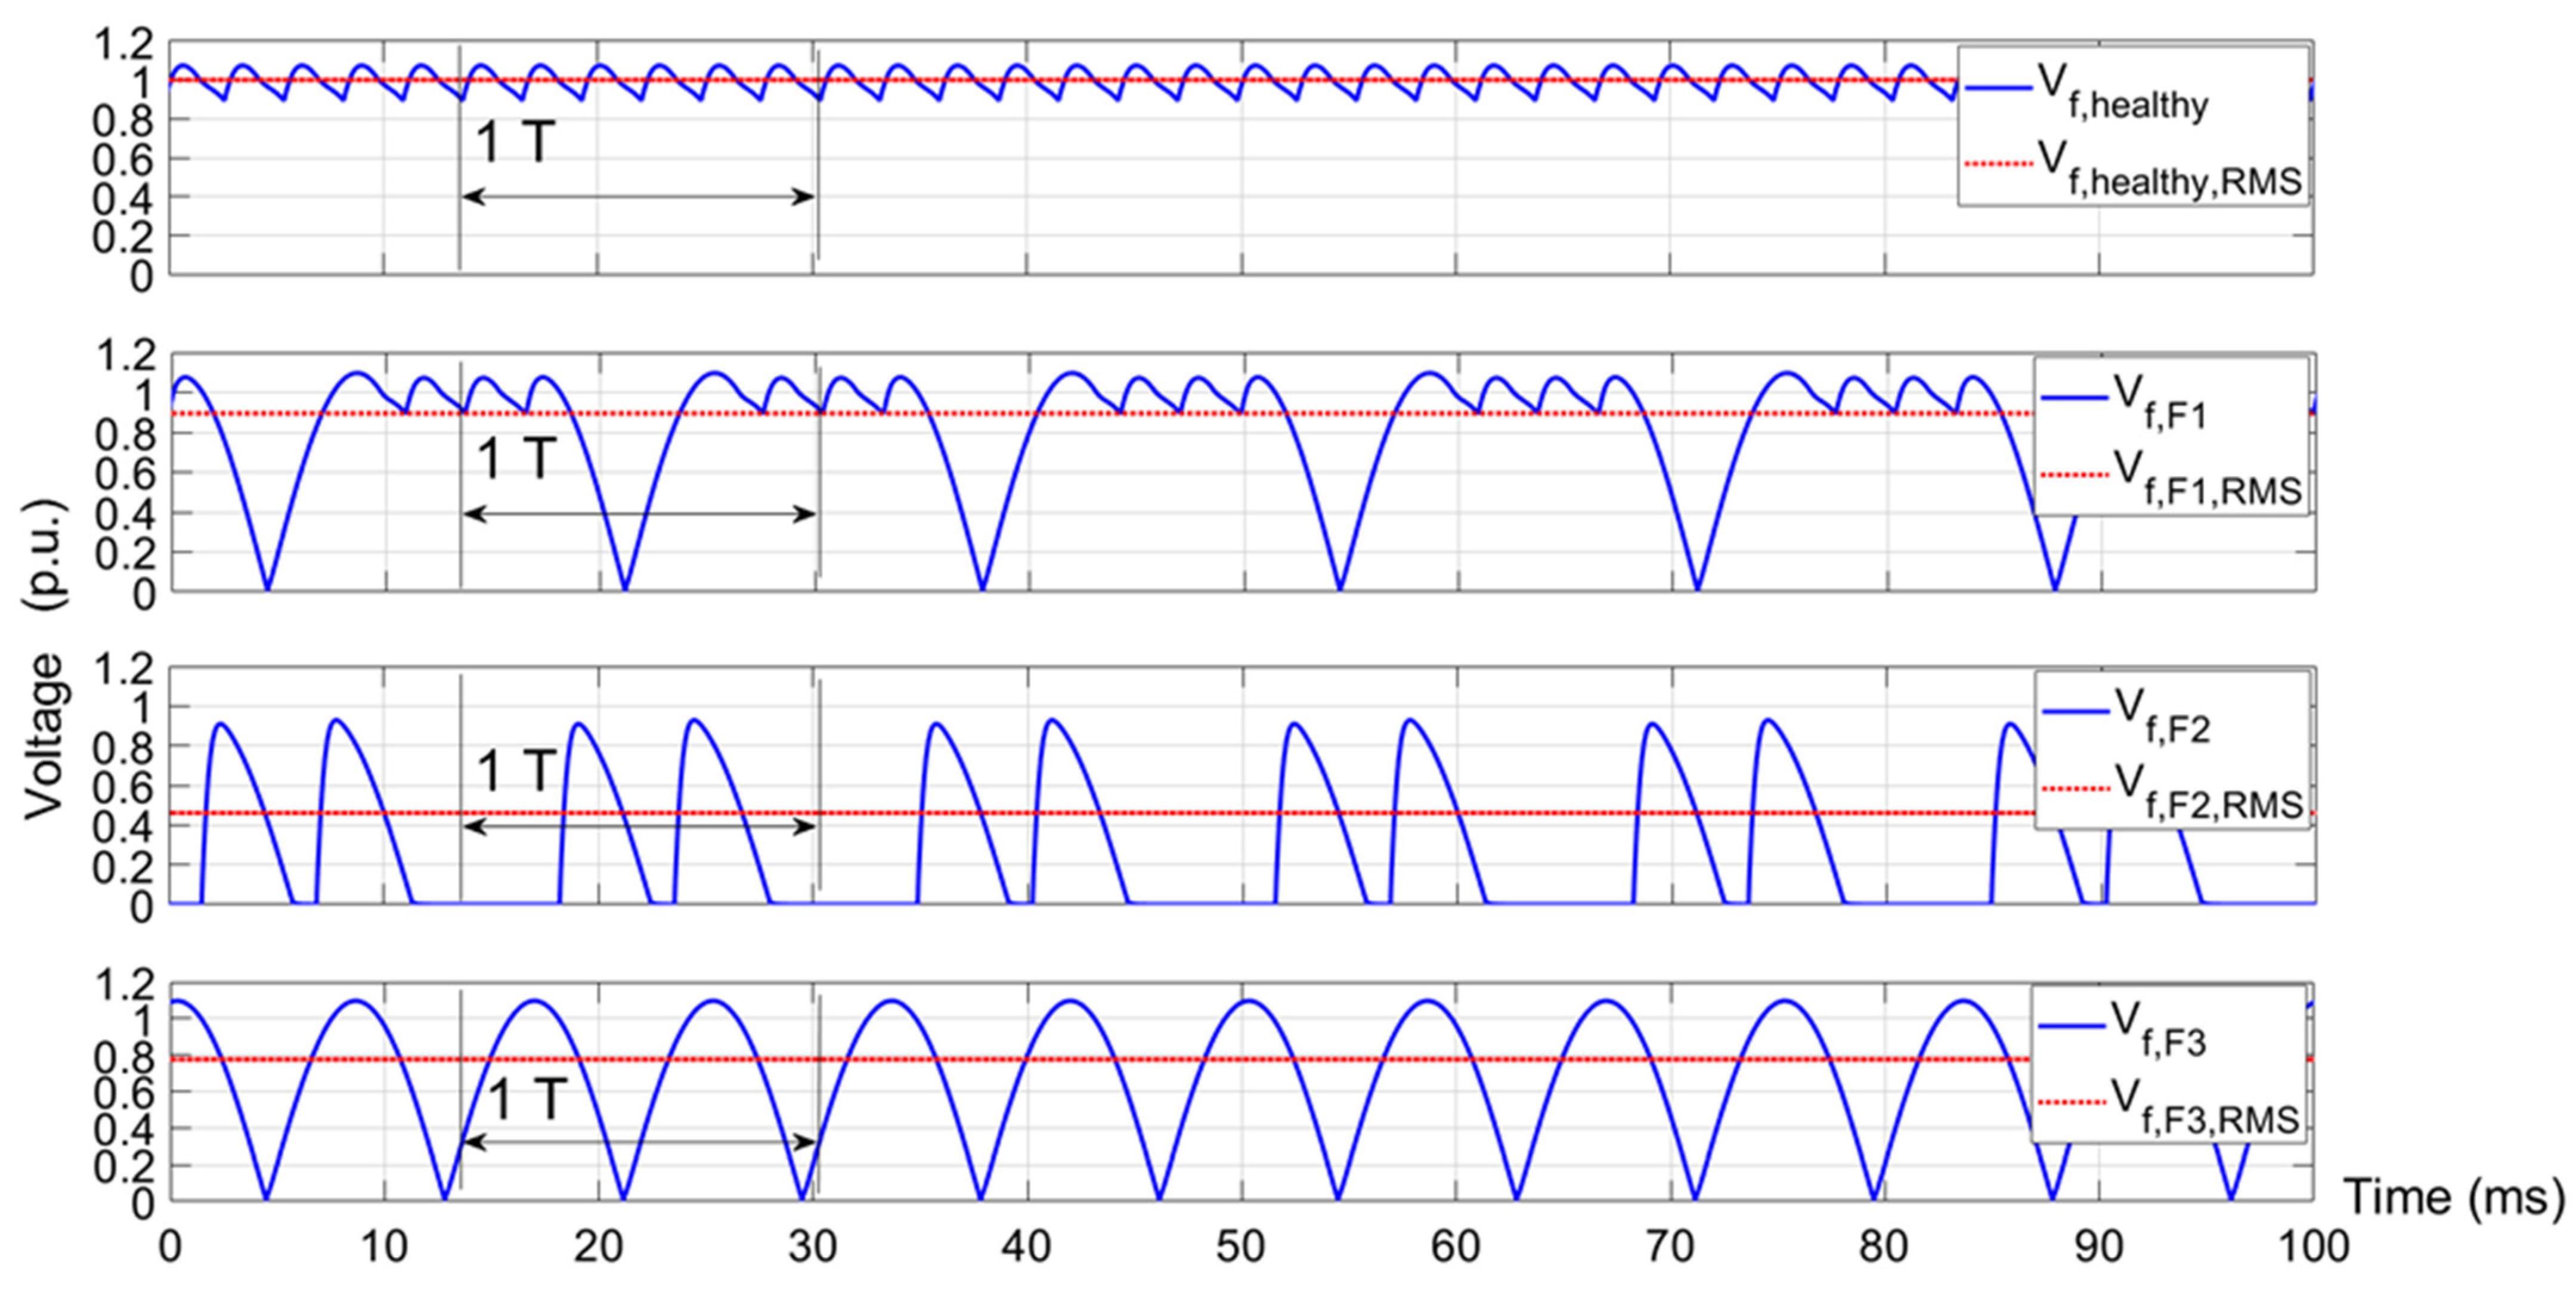
Regarding open-diode faults (F1 in Figure 1), although the machine is able to maintain the output values, its transient capacity is concerned. There is a risk that persists which is a second fault of the same type taking place in the same faulty leg. The rectification output is degraded because the ripple is increased as shown in Figure 2 (Vf,F1 waveform, with Vf,F1,RMS ≈ 0.8945 · Vf,healthy,RMS DC average value).
In the case of shorted-diode faults (F2 in Figure 1), these provoke sequential phase-to-phase armature winding short-circuits between the affected diode phase and the adjacent healthy ones in the faulty half side of the rectifier. This implies an overload for the exciter. The rectifier output is degraded as represented in Figure 2 (Vf,F2 waveform, with Vf,F2,RMS ≈ 0.4610 · Vf,healthy,RMS DC average value).
Also, a broken or loose connection which puts an entire branch of the rectifier out of service represents a fault that shall be addressed, under the designation of open-phase faults (F3 in Figure 1). The degradation of the rectifier output due to the increased ripple is also shown in Figure 2 (Vf,F3 waveform, with Vf,F3,RMS ≈ 0.7754 · Vf,healthy,RMS DC average value).
In any of the previous fault cases (F1, F2 or F3), if the machine runs on voltage regulation, the Automatic Voltage Regulator (AVR) compensates for the degraded machine output originated from the excitation output degradation through the increase in the exciter excitation current [10,11], so as to maintain the same average level of the DC rectifier output and to thereupon maintain the same main field value.
The variety of rotating rectifier fault detection methods is large. The most common offline methodology involves disassembling the machine to measure the health of each diode and to check the connections. The most significative online approaches are based on the analysis of externally available electrical signals (machine output voltage/current and exciter field voltage/current) or, alternatively, mechanical, acoustic or thermal signals. Although these methods have advantages mainly related to their non-invasiveness and their reliability, they have a high computational complexity and cost.
On the one hand, regarding externally available electrical signals, in reference [12] it is presented that open-diode faults and shorted-diode faults give out different output voltage harmonic spectrum patterns. In this sense, the actual condition of the rotating rectifier was monitored through the characteristic frequencies used as indicators, largely the sixth harmonic, and also open-circuit and shorted-diode faults were distinguished using the amplitude ratios between certain harmonics as indicators. In reference [13], the relative wavelet energy tool together with statistical properties was also applied to the output voltage waveform and the k-nearest neighbors method (KNN) was used to classify the faults.
Further regarding externally available electrical signals, most of these are not suitable to detect faults in environments with electrical noise, which is not in the matter of the exciter field current and of the output current [14]. The exciter field current waveform is an appropriate one for diode fault detection as described in reference [15]. The well-known detection method proposed in reference [15] shall be specifically mentioned on the basis of the ratio between the fundamental harmonic component and the exciter field current DC content. Reference [16] monitors the second harmonic content as an indicator for diode failure faults. In reference [17], its FFT components are deeply learned and Euclidean distance calculation is used for fault detection. In the case of reference [18], voltage-behind-reactance (VBR) is used as a basis to develop a fault detection method, which also goes through the harmonic analysis of the exciter field current.
As any of the aforementioned approaches that analyze the exciter field current harmonic content may lose information about fault location, in order to acquire information about the fault’s location, fault features of the exciter rotor current were studied in reference [19] and, consequently, the ratio of the second harmonic to the fundamental of the restructured exciter rotor three-phase currents was used to detect diode failure faults. Other novel alternatives to harmonic-based approaches related to the exciter field current include the use of fractal theory and dynamics of the signal [20].
On the other hand, other alternative non-electrical signal analysis methods have been put forward as well to detect rotating diode failure faults. In reference [21], the KNN supervised classification method is applied to the wavelet transform of acoustic signals in order to recognize healthy and faulty conditions. In reference [22], the support vector machine classification method (SVM) is applied to the discrete wavelet transform of vibration signals. Finally, in reference [23], KNN and SVM classification methods are applied to the wavelet components of features from thermal images.
Another common online approach to the detection of diode failures is based on airgap flux analysis. Developed on the characteristics of the frequency components of the induced e.m.f. at a search coil situated at the stator slots of the exciter machine, a design of a classifier was proposed in reference [24] through the use of the KNN method. In reference [25], the installation of a coil on the exciter stator yoke is proposed in order to discern open-diode faults using the rotational frequency of the electromotive force (e.m.f.) induced in the coil. Nevertheless, although airgap flux techniques are highly accurate and reliable, they are substantially invasive, they impose installation and machine design constraints and they are ineffective in terms of computational complexity and costs.
To the same purpose, stray flux-based approaches have been developed. In reference [26] it is proven that because the stray flux components related to the exciter frequency increase when compared to healthy conditions, diode failure faults are subject to detection. In reference [27], the e.m.f. induced at a search coil located near the frame of the machine is subject to spectral analysis. Although stray flux techniques are simple and non-invasive, their main limitations consist of their low accuracy level and their computational complexity and cost.
A summary of the mentioned signal analysis-based techniques is displayed in Table 1. Apart from the different approaches based on signal analysis, condition monitoring through model-based strategies is a trend. Model-based condition monitoring approaches are hypothesized to be the more suitable for protection the more precise the model built is. In this regard, the exciter models presented in references [28,29,30,31] are considered a primary step for protection scheme design. Furthermore, a numerical model was used in reference [32] based on 2D finite element analysis, although the FFT had to be performed on the output voltage.
In the interest of overcoming the sluggishness of the methods based on signal analysis that are largely due to information acquisition and data processing times, and also in the interest of overcoming their limitations regarding rapid dynamic faults, it is believed that the current state-of-the-art method has scope for fast model-based condition monitoring techniques [33].
This paper applies a verified BSM model [34] to develop a novel online rotating rectifier fault detection method, which is based upon the comparison between the actual and the theoretical exciter field currents, the latter being computed from the machine output values through the healthy BSM model, at any monitored steady point. The rotating rectifier faults that have been addressed in this work are open-diode faults, shorted-diode faults and open-phase faults. This work notably expands model-based BSM protection technique capability. The main advantage of the proposed detection method is that, once the machine parameters that are required as inputs to build the theoretical model are known—for example through standard testing of the machine [35]—the computational complexity that arises from the algorithm in use is very low when compared to other approaches and, more specifically, to other model-based methods. Moreover, the method is characterized by the non-intrusiveness property. The needed inputs are already ordinarily monitored variables in the industry, without need of any additional equipment or adaptation, which makes its industrial application straightforward.
The mentioned computational simplicity makes reliable real-time condition monitoring and fault diagnostics possible. The detection method is suitable as a first online diagnostic approach before shifting to other techniques. The paper also consequently proposes a specific protection method regarding rotating rectifier faults.
In order to corroborate the method, on the one hand, computer simulations have been conducted, and, on the other hand, a large variety of experimental healthy and faulty condition tests have been carried out on a specific laboratory test bench.
This paper describes the principles of the applied method in Section 2. Section 3 and Section 4 are dedicated, respectively, to the computer simulations and to the experimental testing. Finally, in Section 5, conclusions are put forward pointing out the main contributions of this work.

2. Description of the Fault Detection Method

A simplified representation of the applied fault detection and of the proposed protection features is shown in Figure 3.
The proposed fault detection method is based upon the fact that in the event of an electrical fault in the rotating rectifier, if voltage regulation is performed, the AVR will provide a higher excitation current compared to the one needed in theoretical healthy conditions, for the sake of maintaining the same machine operating setpoint. The later theoretical current is computed through a healthy machine model developed in reference [34]. Nevertheless, if excitation is not controlled automatically but manually, as happens to be the case in Section 4, the method is equally applicable as the drop in the reactive power output defines a new faulty operation point.
The inputs that the model needs in order to perform the detection consist of discrete measurements of variables that are usually already monitored in the industry. These inputs consist, on the one hand, of the machine output measurements, physically acquired through measurement of voltage transformers (PT) and current transformers (CT), as a combination of at least three:
Basic variable measurements: Phase voltage (UA and/or UB and/or UC) and/or line current (IA and/or IB and/or IC). Alternatively, line voltage (UAB and/or UAC and/or UBC) can be utilized in place of phase voltage.
Derived variable measurements: Active power (P) and/or reactive power (Q). Eventually, apparent power (S) can be utilized as a substitute for either P or Q.
An example of inputs that entirely define an operating point would be (UAB, P, Q) as one of the possible combinations. In Figure 3, PTs and CTs for voltage and currents in each of the phases have been represented as a possible exhaustive physical realization of the method.
On the other hand, the other input measurement required to apply the method consists of the exciter field current (Ie,mea). In Figure 3, the measuring device that has been represented is a DC current shunt, although a Hall effect sensor or other measurement technique could be used instead.
First, the value of the theoretical exciter field current (Ie,cal) is estimated using the healthy condition model, for any actual operating point of the machine, through the following steps:
  • First stage: Main machine.
The theoretical field current value for the main machine (If,cal) is computed by means of standard methods. If the ASA method is applied [35], the following equation deduced from the corresponding phasor composition provides the desired estimation:
I f , cal =   Δ I f + [   ( m airgap ) 1 ·   U + ( m sc ) 1 ·   I · sin φ   ] 2 + [ ( m sc ) 1 ·   I · cos φ ] 2  
where: term   ( m airgap ) 1 ·   U stems from the airgap line of the machine, given its slope value   m a i r g a p and the actual machine output voltage value ( U ) considered as if it was delivered at no-load conditions with no saturation.
Terms ( m sc ) 1 ·   I · sin φ and ( m sc ) 1 ·   I · cos φ stem from the short-circuit characteristic of the machine, given its slope value m s c and the actual machine output current ( I ), therefore considering the armature reaction and the voltage drop at the Potier reactance (Xp). In order to perform the phasor sum with the previous term, the power factor angle ( φ ) shall be used:
φ =   arccos [   P U · I   ] = arcsin [   Q U · I   ] = arctan [   Q P   ]
Term Δ I f represents the additional need of equivalent field current to overcome saturation and it is calculated as the difference for the actual delivered e.m.f. ( E r ) between the no-load saturation characteristic and the airgap line, i.e.,   ( m airgap ) 1 ·   E r , where:
E r = [ U +   I · X p · sin φ   ] 2 + [   I · X p ·   cos φ ] 2  
2.
Rectifier stage relationship.
The theoretical output r.m.s. current of the exciter (Iout,cal) is computed from If,cal by means of a well-known relationship with the full-wave uncontrolled rectifier. The following equation gives out the value of Iout,cal from If,cal, while Equation (5) gives out the theoretical exciter output r.m.s. line voltage value (Uout,cal) from Iout,cal:
I out , cal = 1 2 π · [ 0 4 π 6 ( I f , cal ) 2 d ( ω t ) + 6 π 6 10 π 6 ( I f , cal ) 2 d ( ω t ) ] =   I f , cal · 1 2 π · [ 4 π 6 + 4 π 6 ] = I f , cal · 2 3
3.
Second stage: Exciter.
This step is brought down to the application of a linear relation between Ie,cal and Iout,cal, which can be obtained through a healthy condition test. This is because the constant equivalent impedance (Z) property is applied in magnitude and in phase, given the load connected to the exciter, at the fundamental frequency. The mentioned impedance is written as follows:
Z = | Z | φ e = U out , cal 3 I out , cal
It shall be noted that the abovementioned linearity is applicable when the exciter runs under linear conditions, which is usually the case in the industry, where these machines are oversized in order to avoid saturation, even if the main machine is overloaded. If this is not the case, this simplification could not be applied, and the analogous ASA development for the main machine should be carried out for the exciter.
Finally, parameter r consists of the ratio between Ie,mea and the one that would be necessary to provide if the rectifier was in healthy conditions for the same actual operating point (Ie,cal). If Ie,mea > Ie,cal, then r > 1 and abnormal operation conditions can be deduced.
r = I e , mea I e , cal
If the AVR is in operation, in case of a rectifier fault, it seeks to compensate for the degraded rectifier output, so as to maintain the same average level of the DC rectifier output and to thereupon maintain the same main field value. A gap-up in Ie,mea would be observed while Ie,cal would stay constant given that the machine operating setpoint does not vary. Therefore, in faulty conditions, r > 1.
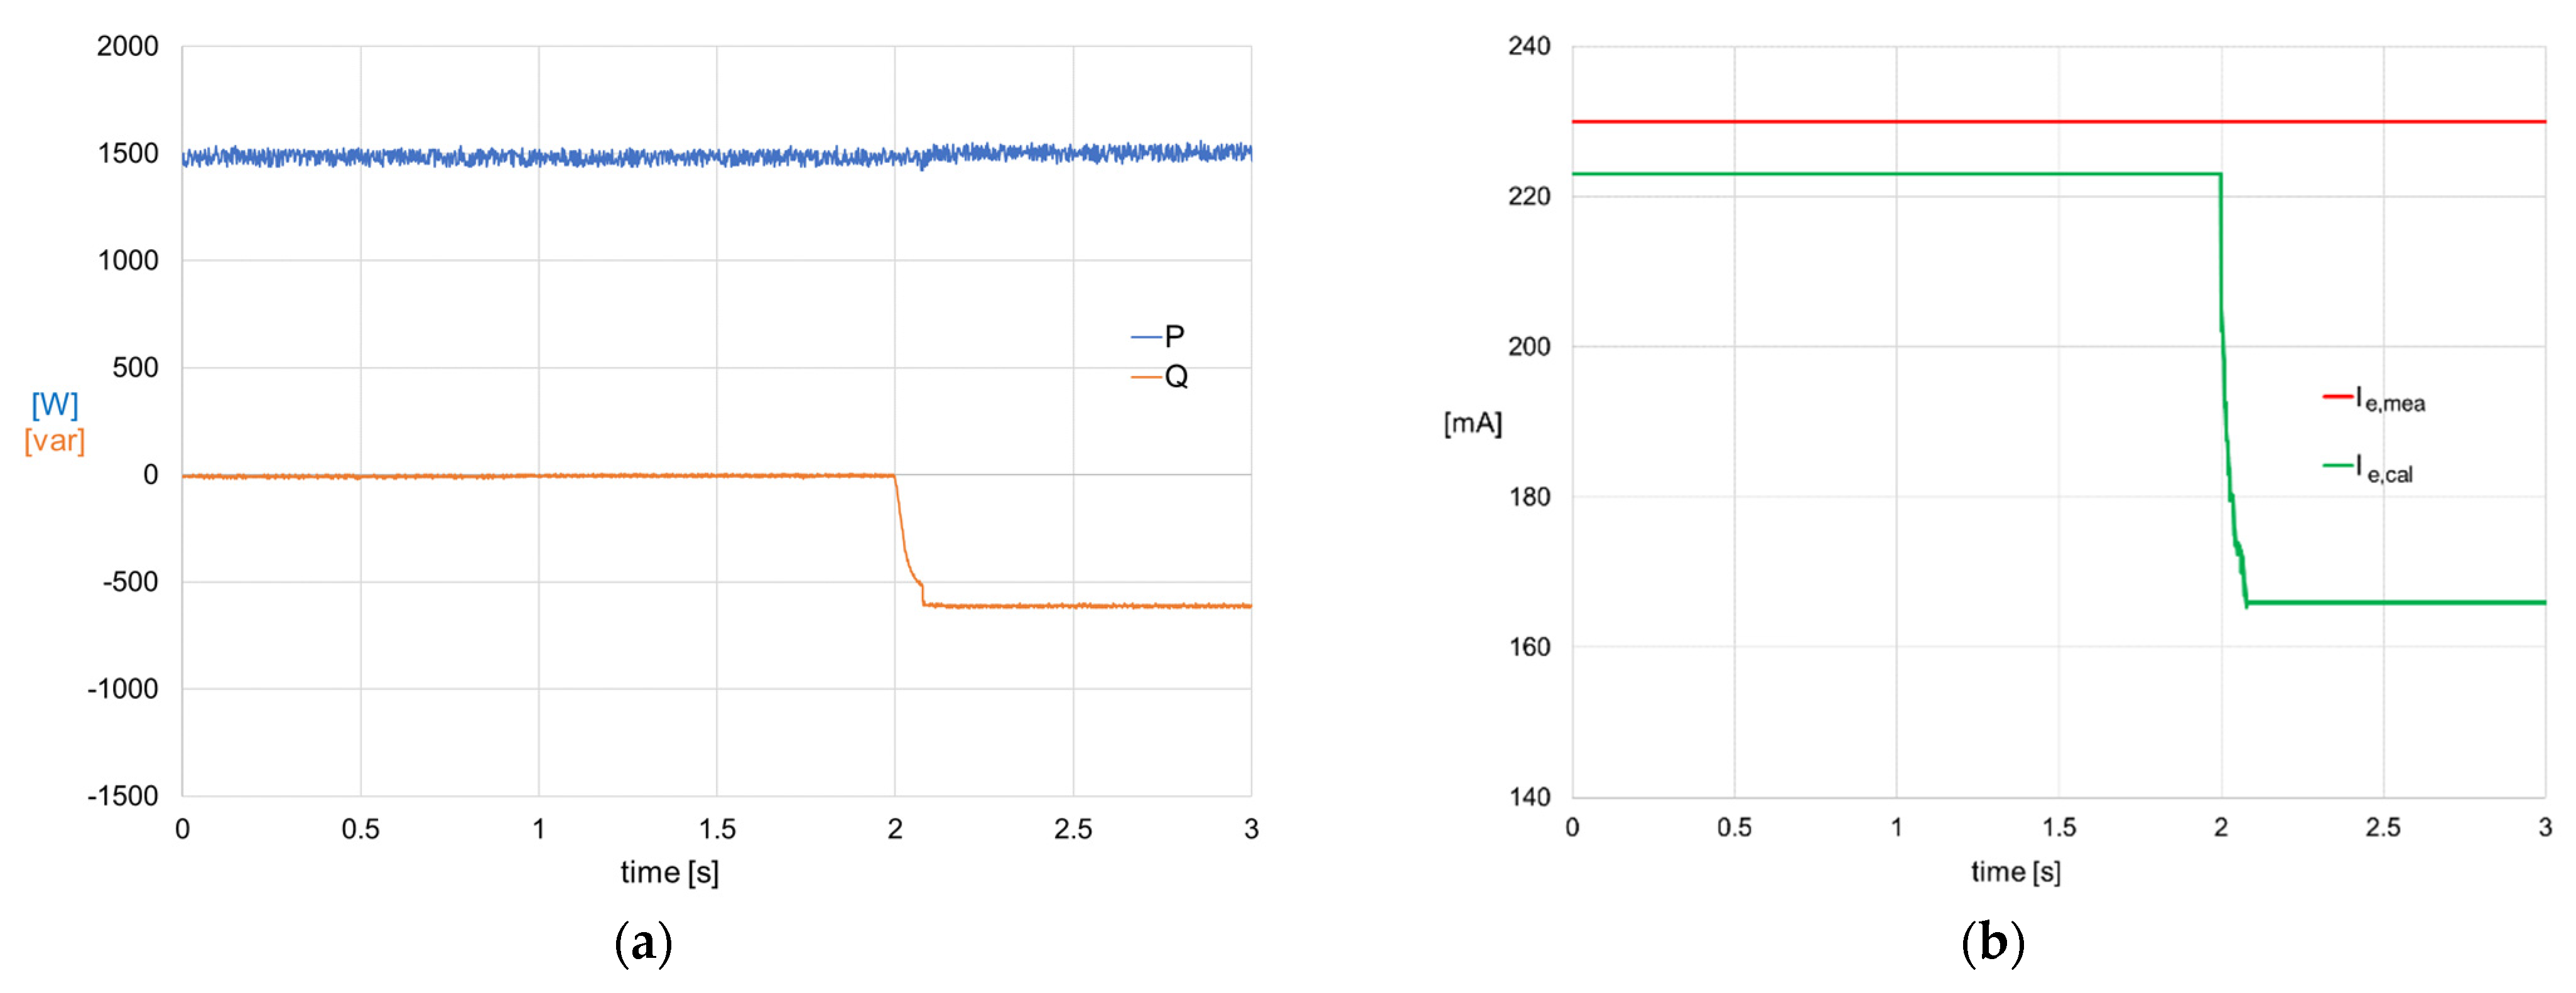
On the contrary, if the machine does not run on automatic excitation, a drop in Q would be observed after a rectifier fault occurs. In this case, Ie,mea would remain invariable while Ie,cal would experiment a gap down given that the new operating point with lower Q would be considered as an input to compute the new theoretical value. Therefore, in faulty conditions, r > 1 as well. Consequently, the method is equally applicable for manual mode excitation.
It shall be noted that these faults are unequivocally recognized as any healthy-to-faulty transition. Specific characteristic increments of the difference between Ie,mea and Ie,cal are attained with a steep transitory evolution.
If r > k, several comparisons can be performed in order to discern the fault type. The setting of k shall consider the accuracy achieved in the theoretical estimation, particularly according to the precision of the measuring devices that provide its inputs, usually ranging from 1.02 (i.e., 2% full-scale error tolerance) to 1.05 (i.e., 5% full-scale error tolerance). The value is set at k = 1.05 for the experimental approach developed in Section 4. A warning, alarm, information or trip feature could be included in the case that r > k (output signal). Applying the factor of safety allows us to avoid, in normal conditions, inaccuracy issues leading to unwanted warnings, alarms, information or trips.
The comparison is performed with different thresholds (ri,inf to ri,sup for i = 1, 2 and 3), with r2,sup > r2,inf > r3,sup > r3,inf > r1,sup > r1,inf > k ≥ 0 for each of the faults (F1: open-diode fault; F2: shorted-diode fault; F3: open-phase fault) in order to trip when any of the faults is detected. Thresholds ri,inf and ri,sup may not necessarily be constant, as a possible realization of the method may include variable thresholds based upon the machine operating point. The method is especially conceived for steady operating points.
It is assumed that any of the sudden faults will be detected and would be a trigger, so multiple sudden fault combinations (multiple diode failures, diode failure with open phase, two open phases, etc.) are not considered.
The method allows to continuously monitor the health of the rotating rectifier, analyzing the evolution of the relative difference between the healthy theoretical exciter field current and the actual measured exciter field current, and identifying the step evolutions that derive from the mentioned binary type faults, i.e., only two states are possible: healthy or faulty.
For all features, constant time delay parameters or time-inverse delay characteristics (TON,i for i = 1, 2 and 3) shall be set, especially depending on the exciter capability to withstand each fault, in order to avoid false positives related to electromagnetic transitory environmental effects, among other factors.

3. Computer Simulations

3.1. Computer Simulation Model

As shown in Figure 4, a computer simulation model was built using Simulink® (The MathWorks, Inc., Natick, MA, USA). In the program, numerous simulation tests were run in healthy and faulty conditions (F1: open-diode faults; F2: shorted-diode faults; F3: open-phase faults) with the aim of evaluating, for different machine operating points, the functionality of the proposed detection method.
As represented in Figure 4, both machines, i.e., main machine and exciter, are mechanically coupled through the shaft speed, as it is the mechanical input parameter of the exciter. Speed regulation is performed through a diesel engine governor block that provides the total required mechanical power, while voltage regulation is performed automatically through an AVR block with the field voltage as an input of the exciter. Therefore, any of the rotating rectifier faults (F1, F2 and F3) imply a rise of the exciter field current (Ie) so as to remain at the same operating point. Operating points will be characterized in this section through the (U, P, Q) values.

3.2. Computer Simulation Verification

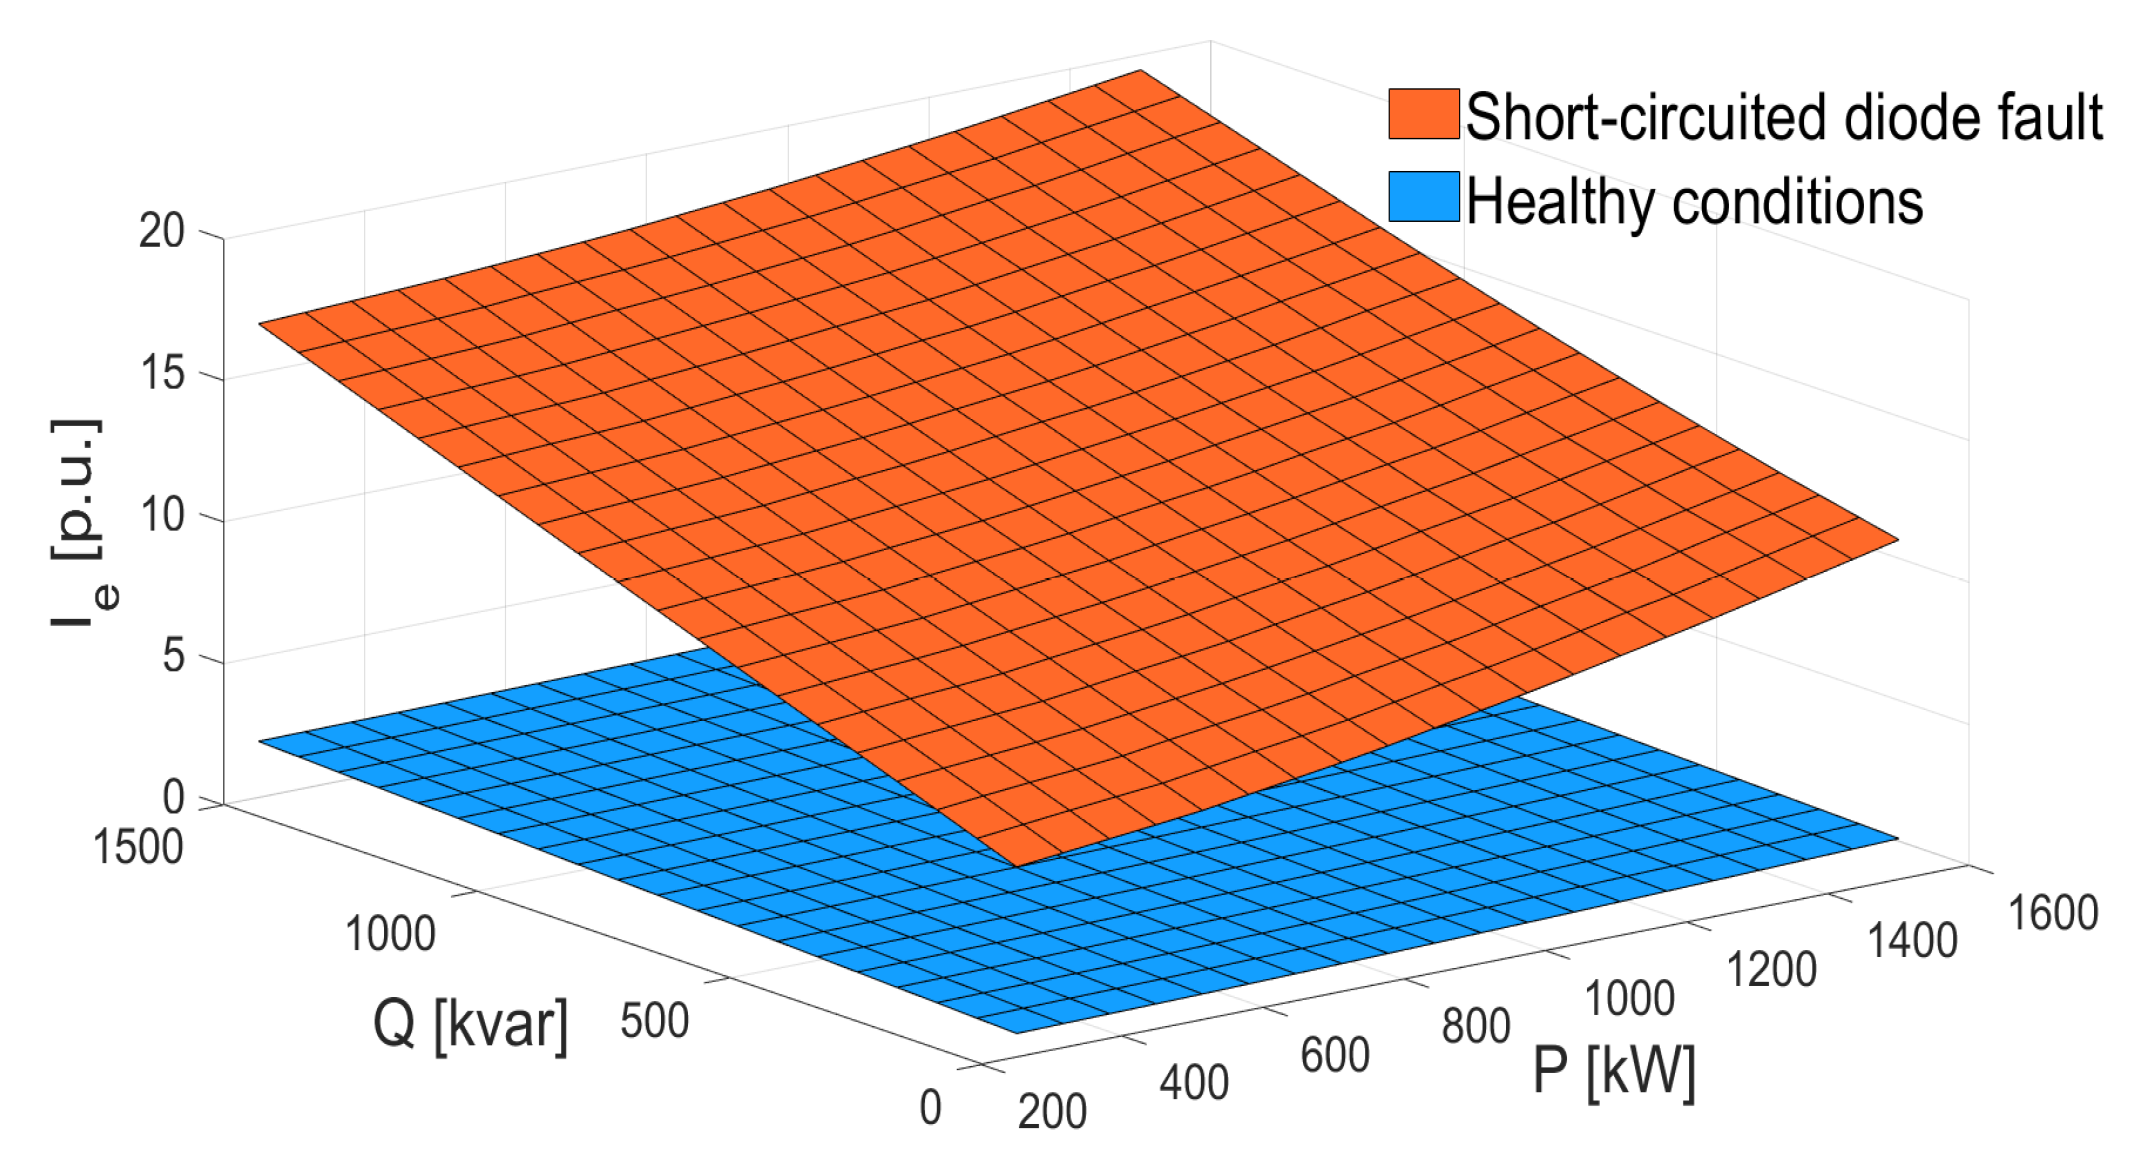
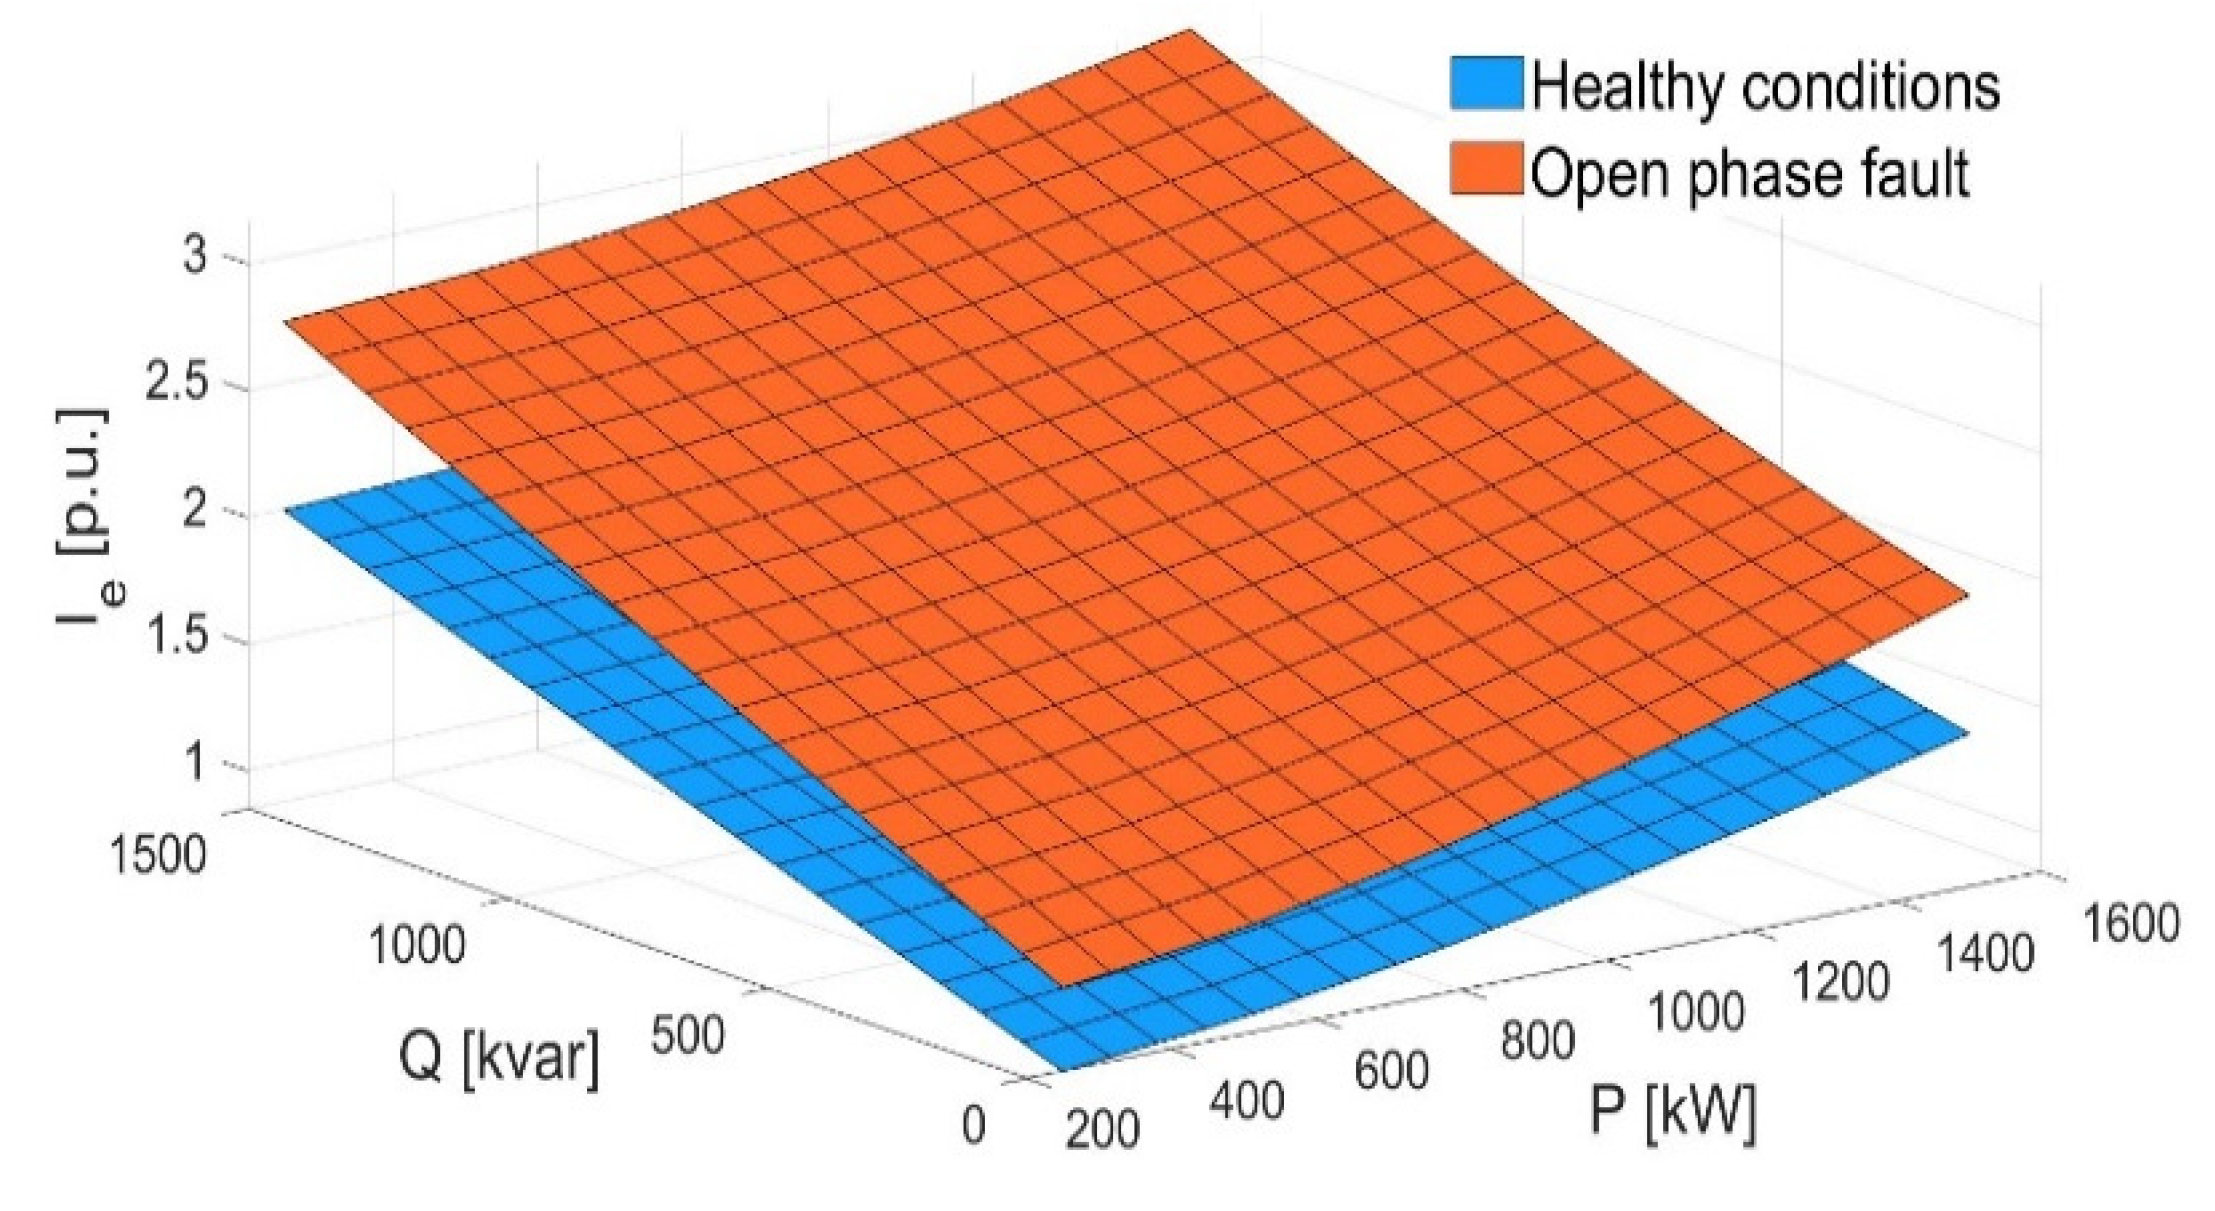
Simulations in the cases of open-diode fault (F1), shorted-diode fault (F2) and exciter open-phase fault (F3) are presented in Figure 5, Figure 6 and Figure 7, respectively. The value of Ie (per-unit, p.u.) is represented in each of the faulty condition cases, for different (P, Q) operating setpoints, at reference voltage (U = 400 V or 1 p.u.). Furthermore, the healthy case surface is shown as a reference in each of the figures.
As can be seen in Figure 5, Figure 6 and Figure 7, the gaps between the surfaces in faulty and healthy conditions allow a clear differentiation between each of the faulty cases and the common healthy case to be carried out. Therefore, these faults are unequivocally recognized when the AVR is in operation through the characteristic difference in the exciter field current between the healthy reference surface, which is intended to be estimated through the proposed method, and the faulty surface for each (P, Q) point.
Furthermore, the points on the faulty surfaces are attained via a step function, which means that from any healthy condition operating point, the characteristic stepwise increments can be recognized, making elementary the differentiation between the healthy conditions and the faulty conditions.
It is a notable fact that if the AVR was not in operation, the fault recognition would be based instead on characteristic drops of Q. For the same Ie, a new operating point would be attained with lower Q and on the corresponding faulty condition surface.

4. Experimental Tests

4.1. Experimental Test Bench

A standard procedure to test BSM was applied, which consisted of making the rectifier static by mounting temporary slip rings with the aim of having direct access for electrical measurement purposes in the elements that are ordinarily in a rotary regime [35]. A simple representation of the mentioned special setup is provided in Figure 8.
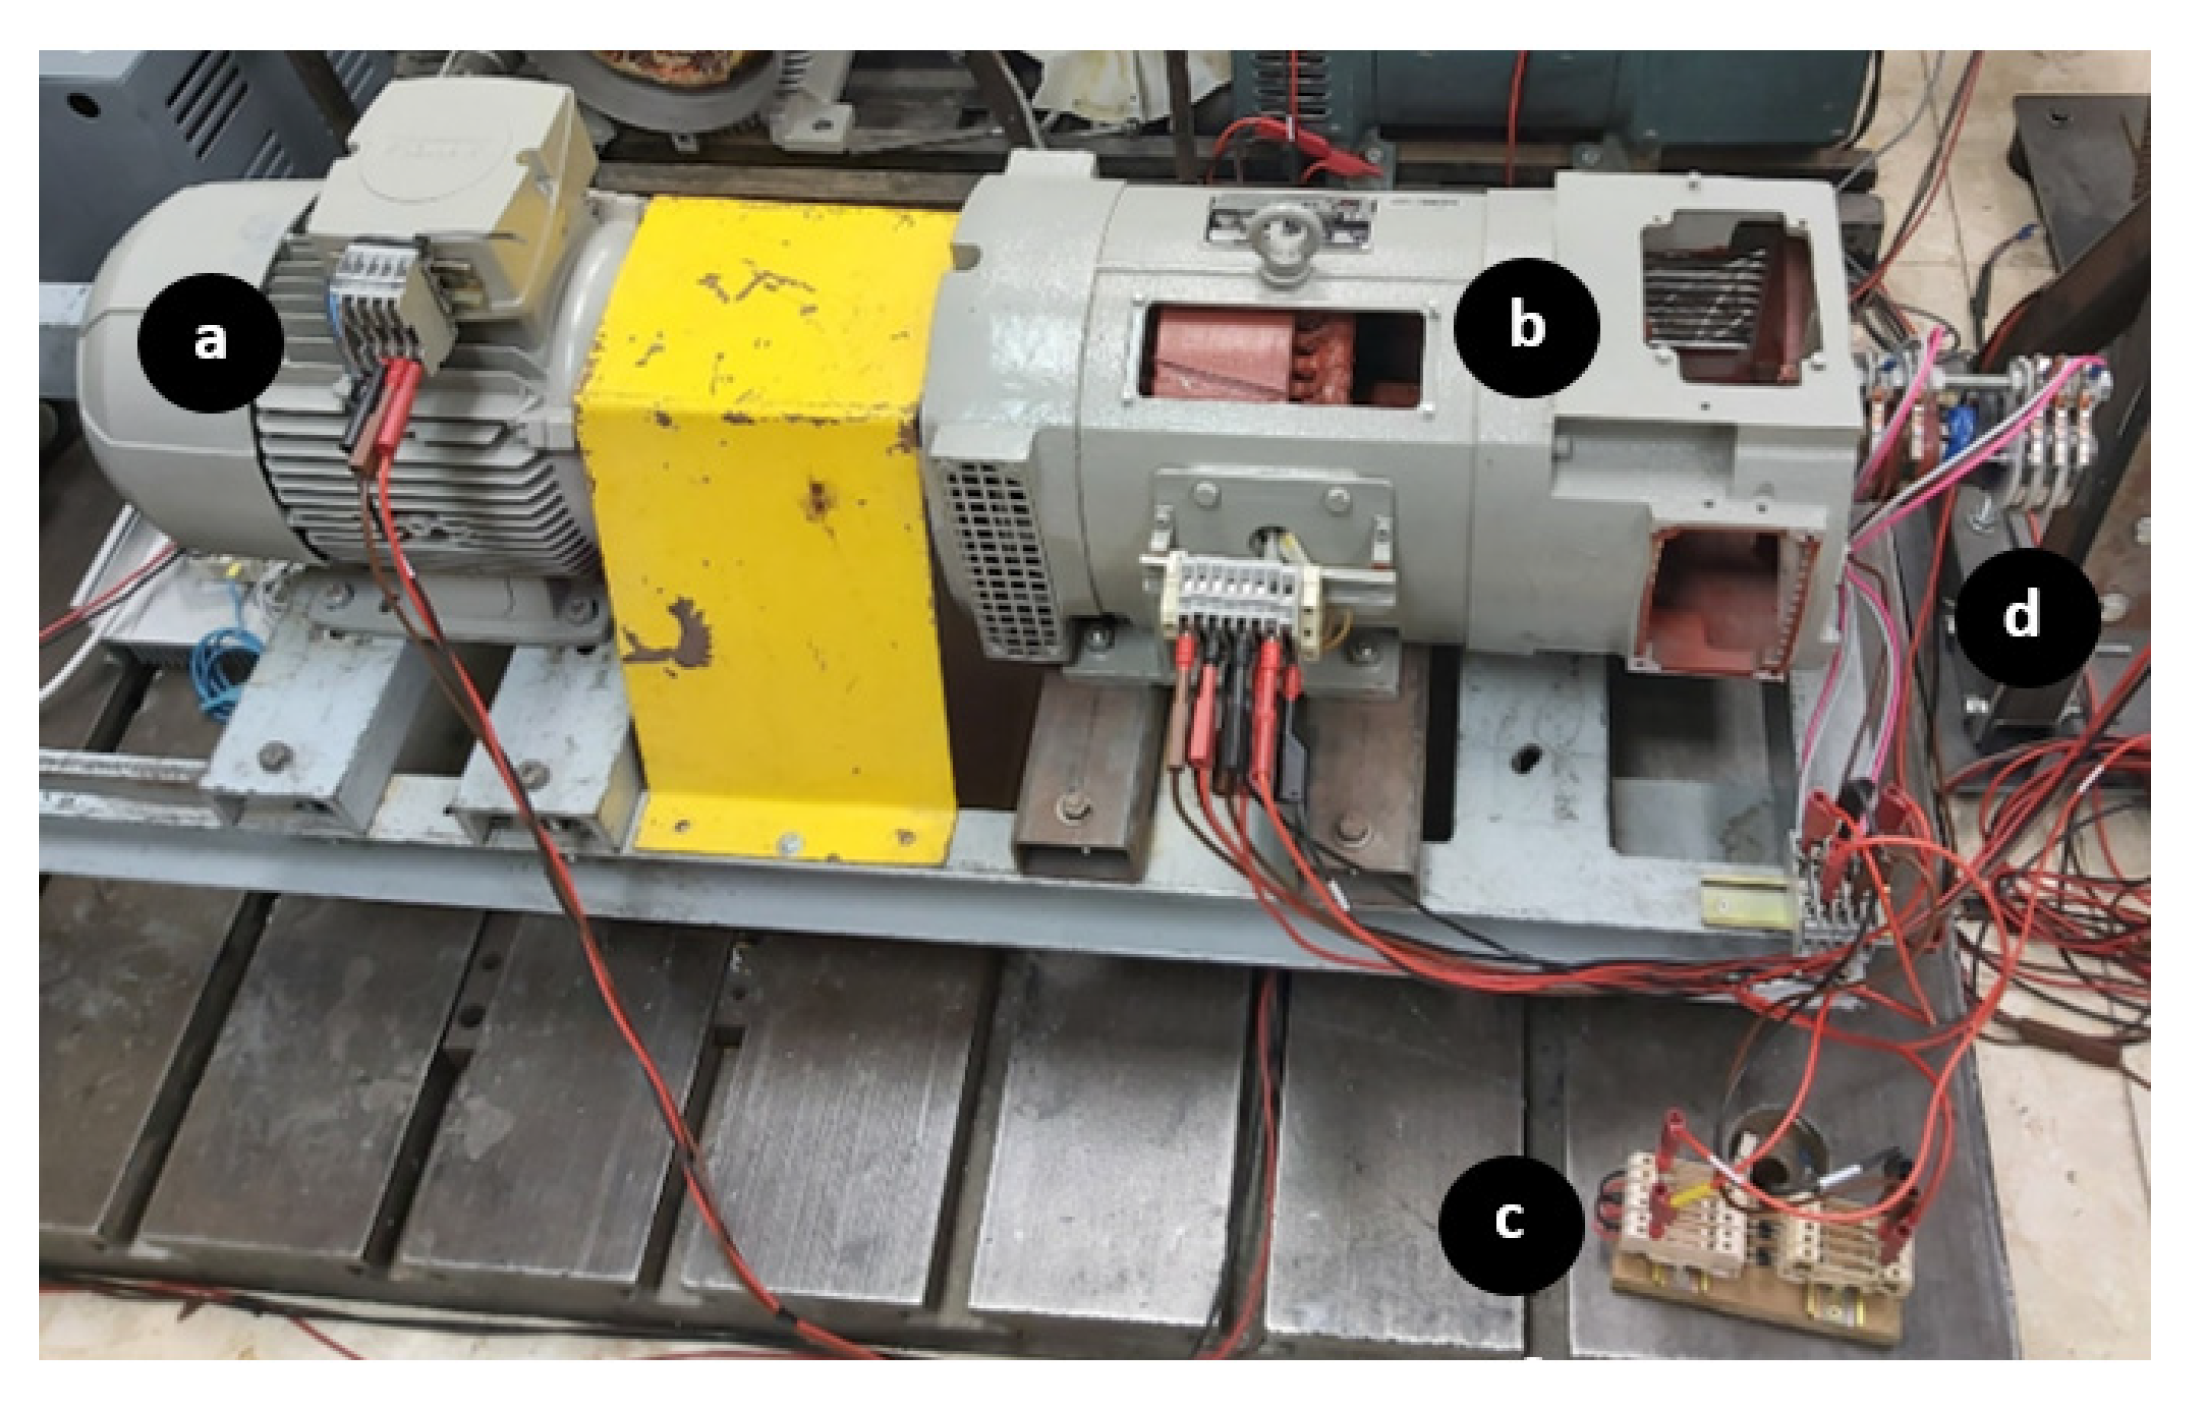
The experimental test bench, shown in Figure 9, is made up of the following elements on the same shaft: (a) a prime mover, consisting of an asynchronous motor controlled with a variable-frequency drive (VFD); (b) the BSM (exciter and main machine), which is excited by means of a variable DC power supply; (c) a static full-wave three-phase diode rectifier provided with sectional terminal blocks, situated between the AC output on the exciter side and DC input on the main machine side, both which have (d) brushes and slip rings installed. These elements find their correspondence also in Figure 8.
The connection of the machine to the grid is done through an autotransformer, which has the effect of having an adjustable AC busbar, i.e., the grid side voltage (U) can be altered. When the machine is synchronized with the grid, P and Q are, respectively, controlled independently through the VFD and the DC adjustable voltage supply.
Data about the main machine and the exciter on which the tests were performed are provided in Table 2 and Table 3, respectively.
The measuring devices that were installed have also been represented in Figure 8, as well as the data acquisition equipment that allows 455 measurements per second to be obtained via Arduino® (Arduino S.r.l. Genova, Italy) and computer data-logging. This equipment used to acquire the measurements is conventionally used in industrial noisy environments and it consists of:
  • Hall effect DC current sensor, in order to measure the exciter field current.
  • Three 10/5A current transformers (CT), compliant with EN-IEC 61869-2 standard, one per output phase.
  • Industrial programmable multi-transducer, compliant with EN-IEC 61000 standard regarding electromagnetic compatibility, with EN 60688 standard regarding electrical measuring transducers and with EN 55011 standard regarding radiofrequency disturbance.
The main characteristics of this equipment are summarized in Table 4, Table 5 and Table 6, respectively.
It shall be noted that in real case applications, the method is expected to give better results than in the laboratory because current transformers used in large power generators have better accuracy.
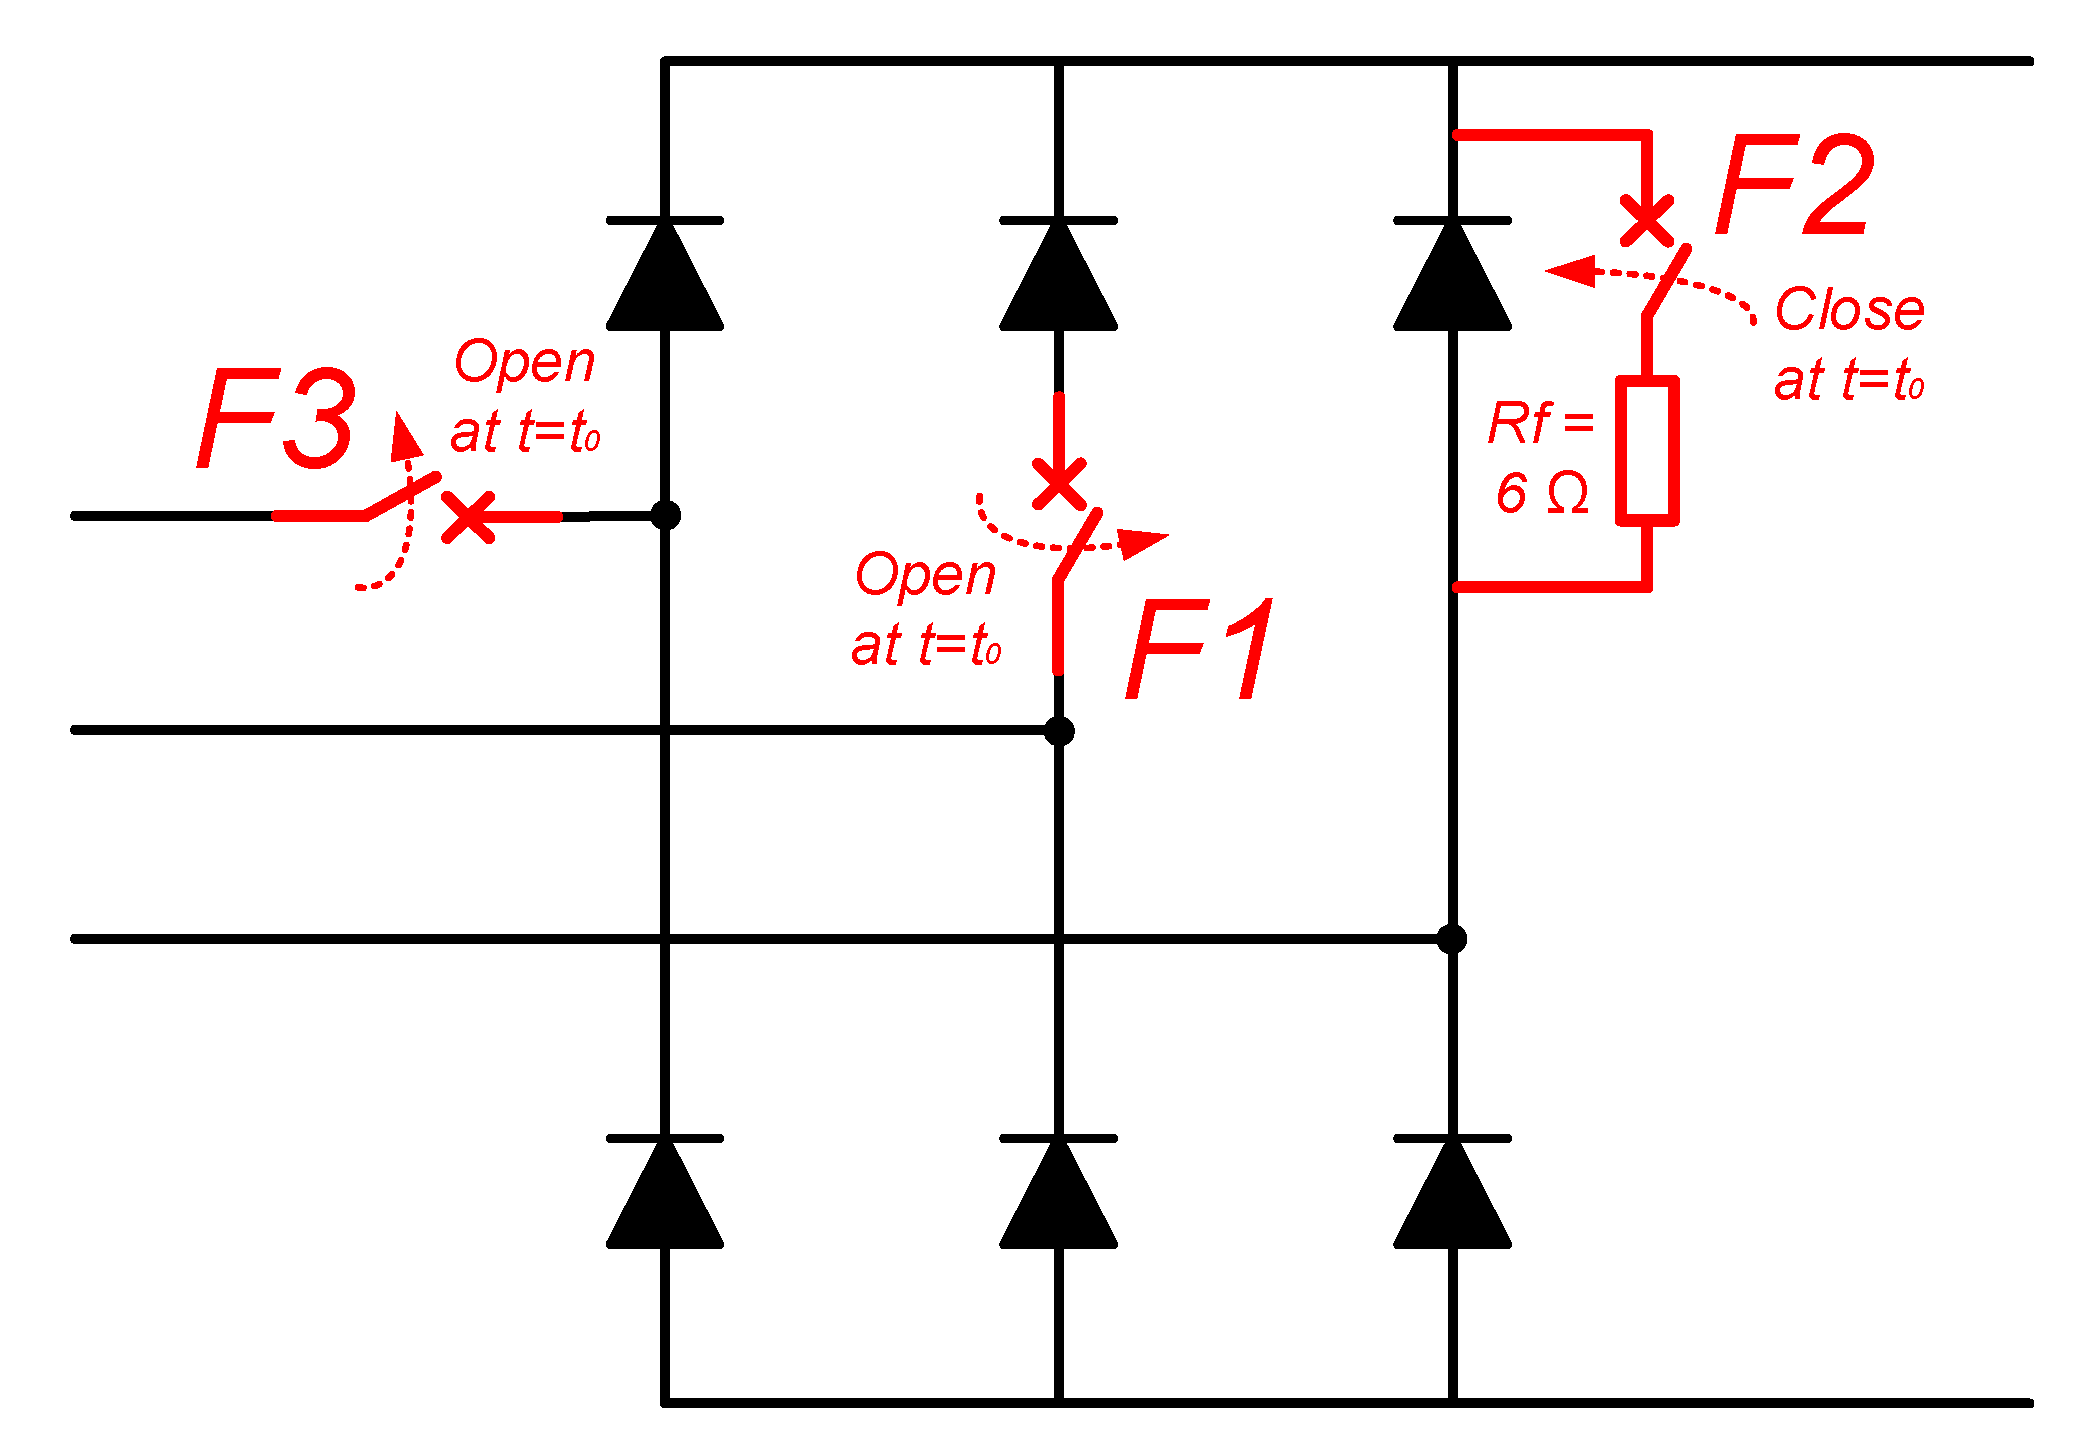
In order to perform faulty tests, some arrangements were carried out at the diode bridge rectifier so as to simulate each type of fault, as shown in Figure 10. These faults are the following:
  • F1: Open-diode fault. A circuit-breaker is placed in series with one of the diodes. It is closed in healthy conditions and suddenly opened when the fault is performed.
  • F2: Shorted-diode fault. A short-circuit branch is connected in parallel with one of the diodes and it is provided with a circuit-breaker. It is open in healthy conditions and suddenly closed when the fault is carried out. The fault has been performed with a fault resistance value of 6 Ω (Rf = 6 Ω) in order to limit the fault current below the rated exciter current, and, therefore, to avoid excessive fault currents that could damage the exciter, as shown in Figure 11.
  • F3: Open-phase fault. A circuit-breaker is placed in series with one of the input phase lines. It is closed in healthy conditions and suddenly opened when the fault is produced.

4.2. Experimental Test Results

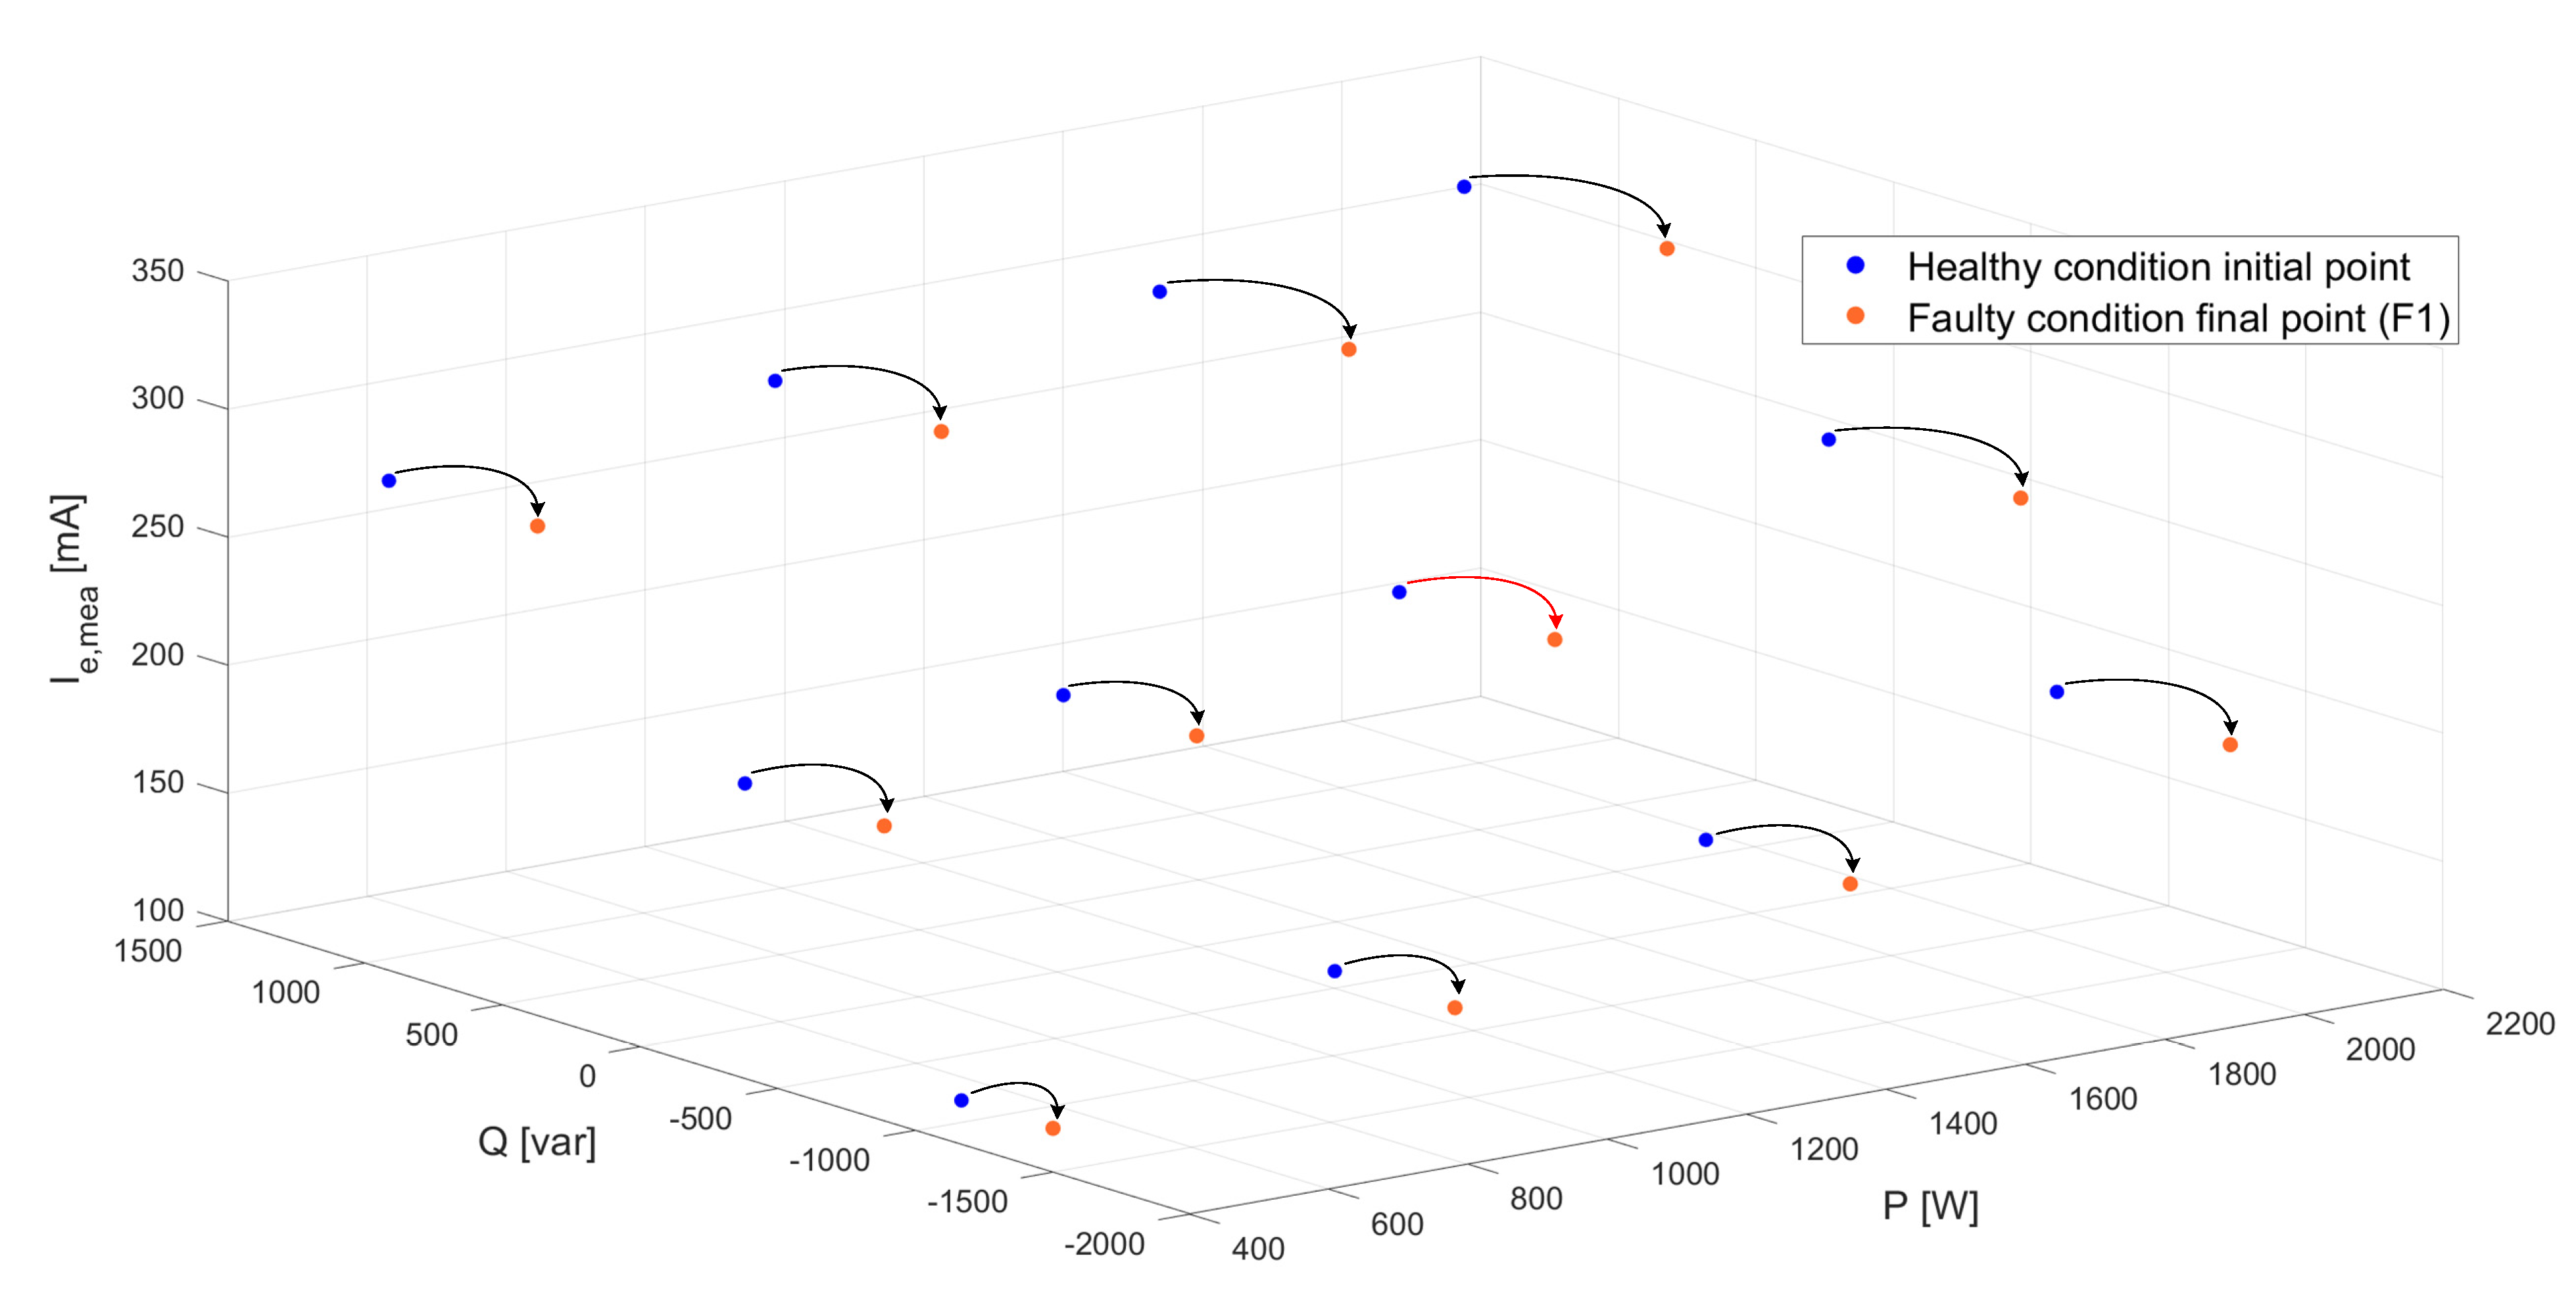
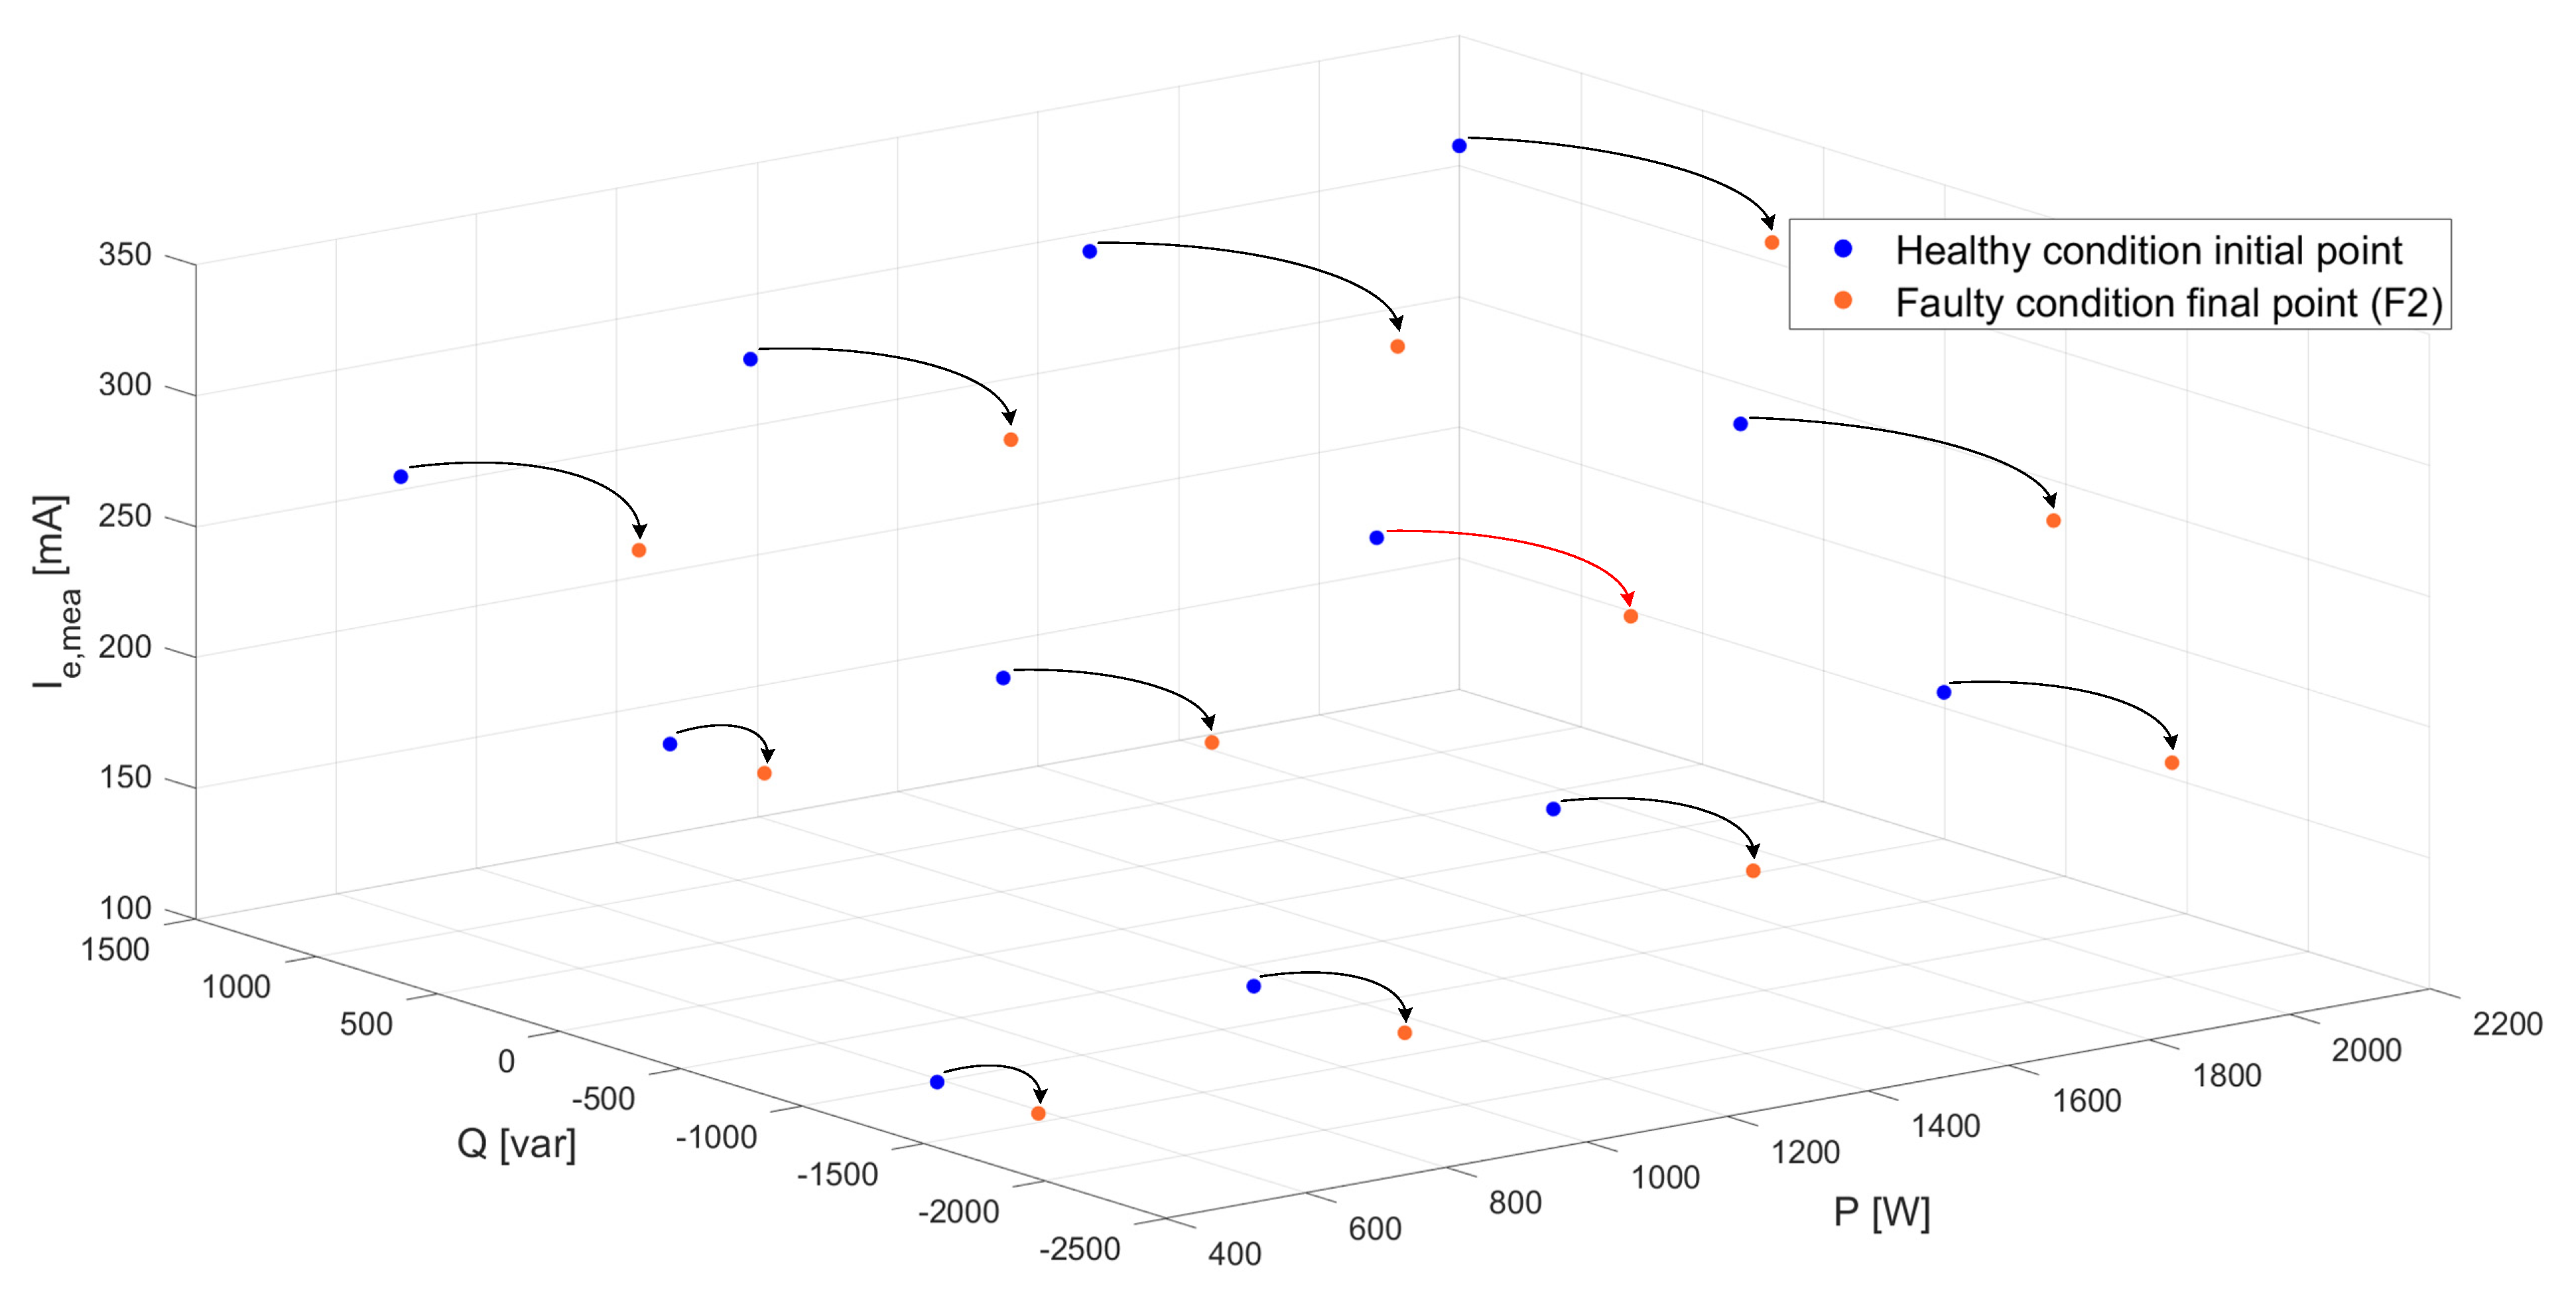
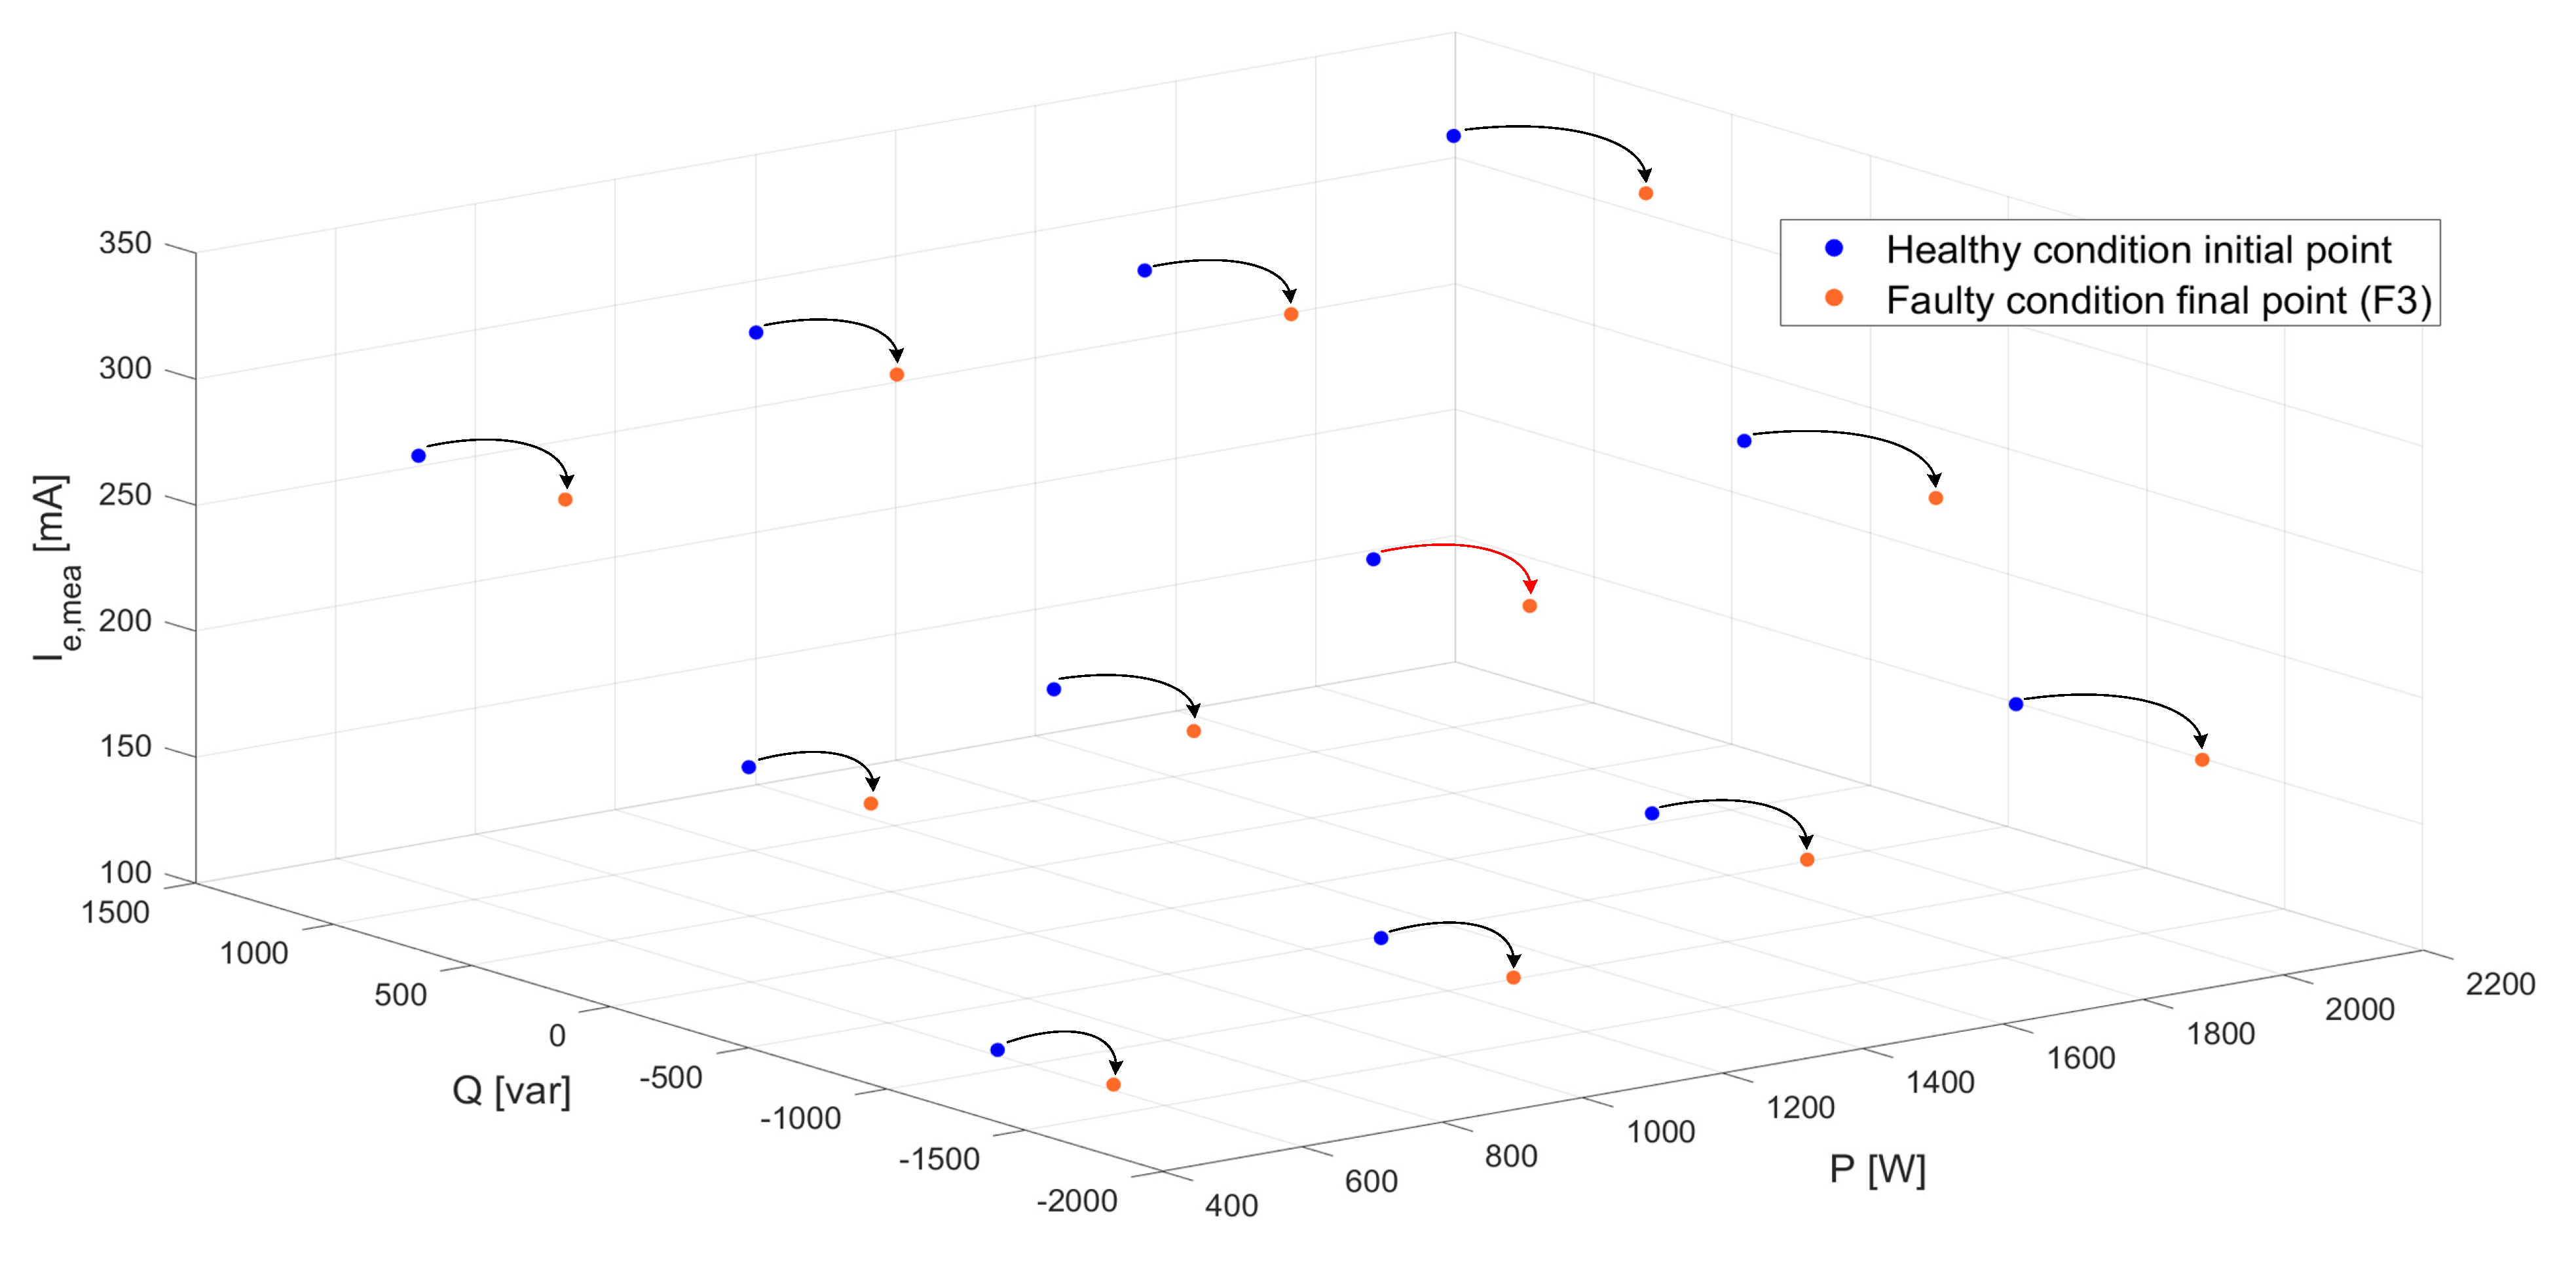
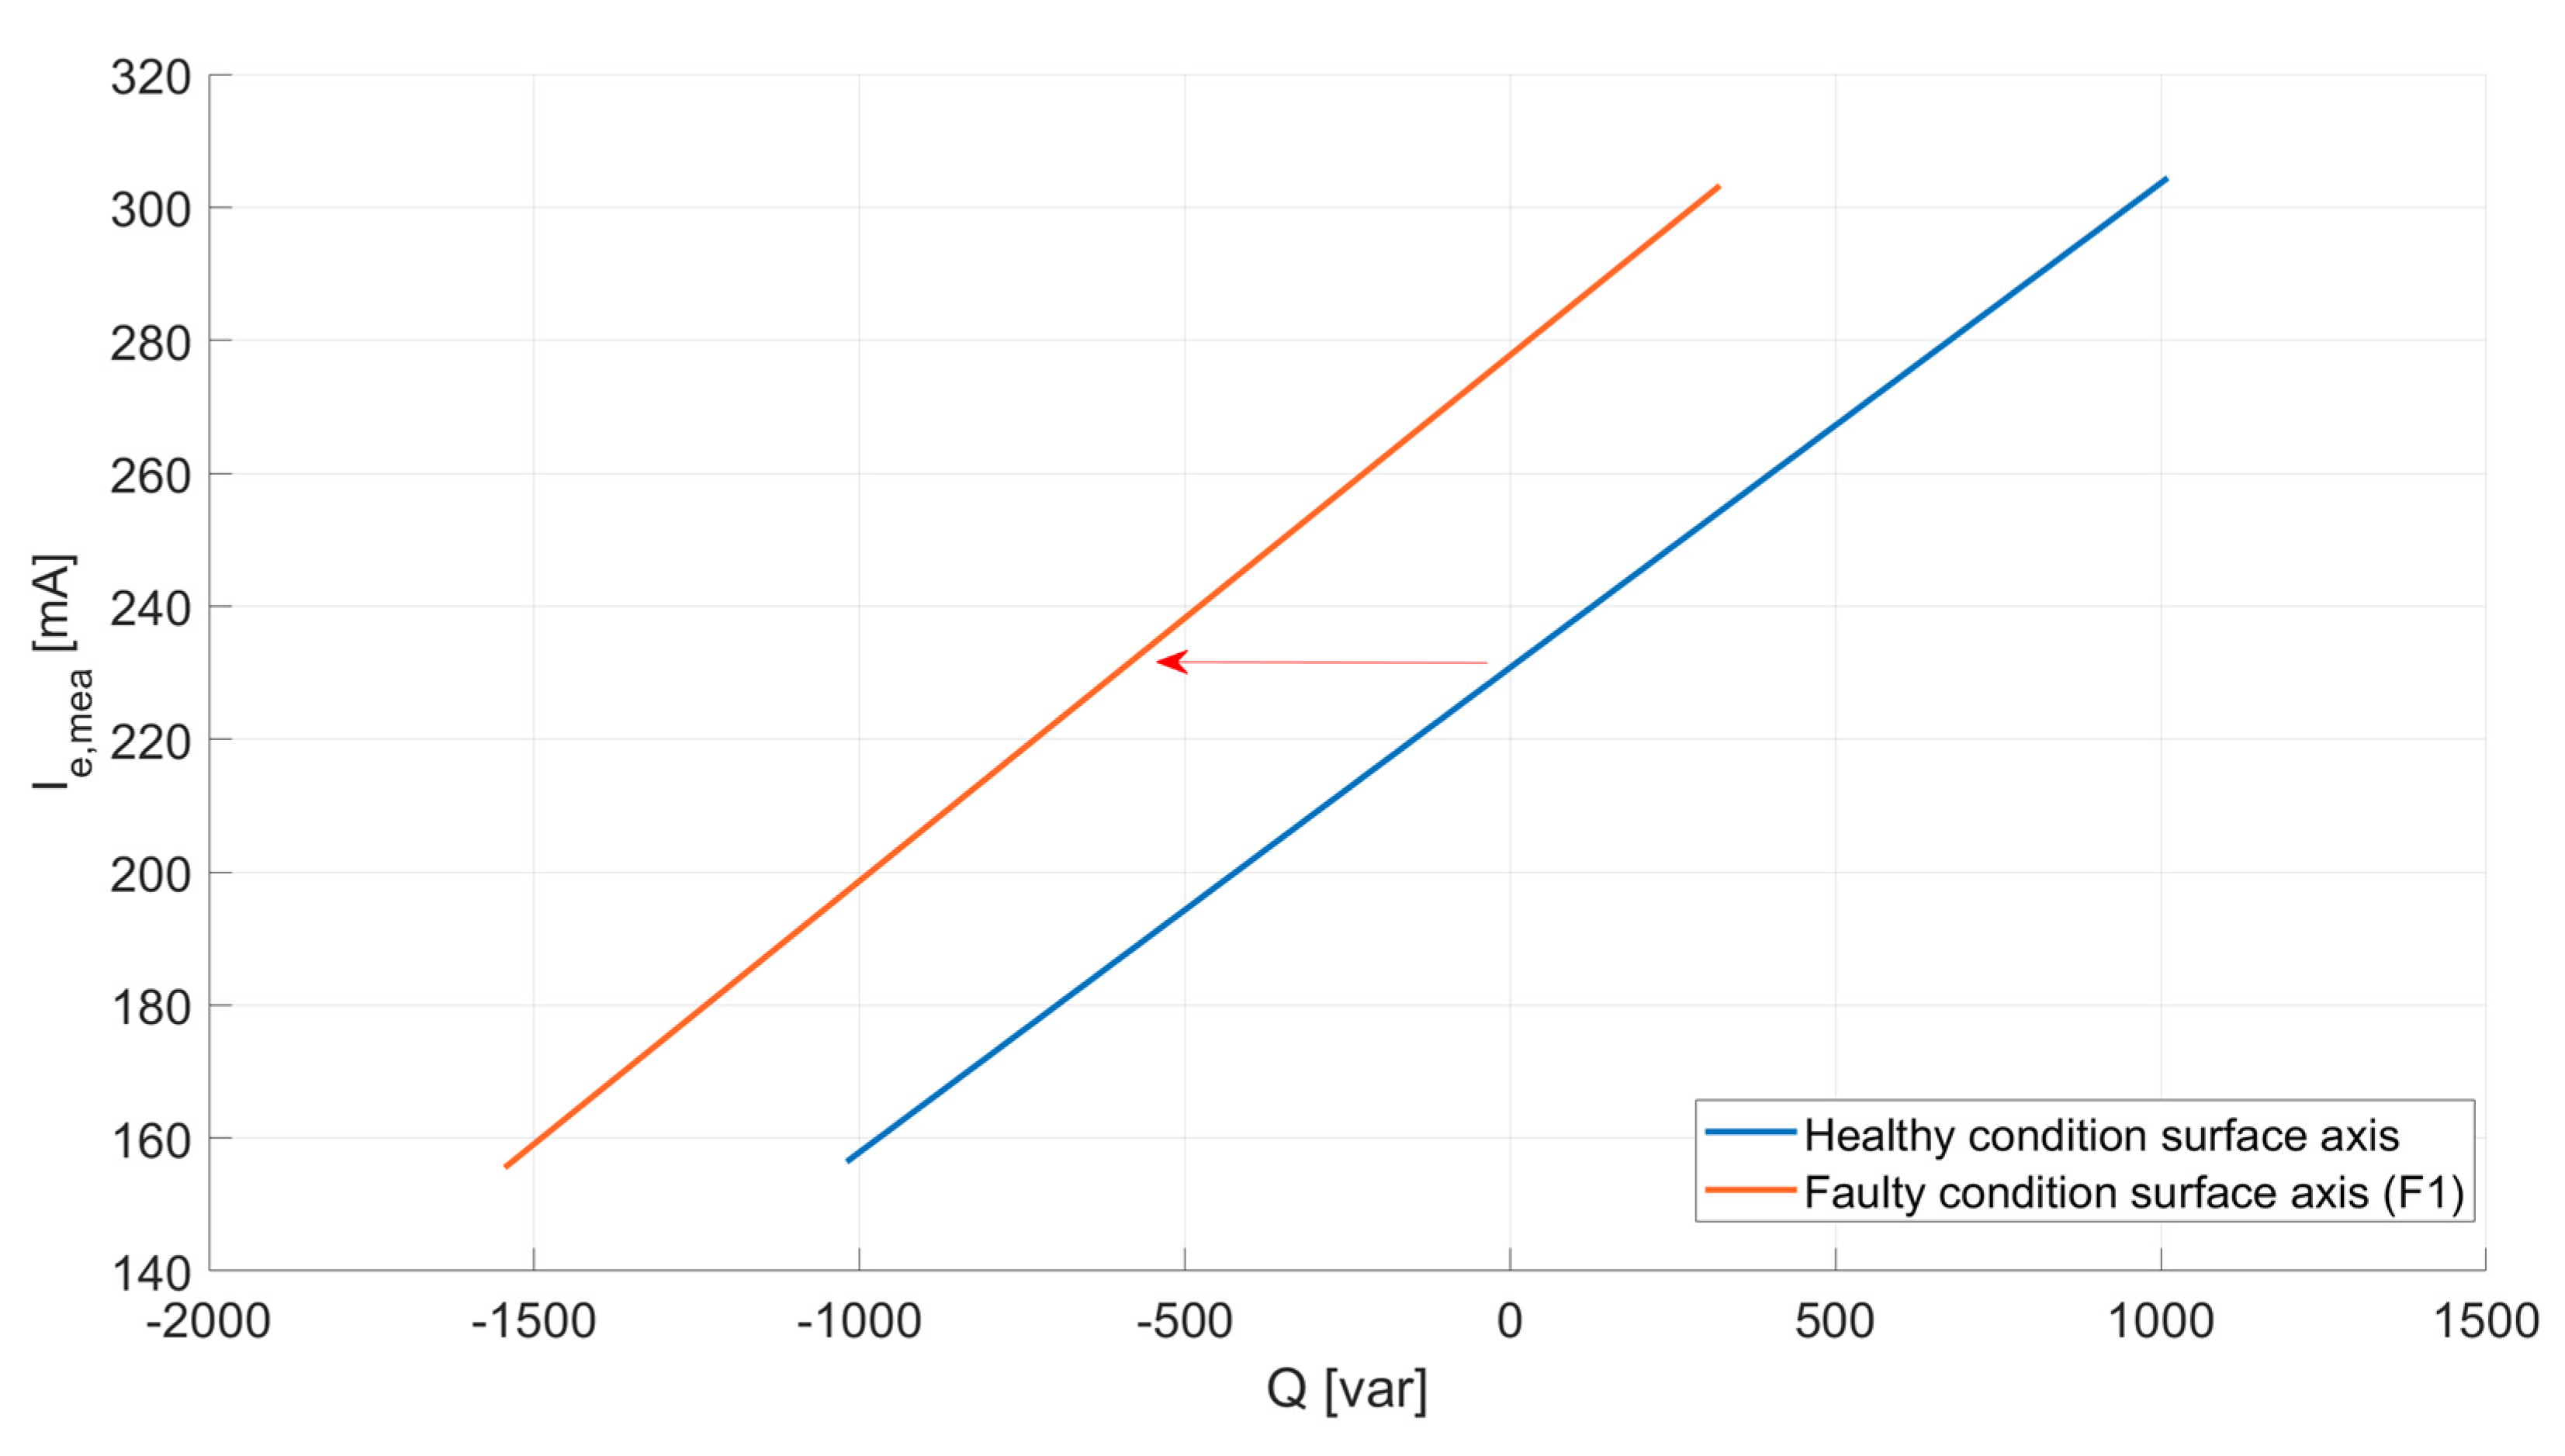
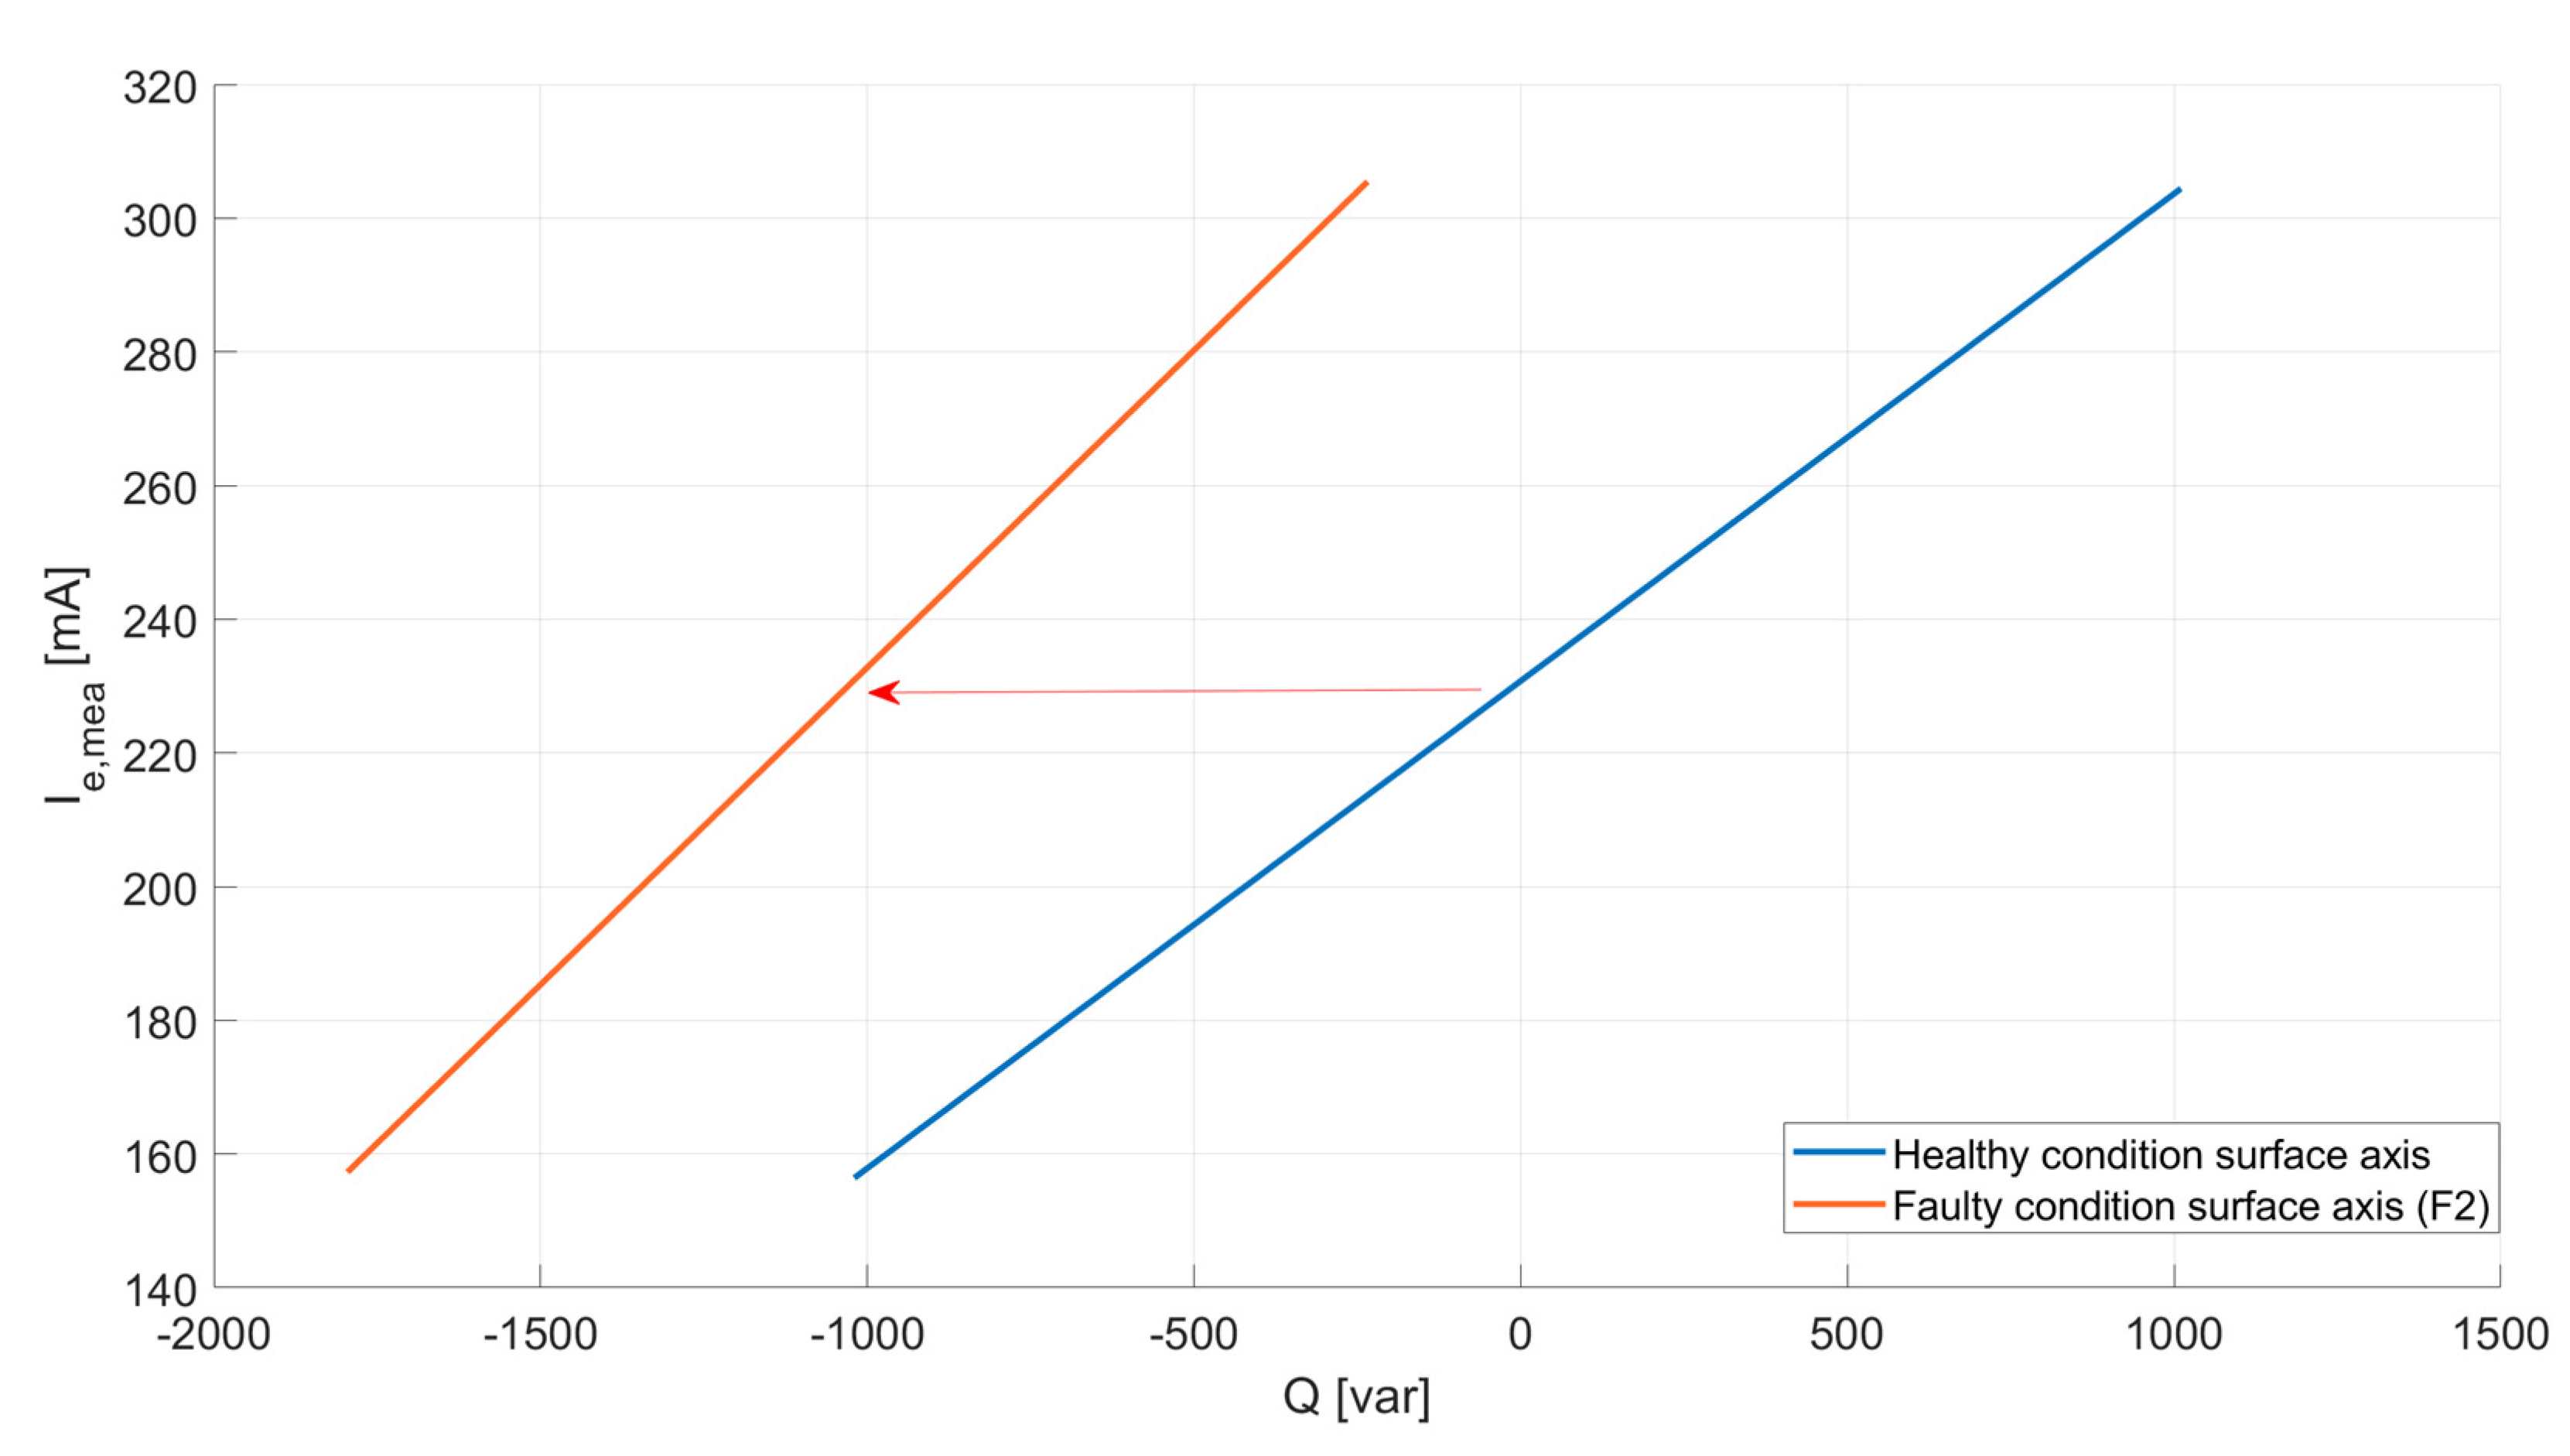
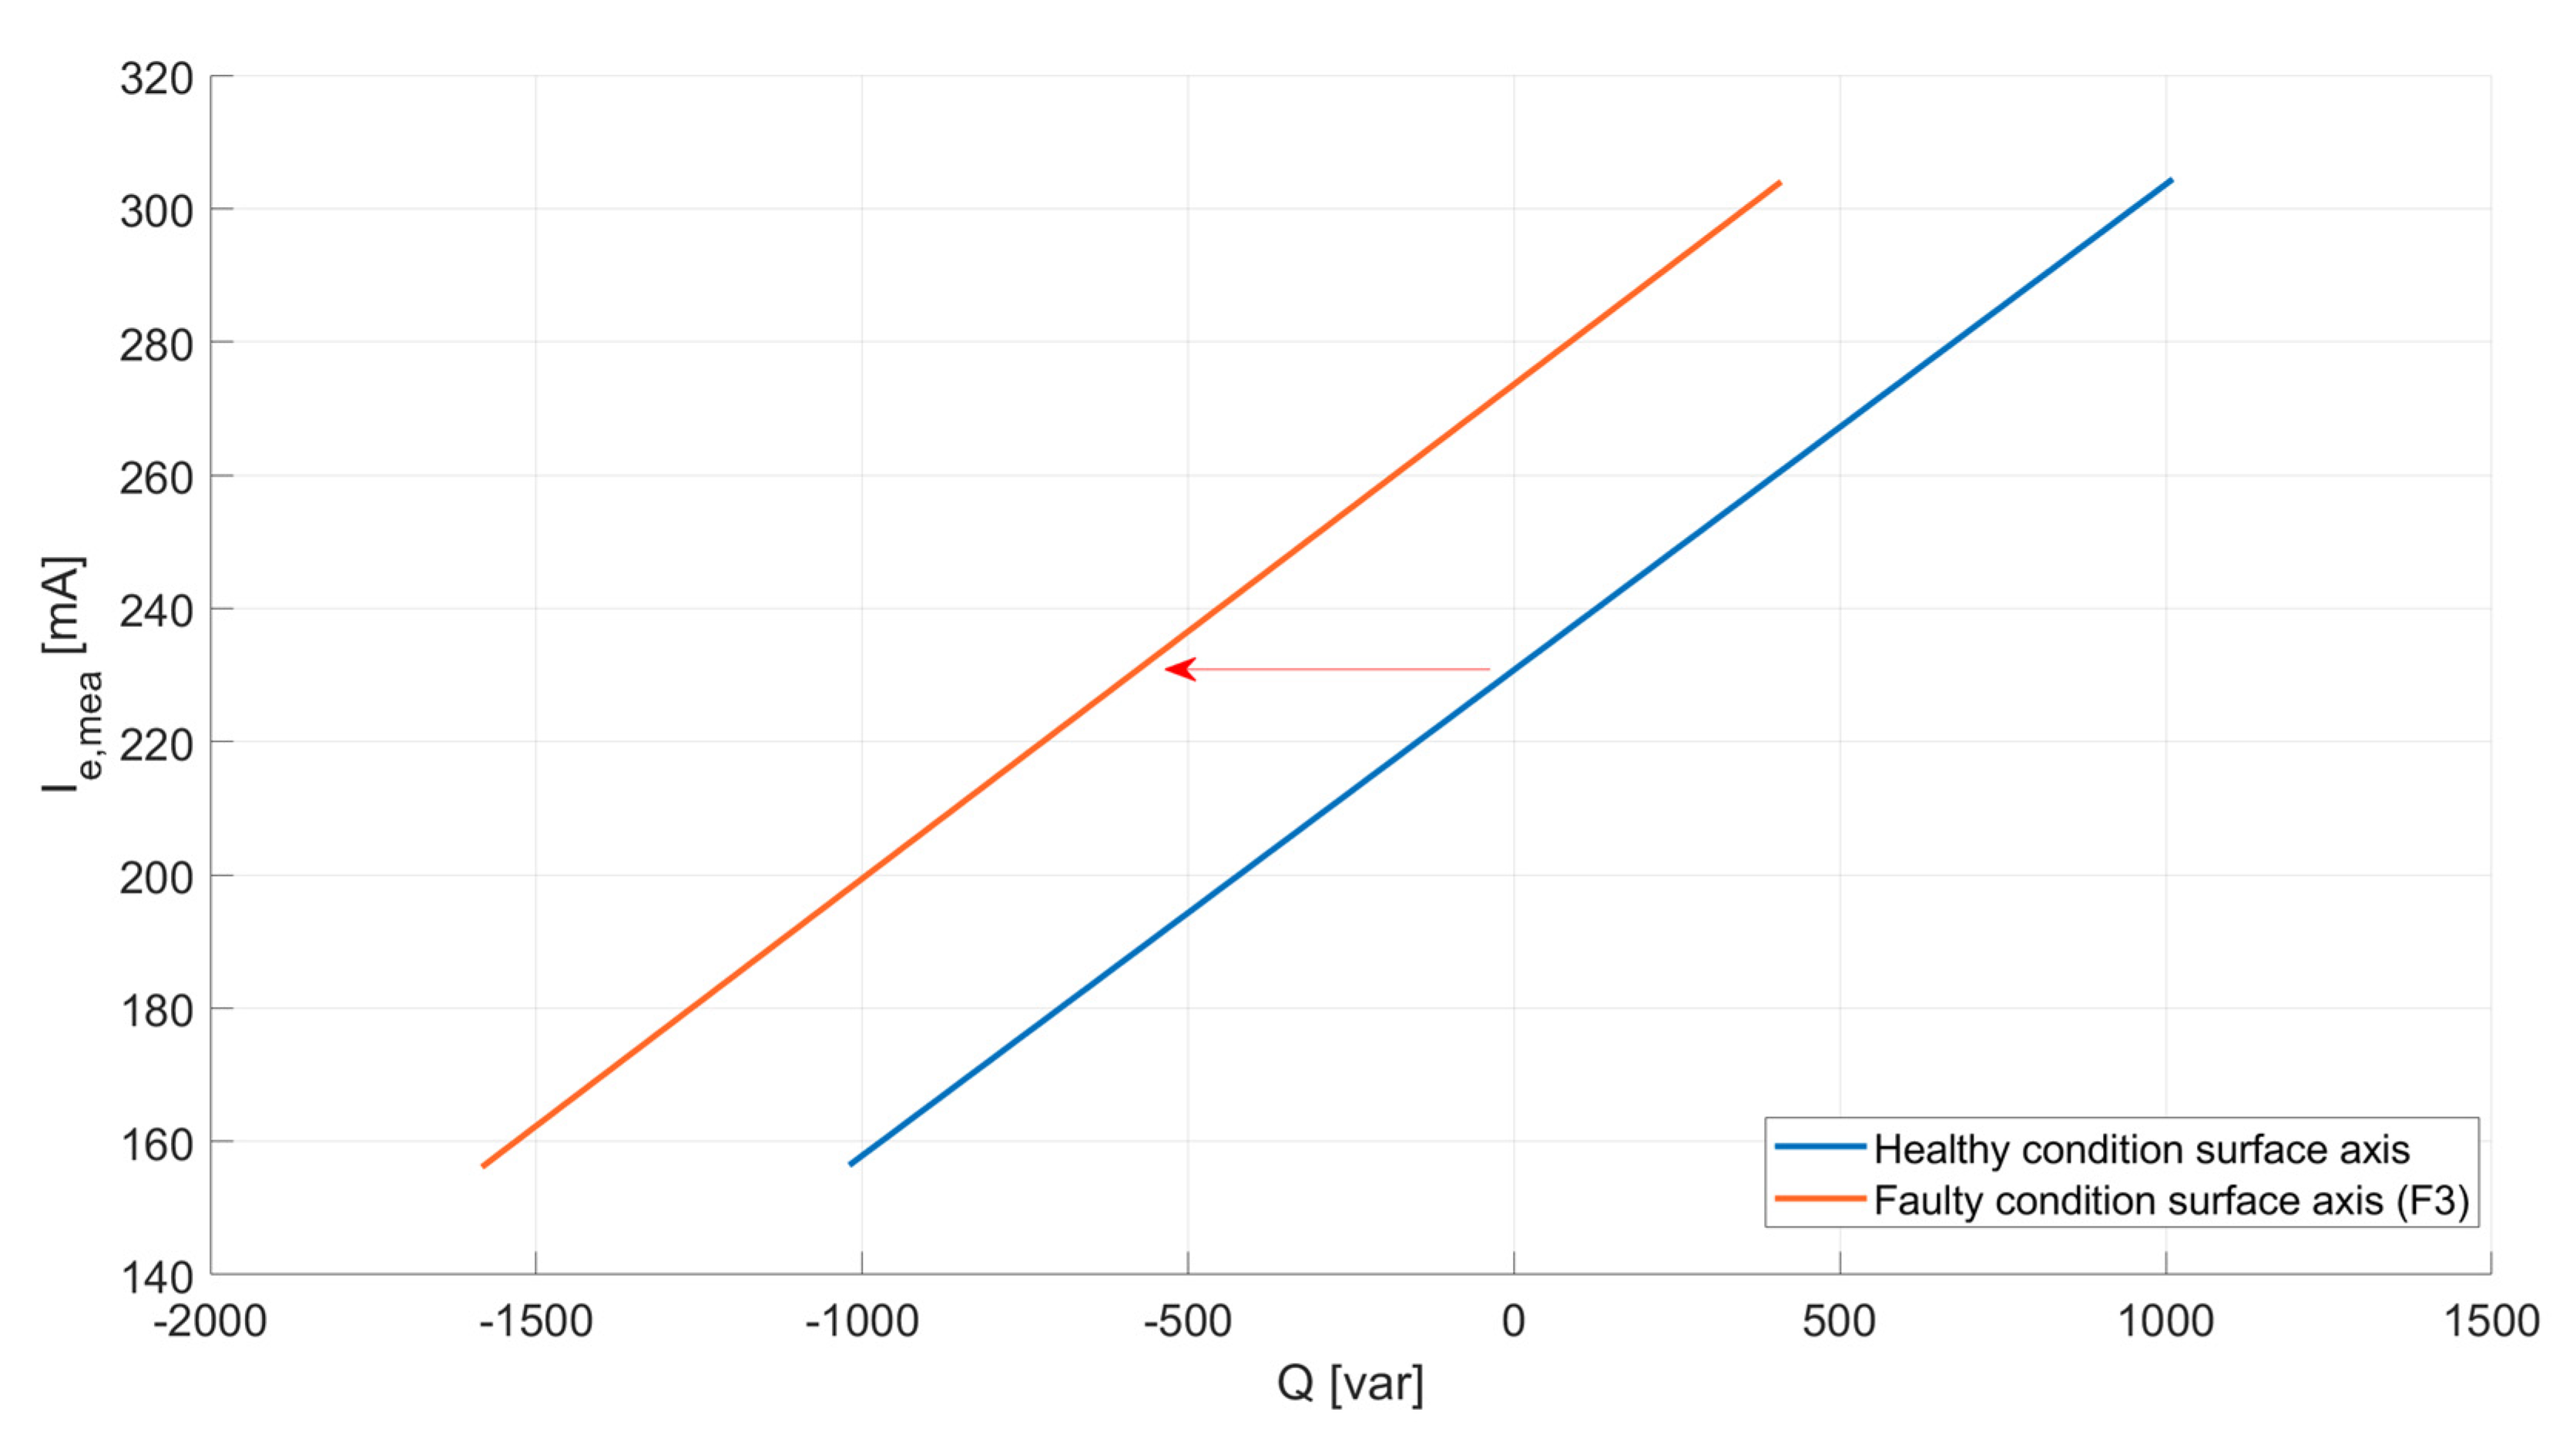
The results of the experimental tests for various (P, Q) operating points at a fixed grid voltage (U = 400 V) in the case of an open-diode fault (F1), a shorted-diode fault (F2) with Rf = 6 Ω and an open-phase fault (F3) are shown in Figure 12, Figure 13 and Figure 14, respectively, in the form of healthy-to-faulty transitions. In these figures, the exciter field current measurement (Ie,mea) for each healthy condition initial point (tail of arrow) and for each corresponding final faulty condition point (head of arrow) is represented for different operating points at a fixed grid voltage.
As the excitation is not controlled through an AVR system but manual excitation control is performed instead through the DC adjustable supply system and kept constant for each healthy-to-faulty transition, and as the mechanical power input from the prime mover is also kept constant for each transition, after each rectifier fault is carried out, a healthy operation point (points in blue in Figure 12, Figure 13 and Figure 14) gives place to a new faulty condition operation point (points in orange in Figure 12, Figure 13 and Figure 14). These faulty condition points are attained with the same Ie,mea, i.e., on the same horizontal plane as the original healthy condition point, and with the same P value as the original healthy condition point. A drop in the Q value is observed in each transition as the machine-reactive power requirement turns to be greater in faulty cases, behaving as a reactive power sink.
Furthermore, from the experimental test points shown in Figure 12, Figure 13 and Figure 14, a healthy condition surface axis for P = 1500 W and three faulty condition surface axes (for faults F1, F2 and F3) also for P = 1500 W have been inferred. These surface axes have been represented in Figure 15, Figure 16 and Figure 17, respectively. The healthy-to-faulty transitions marked with a red arrow in Figure 12, Figure 13 and Figure 14 have also been represented in Figure 15, Figure 16 and Figure 17, respectively.
As can be seen in Figure 15, Figure 16 and Figure 17, a straightforward differentiation is feasible between the healthy case and the faulty cases, as a stepwise gap exists between the surfaces in healthy and faulty conditions.
The online fault detection method relies on the comparison between Ie,mea and Ie,cal, the latter of which shall be computed through the healthy machine model from the machine actual output values as developed in reference [34] and synthetized in Section 2. This method shall be verified through the healthy-to-faulty transition experimental tests presented in this section.
As aforementioned, when the rectifier fault is produced, the machine operating point moves from a point on the healthy condition characteristic to another point on the corresponding faulty characteristic according to the fault type (F1, F2 or F3). In this case, an operating point with lower Q is attained, with the fact that Ie remains constant before and after the fault is produced. Following the detection method, Ie,cal should be computed for the new faulty operating point outputs (U, P, Q) through the healthy machine model and then compared to Ie,mea as per Figure 3. Because at these faulty operating points the excitation power need is higher than in healthy conditions for exactly the same machine outputs (Ie,mea > Ie,cal), their ratio, monitored through r, is an effective indicator of rectifier faults.
The method will be verified for the three healthy-to-faulty transitions marked in red in Figure 12, Figure 13 and Figure 14 and represented in Figure 15, Figure 16 and Figure 17 with a voltage measurement full-scale error tolerance of 1.5% and a power measurement full-scale error tolerance of 5%:
  • Regarding the open-diode fault (F1), the initial healthy condition point is (U = 400 V; P = 1500 W; Q = 0 var). When the fault is produced, Q drops to −594 var defining a new operating point at (U = 400 V; P = 1500 W; Q = −594 var), as shown in Figure 18a. In healthy conditions, the value of the measured current (Ie,mea) is similar to the theoretical one computed through the model (Ie,cal), i.e., r ≈ 1, but after the fault takes place, while Ie,mea stays constant at 230 mA, the value of Ie,cal experiences a drop as the new output operating point should be attained with less need of excitation power if the system was healthy, as per Figure 18b. This fact gives rise to a value difference obtained from the comparison of Ie,mea and Ie,cal after the fault, represented by the stepwise gap (r > 1).
  • Similarly to the previous case, in the case of the shorted-diode fault (F2) with Rf = 6 Ω, the initial healthy condition point (U = 400 V; P = 1500 W; Q = 0 var) gives place to a new operating point at (U = 400 V; P = 1500 W; Q = −1012 var) after the fault is produced, as shown in Figure 19a. As represented parallelly in Figure 19b, the value of Ie,mea passes from being similar to the theoretical one computed through the model (Ie,cal) before the fault, i.e., r ≈ 1, to having a clear difference after the fault, as Ie,mea stays constant at 230 mA but the value of Ie,cal drops when the calculation is performed with the healthy model at the new operating point (r > 1).
  • Finally, regarding the open-phase fault (F3), the healthy-to-faulty transition implies that the (U = 400 V; P = 1500 W; Q = 0 var) is left and a new operating point at (U = 400 V; P = 1500 W; Q = −610 var) is attained, as represented in Figure 20a. As shown parallelly in Figure 20b, a stepwise gap between Ie,mea and Ie,cal is also obtained after the fault (r > 1) due to the drop of Ie,cal at the new operating point.

5. Conclusions

This paper applies a novel brushless synchronous machine theoretical model to the online detection of rotating rectifier electrical faults, specifically to open-diode faults, shorted-diode faults and open-phase faults.
The applied method is based on the comparison of the theoretical exciter field current, computed from the theoretical healthy machine model from the system output measurements, and the actual measured exciter field current, for each monitored operating point. The applicability of the method relies on the fact that all the mentioned faults imply a divergence between the theoretical and the measured exciter field current.
The method stands out because it is non-intrusive and because the inputs that are needed consist of variables that are already usually monitored in mostly all industrial applications. Moreover, it has a negligible computational complexity with respect to other existing condition monitoring techniques. All these facts make straightforward its industrial application without need of any further equipment or adaptation.
The online condition monitoring achieved through the application of the method is a useful tool to provide a first signal or alert to the operator in the event of a rotating diode fault, as a preliminary online approach before shifting to other diagnostics methods that may need access to the machine. The applicability of the rotating rectifier fault detection method has been corroborated with successful results, on the one hand, through computer simulations, and, on the other hand, through experimental testing that has been performed on a specific laboratory test bench.
Future challenges and research directions mainly include the application of the proposed method to larger power machines in industrial contexts and the development of an automatic fault classifier in order to build a complete functional protection scheme.

Author Contributions

Conceptualization, K.M. and C.A.P.; methodology, K.M. and C.A.P.; software, K.M.; validation, K.M. and L.F.B.; formal analysis, K.M. and L.F.B.; investigation, K.M., L.F.B. and C.A.P.; resources, K.M.; data curation, K.M.; writing—original draft preparation, K.M.; writing—review and editing, K.M., J.M.G., L.F.B. and C.A.P.; visualization, K.M., J.M.G., L.F.B. and C.A.P.; supervision, L.F.B.; project administration, C.A.P.; funding acquisition, C.A.P. All authors have read and agreed to the published version of the manuscript.

Funding

This research received no external funding.

Informed Consent Statement

Not applicable.

Data Availability Statement

Not applicable.

Conflicts of Interest

The authors declare no conflict of interest.

References

  1. Dulas, J.H.; Chisholm, M.; Griffith, T.; Ocmand, J. API 546, 4th Edition—Making It Easier to Specify Brushless Synchronous Machines. In Proceedings of the 2019 IEEE Petroleum and Chemical Industry Committee Conference (PCIC), Vancouver, BC, Canada, 9–12 September 2019; pp. 41–50. [Google Scholar]
  2. IEEE Std C50.13-2014 (Revision of IEEE Std C50.13-2005); IEEE Standard for Cylindrical-Rotor 50 Hz and 60 Hz Synchronous Generators Rated 10 MVA and Above. IEEE: New York, NY, USA, 2014; pp. 1–63.
  3. Nøland, J.K.; Nuzzo, S.; Tessarolo, A.; Alves, E.F. Excitation System Technologies for Wound-Field Synchronous Machines: Survey of Solutions and Evolving Trends. IEEE Access 2019, 7, 109699–109718. [Google Scholar] [CrossRef]
  4. Rebollo, E.; Blánquez, F.R.; Platero, C.A.; Blázquez, F.; Redondo, M. Improved High-Speed De-excitation System for Brushless Synchronous Machines Tested on a 20 MVA Hydro-generator. IET Electr. Power Appl. 2015, 9, 405–411. [Google Scholar] [CrossRef]
  5. Chapman, S.J. Electric Machinery Fundamentals, 5th ed.; McGraw-Hill: New York, NY, USA, 2012; ISBN 9780073529547. [Google Scholar]
  6. Pallantla, M.; Kumar, P.; Mohan, N. Comparison and Evaluation of the Different Brushless Excitation Topologies for Synchronous Machines-A Literature Survey. In Proceedings of the 2020 IEEE International Conference on Power Electronics, Smart Grid and Renewable Energy (PESGRE2020), Cochin, India, 2–4 January 2020; pp. 1–6. [Google Scholar]
  7. IEEE Std C37 102-2006 (Revision of IEEE Std C37 102-1995); IEEE Guide for AC Generator Protection. IEEE: New York, NY, USA, 2006; pp. 1–177.
  8. Kim, H.J.; Shaikh, M.F.; Lee, S.B.; Platero, C.A.; Kim, T. Alternative Test Methods for Monitoring the Condition of Brushless Exciters in Synchronous Machines. IEEE Trans. Energy Convers. 2022, 37, 2009–2018. [Google Scholar] [CrossRef]
  9. Sun, C.; Liu, W.; Han, X.; Jiao, N.; Shen, K.; Wang, R.; Mao, S.; Wang, K. Fault Diagnosis of a Rotating Rectifier in a Wound-Rotor Synchronous Starter/Generator in the Generation Mode. IEEE Trans. Transp. Electrif. 2022, 8, 4569–4582. [Google Scholar] [CrossRef]
  10. IEEE Std 421.1-2007 (Revision of IEEE Std 421.1-1986); IEEE Standard Definitions for Excitation Systems for Synchronous Machines. IEEE: New York, NY, USA, 2007; pp. 1–33.
  11. Batzel, T.D.; Swanson, D.C.; Defenbaugh, J.F. Predictive diagnostics for the main field winding and rotating rectifier assembly in the brushless synchronous generator. In Proceedings of the 4th IEEE International Symposium on Diagnostics for Electric Machines, Power Electronics and Drives (SDEMPED), Atlanta, GA, USA, 24–26 August 2003; pp. 349–354. [Google Scholar]
  12. Salah, M.; Bacha, K.; Chaari, A. Detection of Brushless Exciter Rotating Diodes Failures by Spectral Analysis of Main Output Voltage. In Proceedings of the 2013 International Conference on Electrical Engineering and Software Applications, Hammamet, Tunisia, 21–23 March 2013; pp. 1–6. [Google Scholar]
  13. Rahnama, M.; Vahedi, A.; Alikhani, A.M.; Takorabet, N. Diode Open-Circuit Fault Detection in Rectifier Bridge of the Brushless Synchronous Generator. In Proceedings of the 2018 XIII International Conference on Electrical Machines (ICEM), Alexandroupoli, Greece, 3–6 September 2018; pp. 1821–1826. [Google Scholar]
  14. Rahnama, M.; Vahedi, A. Rotary Diode Failure Detection in Brushless Exciter System of Power Plant Synchronous Generator. In Proceedings of the 2016 6th Conference on Thermal Power Plants (CTPP), Tehran, Iran, 19–20 January 2016; pp. 6–11. [Google Scholar]
  15. McArdle, M.G.; Morrow, D.J. Noninvasive Detection of Brushless Exciter Rotating Diode Failure. IEEE Trans. Energy Convers. 2004, 19, 378–383. [Google Scholar]
  16. Sottile, J.; Trutt, F.C.; Leedy, A.W. Condition Monitoring of Brushless Three-phase Synchronous Generators with Stator Winding or Rotor Circuit Deterioration. IEEE Trans. Ind. Appl. 2006, 42, 1209–1215. [Google Scholar] [CrossRef]
  17. Cui, J.; Tang, J.; Shi, G.; Zhang, Z. Generator Rotating Rectifier Fault Detection Method Based on Stacked Auto-encoder. In Proceedings of the 2017 IEEE Workshop on Electrical Machines Design, Control and Diagnosis (WEMDCD), Nottingham, UK, 20–21 April 2017; pp. 256–261. [Google Scholar]
  18. Ahmadi, A.; Mahbubi, S.; Shahnazari, M. Rotating Rectifier Fault Detection in Brushless Excitation System of Synchronous Generators. In Proceedings of the 2019 27th Iranian Conference on Electrical Engineering (ICEE), Yazd, Iran, 30 April–2 May 2019; pp. 1–5. [Google Scholar]
  19. Pang, J.; Liu, W.; Wei, Z.; Sun, C.; Jiao, N.; Han, X. Online Diode Fault Detection in Rotating Rectifier of the Brushless Synchronous Starter Generator. IEEE Trans. Ind. Inform. 2020, 16, 6943–6951. [Google Scholar] [CrossRef]
  20. Zhang, C.; Xia, L. A Novel Online Diagnosis of Brushless Generator Rotary Rectifier Fault. In Proceedings of the 2008 International Conference on Electrical Machines and Systems, Wuhan, China, 17–20 October 2008; pp. 835–838. [Google Scholar]
  21. Rahnama, M.; Vahedi, A. Application of Acoustic Signals for Rectifier Fault Detection in Brushless Synchronous Generator. Arch. Acoust. 2019, 44, 267–276. [Google Scholar]
  22. Rahnama, M.; Vahedi, A.; Alikhani, A.M.; Montazeri, A. Machine-learning Approach for Fault Detection in Brushless Synchronous Generator Using Vibration Signals. IET Sci. Meas. Technol. 2019, 13, 852–861. [Google Scholar] [CrossRef]
  23. Mohammad-Alikhani, A.; Rahnama, M.; X Vahedi, A. Neighbors Class Solidarity Feature Selection for Fault Diagnosis of Brushless Generator Using Thermal Imaging. IEEE Trans. Instrum. Meas. 2020, 69, 6221–6227. [Google Scholar] [CrossRef]
  24. Li, X. A Microprocessor-based Fault Monitor for Rotating Rectifiers of Brushless AC Exciters Using a Pattern-Recognition Approach. In Proceedings of the 10th Anniversary IMTC/94. Advanced Technologies in I & M. 1994 IEEE Instrumentation and Measurement Technology Conference, Hamamatsu, Japan, 10–12 May 1994; pp. 394–397. [Google Scholar]
  25. Wu, Y.; Cai, B.; Ma, Q. An Online Diagnostic Method for Rotary Diode Open-Circuit Faults in Brushless Exciters. IEEE Trans. Energy Convers. 2018, 33, 1677–1685. [Google Scholar] [CrossRef]
  26. Tian, P.; Platero, C.A.; Lee, S.B.; Gyftakis, K.N.; Antonino-Daviu, J.A. Exciter Axial and Radial Stray Flux Analysis for Rotating Diodes Supervision. In Proceedings of the IEEE 13th International Symposium on Diagnostics for Electrical Machines, Power Electronics and Drives (SDEMPED), Dallas, TX, USA, 22–25 August 2021; pp. 86–91. [Google Scholar]
  27. Salah, M.; Bacha, K.; Chaari, A.; Benbouzid, M.E.H. Brushless Three-Phase Synchronous Generator Under Rotating Diode Failure Conditions. IEEE Trans. Energy Convers. 2014, 29, 594–601. [Google Scholar] [CrossRef] [Green Version]
  28. Zouaghi, T.; Poloujadoff, M. Modeling of Polyphase Brushless Exciter Behavior for Failing Diode Operation. IEEE Trans. Energy Convers. 1998, 13, 214–220. [Google Scholar] [CrossRef]
  29. Tang, J.; Liu, Y.; Sharma, N. Modeling and Experimental Verification of High-Frequency Inductive Brushless Exciter for Electrically Excited Synchronous Machines. IEEE Trans. Ind. Appl. 2019, 55, 4613–4623. [Google Scholar] [CrossRef]
  30. Bui, H.K.; Bracikowski, N.; Hecquet, M.; Zappellini, K.L.; Ducreux, J.P. Simulation of a Large Power Brushless Synchronous Generator (BLSG) with a Rotating Rectifier by a Reluctance Network for Fault Analysis and Diagnosis. IEEE Trans. Ind. Appl. 2017, 53, 4327–4337. [Google Scholar] [CrossRef]
  31. Tantawy, A.; Koutsoukos, X.; Biswas, G. Aircraft Power Generators: Hybrid Modeling and Simulation for Fault Detection. IEEE Trans. Aerosp. Electron. Syst. 2012, 48, 552–571. [Google Scholar] [CrossRef]
  32. Rahnama, M.; Vahedi, A.; Alikhani, A.M.; Nobahari, A. Numerical Modeling of Brushless Synchronous Generator for Rectifier Fault Detection. In Proceedings of the 2019 19th International Symposium on Electromagnetic Fields in Mechatronics, Electrical and Electronic Engineering (ISEF), Nancy, France, 29–31 August 2019; pp. 1–2. [Google Scholar]
  33. Mahtani, K.; Guerrero, J.M.; Beites, L.F.; Platero, C.A. Model-based On-line Protection Method for Brushless Synchronous Generators. In Proceedings of the IEEE 13th International Symposium on Diagnostics for Electrical Machines, Power Electronics and Drives (SDEMPED), Dallas, TX, USA, 22–25 August 2021; pp. 126–132. [Google Scholar]
  34. Mahtani, K.; Guerrero, J.M.; Beites, L.F.; Platero, C.A. Model-Based Field Winding Interturn Fault Detection Method for Brushless Synchronous Machines. Machines 2022, 10, 1227. [Google Scholar] [CrossRef]
  35. EN-IEC 60034-4-1: 2018; Rotating Electrical Machines—Part 4–1: Methods for Determining Electrically Excited Synchronous Machine Quantities from Tests. International Electrotechnical Commission: Geneva, Switzerland, 2018.
Figure 1. Simplified schema of the BSM (F1: open-diode fault; F2: shorted-diode fault; F3: open-phase fault).
Machines 11 00223 g001
Figure 2. Main field voltage (Vf) waveform and r.m.s. value for healthy conditions and for faulty conditions (F1: open-diode fault; F2: shorted-diode fault; F3: open-phase fault).
Machines 11 00223 g002
Figure 3. Simplified schema of the fault detection method and protection features.
Machines 11 00223 g003
Figure 4. Computer simulation model.
Machines 11 00223 g004
Figure 5. Simulation results. Ie (p.u.) represented for different (P, Q) operating setpoints at reference voltage for F1: open-diode fault.
Machines 11 00223 g005
Figure 6. Simulation results. Ie (p.u.) represented for different (P, Q) operating setpoints at reference voltage for F2: shorted-diode fault.
Machines 11 00223 g006
Figure 7. Simulation results. Ie (p.u.) represented for different (P, Q) operating setpoints at reference voltage for F3: exciter open-phase fault.
Machines 11 00223 g007
Figure 8. Schematic layout of the experimental arrangement with static rectifier. Rotating elements are contained in the areas in gray.
Machines 11 00223 g008
Figure 9. Experimental test bench ((a) asynchronous motor; (b) BSM; (c) diode rectifier; (d) brushes and slip rings).
Machines 11 00223 g009
Figure 10. Experimental rectifier faulty condition test arrangement schema (F1: open-diode fault; F2: shorted-diode fault; F3: open-phase fault).
Machines 11 00223 g010
Figure 11. Shorted-diode faulty test setup, with Rf = 6 Ω achieved with two 3 Ω series resistors.
Machines 11 00223 g011
Figure 12. Experimental results. Representation of Ie,mea for (P, Q) operating points at U = 400 V both in healthy conditions and in faulty conditions (F1: open-diode fault).
Machines 11 00223 g012
Figure 13. Experimental results. Representation of Ie,mea for (P, Q) operating points at U = 400 V both in healthy conditions and in faulty conditions (F2: shorted-diode fault with Rf = 6 Ω).
Machines 11 00223 g013
Figure 14. Experimental results. Representation of Ie,mea for (P, Q) operating points at U = 400 V both in healthy conditions and in faulty conditions (F3: open-phase fault).
Machines 11 00223 g014
Figure 15. Experimental results. Representation of Ie,mea healthy and faulty condition (F1: open-diode fault), surface axis for P = 1500 W at U = 400 V.
Machines 11 00223 g015
Figure 16. Experimental results. Representation of Ie,mea healthy and faulty conditions (F2: shorted-diode fault with Rf = 6 Ω), surface axis for P = 1500 W at U = 400 V.
Machines 11 00223 g016
Figure 17. Experimental results. Representation of Ie,mea healthy and faulty conditions (F3: open-phase fault), surface axis for P = 1500 W at U = 400 V.
Machines 11 00223 g017
Figure 18. Healthy-to-faulty transition for a sudden open-diode fault (F1), with fixed P = 1500 W and U = 400 V: (a) Measured P and Q; (b) Ie,mea and Ie,cal.
Machines 11 00223 g018
Figure 19. Healthy-to-faulty transition for a sudden shorted-diode fault (F2) with Rf = 6 Ω, with fixed P = 1500 W and U = 400 V: (a) Measured P and Q; (b) Ie,mea and Ie,cal.
Machines 11 00223 g019
Figure 20. Healthy-to-faulty transition for a sudden open-phase fault (F3), with fixed P = 1500 W and U = 400 V: (a) Measured P and Q; (b) Ie,mea and Ie,cal.
Machines 11 00223 g020
Table 1. Comparison of various online BSM rotating rectifier fault techniques.
CategorySubcategoriesReferencesChallenges Overcome by Model-Based Methods
Electrical signal analysisOutput voltage[12,13,32]Suboptimal accuracy
Electrical measurement error dependence
Computational complexity
Output current[14,19]
Exciter field current[14,15,16,17,18,19,20]
Mechanical signal analysisAcoustics[21]Audio signal acquisition technical constraints
Acoustic noise
Additional equipment
Difficult fault classification
Computational complexity
Vibrations[22]Suboptimal accuracy
Vibration signal acquisition technical constraints
Additional equipment
Difficult fault classification
Computational complexity
Cost
Thermal signal analysisn/a[23]Computational complexity
Additional equipment
Material cost
Airgap flux analysisn/a[24,25]Invasiveness
Additional equipment
Installation constraints
Machine design constraints
Computational complexity
Cost
Stray flux analysisn/a[26,27]Low accuracy
Computational complexity
Additional equipment
Cost
Table 2. Main machine data.
Alternator TypeSynchronous 3-Phase
Rated power5kVA
Rated speed1500rpm
Rated voltage400V
Rated current7.2A
Pole pairs2
Rated frequency50Hz
IP21
Isolation classF
Rated excitation voltage33V
Rated excitation current4.10A
Table 3. Exciter data.
Alternator TypeSynchronous 3-Phase
Rated power277VA
Rated speed1500rpm
Rated voltage40V
Rated current4A
Pole pairs4
Rated frequency100Hz
IP21
Isolation classF
Rated excitation voltage33V
Rated excitation current0.61A
Table 4. Hall effect DC current sensor data.
Maximum Voltage26V
Maximum current±3.2 (±0.8 resolution)A (mA)
Precision amplifier0.1 (1% precision)
InterfaceI2C
Table 5. Current transformer data.
TypeSingle Phase,
Wound Primary
Ratio10/5
Rated current10A
Class and power0.5 (2.5)
1 (5)
3 (7)
(VA)
Maximum operating voltage0.72kV
Table 6. Programmable multi-transducer data.
Number of Outputs3
Type of outputAnalogue
Rated input current1 to 6A
Rated input voltage57.7 to 400 (phase-to-neutral)
100 to 693 (phase-to-phase)
V
Accuracy class0.2 (voltage and current)
0.5 (all other quantities)
Computer interfaceRS232
Disclaimer/Publisher’s Note: The statements, opinions and data contained in all publications are solely those of the individual author(s) and contributor(s) and not of MDPI and/or the editor(s). MDPI and/or the editor(s) disclaim responsibility for any injury to people or property resulting from any ideas, methods, instructions or products referred to in the content.