Article

Thermal–Electrical–Mechanical Coupled Finite Element Models for Battery Electric Vehicle

Center for Collision Safety and Analysis, George Mason University, 4400 University Dr, Fairfax, VA 22033, USA
*
Author to whom correspondence should be addressed.
These authors contributed equally to this work.
Machines 2024, 12(9), 596; https://doi.org/10.3390/machines12090596
Submission received: 5 July 2024 / Revised: 8 August 2024 / Accepted: 12 August 2024 / Published: 27 August 2024
(This article belongs to the Section Vehicle Engineering)

Abstract

:
The safety of lithium-ion batteries is critical to the safety of battery electric vehicles (BEVs). The purpose of this work is to develop a method to predict battery thermal runaway in full electric vehicle crash simulation. The thermal–electrical–mechanical-coupled finite element analysis is used to model an individual lithium-ion battery cell, a battery module, a battery pack, and a battery electric vehicle with 24 battery modules in a live circuit connection. The lithium-ion battery is modeled using a representative approach, with each internal battery component individually modeled to represent its geometric shape and realistic thermal, mechanical, and electrical properties. A resistance heating solver and Randles circuit model built with a generalized voltage source are used to simulate the electrical behavior of the battery. The thermal simulation of the battery considers the heat capacity and thermal conductivity of different cell components, as well as heat conduction, radiation, and convection at their interfaces. The mechanical property of battery cell and battery module models is validated using spherical punch tests. The electrical property of the battery cell and battery module models is verified against CircuitLab simulation in an external short-circuit test. The simulation results for the battery module’s internal resistance are consistent with both experimental data and literature values. The multi-physics coupling phenomenon is demonstrated with a cylindrical compression simulation on the battery module. The multi-physics BEV model with 24 live battery modules is used to simulate the external short-circuit test and the side pole impact test. The simulation run time is less than 24 h. The results demonstrated the feasibility of using a representative battery model and multi-physics analysis to predict battery thermal runaway in full electric vehicle crash analysis.

1. Introduction

With the increasing number of battery electric vehicles (BEVs) on public roadways, there is a need to develop a finite element simulation method to fully understand the crash safety of BEVs and their lithium-ion batteries. Due to the relatively low energy density of lithium-ion batteries, BEVs are typically 125% heavier than their Internal Combustion Engine (ICE) equivalent [1,2]. This additional mass has a negative effect on safety performance and fleet compatibility [3]. ICE vehicles and BEVs differ significantly in terms of mass distribution and structural arrangement, particularly concerning the vehicle’s frontal, side, floor, and roof structures. These distinctions have a substantial impact on crashworthiness performance during frontal, side, and rollover collisions. Beyond the traditional active safety systems found in ICE vehicles, the BEVs often come with drive-by-wire technology, distributed driving systems, autonomous driving, and connected vehicle features [4,5,6,7,8,9]. These advancements contribute to enhanced accident prevention and reduced injury risk. However, the use of lithium-ion batteries in BEVs is associated with a potential fire hazard [10]. Battery fire accidents can be triggered by various factors, including mechanical damage [11], electric malfunction [12,13], exposure to high heat or external fire [14,15], involvement in a crash [10,16], post-crash fire [17,18,19] or other unknown reasons [12].
Given that battery fires are a significant failure mode in electric vehicles, a simulation method capable of modeling battery thermal runaway is essential for the crash safety design and analysis of electric vehicles and their batteries. This method should address key questions, including whether the battery ignites in specific crash scenarios, the root cause of battery fires, and the vulnerable components in both the battery and vehicle design during thermal runaway events. Additionally, the method must be computationally efficient to be practical for industrial applications. Prior to this work, no literature has demonstrated a method capable of predicting the thermal runaway of lithium-ion batteries in full electric vehicle crash simulation.

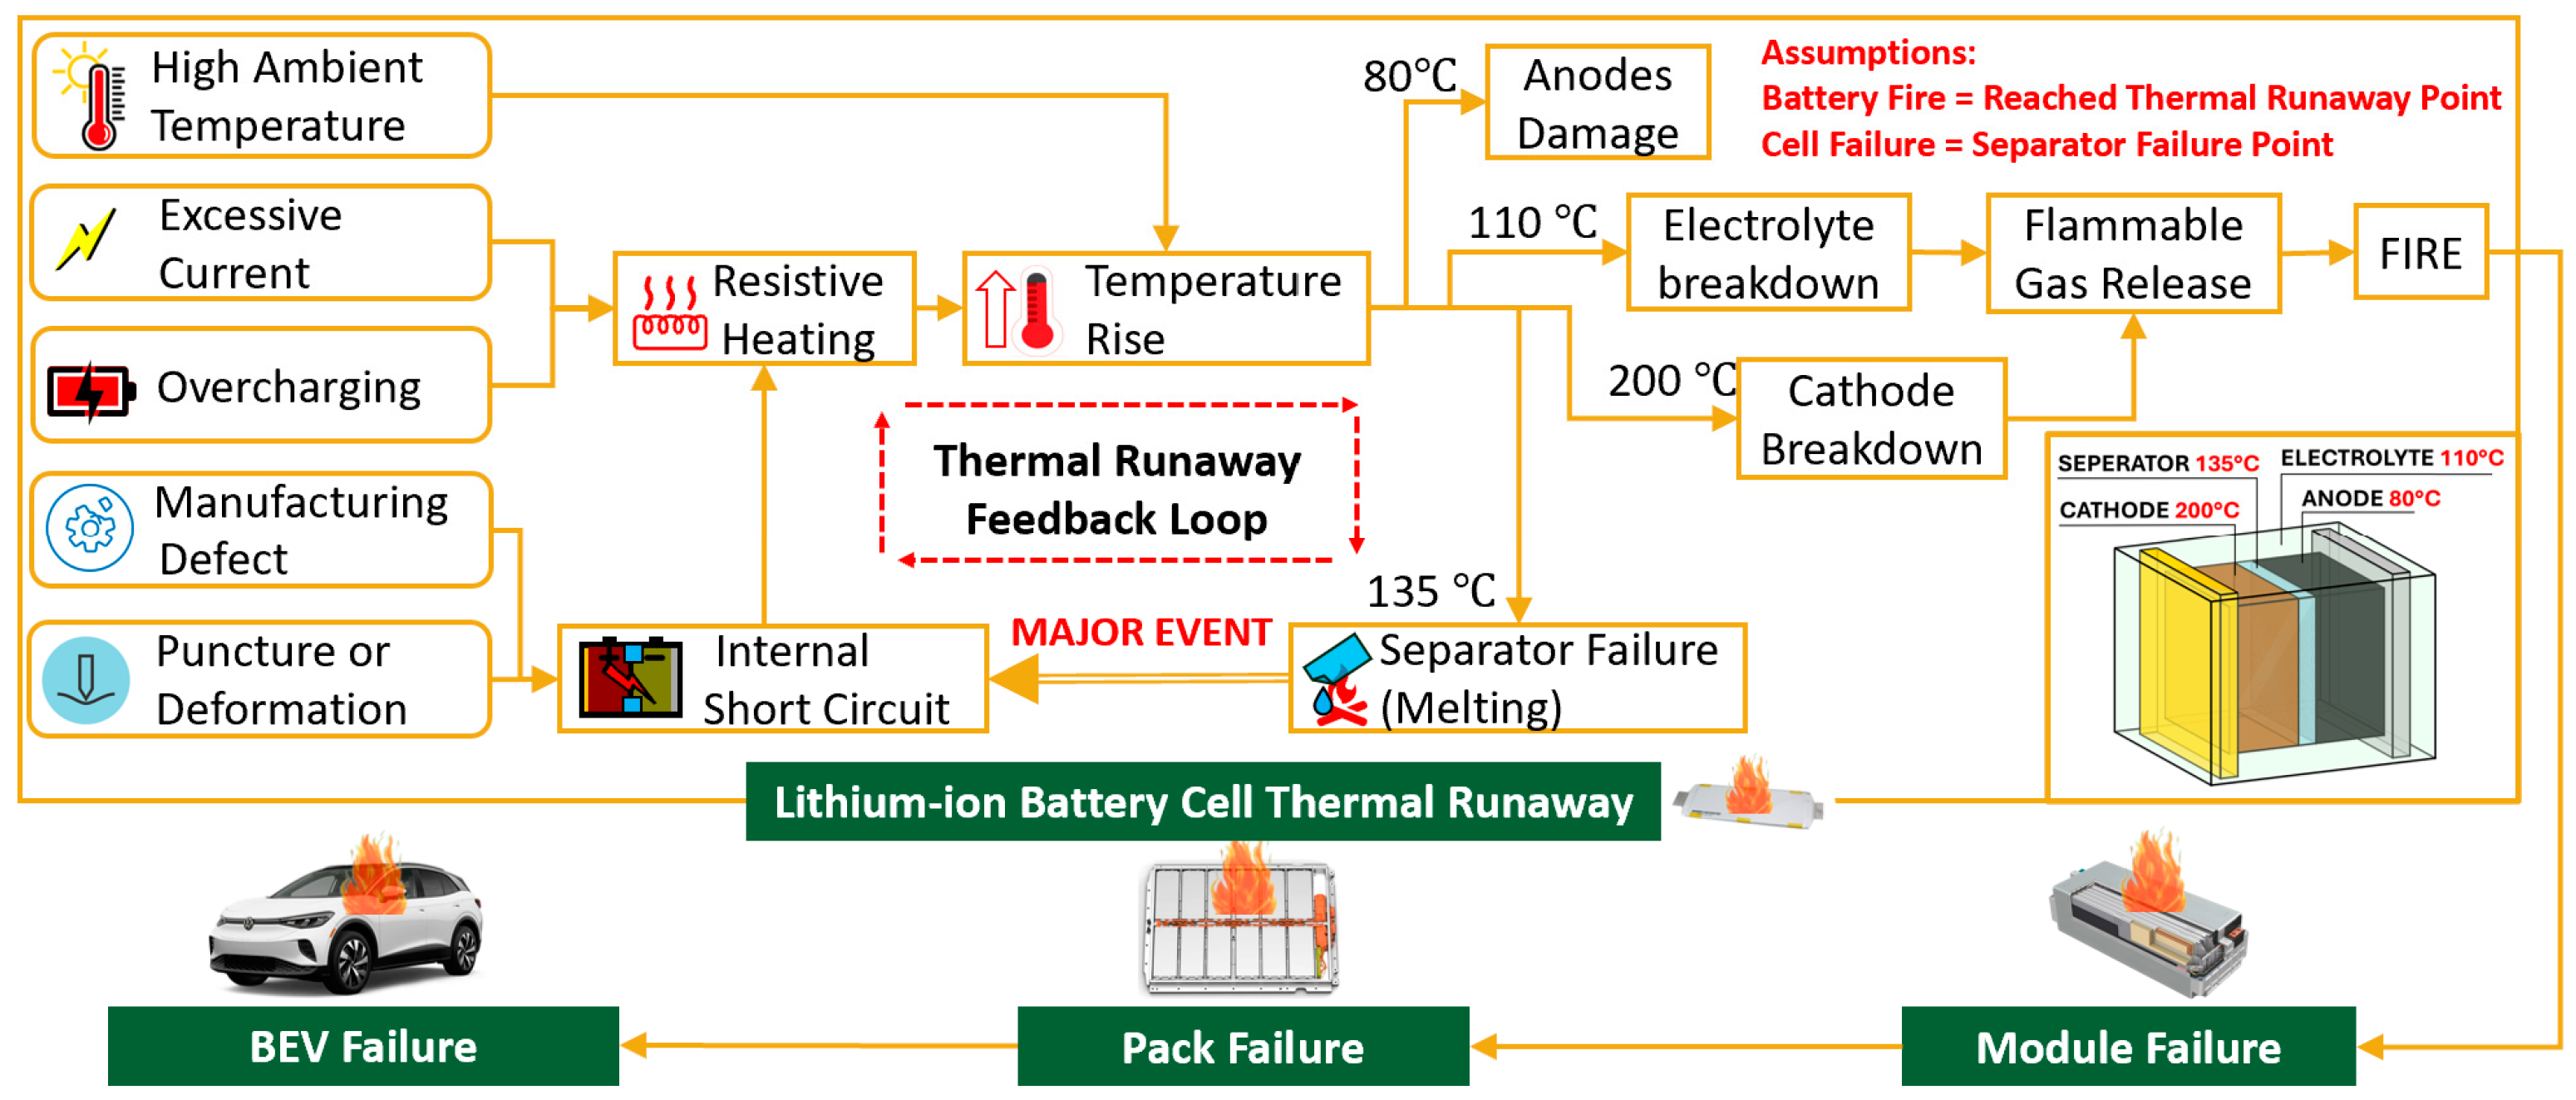
1.1. Lithium-Ion Battery Thermal Runaway Process

The lithium-ion battery catches fire through a process known as thermal runaway [20]. Thermal runaway occurs when an increase in battery temperature leads to changes in battery conditions that further raise the temperature, often resulting in a fire or explosion. To fully understand the physics behind thermal runaway, it is essential to first comprehend the sequence of events leading to a battery fire. Thermal runaway can be triggered by factors such as excessive current, overcharging, exposure to elevated temperatures, manufacturing defects, mechanical damage, or a combination of these effects, as illustrated in Figure 1. High environmental temperatures can directly heat up the battery. Overcharging and excessive current can increase the battery temperature through Joule heating. Mechanical damage or manufacturing defects can cause internal short circuits, which further raise the temperature through localized Joule heating. Once the temperature reaches 80 °C, the heat can cause permanent damage to the anode material. At 110 °C, the organic electrode begins to decompose, releasing heat and flammable gas. The polyethylene separator film melts at 135 °C. Once the separator fails, the direct contact between the cathode and anode material creates an internal short circuit, leading to the release of large amounts of heat and flammable gases, which often leads to fire or explosion [21]. By the time the temperature reaches 200 °C, the cathode material will break down and release flammable gas. At this stage, a fire and explosion are likely to occur [22]. Battery thermal runaway typically begins in an individual cell, then propagates to neighboring cells, and eventually spreads to the entire battery pack. Separator failure is a critical event in thermal runaway. If the separator remains intact, the temperature may decrease once the external circuit is disconnected or cooling is applied. However, once the separator fails and an internal short-circuit forms, a large amount of heat is released, causing a larger portion of the separator to melt. This results in additional internal short circuits and further heat release. This self-sustained chain reaction, known as the thermal runaway, can lead to smoke, fire, and explosion of the battery [23]. The thermal runaway point refers to the starting point of uncontrolled temperature escalation; thus, it should be considered the critical failure point in battery safety analysis [21]. Separator failure is the most likely trigger for thermal runaway. Therefore, the point of separator failure should be recognized as the critical failure point for battery safety analysis. The purpose of battery simulation is to capture the phenomenon involving the coupling of multiple physics that leads to the starting point of battery thermal runaway. This helps predict whether a BEV will catch fire under specific crash scenarios. Phenomena occurring after the initiation of thermal runaway, such as ignition and combustion, are outside the scope of this study.

1.2. Selection of Battery Simulation Techniques

(1) Finite element simulation methods used in battery simulation are summarized as follows: The classical method for battery simulation uses mechanical-only finite element analysis [24,25]; while computationally efficient, this method cannot predict thermal runaway and battery fire, which are primary concerns for battery safety. It is noted that when a battery cell is mechanically damaged, internal short circuit and thermal runaway could happen before the cell loses its mechanical strength [26]. In simpler terms, the battery may catch fire before it breaks. Mechanical-only simulation can only predict the structure failure point, leading to the impression that the battery is safer than its actual safety level. This could be dangerous because it may lead to the implementation of inadequate safety measures or the use of the battery in situations where it is not actually safe. Another battery simulation method involves electrical–chemical–thermal–mechanical finite element analysis. Solving electrochemical equations with heat generation significantly impacts the computational efficiency [27], making it impractical to model the entire BEV together with its battery cells in full vehicle crash simulations. Another alternative is electromagnetic–thermal–mechanical finite element analysis [28], which involves solving Maxwell’s equation. This method is computationally costly due to the complexity of Maxwell’s equations and their interactions with thermal and mechanical phenomena. Since the widely adopted Randles circuit model for battery equivalent circuits [29,30,31] uses only capacitors and resistors, the involvement of electromagnetism is unnecessary. The resistant heating solver is much more efficient for battery simulation. Thermal–electrical–mechanical-coupled finite analysis is previously used in lithium-ion battery simulation [32,33,34,35,36,37,38]. In this study, thermal–mechanical–electrical finite element analysis features the use of a thermal solver, an electric resistance heating solver, and a mechanical solver in a fully coupled LS-DYNA simulation. A user-defined voltage source was utilized to model the capacitor so the Randles circuit could be modeled with the resistant heating solver [32]. This method to model the Randle circuit is previously used to predict the thermal runaway of a single lithium-ion battery cell under normal and abusive conditions [32,39]. This study demonstrates that the thermal–mechanical–electrical-coupled simulation is suitable for modeling the crash safety of lithium-ion batteries integrated with BEVs.
(2) Thermal–Electrical–Mechanical Coupling Formulation in LS-DYNA: The thermal–electrical–mechanical coupling formulation in LS-DYNA is summarized in the literature [40,41,42]. The multi-physics solvers are required to concurrently solve Maxwell’s equations, Joule’s Law, and Newton’s Law.
Electrical: The Maxwell equations are approximated using the Eddy-current approximation for conductors with a low-frequency varying field. It is assumed that ε E t σ E , where E is the electric field. ε is the permittivity of free space. σ is the electric conductivity. This approximation implies a divergence-free current density and no free charge accumulation. The Maxwell equations become as follows:
Faraday Law:
× E = B t
Amper Law:
× B μ = j + ε E t
Gauss Law:
· B = 0
· ε E = 0
· j = 0
Ohm Law:
j = σ E + j s
where B is magnetic flux density, j is current density, j s is a divergence-free source current density, μ is permeability, ε is permittivity. The divergence condition (3) allows B writing as follows:
B = × A
where A is the magnetic vector potential [43]. According to Equation (1), the electric field is as follows:
E = ϕ A t
where ϕ is the electric scalar potential. The Gauge condition is used as follows:
· σ A = 0
which allows a separate the vector potential from the scalar potential in the equations, implying Equations (5), (6), (8), and (9).
· σ ϕ = 0
which implies Equations (2), (6), (7), and (8).
σ A t + × 1 μ × A + σ ϕ = j s
Equations (10) and (11) are Maxwell equations in terms of the two potentials. Let Ω be a set of multiply connected conducting regions. The surrounding insulator exterior regions is Ω e . The boundary between Ω and Ω e is Γ , and the artificial boundary on Ω at the end of the meshing region, where the conductors are connected to an external circuit, is called Γ c . In the following, let n be the outward normal to surfaces Γ or Γ c . In Ω e , we have σ = 0 and μ = μ 0 .
n · ϕ = 0   o n   Γ
ϕ = ϕ c   o n   Γ c
n × × A = A e   o n   Γ
n × A = A c   o n   Γ c
Equations (13) and (15) allow the connection of the conductors to a voltage source and a current source, respectively. Once the potentials are computed, the electromagnetic fields are given by Equations (6)–(8).
Mechanical: After the EM fields are computed by solving Maxwell equations, the Lorentz force is evaluated at the nodes and added to the mechanical equation.
ρ D u D t = · s + f + j × B
where u is the displacement. s is stress. f is the external force. ρ is the mass density. Notice that the extra Lorentz force term j × B represents the electric–mechanical coupling.
Thermal: The thermal equation is as follows:
D e D t = s : ε ˙ p l + D q D t + j 2 σ ρ e
where e is the internal energy. s is the stress tensor. ε ˙ p l is the plastic strain rate tensor. q is the external heat source. ρ e is the electrical resistivity. The Joule heating term j 2 / σ ρ e is added to the thermal solver, allowing us to update the temperature.
Equation of State (EOS): The material’s mechanical properties are evaluated at Gauss point temperature. The conductivity also may vary with temperature change.
σ = σ ( T , ρ )
where T is temperature. ρ is the mass density.
(3) Geometry Modeling of Battery Cell. The lithium-ion battery consists of numerous stacked layers of very thin membranes [44]. For porch cells, mechanical behavior in the thickness direction is particularly important for determining the cell’s strength in the hemispherical punch test, radial bending test, and side crushing test [44,45]. Utilizing solid elements is essential for accurately representing the strength of the battery cell in the through-thickness direction. However, the small membrane thickness (0.01~0.06 mm) [46,47] requires a very small element size and timestep in simulation, while the presence of a large number of stacked layers (>50 layers) leads to a very large model [48,49]. These factors make the simulation computationally impractical if the cell is modeled with realistic geometry. In this study, the battery cell is modeled with a representative battery model: Each cell component, including the cathode current collector, cathode, separator, anode, and anode current collector, is modeled separately with a representation geometry. Since the lithium-ion battery features a jelly roll structure composed of numerous thin layers, the thickness of these layers can be proportionally scaled up. This approach allows a few thicker layers to effectively represent the many thin layers in the model. Realistic material properties of each cell component, including density, Young’s module, Poisson’s ratio, stress–strain relation, porosity, thermal conductivity, specific heat capacity, electric resistivity, etc., were used in the FE model. The alternative method is the homogenized battery model: The entire battery cell is treated as a single material. This approach uses a phenomenon-based material model fitted to match cell-level mechanical tests [25]. While this material model captures the overall deformation pattern of the battery cell, it does not represent any realistic material. The representative model is closer to true physics than the homogenized model because it incorporates the realistic mechanical, electrical, and thermal properties of each battery component. The battery cell comprises a loosely packed jelly roll structure with materials such as metal, polymer, graphite, etc., each having very different material properties such as Young’s modulus, stress–strain curve, thermal conductivity, resistivity, melting point, and more. It is not feasible to model the mechanical, electrical, and thermal behavior of each cell component accurately if they are bundled together and treated as a single material. For instance, the melting point for each cell component is different. The polymer separator fails around 135 °C. Some ceramic-coated separators can withstand 200 °C. The aluminum current collector sheet fails at 660 °C. Modeling these components together as a single material in the homogenized approach would overlook such critical distinction. Moreover, the phenomenon-based material model in the homogenized model lacks physical representation. The material model fitted to match one test may not match another test conducted on the same cell under different testing conditions. The homogenized model also struggles with electric modeling because it cannot accurately represent the internal circuit and resistivity variations among different cell parts. In contrast, the representative model can realistically predict internal resistance, voltage distribution, current flow, Joule heating power, and temperature distribution for each layer of the battery. Previous studies using a multi-physics single-cell representative model have shown its capability to match mechanical and electrical test results [32]. Following a similar methodology, the model employed in this study is calibrated using external short-circuit tests and spherical punch tests. It can simulate the coupled physical phenomena that lead to battery thermal runaway.

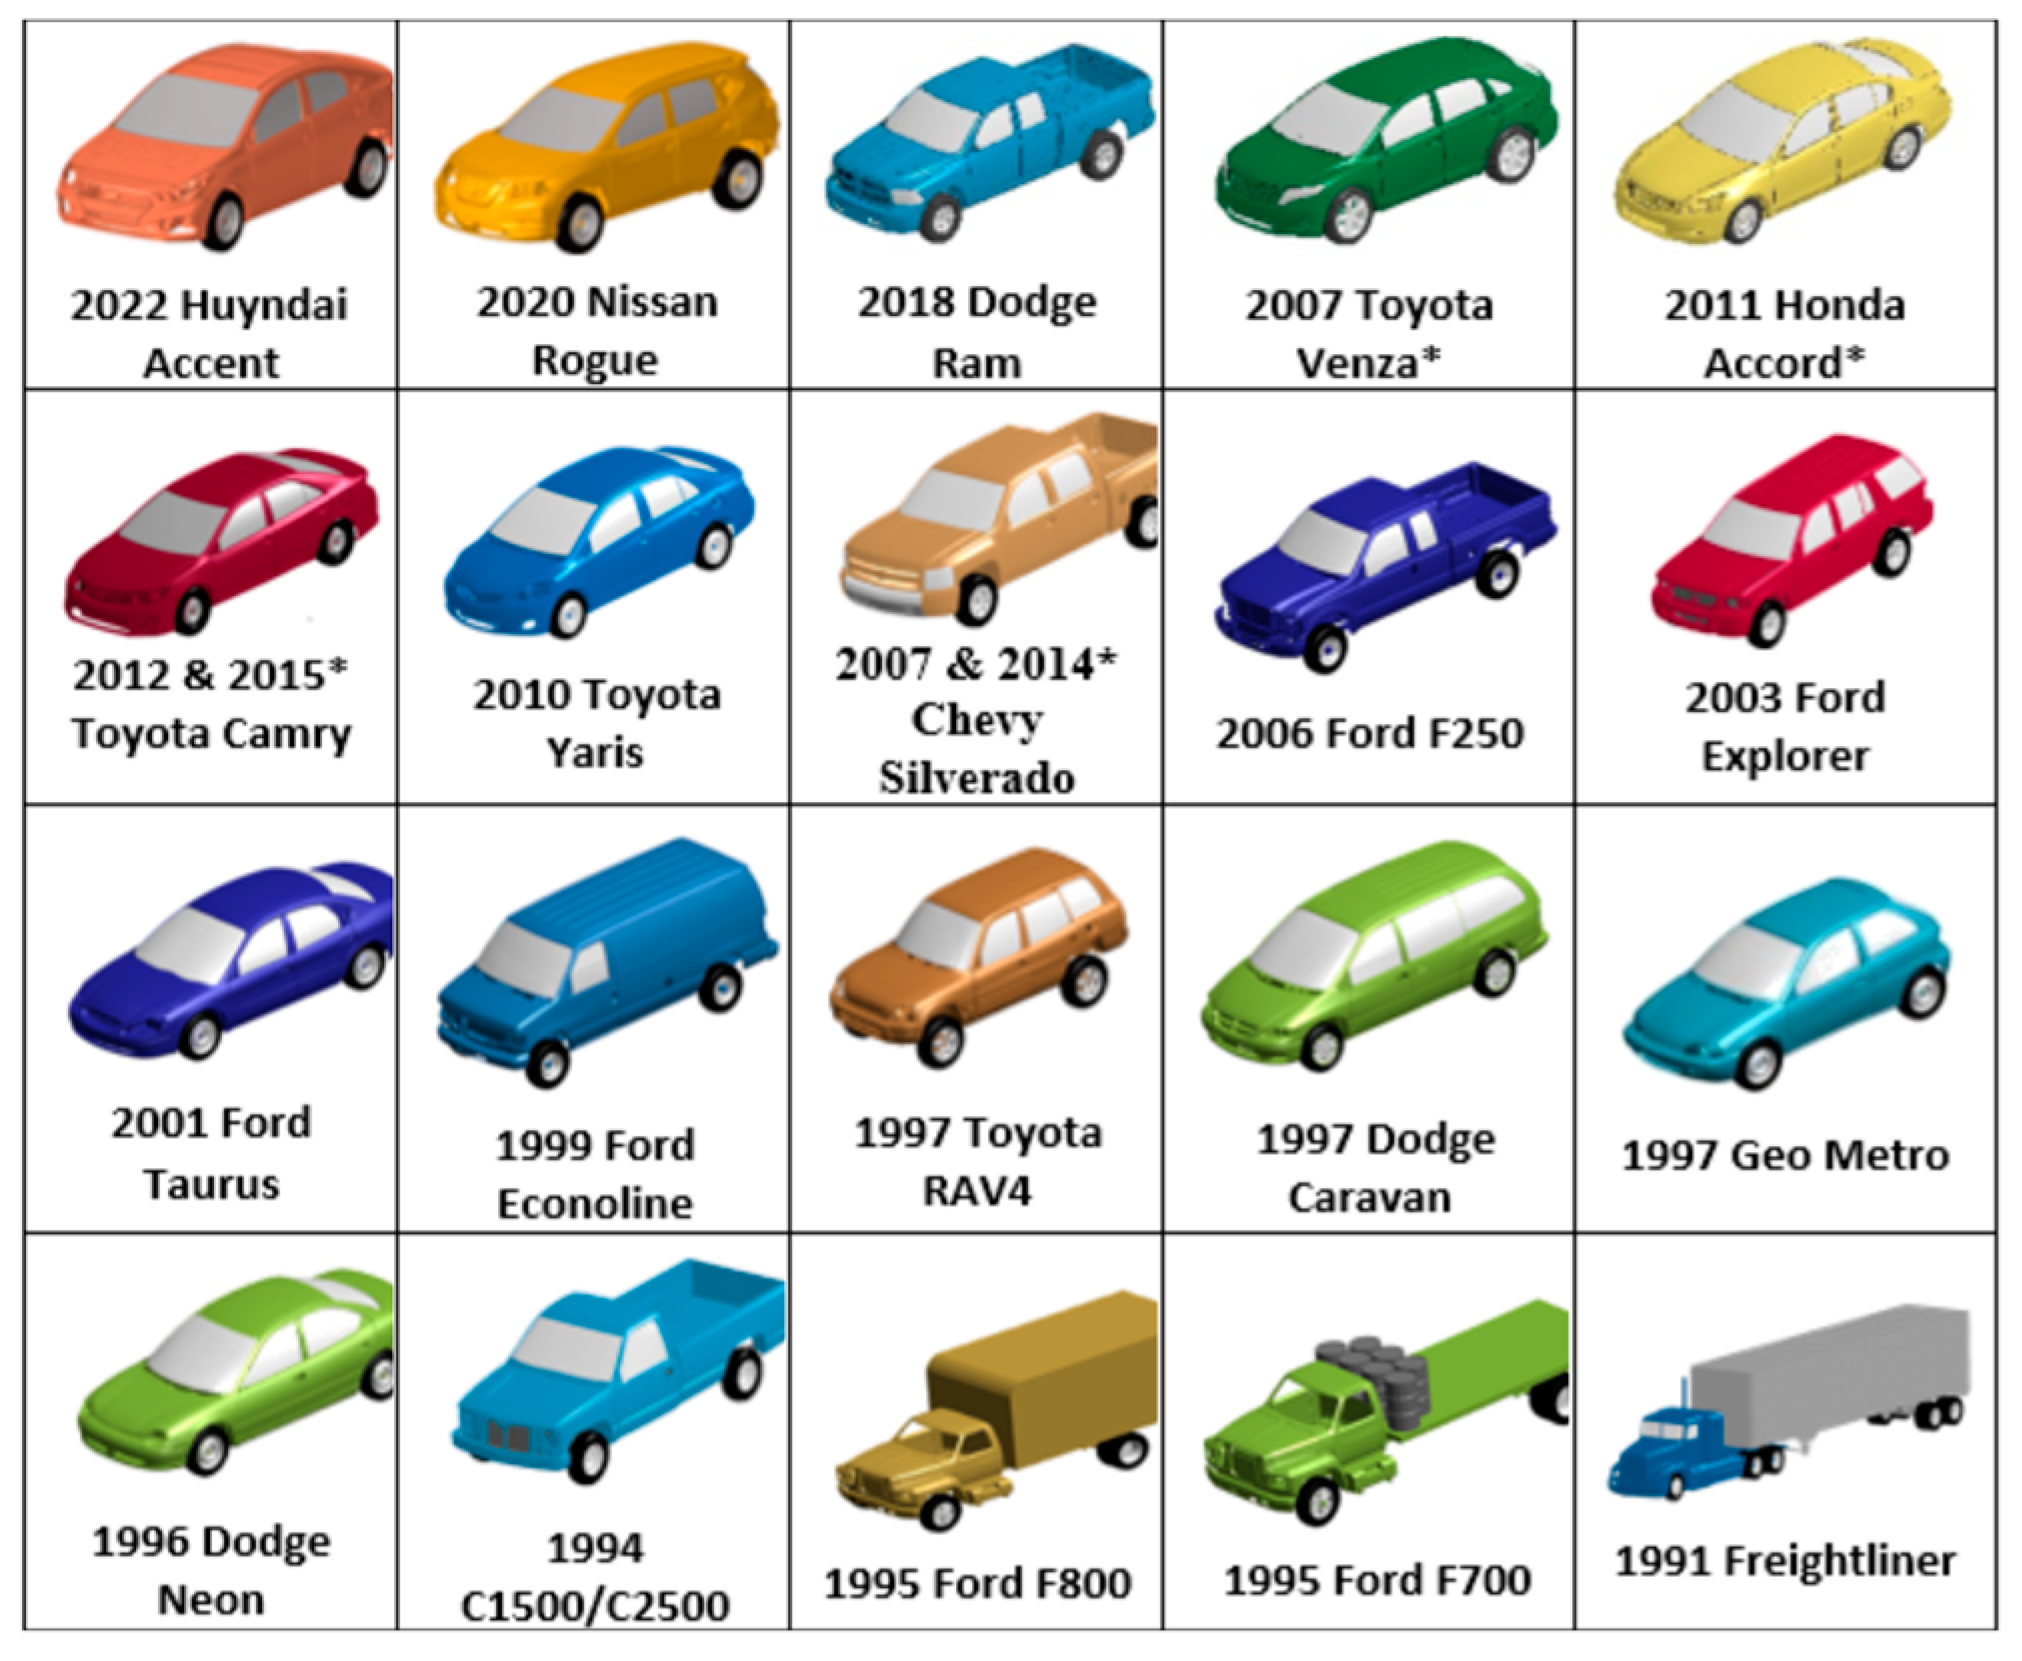
1.3. Full Vehicle Finite Element Models for Crash Analysis

Finite element analysis has been widely used to study the crashworthiness of automobiles and roadside hardware [50,51,52,53]. The National Highway Traffic Safety Administration (NHTSA) has sponsored the development of public domain finite element models for more than two decades to promote automobile safety and support the rule-making effort [54]. Center for Collision Safety and Analysis (CCSA) at George Mason University has developed or managed over 20 public domain vehicle crash analysis models based on the reverse engineering modeling protocol, as shown in Figure 2 [55]. These finite element models are created by reverse engineering the vehicle on the market, and they are also calibrated with the full vehicle crash tests to ensure physical representation. These simulation models provide a powerful tool for research in vehicle crash safety, occupant safety, pedestrian safety, restraint system design, biomechanics, fleet compatibility, roadside hardware, accident reconstruction, and many other fields. These models also serve as a modeling guideline for the state of the art of vehicle crash analysis. The typical procedure for developing a reverse-engineered crash analysis model is summarized as follows: The vehicle is tested for its weight, center of mass, and moment of inertia before disassembly. At the time of disassembly, the geometry and position of each part are laser scanned, and the thickness and mass of each part are also measured. The material test coupons are cut from parts to determine the stress–strain relation for the material model. Finite element mesh is generated based on the part geometry, thickness, and mass following a strict quality control criterion. The mesh of different parts is then connected with spotwelds, constraint rigid body, beam element, rotatable joints, and tied contact. The suspension, added mass, airbags, and restraint system are defined next. The contact is then defined with penetration checked. The finite element model is verified to match the mass, center of gravity, and moment of inertia of the vehicle. The developed finite element model is validated against multiple crash tests, including NCAP frontal impact, IIHS offset deformable barrier test, pole impact test, roof crash test, etc. The modeling is seen to provide satisfactory results [52,56,57]. The models feature accurate geometry, realistic material property, a soft interior, deployable airbags, and a full restraint system, making it a close representation of the actual vehicle.
The classical crash safety simulation models are built in mechanical-only analysis for the ICE vehicle. The reverse engineering FE model for battery electric vehicles requires a proof-of-concept study, especially for the method to model the battery. There are two decisions to be made regarding the technological path, with computational efficiency being the primary concern: (1) electrical–thermal–mechanical analysis vs. mechanical-only analysis: It is seen that thermal–electrical–mechanical-coupled analysis is necessary for capturing the battery thermal runaway. However, it was uncertain whether it was practical to simulate the entire BEV with all active connected battery cells in a multi-physics analysis. If this analysis takes too long to run on a typical cluster computer, then the mechanical-only model would be the only option. (2) Battery homogenized model vs. battery representation model: The battery homogenized model has the entire cell modeled with one chunk of material. The representation model has each cell part modeled separately, so the physical material property can be used. The representation model is more accurate but can be more expensive in computational time. It was uncertain whether the representation battery model runs fast enough for a full EV simulation on a typical cluster computer. If the representation model takes too long to run, then the homogenized model would be the only option.
This proof-of-concept study is the first to demonstrate that a thermal–electrical–mechanical-coupled analysis, using the representation battery model, can effectively simulate crash safety for electric vehicles and predict the battery thermal runaway. A typical multi-physics EV crash simulation can be completed within 24 h using a cluster computer with 24 CPUs.

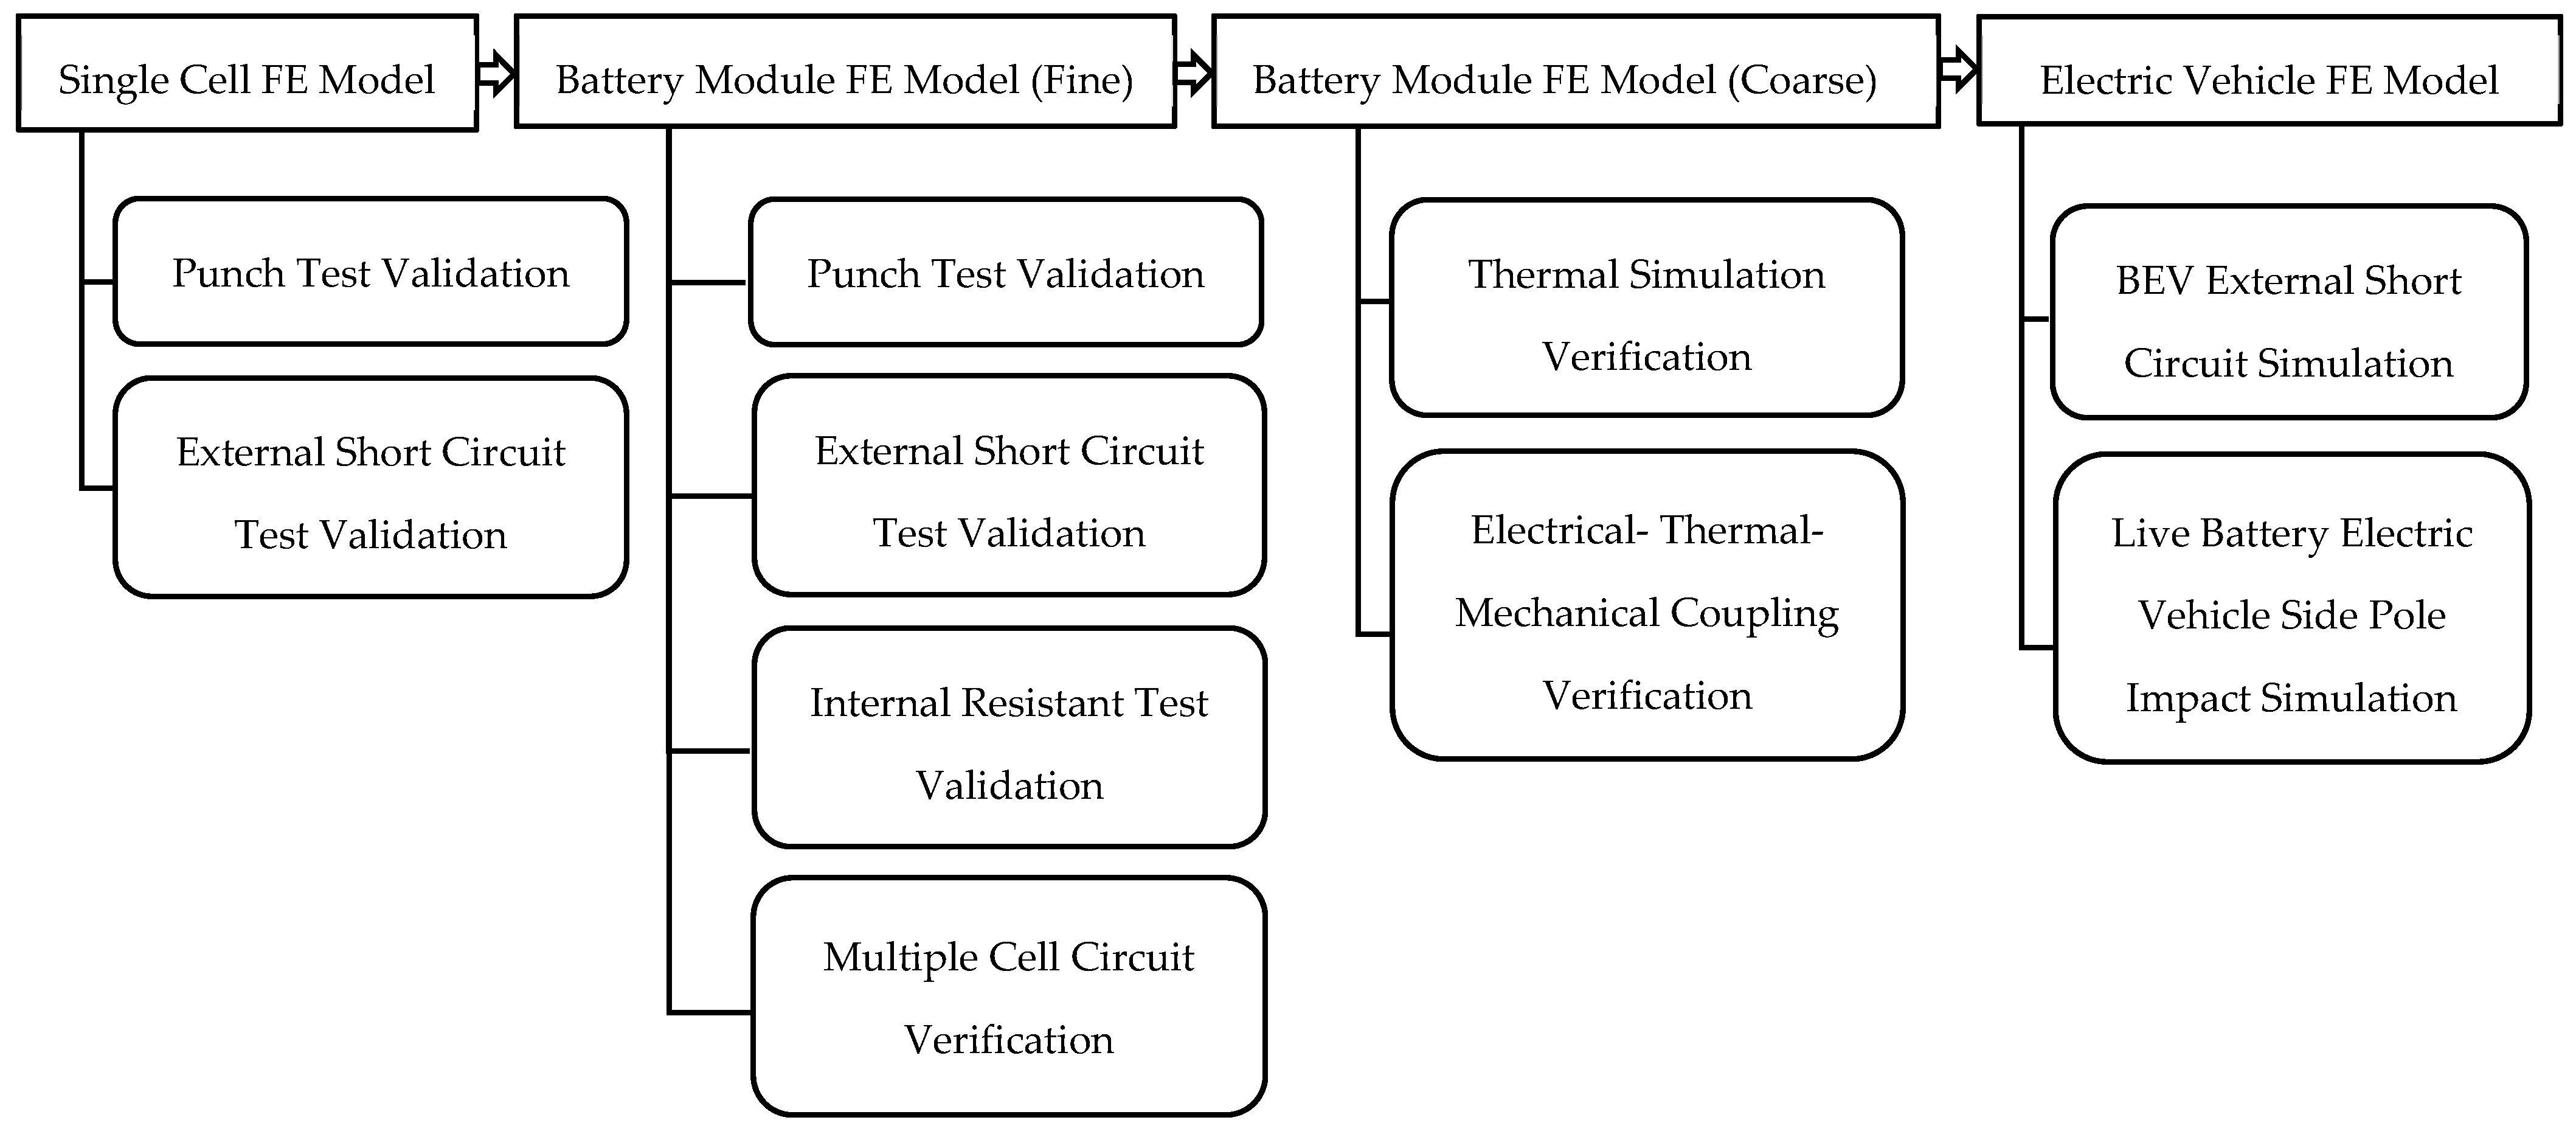
2. Methodology and Results

The thermal–electrical–mechanical-coupled crash analysis model is built in three stages: (1) a single battery cell; (2) a multi-cell battery module; and (3) a generic battery electric vehicle with 24 active cells. The multi-physics FE models and the simulation cases are summarized in Figure 3. The exterior and interior features of the generic BEV model represent the first-generation Google Waymo BEV. The body in white referenced the Toyota Yaris crash analysis model [58]. The battery cell and module represent the system used in the first-generation Nissan Leaf [59]. The battery cell modeling methodology and the detailed material parameters are developed in a previous study [32].
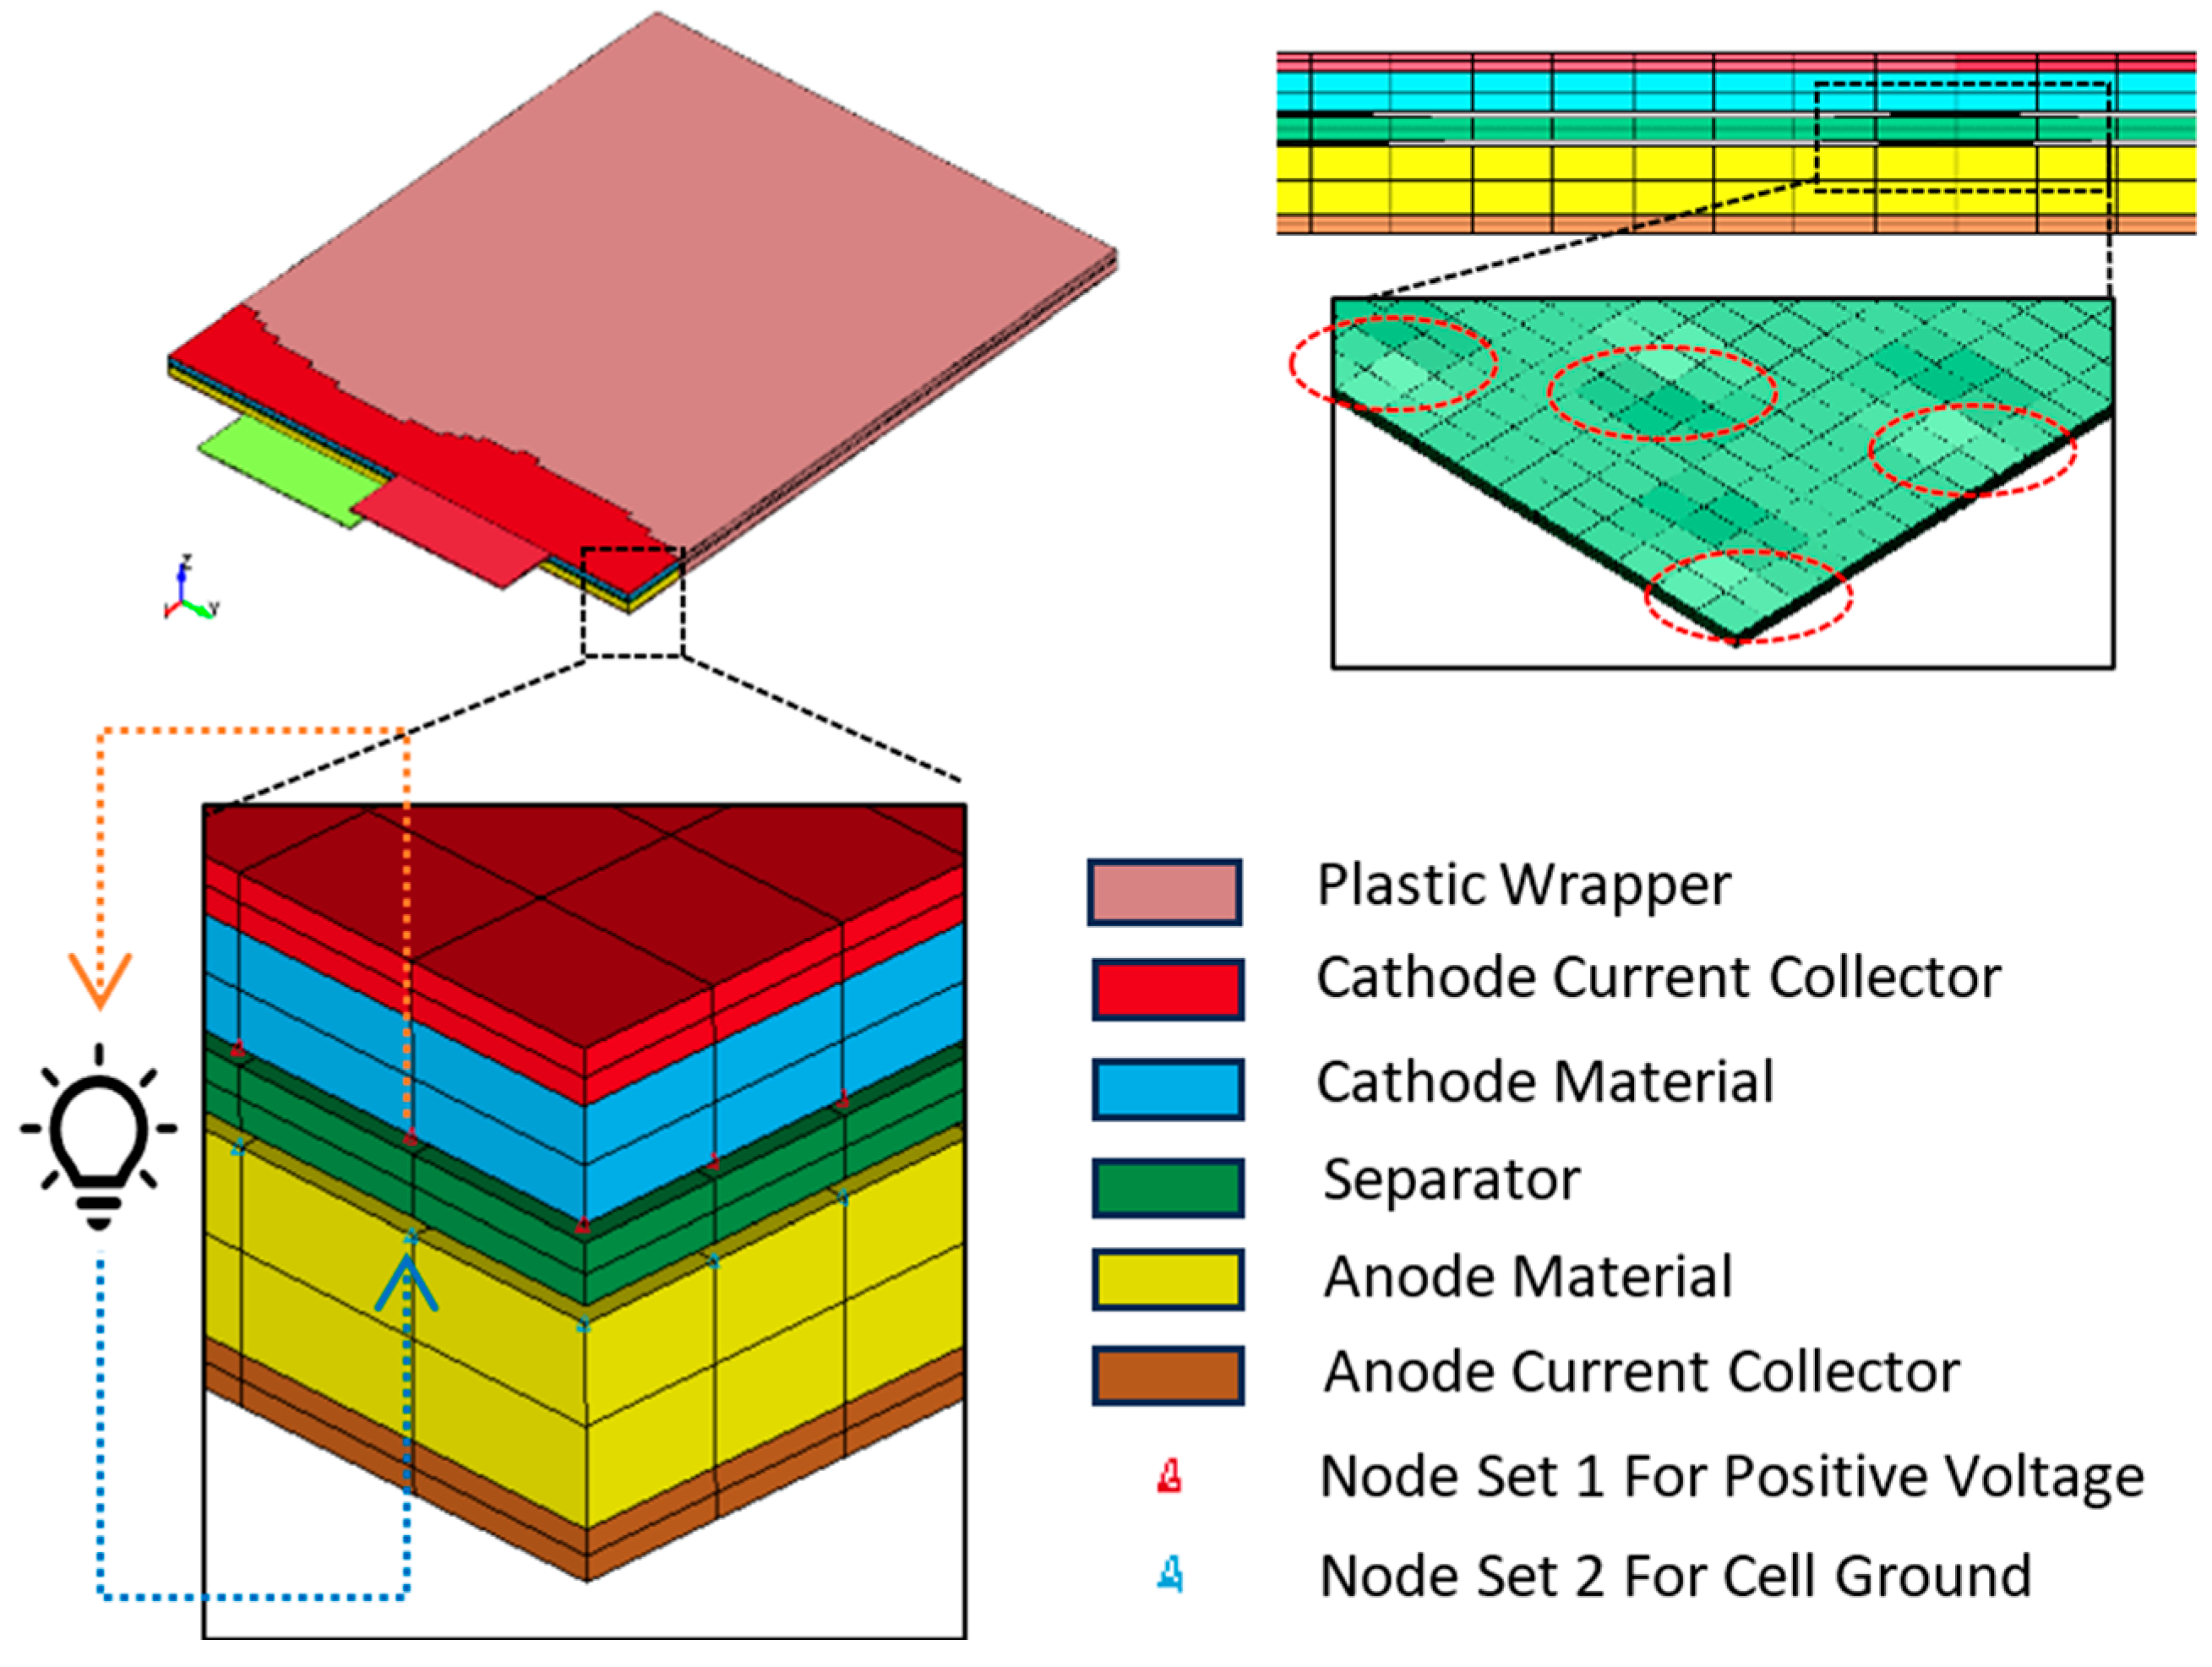
  • A. Single-Cell Model
The geometry of the single-cell model represents the battery cell used by Nissan Leaf [59]. A repurposed Nissan Leaf battery module (first generation) with 4 cells has been disassembled to the cell level. The model closely represents the exterior geometry of the cell. The cell dimension is 261   m m × 216   m m × 79   m m excluding the plastic wrapper, which has a thickness of 0.14   m m . The parts dimension inside the battery cell is proportionally scaled from the cells in previous studies [32,48]. Five plates are used to represent the multi-layer sandwich structure, each representing one battery part, as seen in Figure 4. In the simulation, the cathode current collector has a thickness of 0.857 mm, the cathode layer has a thickness of 1.745 mm, the gap between the cathode and separator is 0.266 mm, the separator has a thickness of 0.932 mm, the gap between the separator and anode is 0.266 mm, the anode layer has a thickness of 3.054 mm, the anode current collector has a thickness of 0.779 mm [48]. The thermal, electrical, and mechanical properties of each cell material are summarized in previous studies [32]. Two layers of solid elements are used on each plate to capture the strength of the cell in the thickness direction. The cathode and cathode current collector plate are connected by sharing nodes; the same also applies to the anode and anode current collector. A gap is necessary to represent the mechanical strength of the loosely packed battery layers [32]. The plate representing the separator is modeled with some “wrinkles” to reflect the loosely packed sandwich structure, as seen in Figure 4. Only certain parts of the separator touch the anode and cathode through frictional contact without sharing nodes. This configuration creates a gap between the separator and the two electrodes while still maintaining structural integrity under gravity.
The electric potential difference is defined between Node Set 1 (red) and Node Set 2 (blue), as shown in Figure 4. Only two node sets are defined for each battery cell. Node Set 1 contains all nodes with a positive voltage, while Node Set 2 contains all nodes with zero voltage. Since the voltage difference on the same battery component is usually very small, it is more efficient to define only one Randles circuit for each battery cell [29].
The electric current starts from Node Set 1 on the side of the cathode layer closer to the separator. The current flows through the cathode, cathode current collector, and cathode current collector tab to the external circuit. The circuit returns from the anode current collector tab, through the anode current collector and anode, and finally back to Node Set 2, which is on the other side of the anode layer closer to the separator. The capacitor and charge transfer resistance in the Randles circuit is analytically modeled by a generalized user-defined voltage source, as seen in Figure 5 (right), enabling the use of a resistance heating solver to simulate the Randles circuit. The detailed methodology and source code for the generalized voltage source are presented in previous work [32]. The thermal, mechanical, and electrical properties of cell component material and the process to determine equivalent circuit parameters can also be found in previous work [32].
The external short-circuit test is simulated using an FE battery cell model in LS-DYNA, as shown in Figure 5. The cell undergoes normal discharging until an external short circuit is formed at 5 × 10 4   s . The predicted current from the LS-DYNA simulation is compared to the result from CircuitLab, an electric circuit simulation software [60]. It is seen that the FE battery cell model accurately captures the dynamic circuit behavior and predicts the temperature rise of the separator. The FE simulation also precisely captures the peak current and the steady state current.
The mechanical property of the battery cell model is verified with a spherical punch test [61]. A 1-inch-diameter sphere indenter is used in the punch test. The LS-DYNA simulation result is compared with the test data in Figure 6. The results show that the battery cell FE model matches the mechanical properties in general. It is noted that the porosity of the lithium material and graphite coating will influence the stiffness of the cell under deformation [32]. The Young’s material and plastic strain vs. stress curve is scaled to 20% of the standard book value to reflect the porosity of the coated layers. Cell disassembly and detailed reverse engineering of the component part are necessary to further improve the accuracy of the cell model.
Thermal contact within the battery cell is also incorporated into the model, as it is a cortical factor in predicting physical phenomena that can lead to thermal runaway. The nonlinear transient thermal solver in LS-DYNA is used. A hybrid thermal contact model is used, considering heat conduction, convection, and radiation [62]. The heat conductance between contact surfaces is calculated as follows:
h = h 0 , 0 l g a p l m i n h c o n d + h r a d , l m i n < l g a p l m a x 0 , l g a p > l m a x
h c o n d = K l g a p
h r a d = f r a d ( T 1 + T 2 ) ( T 1 2 + T 2 2 )
f r a d = σ 1 ε 1 + 1 ε 2 1
l g a p is the gap between the two contact surfaces. h 0 is direct contact heat transfer conductance between two surfaces with a gap smaller than l m i n . h c o n d is the heat conductance of the fluid filling the gap fluid between the contact surfaces K is the fluid’s thermal conductivity. K = 0.58   W / m and K = 0.024   W / m were adopted for thermal conductivity for the liquid electrolyte and air, respectively [63,64]. f r a d is the radiant heat transfer factor between contact surfaces. Stefan–Boltzmann constant σ = 5.6703 × 10 8   ( W / m 2 K 4 ) . ε 1 , ε 2 are the emissivity of two surfaces. The emissivity of black body ε 1 = ε 2 = 1 is assumed [62]. T 1 , T 2 are the absolute temperature of two contact surfaces, respectively. Inside the wrapper of the battery cell, the thermal conductivity of water ( K = 0.58   W / m ) is used to represent the liquid electrolyte between the battery layers. Outside the battery cell, the thermal conductivity of air K = 0.024   W / m is used for all other situations. Two different contact cards are set up separately to define the thermal contact within the battery cells, as seen in Figure 7, and outside the battery cells, as shown in Figure 8. The same contact card also defines the mechanical contact between surfaces. The surface-to-surface contact needs to be used for the combined thermal and mechanical contact. The dynamic friction coefficient, static fiction coefficient, and exponential decay coefficient are set to be 0.005 , 0.004 , and 0.001 , respectively [62].
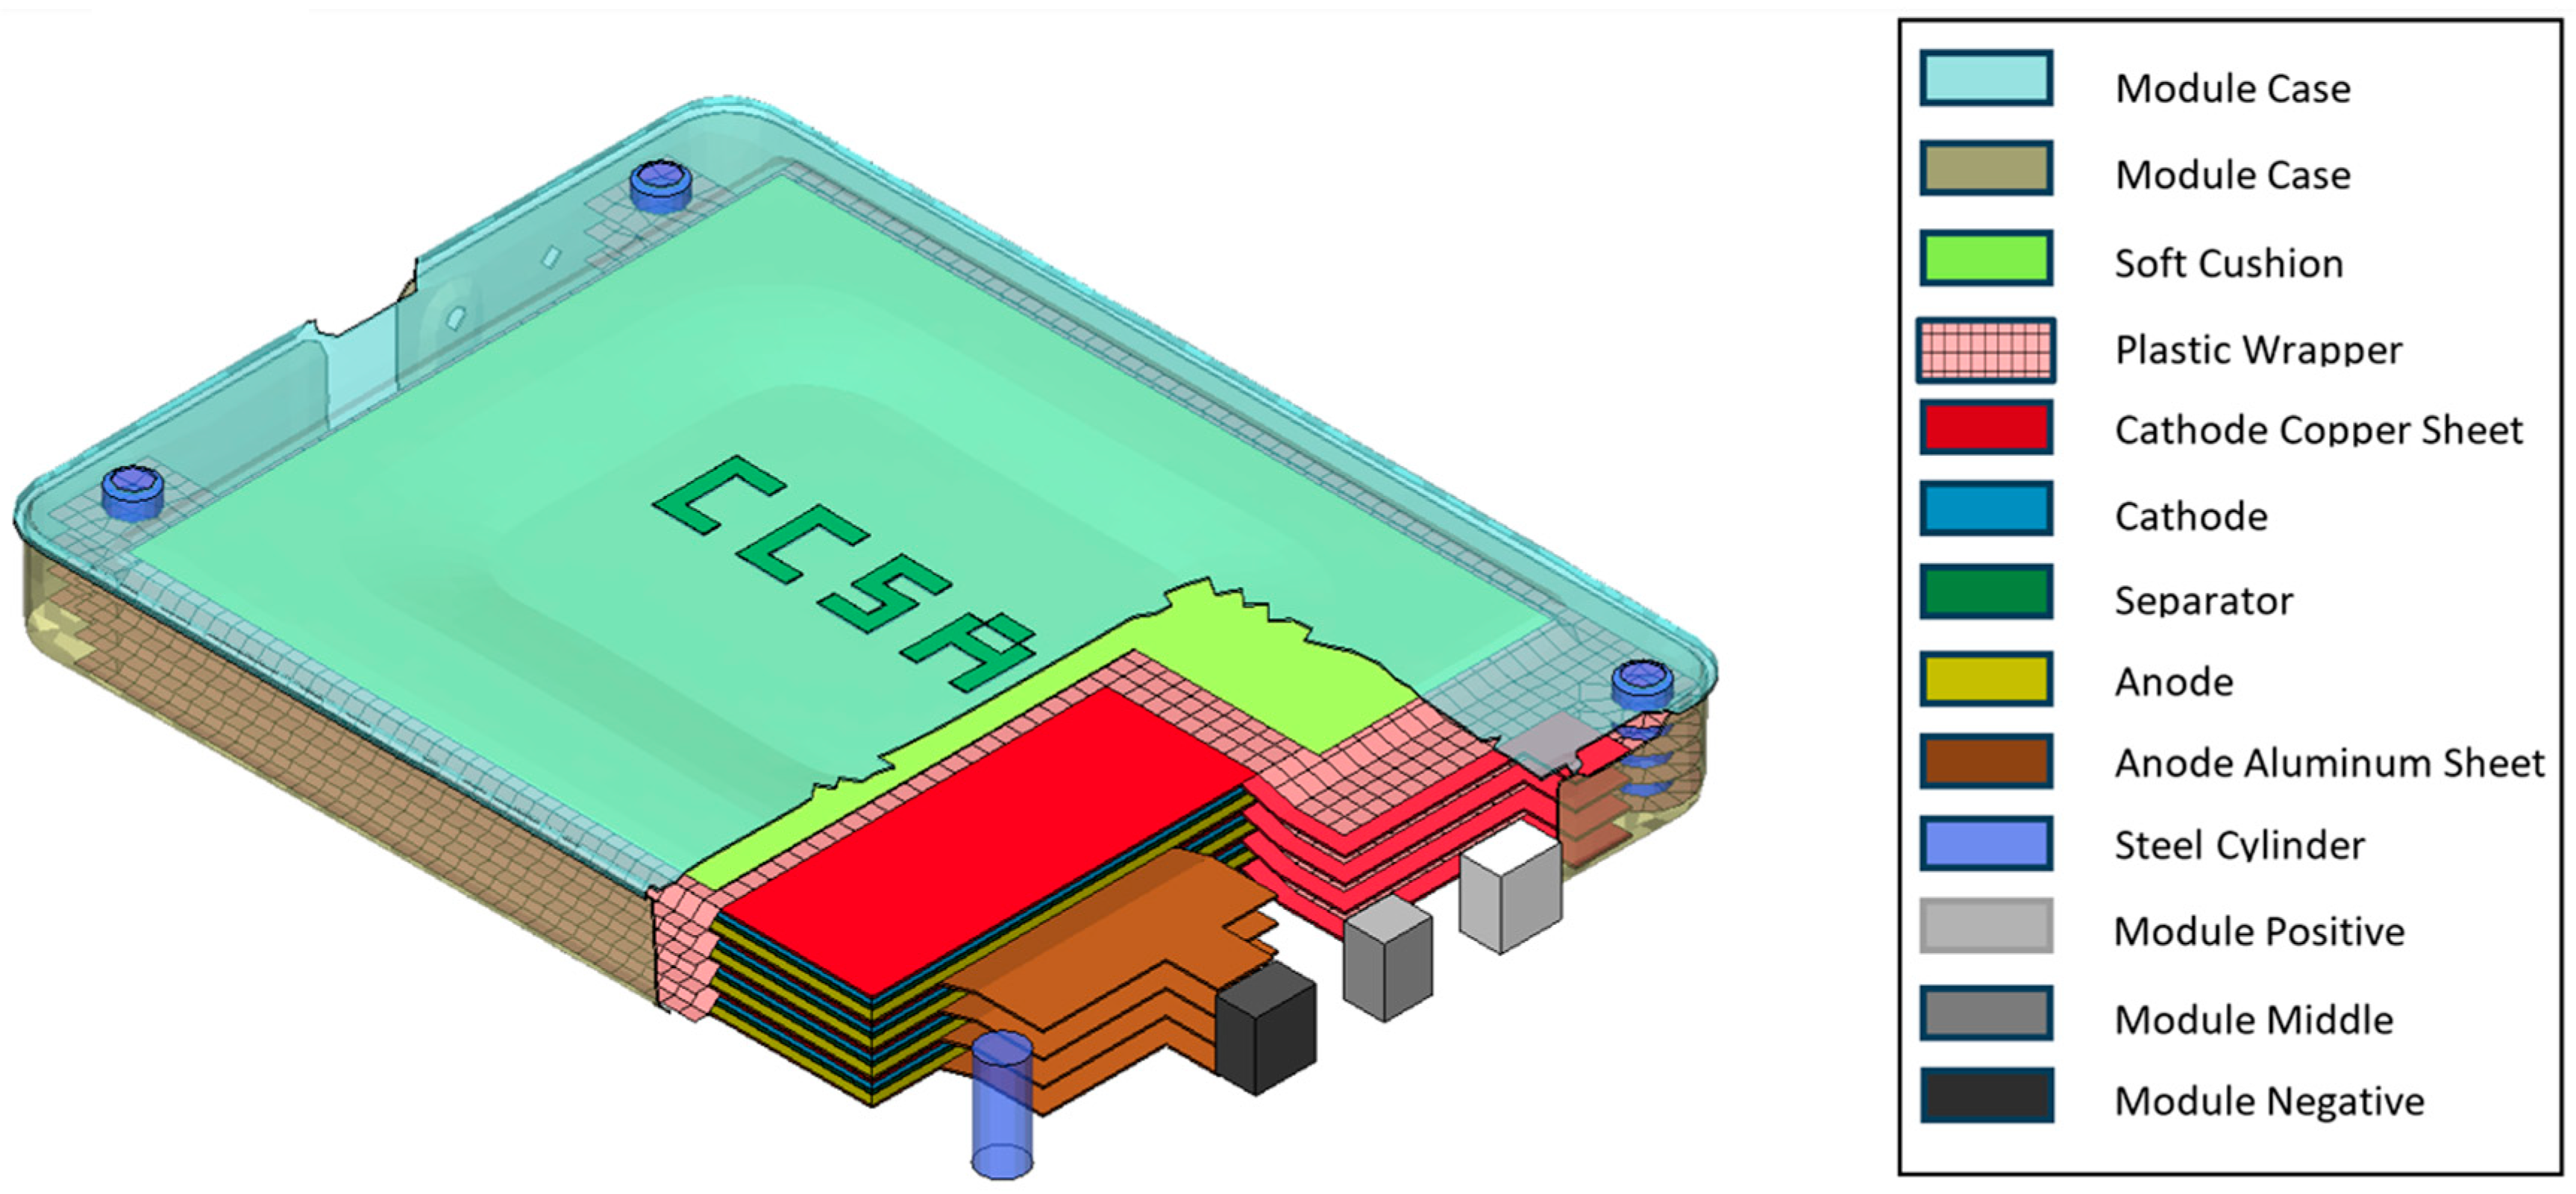
  • B. Battery Module Models
A battery module consists of multiple individual battery cells assembled into a single unit. These cells are connected in serial or parallel to achieve the desired voltage and capacity. The module case offers structure integrity, housing the electric connection, and protects the cells against external impact. The battery module is often the minimal replaceable part in an EV. The FE model of the battery module represents the system used in Nissan Leaf [59]. The battery module contains four lithium-ion battery cells in a 2s2p configuration, where two pairs of parallel-connected cells are connected in serial. The module exterior dimension is 303 × 223 × 55 mm, and the weight is 3.8 kg [65]. In the simulation, the element size of the battery layers is 2 mm in plain and 0.34~1 mm in thickness. There are a total of 275,577 elements in this model. The cathode, cathode current collector, separator, anode, anode current collector, module case, and case cover are modeled with solid elements, as shown in Figure 9. The cushion and plastic wrap are modeled with shell elements. The dimensions of the single-cell model from the previous section have been slightly adjusted to fit into the case geometry of the Nissan Leaf battery module. The material parameters for the battery module model are the same as those used in the single-cell model [32]. Simulation of an event for 0.2 s in the battery module model takes approximately 3 h. The electrical functions in this model operate as expected.
(1)
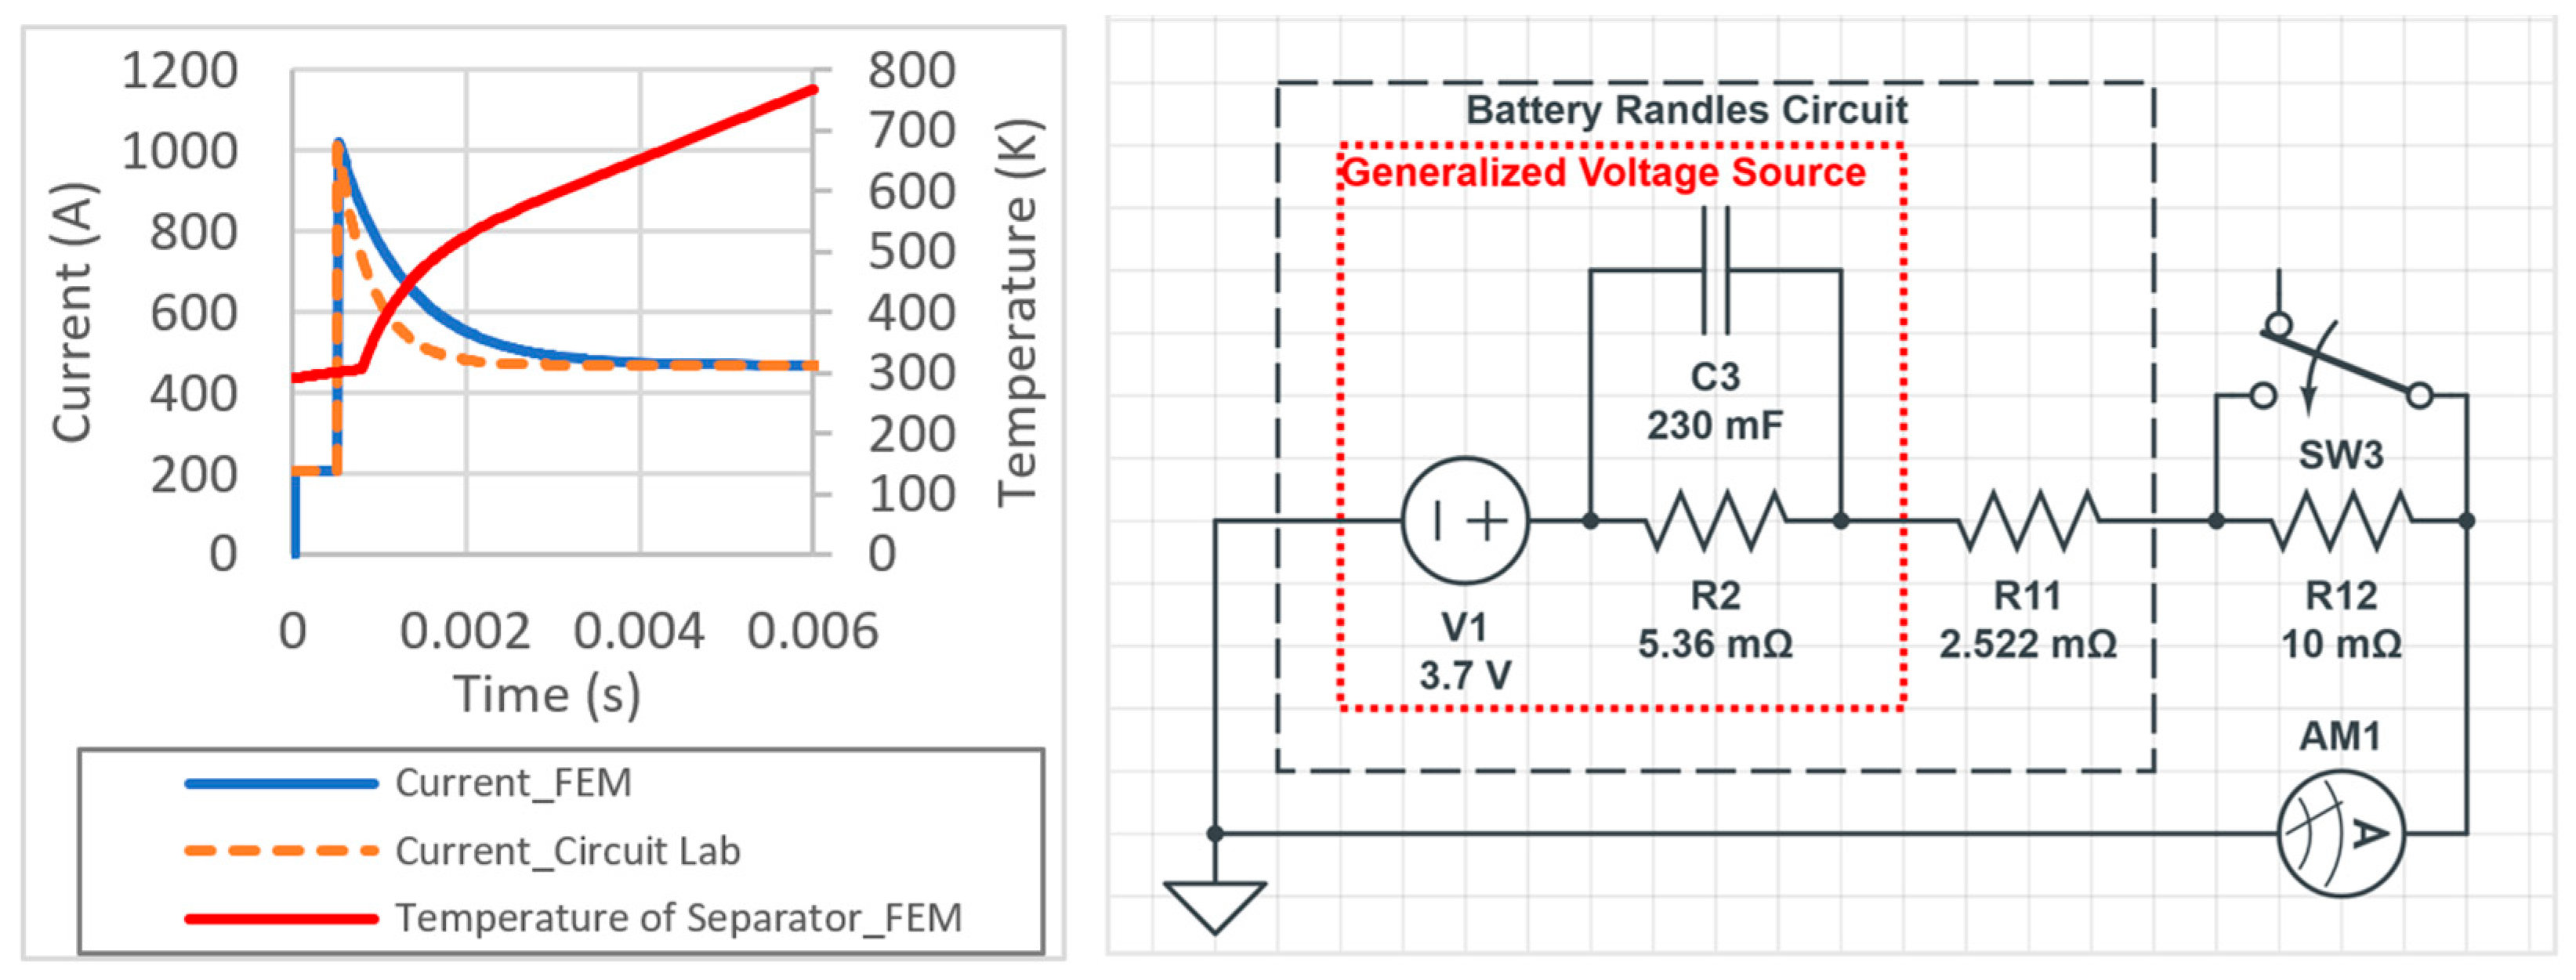
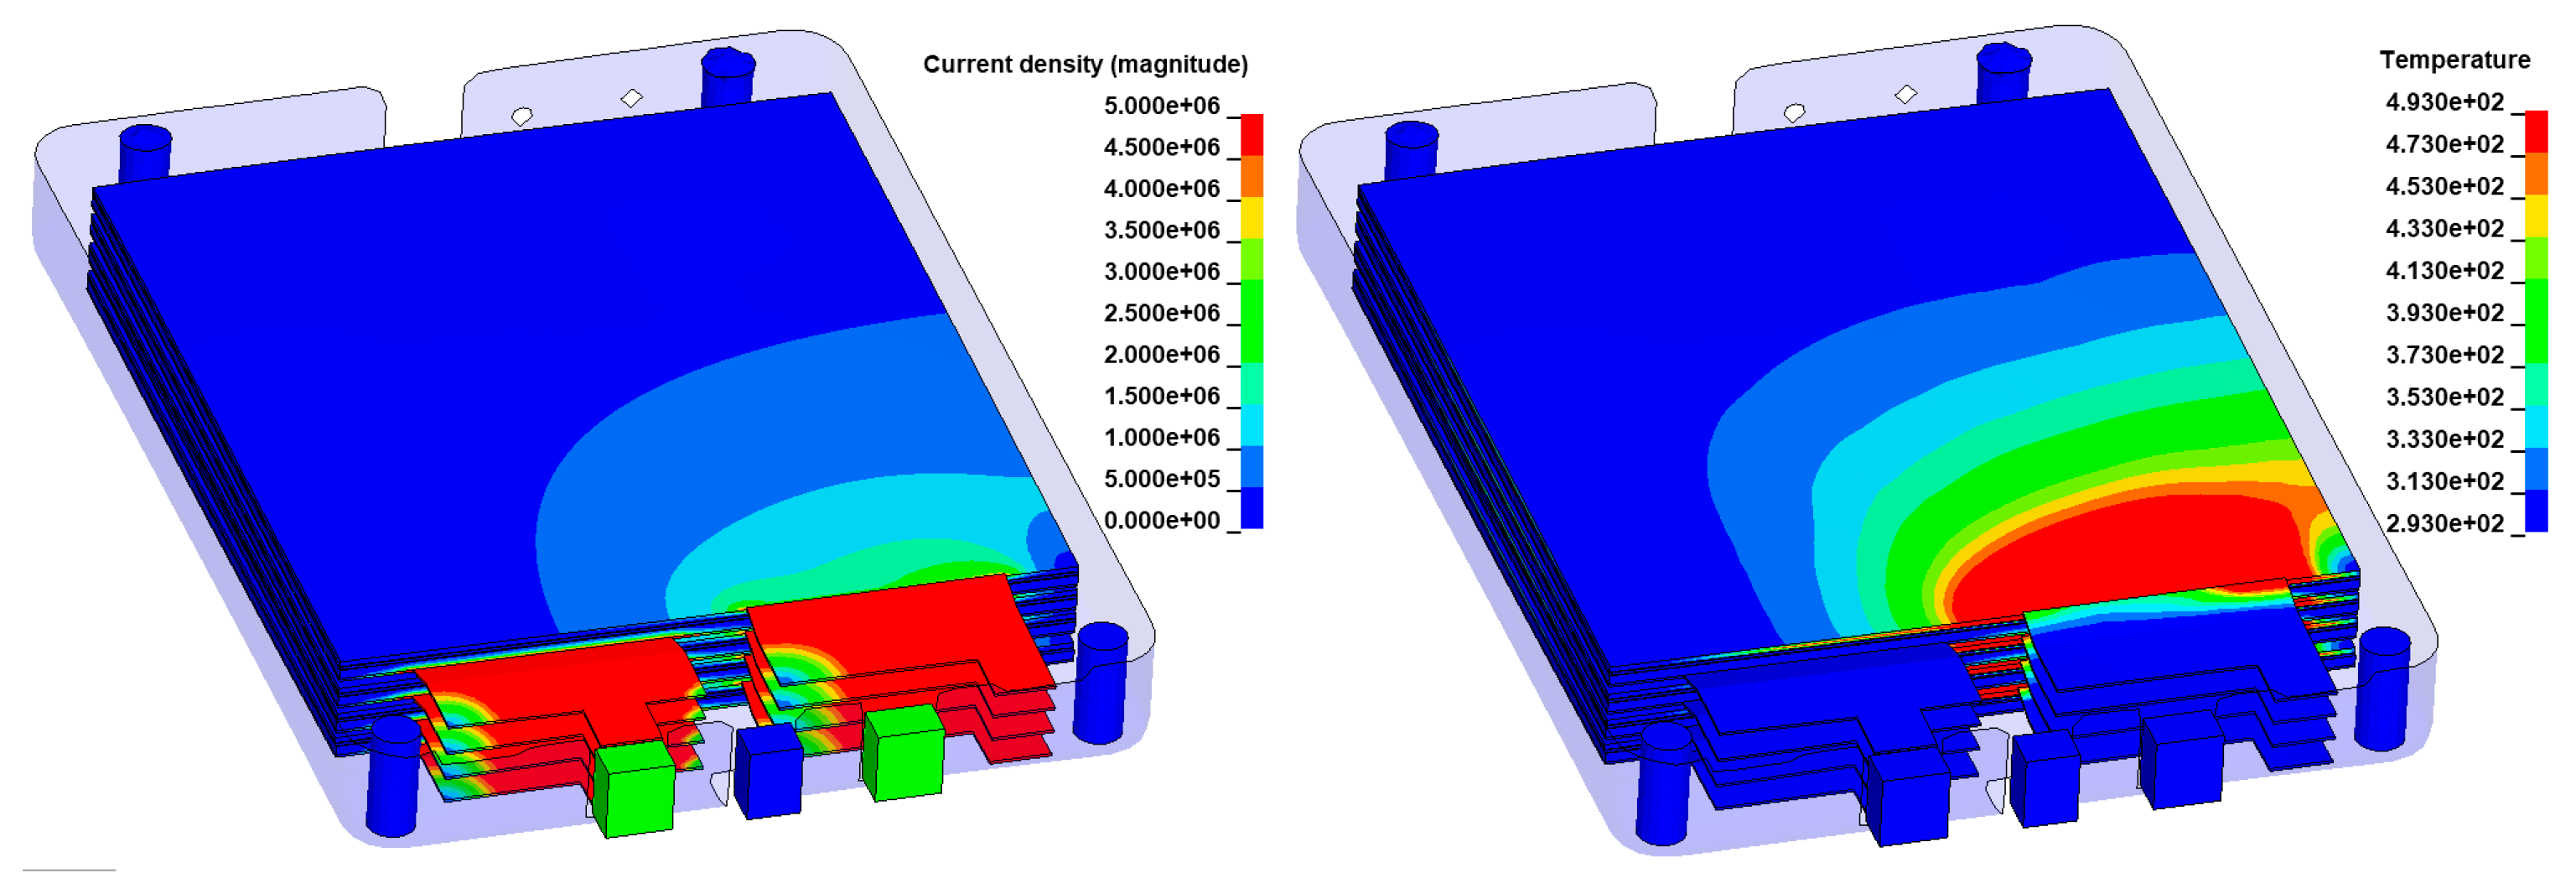
Electric Verification
It is necessary to verify whether the use of a user-defined voltage source to model the Randles circuit can be extended to multiple cells in electrical–thermal–mechanical simulation. Verification cases include two different battery cells in serial connection, as seen in Figure 10, and in parallel connection, as seen in Figure 11. Note that the voltage and the capacitance for the two battery cells are different. The result demonstrates that the electric simulation functions correctly for the two cells in live circuit connections. The method to model the Randles circuit with a generalized voltage source is described in the appendix of previous work [32]. It is important to ensure that each cell has a unique function name and ID for the generalized voltage source that is connected to the circuit. Relative potentials must also be used in the user-defined voltage source, with only one ground defined with an absolute potential value for the entire circuit. The theoretical values from CircuitLab [60] are used to verify the electrical simulation in LS-DYNA. The results show that the dynamic effect of the circuit can be accurately captured in LS-DYNA’s multi-physics simulation. Therefore, the electric modeling method used for single cells can be extended to model multiple cells connected in the circuit.
The simulation of an external short circuit is used to verify the electrical behavior of the Leaf battery module, which consists of 4 cells in the circuit, as shown in Figure 12 (top). The result in Figure 12 (bottom) aligns well between the CircuitLab and LS-DYNA simulations. Notice that the internal ohmic resistance of the cells, such as R11, R12, R13, and R14 in Figure 12 (top), is determined through finite element analysis and used as input in the CircuitLab simulation. The LS-DYNA simulation calculates the internal resistance for each cell as 2.927 m . Table 1 compares the internal resistance value from the finite element simulation with the value from battery module testing and the literature sources. The battery module is tested for its DC internal resistance and AC impedance at 1 kHz using an electrochemical workstation CHI660E. Additionally, AC impedance is tested with battery impedance tester YR1035+. The finite element simulation result of 2.927 m closely matches the literature value ranging from 1.1 m to 6.0 m in the literature [66]. The measured AC impedance and DC internal resistance are higher than the literature value, possibly due to the fact that the test subject is a repurposed electric vehicle battery module retired from EVs. Future tests should focus on determining the charge transfer resistance (e.g., R1, R2, R3, R4) and capacitance (e.g., C5, C6, C3, C4), as shown in Figure 12 (top), using electrochemical impedance spectroscopy [67].
The current density contour for the battery module model, shown in Figure 13 (left), reveals a higher accumulation of current near the tab area, indicating effective electrical stimulation. The temperature contour in Figure 13 (right) shows the highest temperature at the cathode layer near the current collector tab. This suggests that the electric and thermal simulations are functioning as expected.
(2)
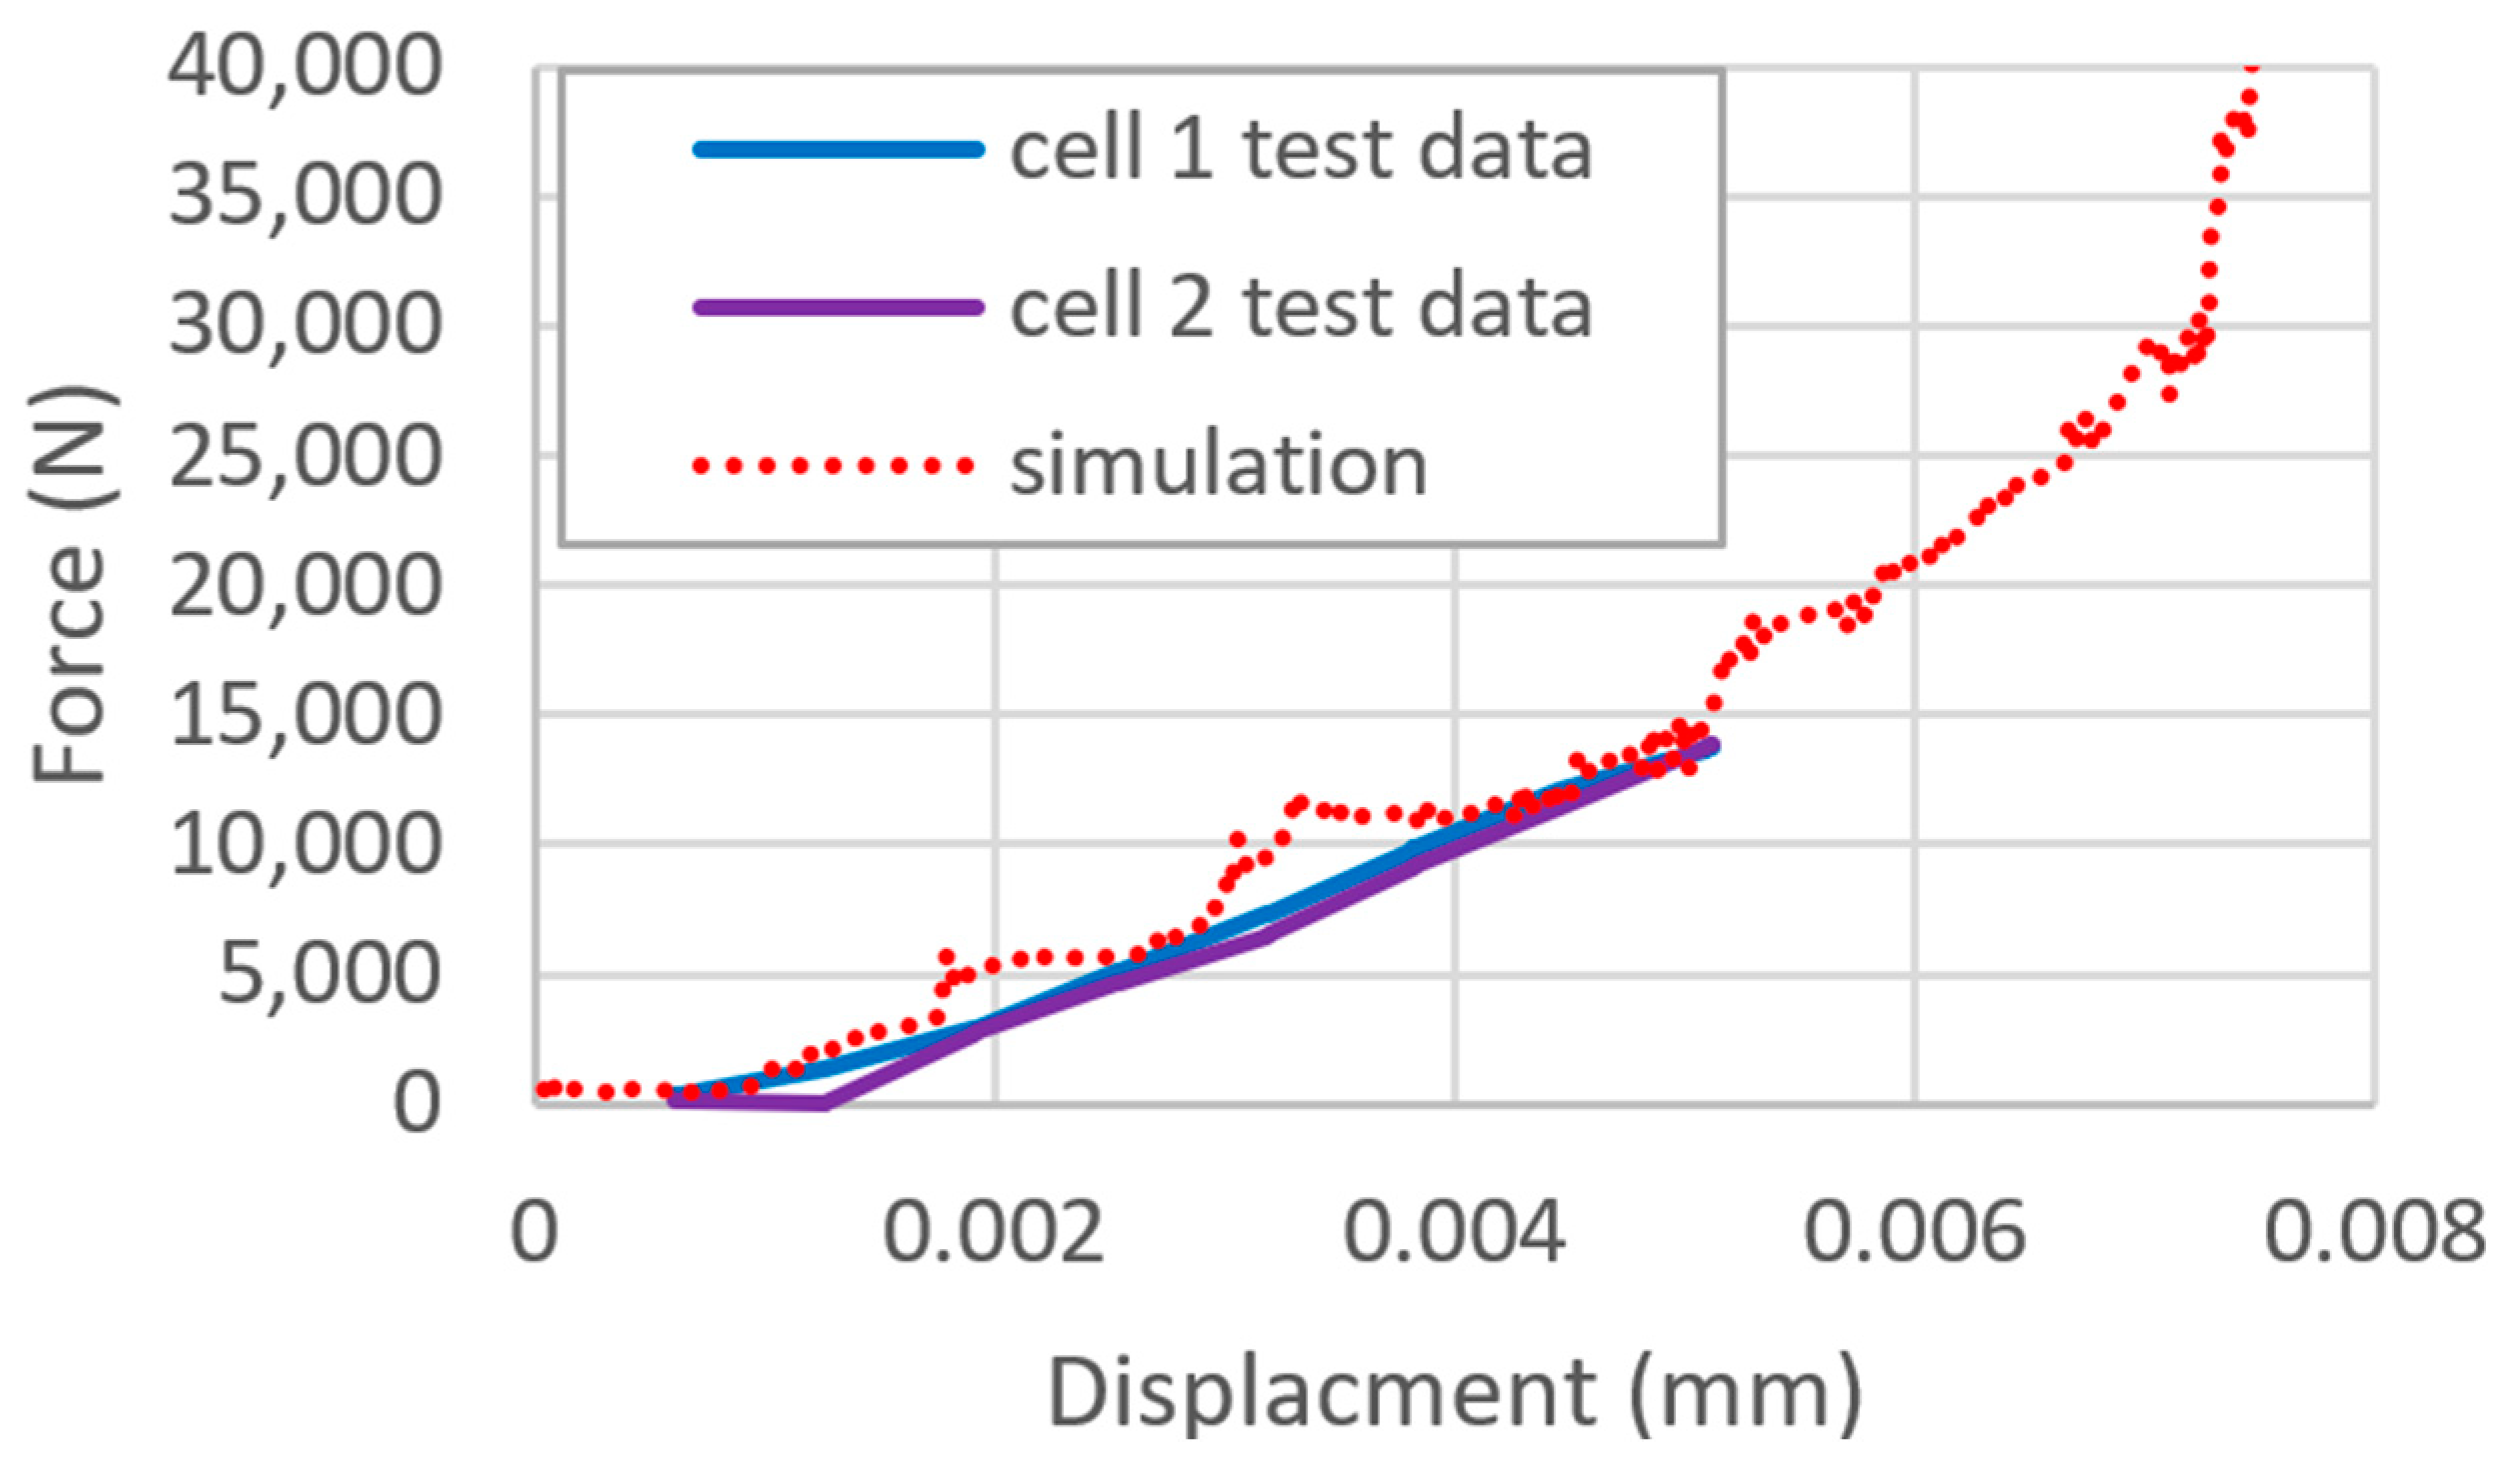
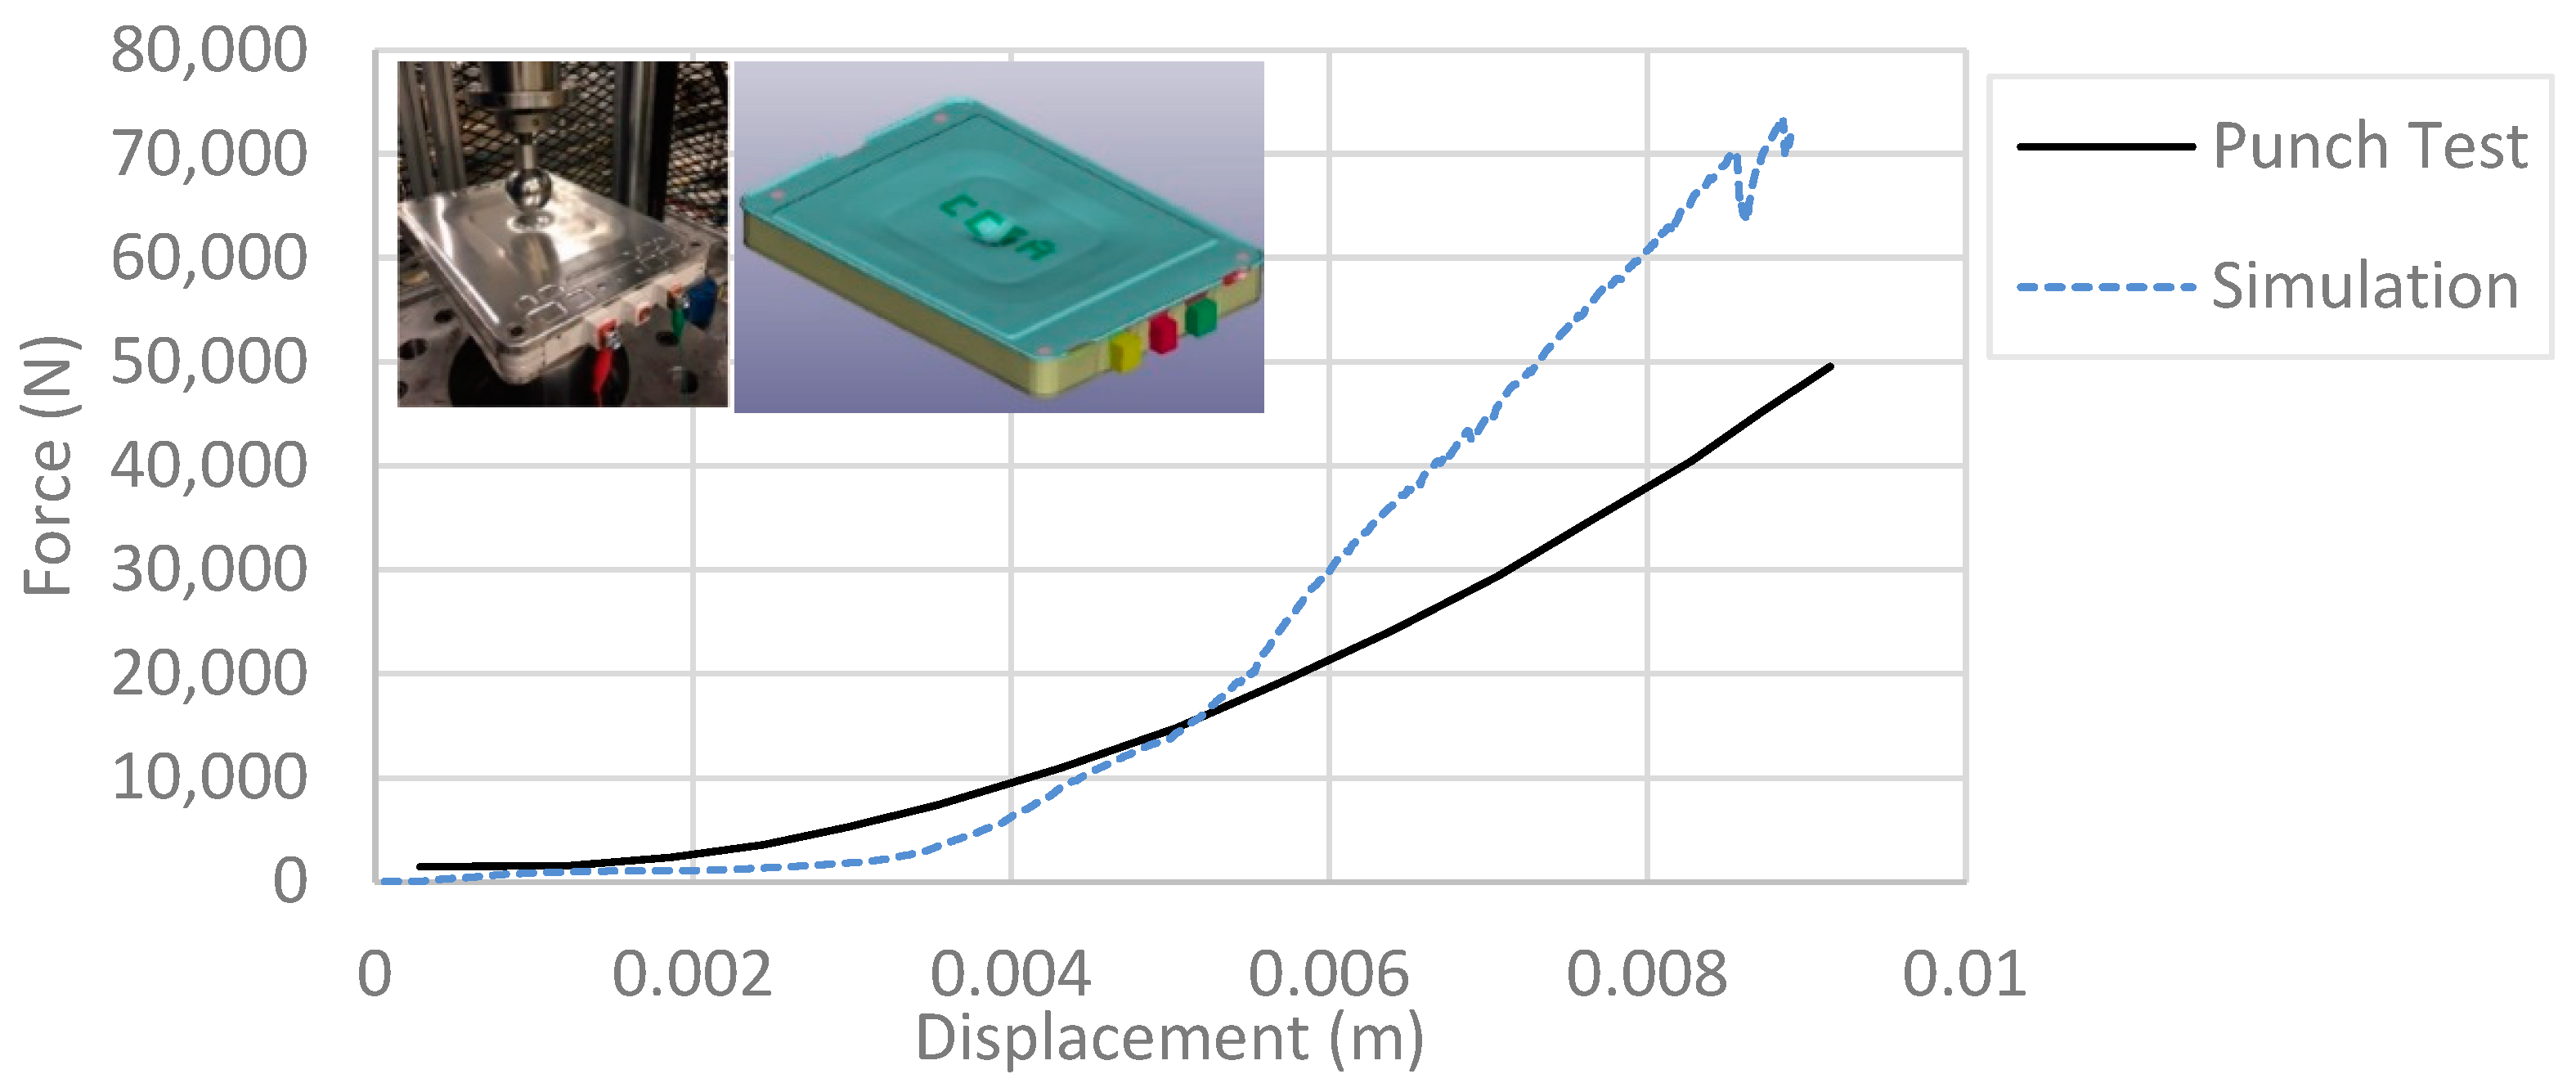
Mechanical Verification
We simulated the spherical indentation test conducted on the Leaf module by Oak Ridge National Laboratory, using a 2-inch-diameter sphere as the punch head at a punching speed of 0.1 inch/min [26,61,68]. The result shows a general match in the force vs. displacement response, as seen in Figure 14. It should be noted that the module case serves as the primary load-bearing structure in the battery module design. A detailed reverse engineering process and material modeling of the battery module case and cushion pads are necessary to further increase the simulation accuracy.
(3)
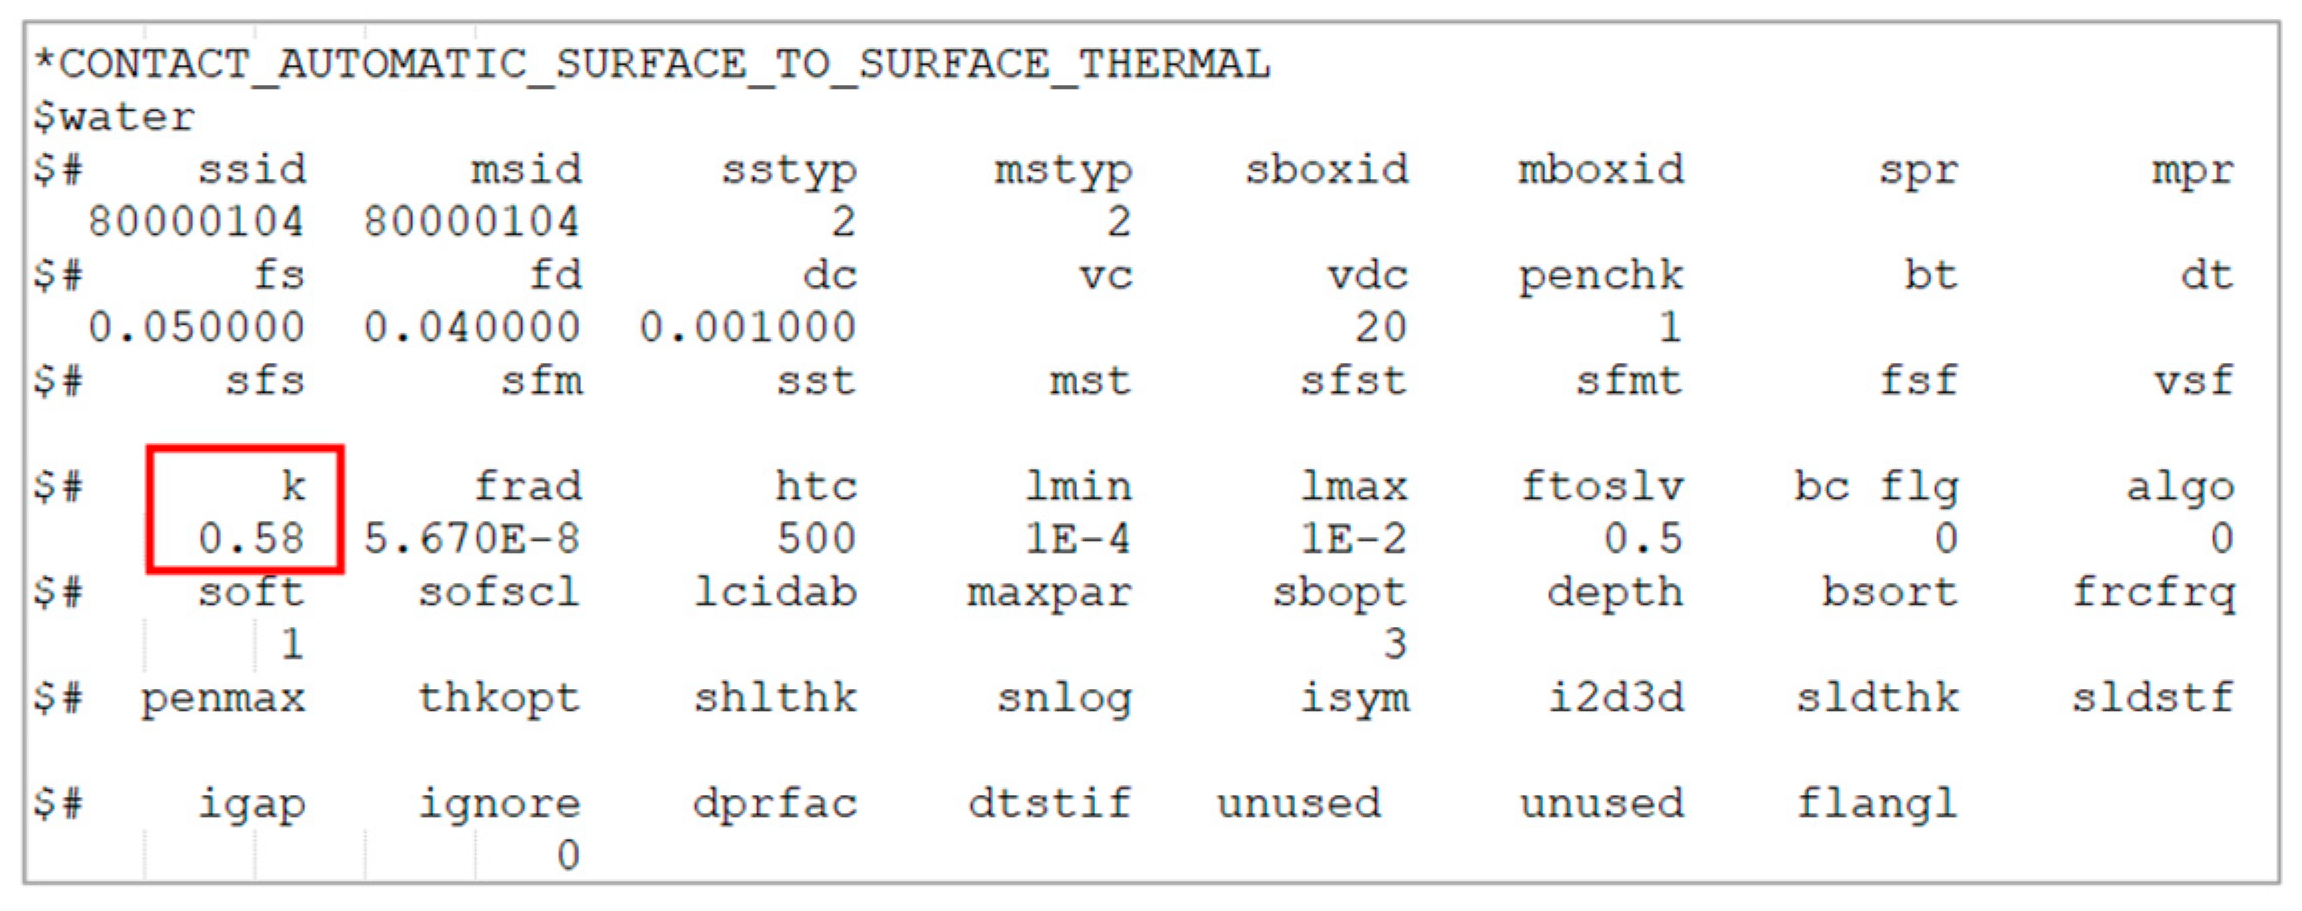
Thermal Verification
The resistive heat generation, heat conduction, and thermal contact of the battery module model are verified in an external short-circuit simulation. The heat generated by Joule heating gradually propagates throughout the entire module, as seen in Figure 15. The primary heating source is observed in the cathode layer. The area near the current collector tab has a higher temperature due to the higher current passing through that location. The heat transfers from the cathode to the metal cathode current collector, then through the plastic wrapper, the cell cushion pad, and finally to the aluminum module cover.
(4)
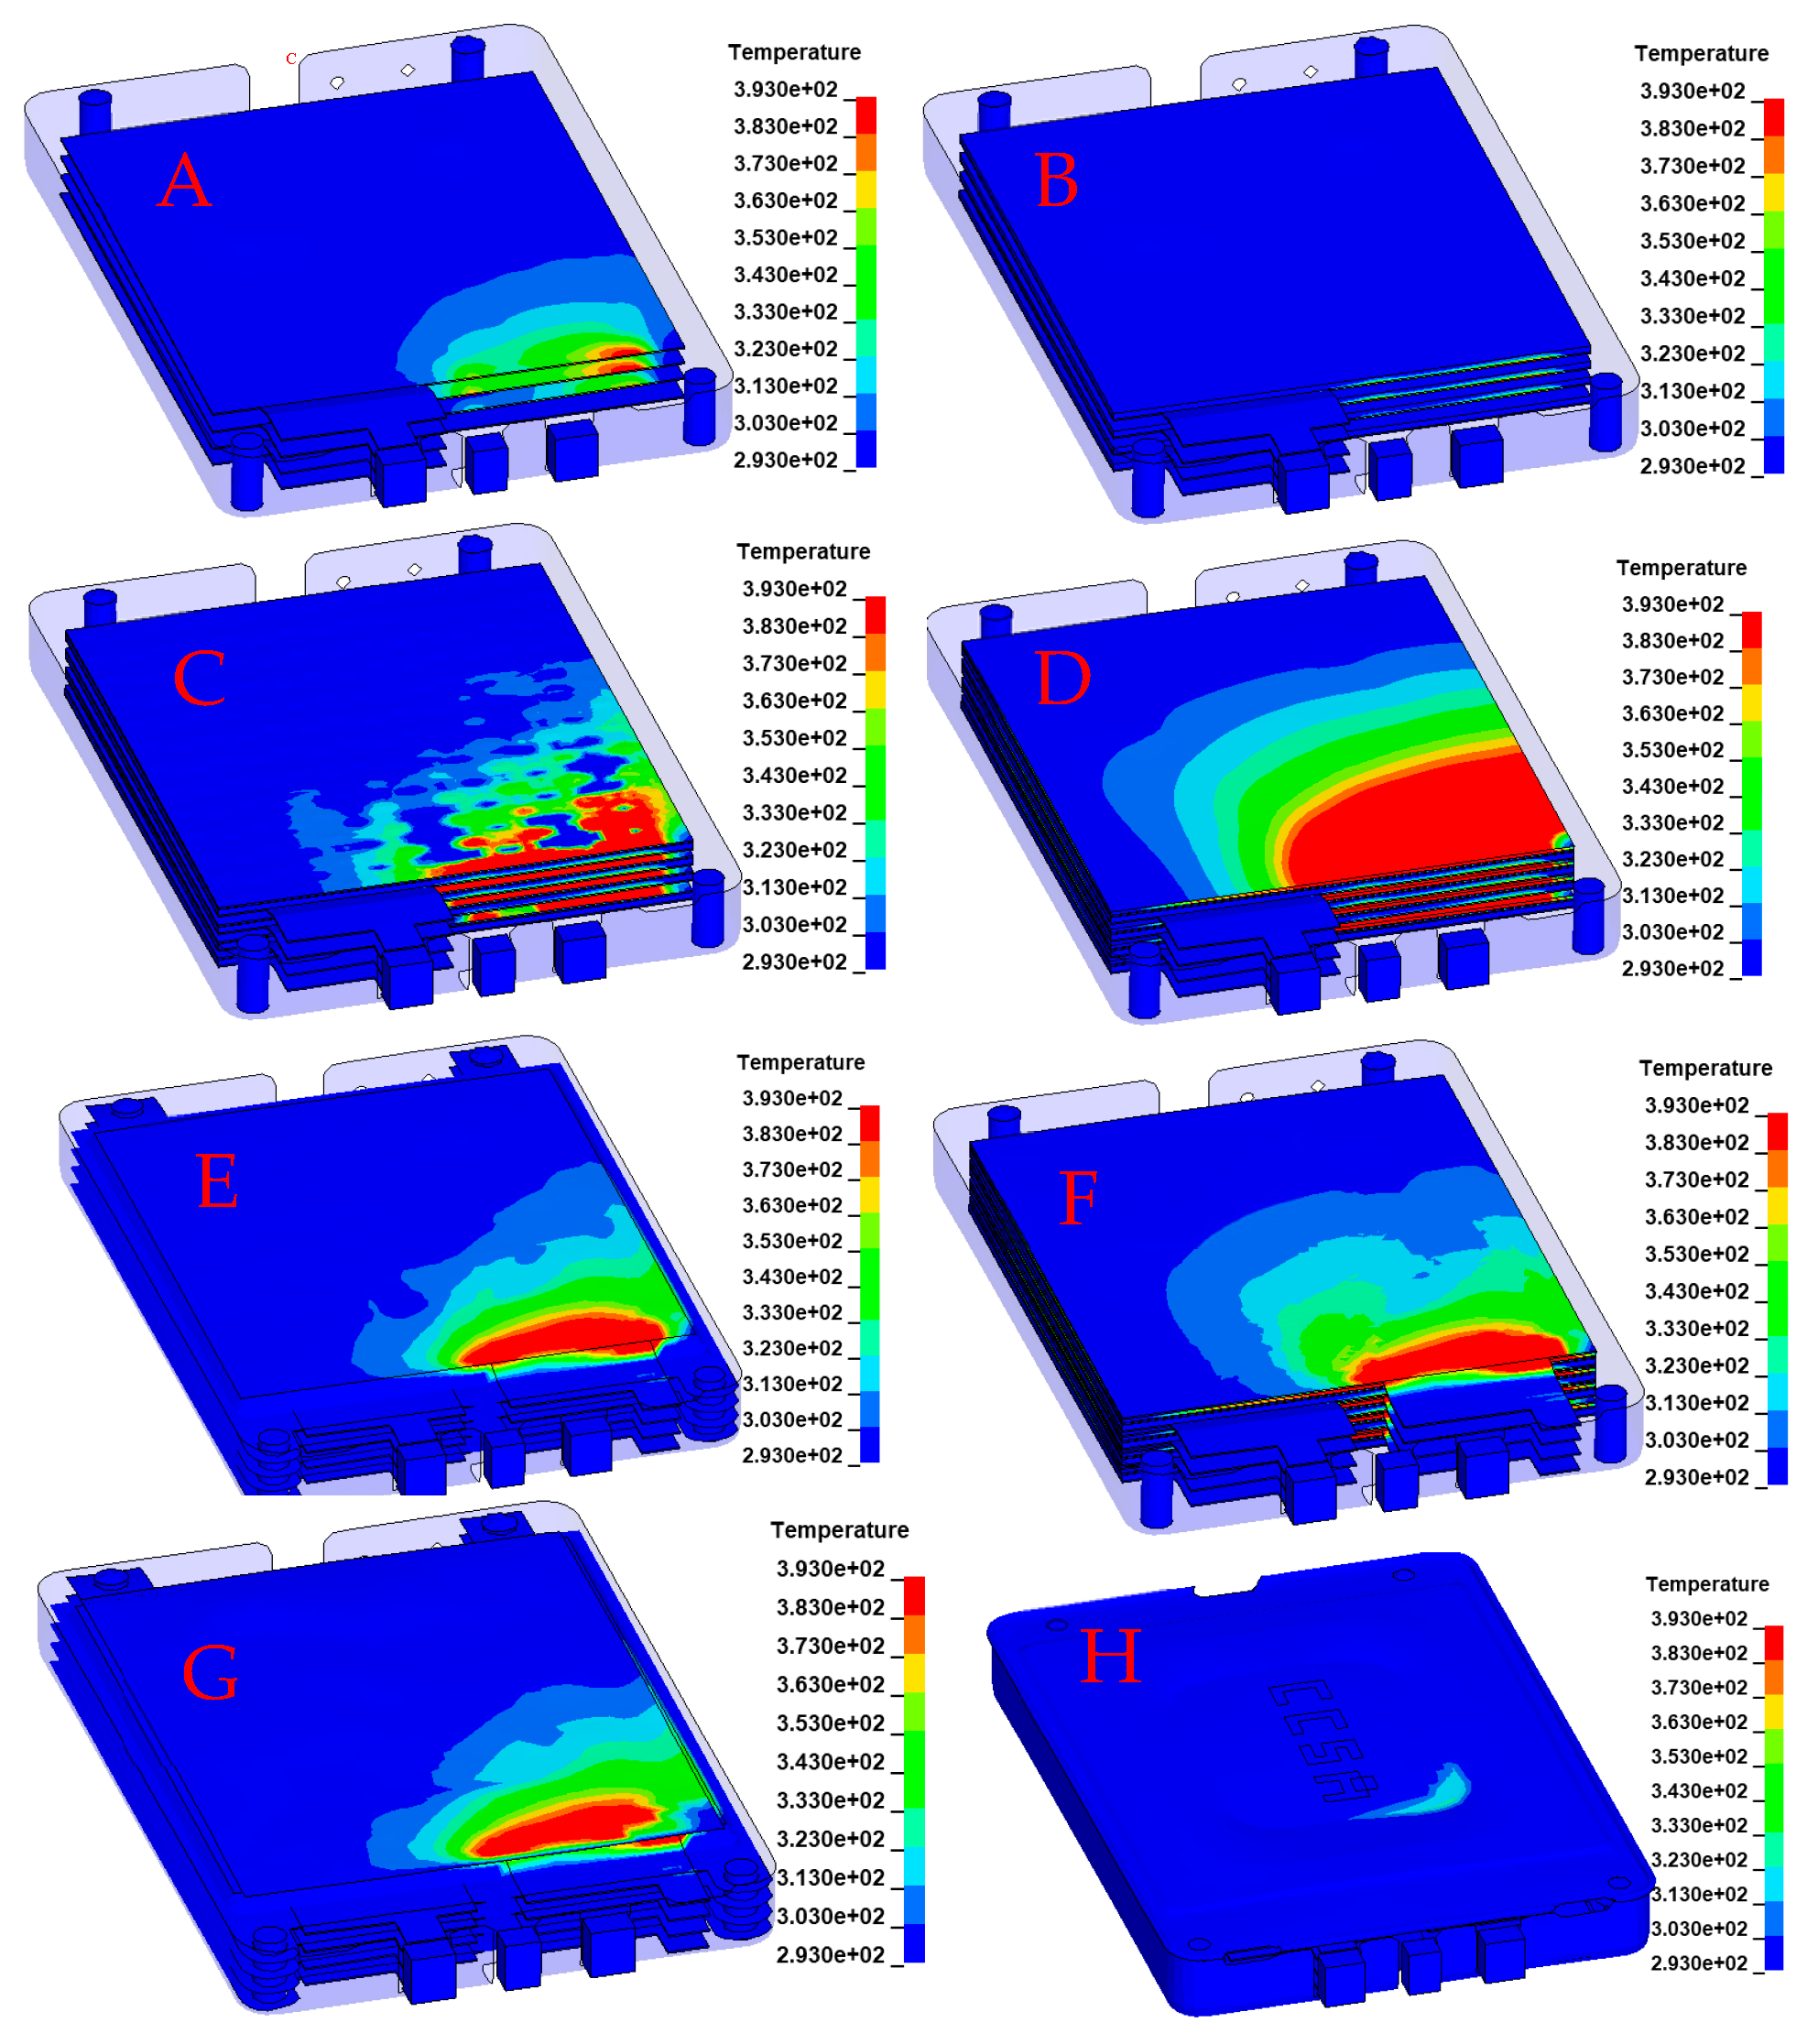
Thermal–Mechanical–Electrical Verification
The thermal–mechanical–electrical coupling is verified in a side impact simulation. In the Nissan Leaf, battery modules are installed horizontally [69]. Besides spherical indentation, side impacts are common collision directions. Battery modules may deform similarly in a frontal or side impact. The pole impact simulation is shown in Figure 16, with the pole having a radius of 50 mm and an impact speed of 1 m/s. The temperature increase in the impact area is primarily attributed to the mechanical work caused by plastic deformation.
(5)
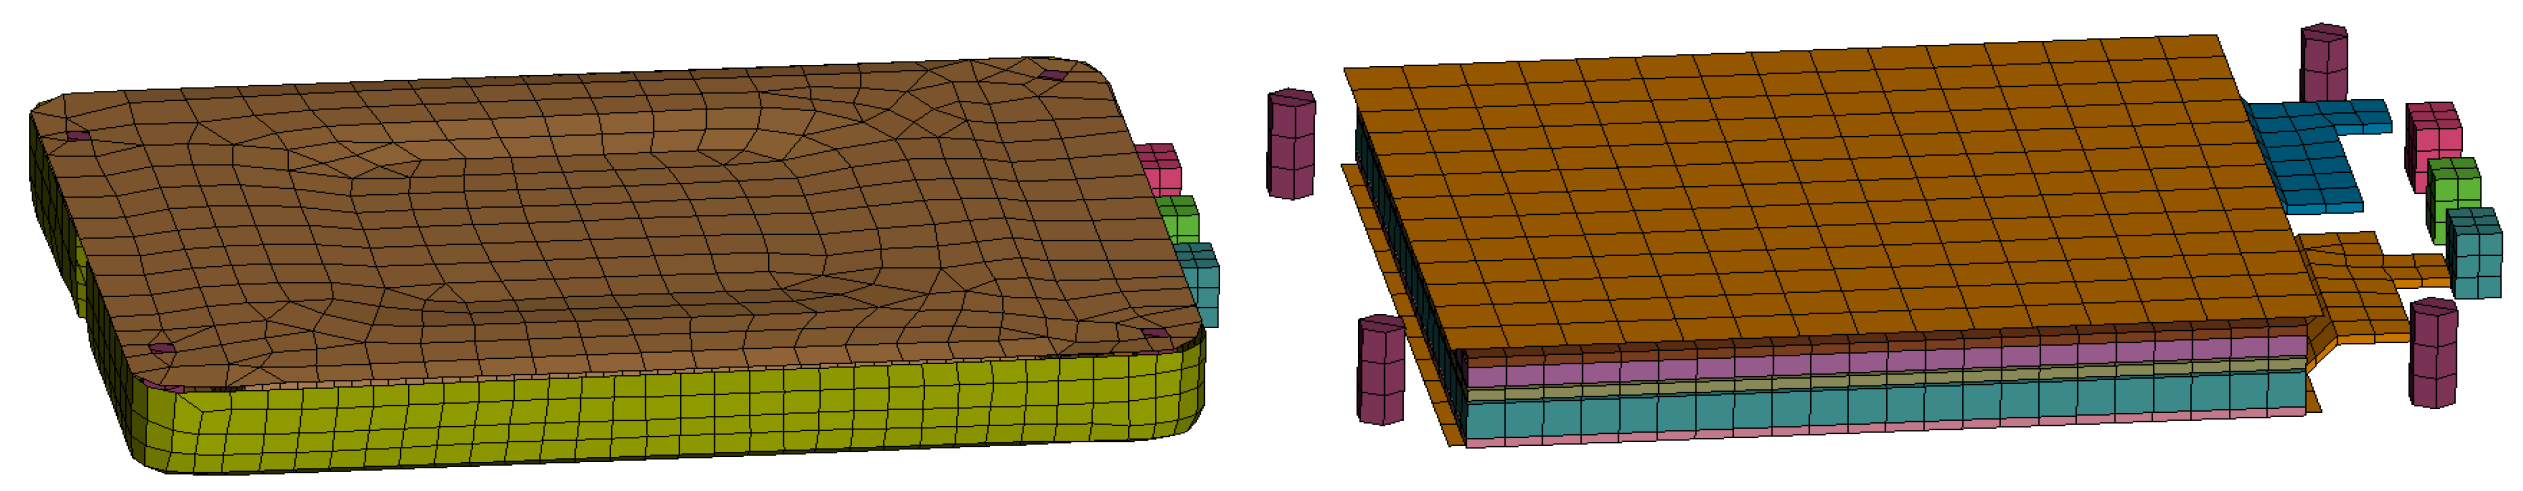
Coarse Battery Module Model
A coarse battery module model containing only one cell was also developed for use in full electric vehicle (EV) analyses, as shown in Figure 17. The goal is to reduce the CPU time to 24 h for a complete EV crash simulation with active battery cells in a multi-physics analysis. This coarse model uses a single 7.4 V cell to represent the battery module circuit shown in Figure 12.
A side pole impact was also conducted for the coarse module mode to verify the functionality of thermal–electrical–mechanical coupling. The temperature and Joule heating power demonstrated that the battery module can simulate heat generation during impact, as seen in Figure 18, besides the heat generation through the work hardening process. It was observed that cell deformation influences the internal resistance, leading to a localized current increase, thereby locally raising Joule heating power and temperature.
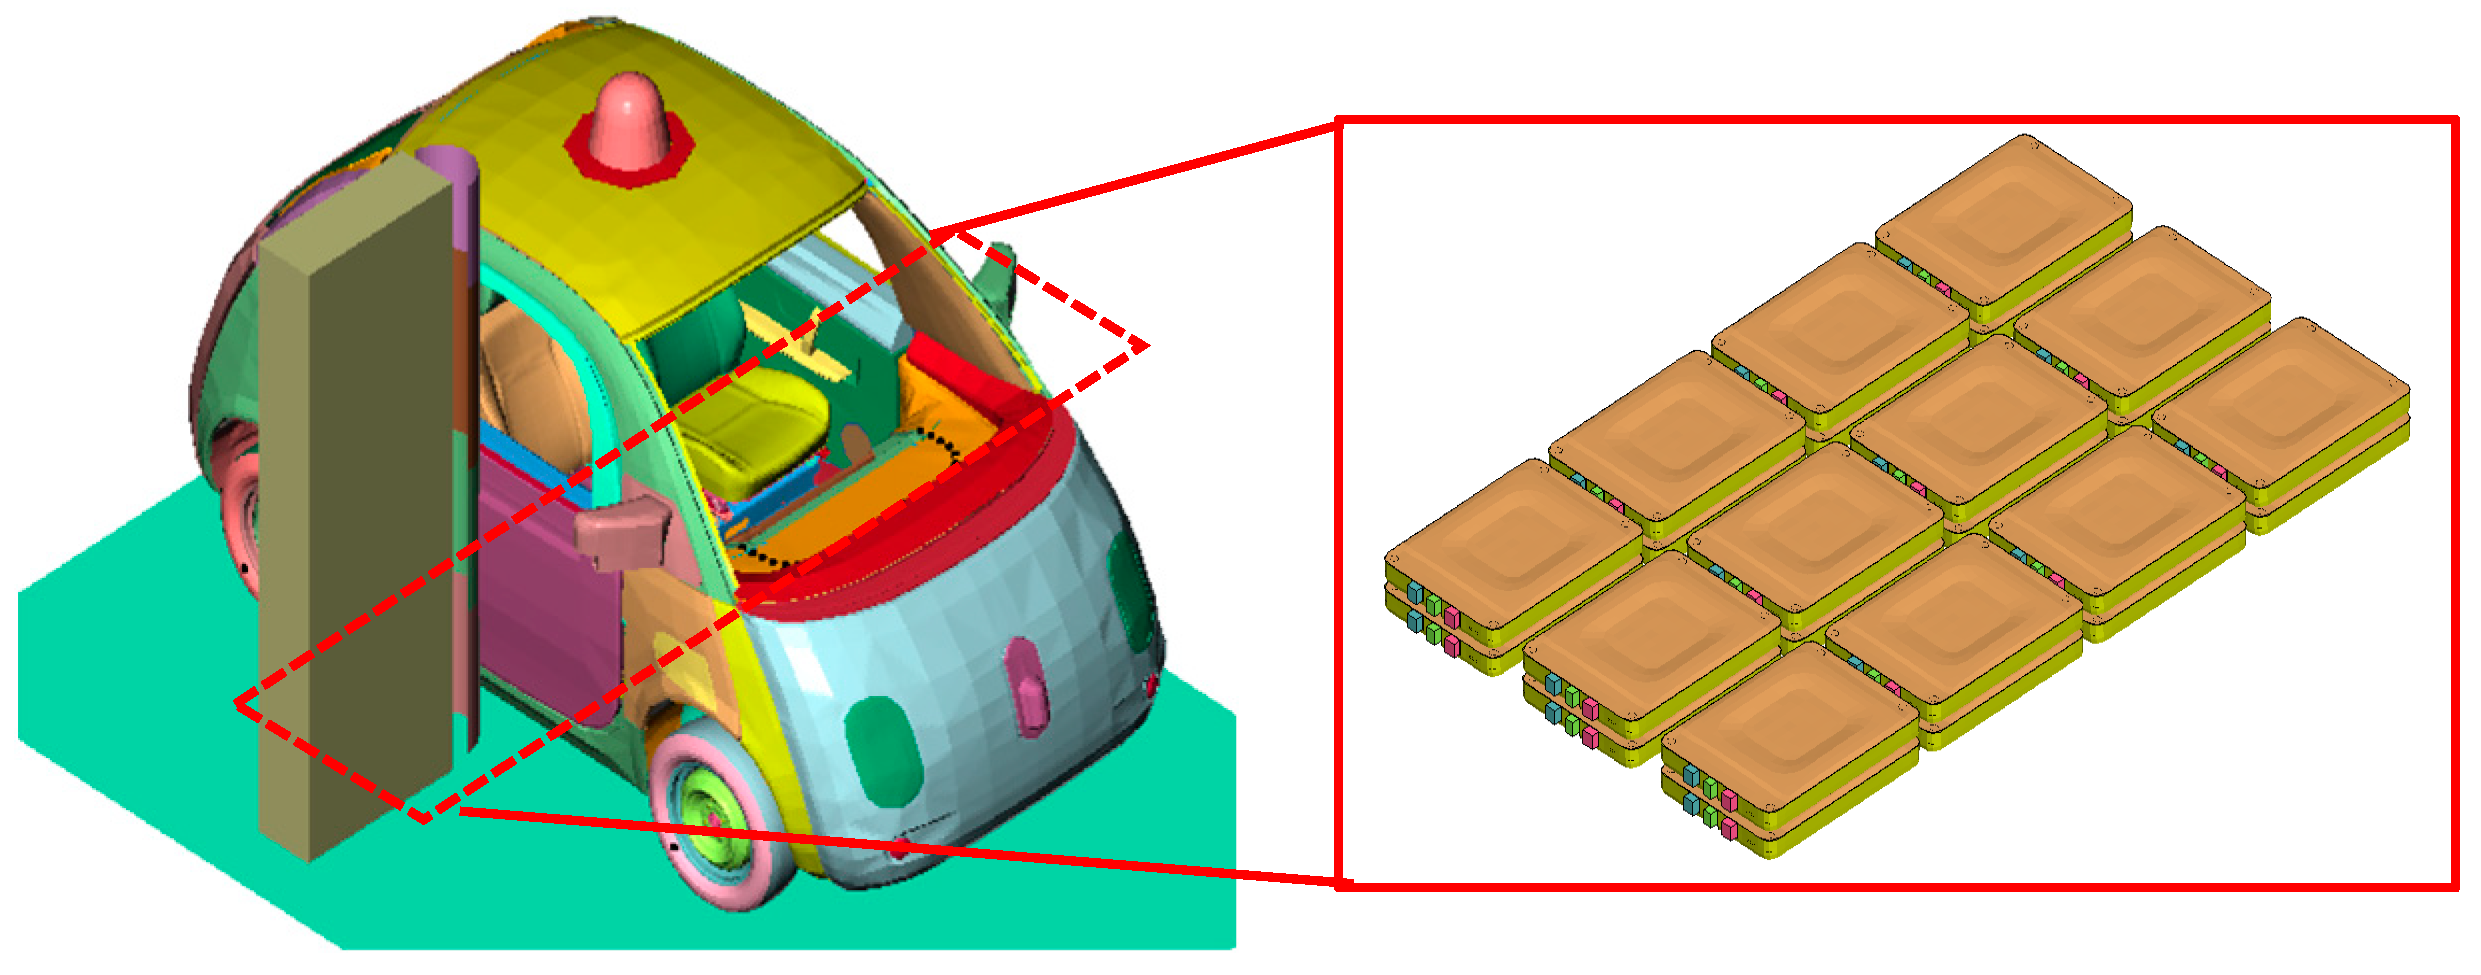
  • C. Battery Electric Vehicle with 24 Active Cells
A generic battery electric vehicle with 24 active battery modules has been developed. The body in white of this generic EV is based on the Toyota Yaris, while the exterior and interior design reflect the first-generation Google Waymo BEV. The battery cells and modules are configured similarly to those in the Nissan Leaf. This generic battery electric vehicle model served as a proof-of-concept study for future EV crashworthiness models. The battery pack consists of 24 active battery cells connected in serial. The battery modules are packed and integrated into the vehicle floor structure, as seen in Figure 19.
(1)
BEV in Normal Usage and External Short Circuit
The case of BEV with a normal discharging battery pack is simulated. The initial temperature of the vehicle is 293 K. An external resistor of 1   is connected to the battery pack to represent battery discharge under normal operating conditions. The electric potential contour is shown in Figure 20 (left), and the current density contour is shown in Figure 20 (right). Recall that the BEV model consists of 24 battery modules in serial connection, with each module carrying a 7.4V voltage. The simulation contour of electric potential confirms the serial connection of cells. The cell on the upper left is connected to the ground, and the cell on the lower right has the highest voltage of 177.6 V, as seen in Figure 20 (left). All battery cells exhibit similar current density contours due to their serial connection, with higher current densities observed near the current collector tab, as shown in Figure 20 (right). Both the electric potential and current density contour suggest that the electrical simulation works correctly. The temperature contour during normal discharge is shown in Figure 21.
For comparison, the case of external short circuit is also simulated for the BEV. Due to the short circuit, the voltage contour of the battery is almost zero, as seen in Figure 22 (top left). The current is over 30 times higher than the normal levels, illustrated in Figure 22 (top right). These voltage and current results confirm the proper functionality of the electrical stimulation. The simulation results show a rapid temperature increase on the cathode, cathode current collector, and separator, as seen in Figure 22 (bottom). The cathode is the primary heat source due to the high resistivity of the cathode material. The heat generated at the cathode transfers to the adjacent cathode current collector and separator. The simulation indicates that the separator reaches its melting point of 150 at t = 0.2 s, as shown in Figure 23. This suggests that an external short circuit of the battery pack could trigger an instant thermal runaway.
(2)
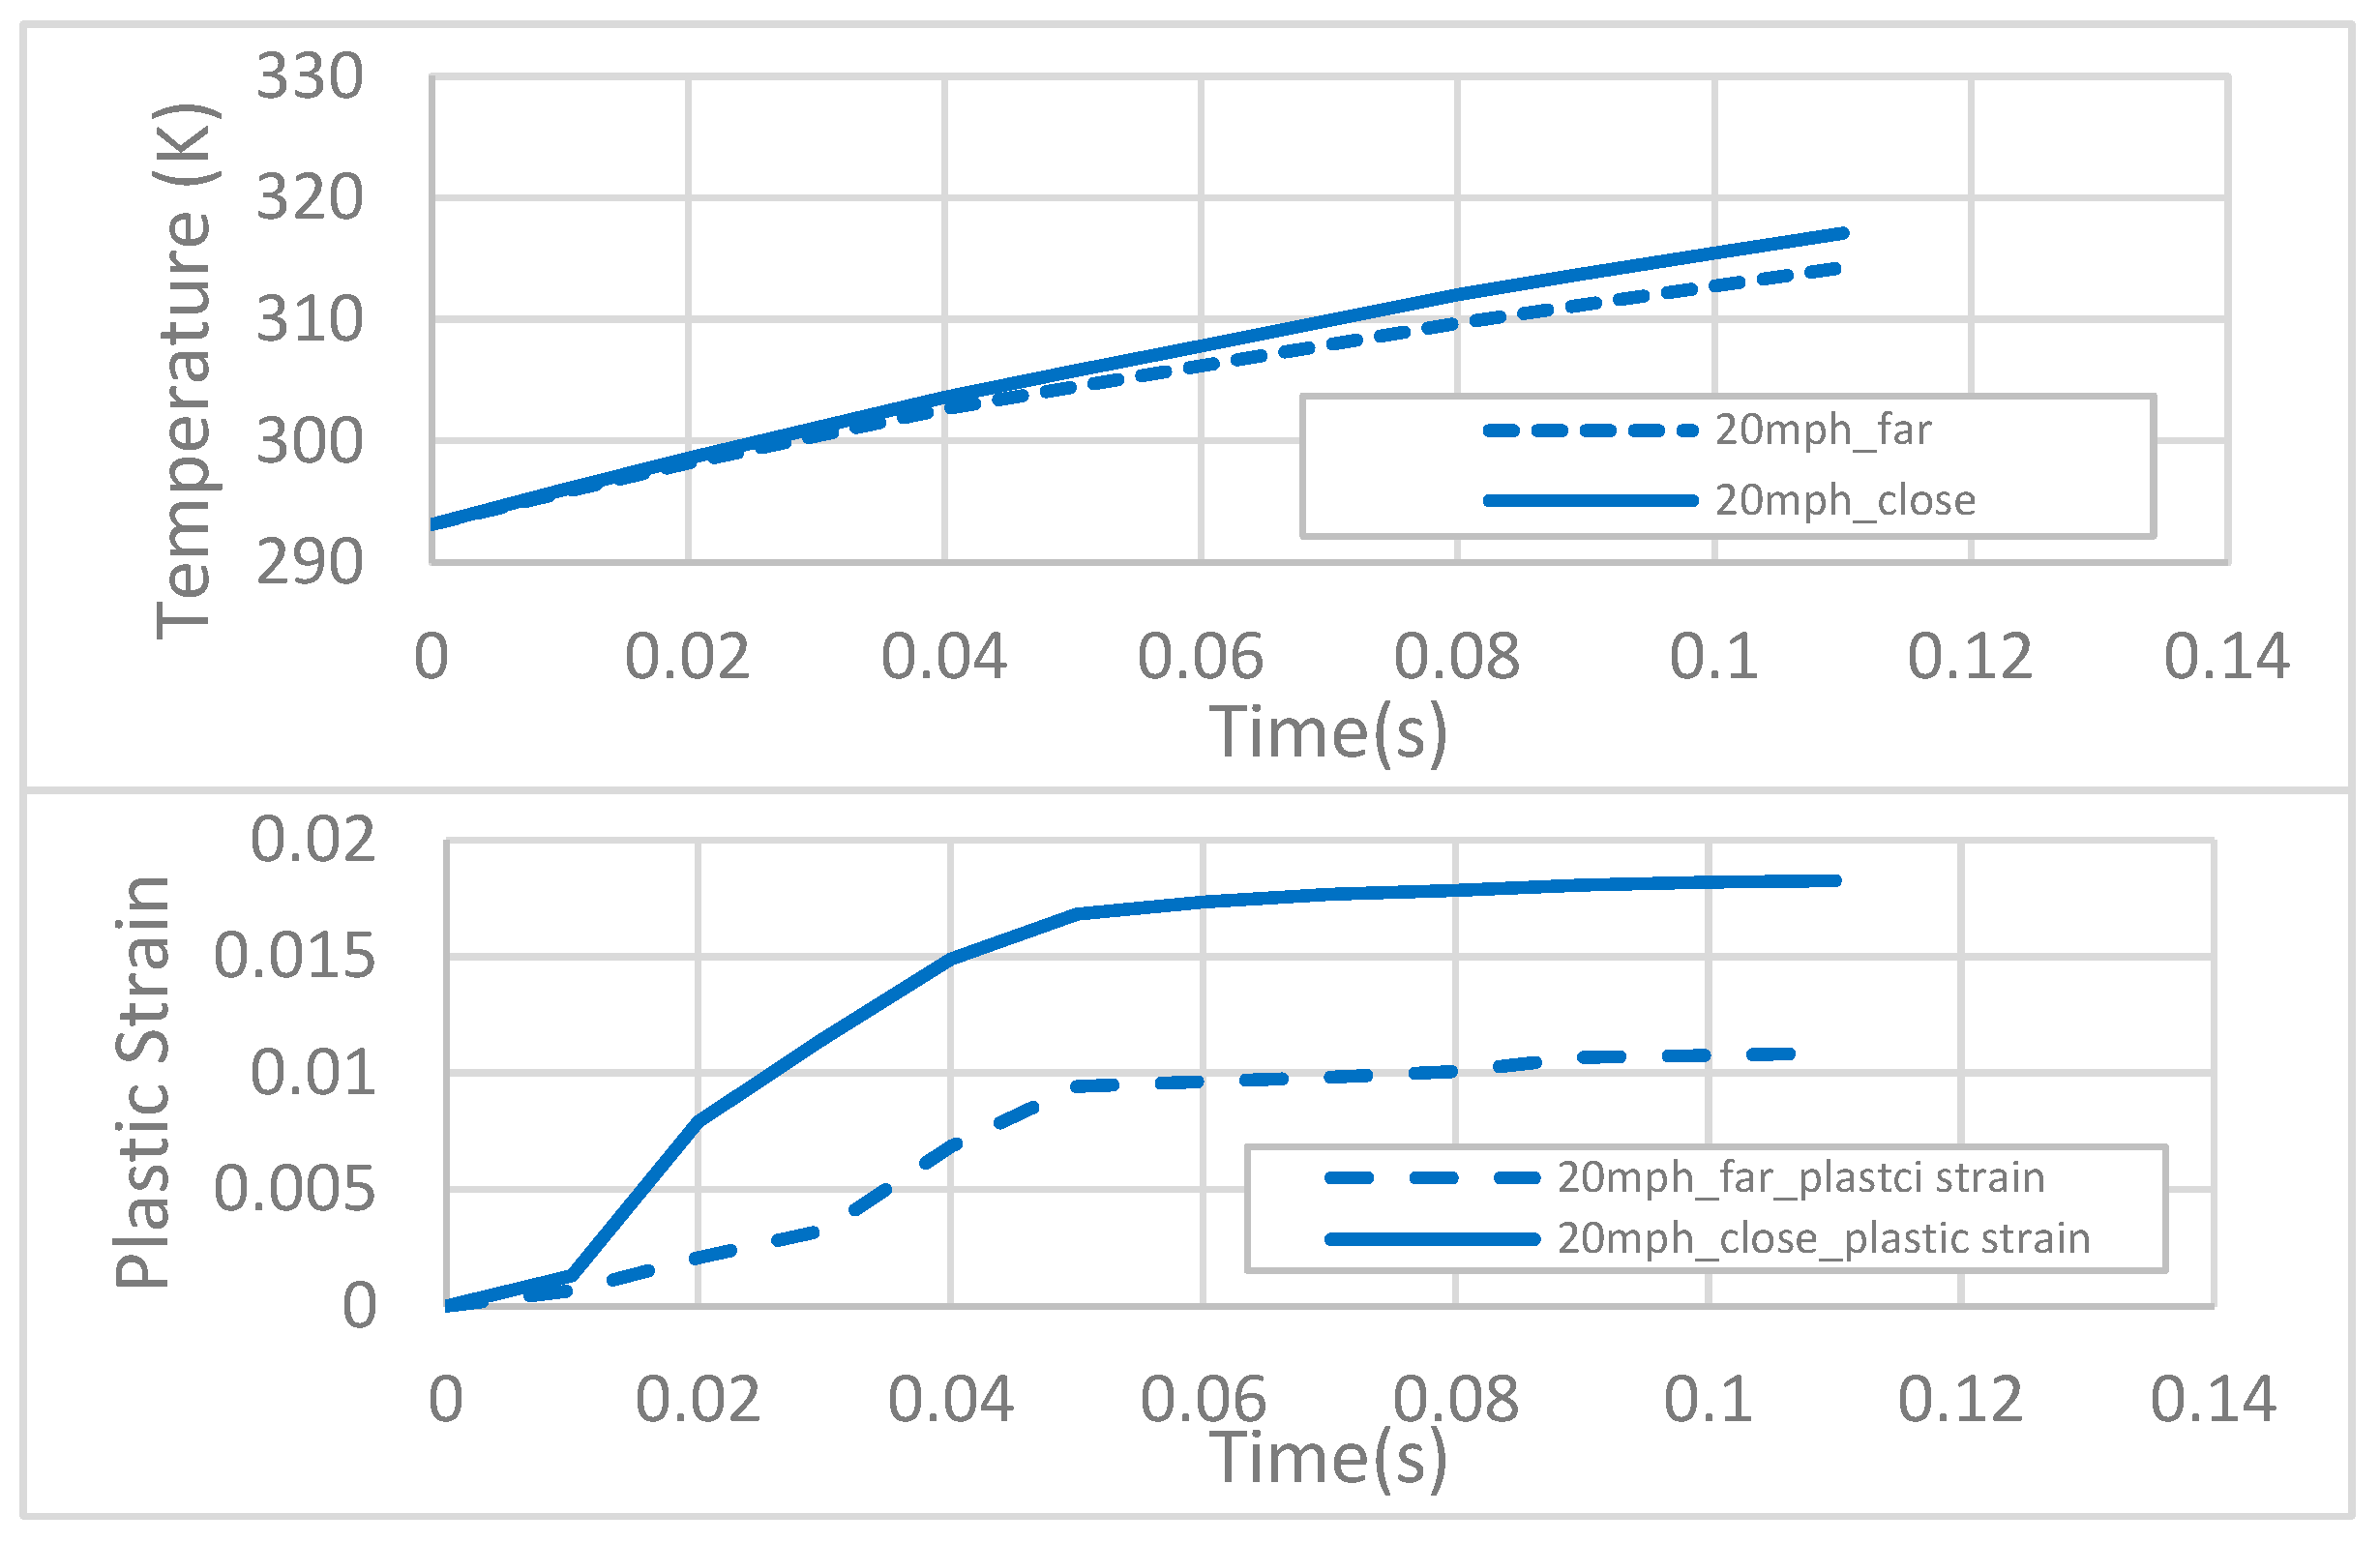
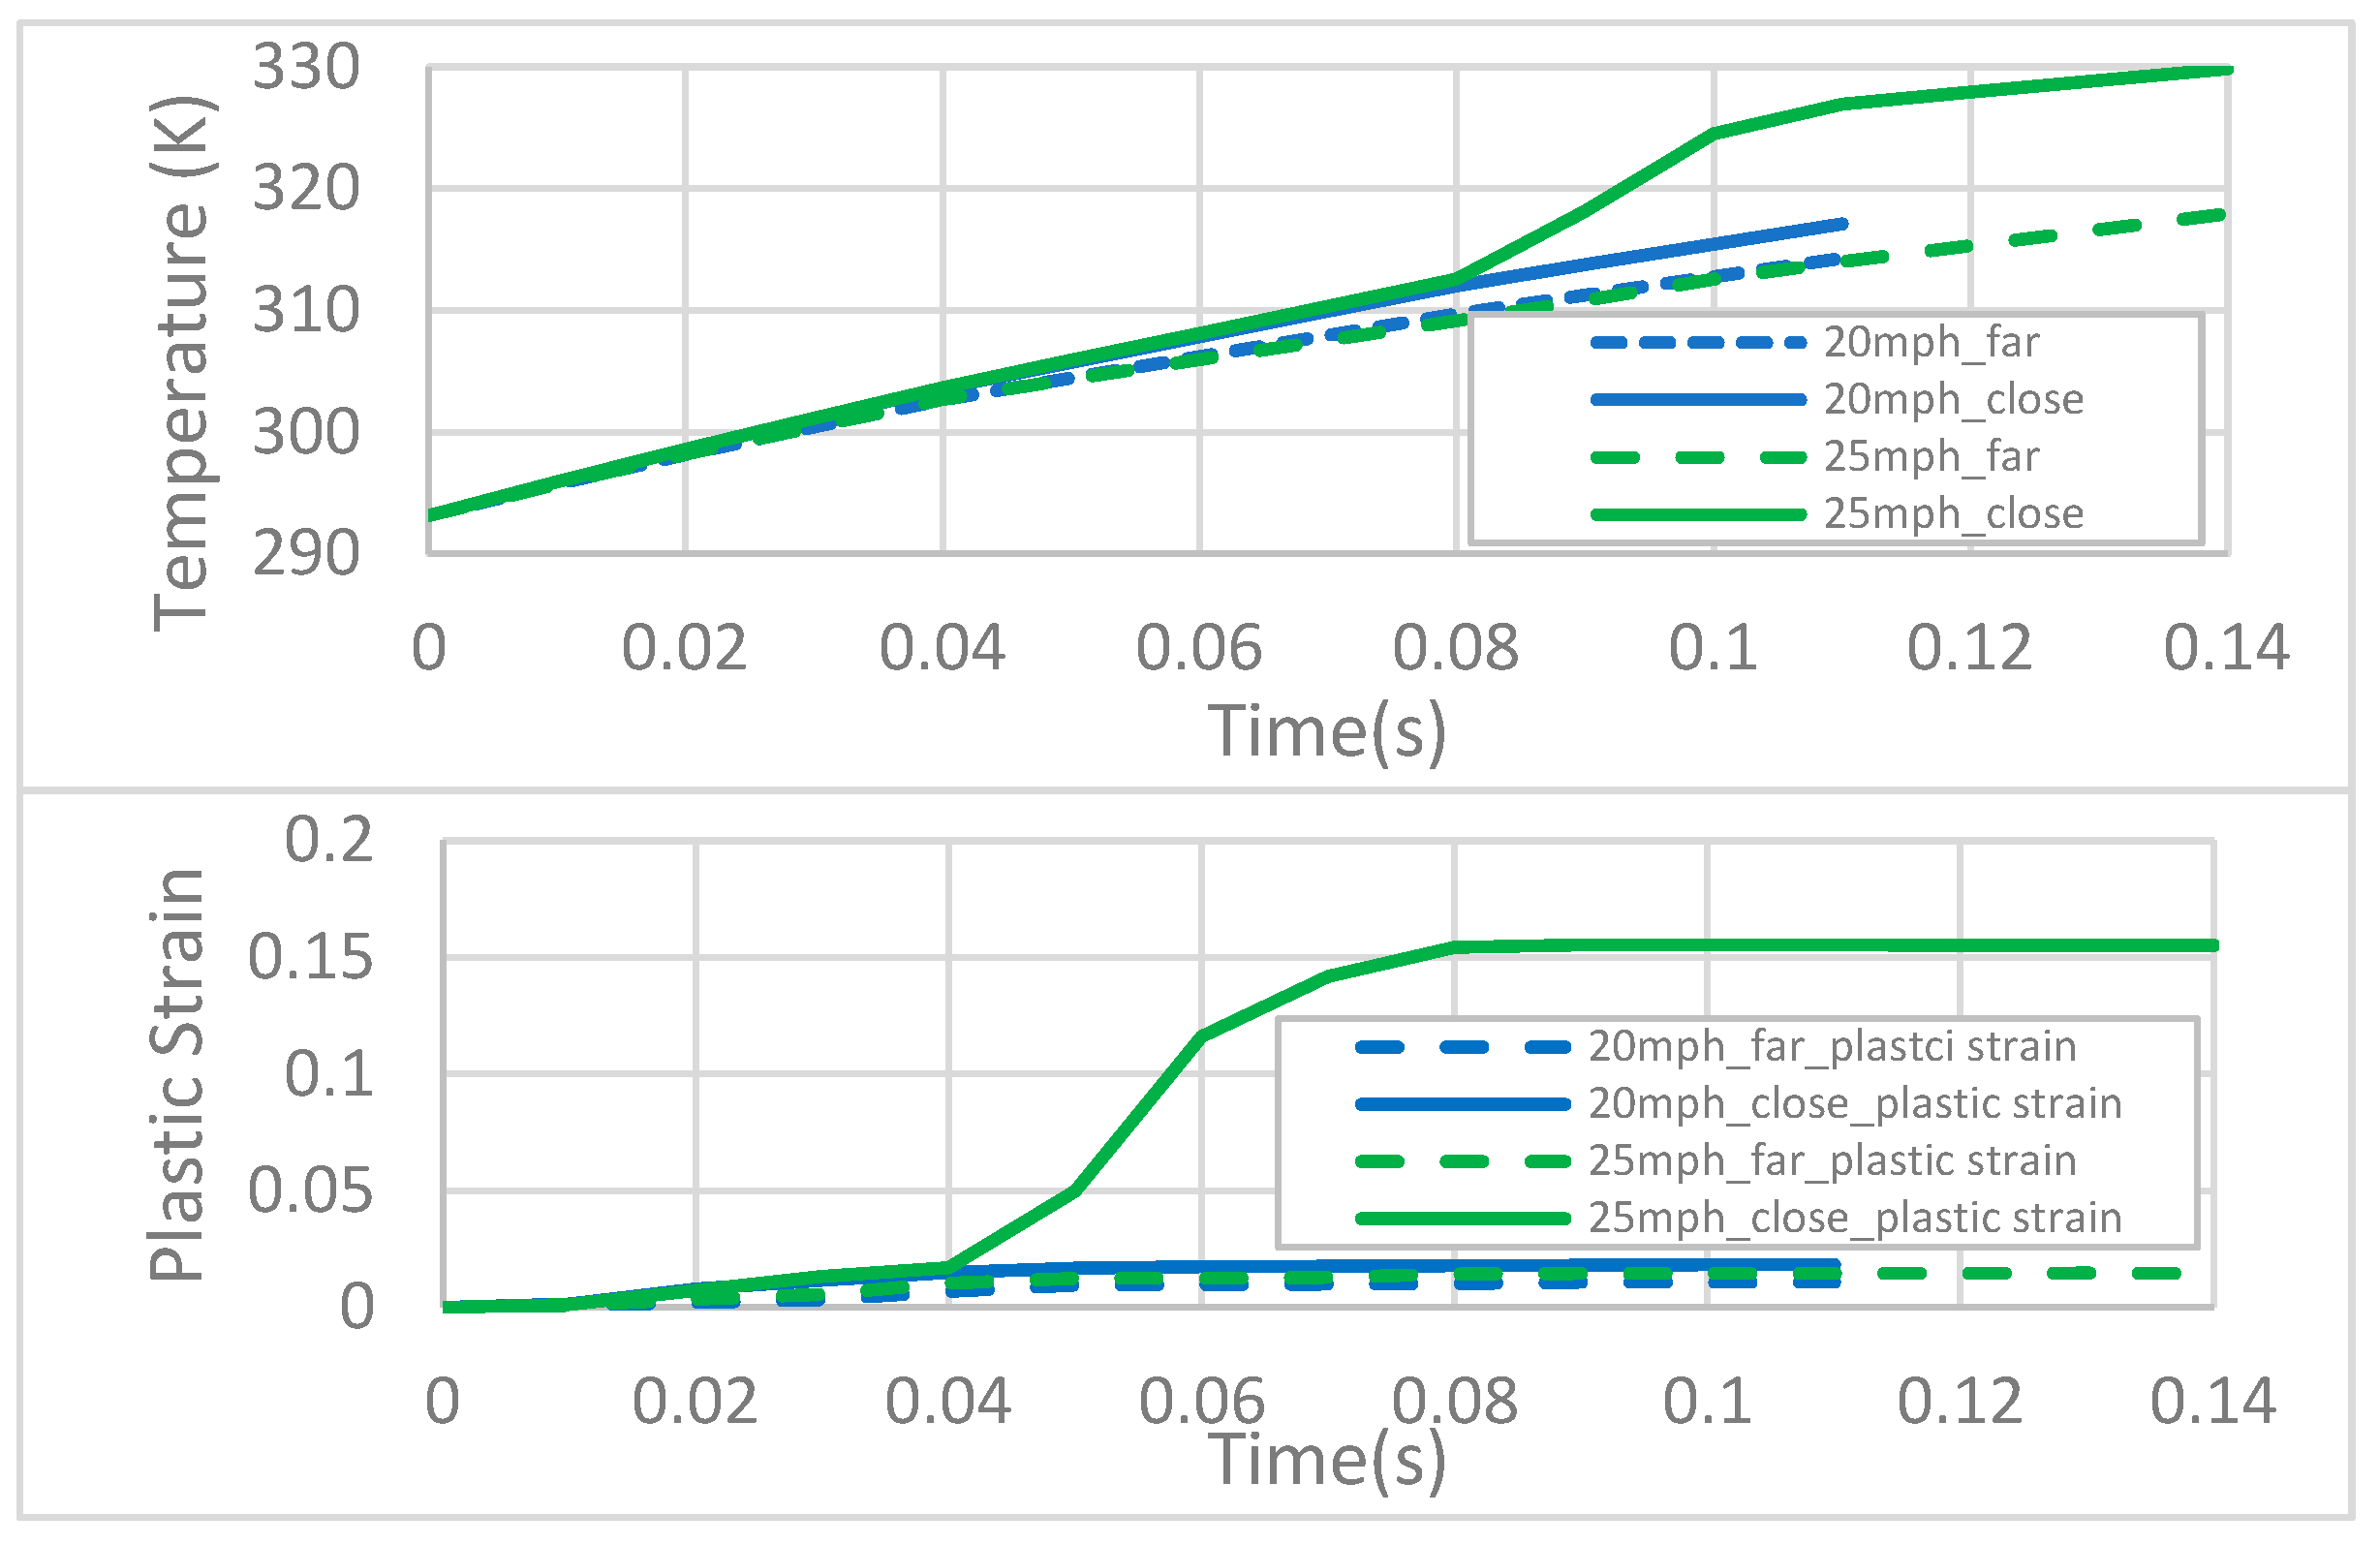
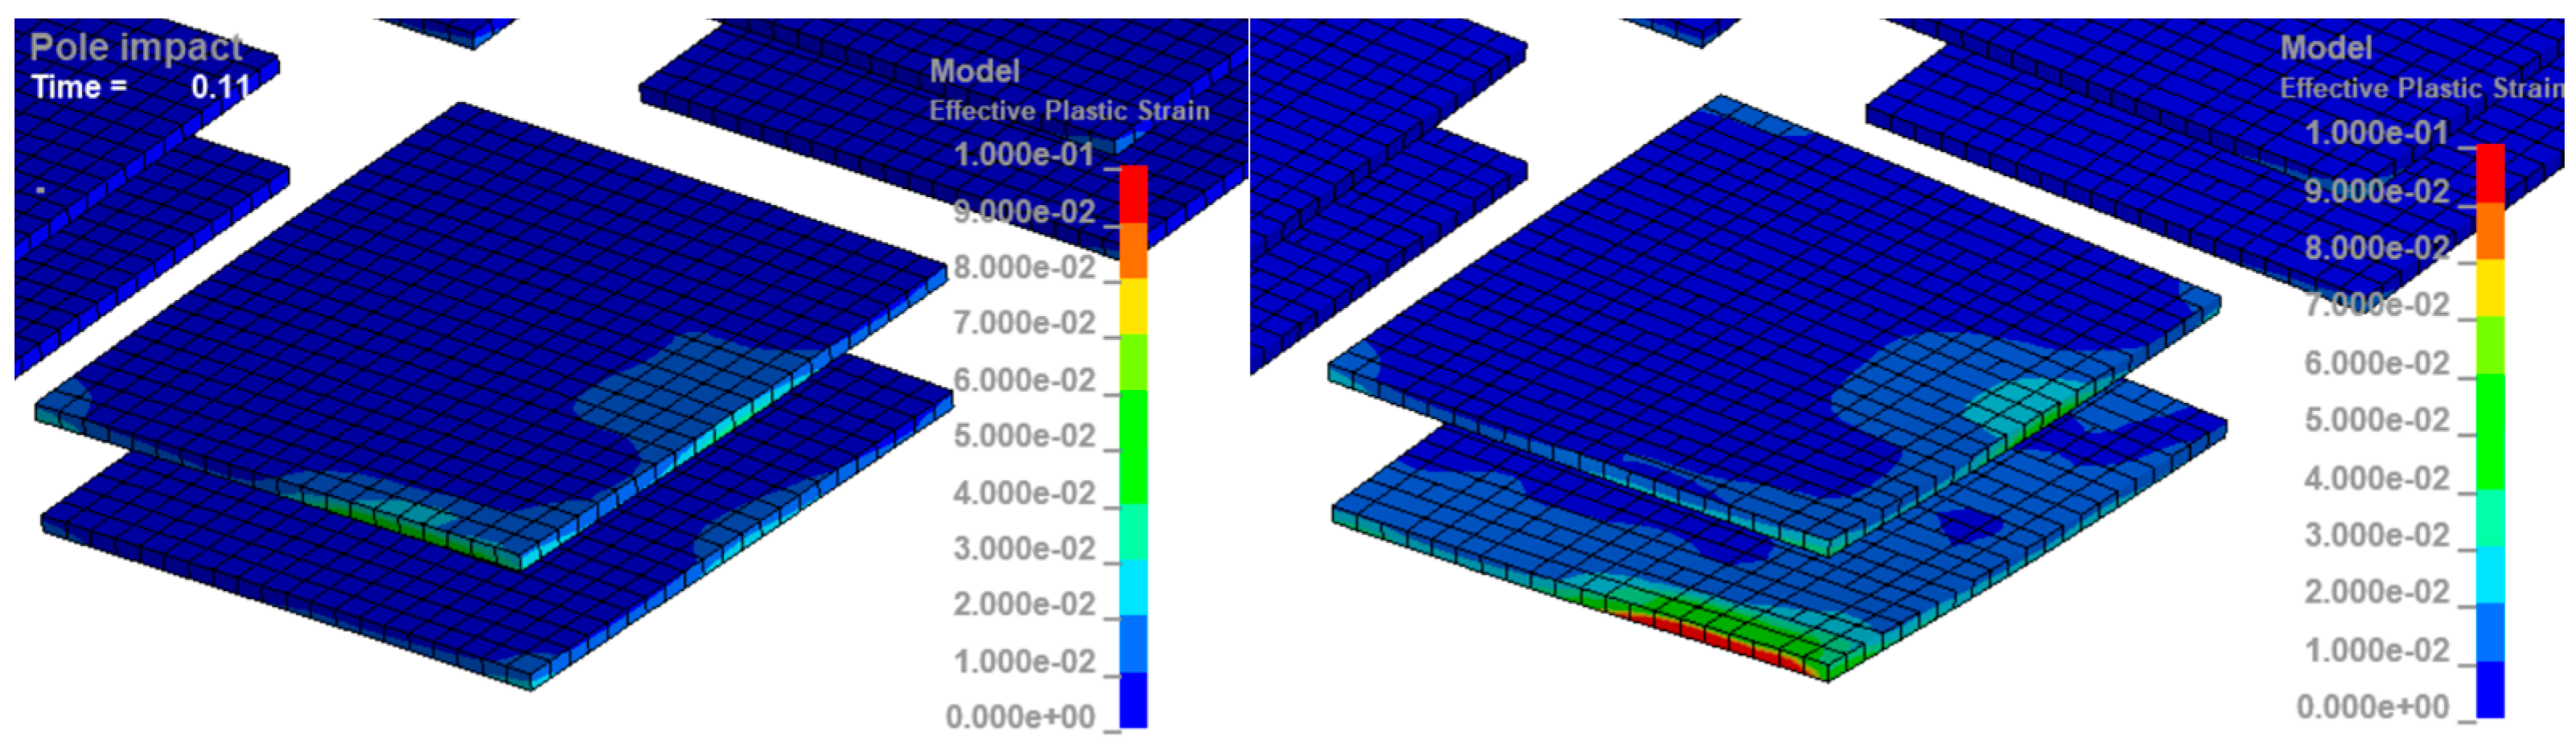
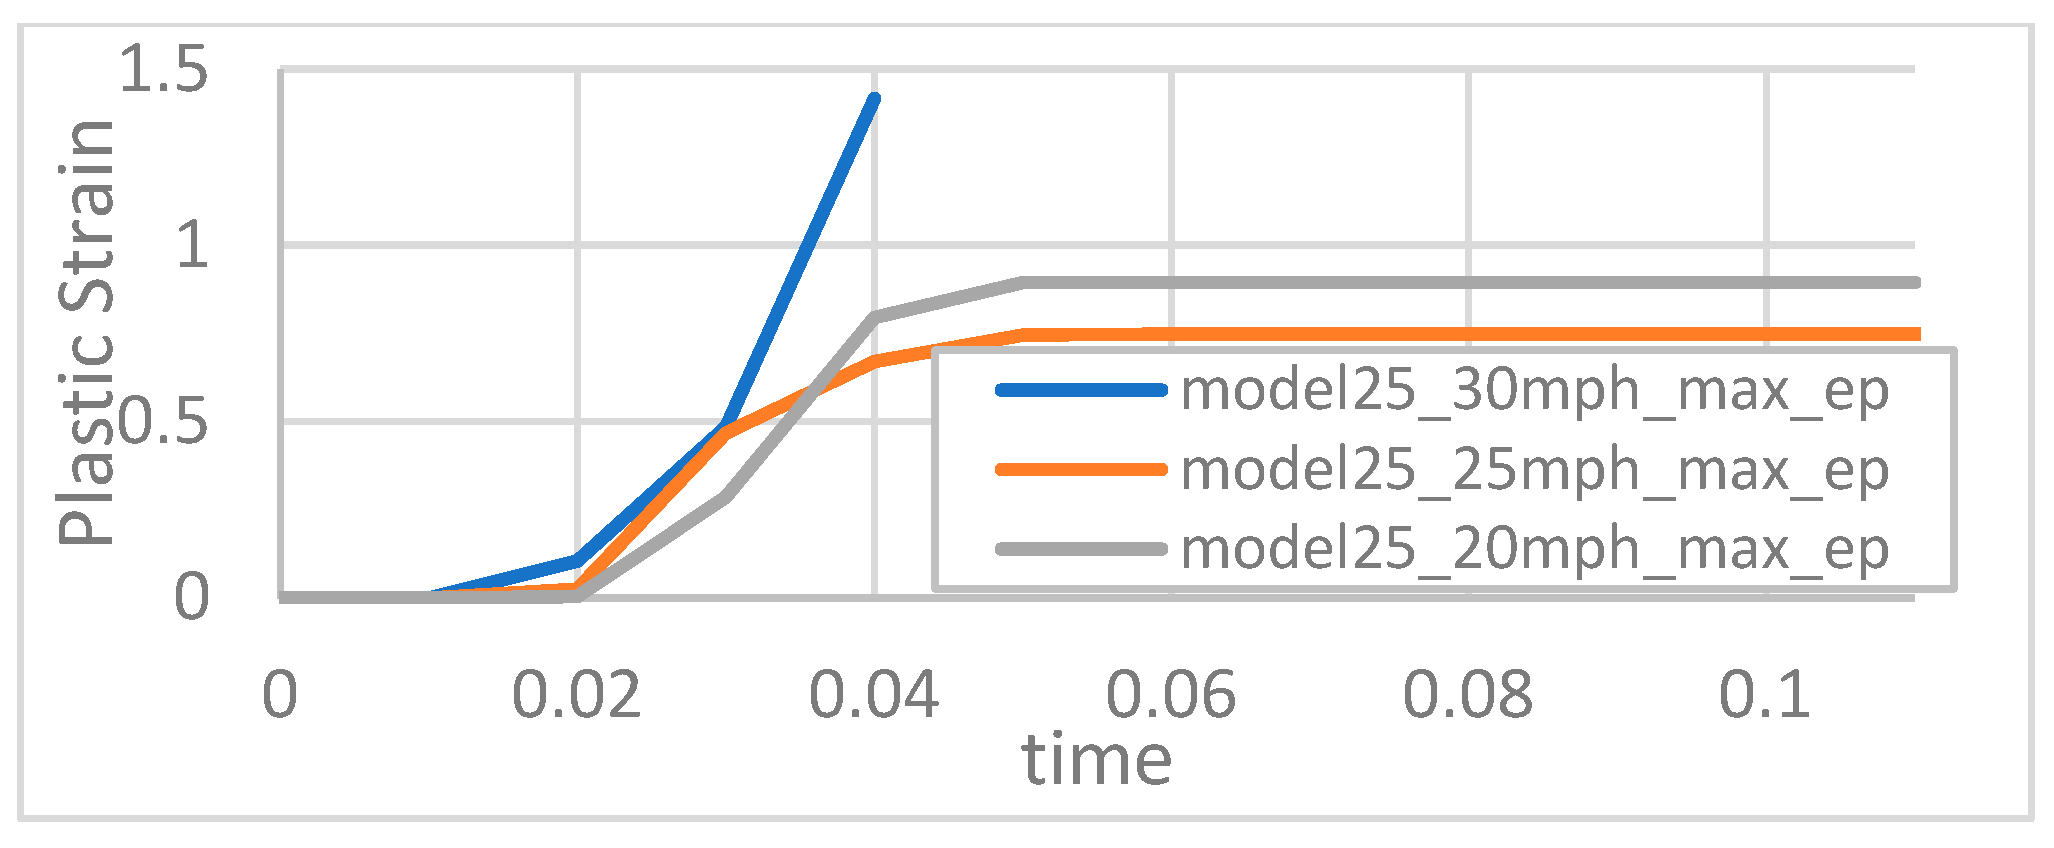
BEV in FMVSS Pole Impact (20 mph impact speed):
The side pole impact could potentially lead to intrusion on the battery compartment and cause a battery fire. The full vehicle pole impact simulation model, as shown in Figure 24, was developed in accordance with Federal Motive Vehicle Safety Standard (FMVSS) No. 201 and 214 [70]. The rigid pole has a radius of 127.5 mm and an initial velocity of 20 mph upon impact. The pole impact simulation required 24 h and 40 min to simulate the event within 0.2 s. The battery system undergoes normal discharge, representing a typical driving condition. The initial temperature for the vehicle is 293 K. The deformation pattern and temperature contour for the cathode layer are shown in Figure 25.
It is seen that the heat generated by Joule heating is concentrated near the current collector tab on the cathode layer of the cells. The battery has a 20 °C temperature rise due to normal discharge, as illustrated by the temperature rise of the cells far away from the impact area, shown by the blue dashed lines in Figure 26 (top). Under normal driving, this generated heat is carried away by the active battery cooling system of the electric vehicle. However, during a crash, the battery management system is likely to shut down the active cooling. For simplicity, this conceptual model does not model the active cooling system for the BEV.
It is observed that the cell near the impact area (solid line) experiences a 4 °C temperature increase compared to the cell farther away from the impact area (dashed line), as shown in Figure 26 (top). The cell far from the impact area is unaffected by the intrusion; therefore, it can be used as a benchmark to study the influence of intrusion. The plastic deformation for the far-away cell is illustrated by the dashed lines in Figure 26 (bottom). The plastic deformation and extra temperature rise in the cell near the impact area occur almost simultaneously, between 0.01 to 0.11 s, as shown in Figure 26 (bottom). This indicates that the temperature rise is mainly attributed to work performed by plastic deformation. However, the additional 4 °C temperature increase is relatively minor. Therefore, the simulation does not predict an immediate risk of thermal runaway. The battery cells experience a maximum of 2% plastic deformation, as seen in Figure 26 (bottom), which is unlikely to affect the uniformity and change the internal resistance of the battery cell. Thus, the simulation predicts no risk of thermal runaway if the post-crash battery is used in the normal charging and discharging cycle. The plastic porch bag shows 90% plastic deformation Assuming the plastic cell wrapper used to create the porch bag fails at 100% strain, the wrapper will remain intact after impact. Consequently, the post-crash battery will not leak.
(3)
BEV in Pole Impact with 25 mph impact speed:
Higher pole impact speeds of 25 mph were examined to assess the BEV’s thermal runaway risk. A moderate deformation is seen for the battery module closer to the impact area. The maximum temperature contours for the 25 mph case are presented in Figure 27. It is seen that the cells near the impact area (solid green line) exhibit a 12 °C temperature rise compared to the cells far away from impact (dashed green line) in Figure 28 (top). This additional temperature rise is triggered by the intrusion into the battery. Notice that the cell plastic deformation occurs from 0.04 to 0.08 s, as shown in Figure 28 (bottom). However, the significant temperature rise on the cathode layer is from 0.08 to 0.1 s, as shown in Figure 28 (top). This temperature rise is primarily caused by additional Joule heating. Notice that the plastic deformation alters the cell’s geometry, which changes the local internal resistance at the deformed area, leading to increased Joule heating. Plastic work is the secondary effect contributing to the rise in cell temperature. Notice that the cell far away from the impact area at 25 mph (green dashed line) has a maximum temperature of 313 K, which is almost identical to the cell far away from the impact area at 25 mph (blue dashed line), as shown in Figure 28 (top). This verified that the cell far away from the impact area is largely uninfluenced by the intrusion and, therefore, can be treated as a benchmark. The temperature rise of 12 °C is not enough to cause thermal runaway. Therefore, the simulation does not predict an immediate risk of thermal runaway for pole impact at 25 mph speed. Figure 29 shows the plastic strain contour of the cathode layer for 20 mph (left) and 25 mph (right) cases. The cathode layers at 20 mph shows only 1.8% plastic deformation, as shown by the solid blue line in Figure 28 (bottom). In contrast, the cathode layer shows 15% plastic deformation at 25 mph, as illustrated by the solid green line in Figure 28 (bottom). If this damaged cell is still used in normal charging and discharging cycles, the permanently deformed cathode layer will cause an uneven change in local resistivity, which may lead to accumulated heat and a risk of thermal runaway. This post-crash battery module is no longer safe to use. The plastic cell wrapper is seen to have a 70% plastic deformation. Suppose we assume that the plastic cell wrapper fails at 100% of strain. The cell wrapper will remain intact. The cell will not leak.
(4)
BEV Pole Impact with 30 mph impact speed:
At an impact speed of 30 mph (right), the battery module exhibits significant deformation compared to the 25 mph (middle) and 20 mph (left) impacts, as shown in Figure 30. The cell current collector tab is bent, and the plastic porch has multiple failure points. Observe that the plastic strain at 20 mph (grey line) is approximately 90%, at 25 mph (brown line) is about 70%, and at 30 mph (blue line) is roughly 150%, as illustrated in Figure 31. If we assume the porch bag failed at 100% of plastic strain, the damaged porch bag at 30 mph leads to the disintegration of the battery structure, exposing flammable materials to the open air and increasing the risk of short circuits due to broken electrical insulation. The damaged porch bag is identified as the primary failure mode that may lead to thermal runaway under this speed. The severely damaged cell will also distort the finite element mesh, causing a stability problem in simulation. Immediate thermal runaway is predicted for BEV pole impact with a 30mph impact speed. Table 2 provides a summary of the thermal runaway predicted from the simulation for all three impact speeds.

3. Conclusions

In this work, thermal–electrical–mechanical coupling FE models are used to model the battery cell, battery module, and battery electric vehicle. The representative battery modeling approach allows the use of physical material properties to the model lithium-ion battery, making the approach more suitable for thermal runaway prediction. This study demonstrates, for the first time, that a representative multi-physics battery model can effectively predict thermal runaway in battery electric vehicle crash simulations. It is important to note that the multi-physics simulation must capture various mechanical, electrical, and thermal phenomena, along with their coupling effects, in order to accurately predict the thermal runaway and battery fire. The simulation method is efficient, with an expected turnaround time of 24 h for a generic EV model with 24 cells in a multi-physics crash simulation.
However, a limitation of this work is that the material properties of the cell components are derived from the literature rather than from material tests conducted on the actual cell components. Future studies should focus on using reverse engineering to accurately characterize the material property of cell components in simulation. This should include testing the electrical, mechanical, and thermal properties. Additionally, cell-level and module-level tests need to be conducted to validate the simulation models. Laser scanning should be employed in the reverse engineering process for modeling battery cells, battery modules, battery packs, and electric vehicles. This work utilized the resistant heating solver and first-order Randles circuit to model the electrochemical process. In future work, a more advanced theoretical framework is needed to capture the electrochemical kinetics of the lithium-ion battery.

Author Contributions

Conceptualization, L.W. and C.-D.K.; methodology, L.W., C.L., C.Y. and C.-D.K.; software, L.W. and C.L.; validation, L.W., C.L. and C.Y.; formal analysis, L.W. and C.L.; investigation, L.W. and C.L.; resources, C.-D.K.; data curation, L.W. and C.L.; writing—original draft preparation, L.W.; writing—review and editing, L.W.; visualization, L.W. and C.L.; supervision, L.W., C.-D.K. and C.Y.; project administration, L.W. and C.-D.K.; funding acquisition, L.W., C.Y. and C.-D.K.; All authors have read and agreed to the published version of the manuscript.

Funding

This research received no external funding.

Data Availability Statement

Data are contained within the article.

Acknowledgments

Special thanks to Kevin Arellano-Moya, Rudolf Reichert, Chung-Kyu Park, Dan Brown, Pei Dong, Siyuan Wang, and Boshen Xu for their help and support of this work.

Conflicts of Interest

The authors declare no conflicts of interest.

References

  1. Czerwinski, F. Current Trends in Automotive Lightweighting Strategies and Materials. Materials 2021, 14, 6631. [Google Scholar] [CrossRef]
  2. Sanguesa, J.A.; Torres-Sanz, V.; Garrido, P.; Martinez, F.J.; Marquez-Barja, J.M. A Review on Electric Vehicles: Technologies and Challenges. Smart Cities 2021, 4, 372–404. [Google Scholar] [CrossRef]
  3. Arbelaez, R. As Heavy EVs Proliferate, Their Weight May Be a Drag on Safety. Available online: https://www.iihs.org/news/detail/as-heavy-evs-proliferate-their-weight-may-be-a-drag-on-safety (accessed on 6 June 2023).
  4. Susilawati, S.; Wong, W.J.; Pang, Z.J. Safety Effectiveness of Autonomous Vehicles and Connected Autonomous Vehicles in Reducing Pedestrian Crashes. Transp. Res. Rec. 2023, 2677, 1605–1618. [Google Scholar] [CrossRef]
  5. Parekh, D.; Poddar, N.; Rajpurkar, A.; Chahal, M.; Kumar, N.; Joshi, G.P.; Cho, W. A Review on Autonomous Vehicles: Progress, Methods and Challenges. Electronics 2022, 11, 2162. [Google Scholar] [CrossRef]
  6. Arango, J.F.; Bergasa, L.M.; Revenga, P.A.; Barea, R.; López-Guillén, E.; Gómez-Huélamo, C.; Araluce, J.; Gutiérrez, R. Drive-By-Wire Development Process Based on ROS for an Autonomous Electric Vehicle. Sensors 2020, 20, 6121. [Google Scholar] [CrossRef]
  7. Liang, J.; Feng, J.; Fang, Z.; Lu, Y.; Yin, G.; Mao, X.; Wu, J.; Wang, F. An Energy-Oriented Torque-Vector Control Framework for Distributed Drive Electric Vehicles. IEEE Trans. Transp. Electrif. 2023, 9, 4014–4031. [Google Scholar] [CrossRef]
  8. Abdelkader, G.; Elgazzar, K.; Khamis, A. Connected Vehicles: Technology Review, State of the Art, Challenges and Opportunities. Sensors 2021, 21, 7712. [Google Scholar] [CrossRef]
  9. Liang, J.; Wang, F.; Feng, J.; Zhao, M.; Fang, R.; Pi, D.; Yin, G. A Hierarchical Control of Independently Driven Electric Vehicles Considering Handling Stability and Energy Conservation. IEEE Trans. Intell. Veh. 2024, 9, 738–751. [Google Scholar] [CrossRef]
  10. Dorsz, A.; Lewandowski, M. Analysis of Fire Hazards Associated with the Operation of Electric Vehicles in Enclosed Structures. Energies 2022, 15, 11. [Google Scholar] [CrossRef]
  11. Valdes-Dapena, P. Latest Tesla Fire Caused by Running over a Metal Object. Available online: https://money.cnn.com/2013/11/08/autos/tesla-fire-details/index.html (accessed on 6 June 2023).
  12. Sun, P.; Bisschop, R.; Niu, H.; Huang, X. A Review of Battery Fires in Electric Vehicles. Fire Technol. 2020, 56, 1361–1410. [Google Scholar] [CrossRef]
  13. Kia Recall 23V218000: High Voltage Battery Pack Short Circuits Causing Fire Hazard. Available online: https://repairpal.com/recall/23V218000 (accessed on 7 June 2023).
  14. Larsson, F.; Andersson, P.; Blomqvist, P.; Mellander, B.-E. Toxic Fluoride Gas Emissions from Lithium-Ion Battery Fires. Sci. Rep. 2017, 7, 10018. [Google Scholar] [CrossRef] [PubMed]
  15. Hynynen, J.; Quant, M.; Pramanik, R.; Olofsson, A.; Li, Y.Z.; Arvidson, M.; Andersson, P. Electric Vehicle Fire Safety in Enclosed Spaces; RISE Research Institutes of Sweden: Gothenburg, Sweden, 2023. [Google Scholar]
  16. Tessin–Tesla En Feu Sur L’A2: La Batterie Serait En Cause|24 Heures. Available online: https://www.24heures.ch/tesla-en-feu-sur-l-a2-la-batterie-serait-en-cause-373966884791 (accessed on 6 June 2023).
  17. Gastelu, G. NTSB: Tesla Was Going 116 Mph at Time of Fatal Florida Accident, Battery Pack Reignited Twice Afterwards. Available online: https://www.foxnews.com/auto/ntsb-tesla-was-going-116-mph-at-time-of-fatal-florida-accident-battery-pack-reignited-twice-afterwards (accessed on 6 June 2023).
  18. NTSB to Investigate Fiery Tesla Crash in Coral Gables That Killed 2. Available online: https://wsvn.com/news/local/miami-dade/ntsb-to-investigate-fiery-tesla-crash-in-coral-gables-that-killed-2/ (accessed on 6 June 2023).
  19. Sacramento Metro Fire District on Instagram on Instagram. Available online: https://www.instagram.com/reel/CewdngRAWNQ/ (accessed on 31 July 2024).
  20. National Transportation Safety Board. Safety Risks to Emergency Responders from Lithium-Ion Battery Fires in Electric Vehicles; National Transportation Safety Board. 2020. Available online: https://www.ntsb.gov/safety/safety-studies/Documents/SR2001.pdf (accessed on 11 August 2024).
  21. Mauger, A.; Julien, C.M. Critical Review on Lithium-Ion Batteries: Are They Safe? Sustainable? Ionics 2017, 23, 1933–1947. [Google Scholar] [CrossRef]
  22. Si, R.; Liu, D.; Xue, S. Experimental Study on Fire and Explosion Suppression of Self-Ignition of Lithium Ion Battery. Procedia Eng. 2018, 211, 629–634. [Google Scholar] [CrossRef]
  23. GWL Dangerous vs. Safe Batteries, Explosion and Fire Test! Available online: https://www.youtube.com/watch?v=Qzt9RZ0FQyM (accessed on 14 July 2023).
  24. Zhu, L.; Xia, Y.; Liu, Y.; Ge, Y.; Wang, L.; Zhang, L. Extending a Homogenized Model for Characterizing Multidirectional Jellyroll Failure in Prismatic Lithium-Ion Batteries. Energies 2021, 14, 3444. [Google Scholar] [CrossRef]
  25. Werling, T.; Sprenger, M.; Ellersdorfer, C.; Sinz, W. Experimental and Numerical Investigation of the Behavior of Automotive Battery Busbars under Varying Mechanical Loads. Energies 2020, 13, 6572. [Google Scholar] [CrossRef]
  26. Kalnaus, S.; Wang, H.; Simunovic, S.; Kumar, A.; Gorti, S.B.; Allu, S.; Turner, J.A. Crashworthiness Models for Automotive Batteries. Crashworthiness Models for Automotive Batteries A Report on the Department of Energy Project 2088-A031-15 for the National Highway Traffic Safety Administration (NHTSA), an Agency of the U.S. Department of Transportation; Oak Ridge National Lab. (ORNL): Oak Ridge, TN, USA, 2018. [CrossRef]
  27. Gu, W.B.; Wang, C.Y. Thermal-Electrochemical Modeling of Battery Systems. J. Electrochem. Soc. 2000, 147, 2910. [Google Scholar] [CrossRef]
  28. Li, Q.; Zhu, L.; Ruan, H. Electromagnetic–Thermo–Mechanical Coupling Behavior of Cu/Si Layered Thin Plate Under Pulsed Magnetic Field. Acta Mech. Solida Sin. 2022, 35, 90–100. [Google Scholar] [CrossRef]
  29. Bateau-Meyer, S.; L’Eplattenier, P.; Deng, J.; Zhu, M.; Bae, C. Randles Circuit Parameters Set Up for Battery Simulations in LS-DYNA®. In Proceedings of the 15th International LS-DYNA® Users Conference, LSTC, Dearborn, MI, USA, 10–14 June 2018; p. 15. [Google Scholar]
  30. L’Eplattenier, P.; Çaldichoury, I.; Marcicki, J.; Bartlett, A.; Yang, X.G.; Mejia, V.; Zhu, M.; Chen, Y. A Distributed Randle Circuit Model for Battery Abuse Simulations Using LS-DYNA®. In Proceedings of the 14th International LS-DYNA Users Conference, Detroit, MI, USA, 12 June 2016; p. 18. [Google Scholar]
  31. Keshavarzi, M.; Derakhshan, M.; Gilaki, M.; L’Eplattenier, P.; Caldichoury, I.; Soudbakhsh, D.; Sahraei, E. Coupled Electrochemical-Mechanical Modeling of Lithium-Ion Batteries Using Distributed Randle Circuit Model. In Proceedings of the 2021 International Conference on Electrical, Computer and Energy Technologies (ICECET), Cape Town, South Africa, 9–10 December 2021; pp. 1–6. [Google Scholar] [CrossRef]
  32. Wang, L.; Ling, C.; Kan, C.-D.; Yang, C. A Coupled Thermal–Electrical–Mechanical Analysis for Lithium-Ion Battery. J. Micromechanics Mol. Phys. 2022, 07, 61–70. [Google Scholar] [CrossRef]
  33. Zhao, R.; Liu, J.; Gu, J. The Effects of Electrode Thickness on the Electrochemical and Thermal Characteristics of Lithium Ion Battery. Appl. Energy 2015, 139, 220–229. [Google Scholar] [CrossRef]
  34. Jiang, W.; Zhou, Q.; Lu, F.; Chen, Y.; Ma, Z. A Thermal-Electrochemical-Mechanical Coupled Model Based on Non-Equilibrium Thermodynamics of Li-Ion Batteries. J. Energy Storage 2022, 55, 105655. [Google Scholar] [CrossRef]
  35. Zhang, X.; Chumakov, S.; Li, X.; Klinsmann, M.; Kim, S.U.; Linder, C.; Christensen, J. An Electro-Chemo-Thermo-Mechanical Coupled Three-Dimensional Computational Framework for Lithium-Ion Batteries. J. Electrochem. Soc. 2020, 167, 160542. [Google Scholar] [CrossRef]
  36. Im, K.; Lim, J.; Lee, K.-J.; Zhang, Z.-C.; Cook, G., Jr. Electrochemical-Thermal-Mechanical Coupling of Lithium-Ion Battery Model in LS-DYNA. In Proceedings of the 16th International LS-DYNA Users Conference, Virtual Event, 10 June 2020. [Google Scholar]
  37. Kim, S.; Wee, J.; Peters, K.; Huang, H.-Y.S. Multiphysics Coupling in Lithium-Ion Batteries with Reconstructed Porous Microstructures. J. Phys. Chem. C 2018, 122, 5280–5290. [Google Scholar] [CrossRef]
  38. Fill, A.; Bubeck, L.; Knauer, D.; Hemmerling, J.; Birke, K.P. Multi-Dimensional Model for Electrical, Thermal and Mechanical Simulation of a Lithium-Ion Cell. In Proceedings of the NEIS 2022; Conference on Sustainable Energy Supply and Energy Storage Systems, Hamburg, Germany, 26 September 2022; pp. 1–8. [Google Scholar]
  39. Kumar, P.; Rankin, G.; Pattipati, K.R.; Balasingam, B. Model-Based Approach to Long Term Prediction of Battery Surface Temperature. IEEE J. Emerg. Sel. Top. Ind. Electron. 2023, 4, 389–399. [Google Scholar] [CrossRef]
  40. Sevgi, L. Electromagnetic Modeling and Simulation; The IEEE Press Series on Electromagnetic Wave Theory; IEEE Press: Piscataway, NJ, USA, 2014; ISBN 978-1-118-71618-2. [Google Scholar]
  41. L’Eplattenier, P.; Cook, G.; Ashcraft, C.; Burger, M.; Imbert, J.; Worswick, M. Introduction of an Electromagnetism Module in LS-DYNA for Coupled Mechanical-Thermal-Electromagnetic Simulations. Met. Form. 2009, 8, 351–358. [Google Scholar]
  42. L’Eplattenier, P.; Çaldichoury, I.; Anton, J. LS-DYNA® R7: Update on the Electromagnetism Module (EM). In Proceedings of the 9th European LS-DYNA Conference, Manchester, UK, 2–4 June 2013. [Google Scholar]
  43. Biro, O.; Preis, K. On the Use of the Magnetic Vector Potential in the Finite-Element Analysis of Three-Dimensional Eddy Currents. IEEE Trans. Magn. 1989, 25, 3145–3159. [Google Scholar] [CrossRef]
  44. Chen, Y.; Kang, Y.; Zhao, Y.; Wang, L.; Liu, J.; Li, Y.; Liang, Z.; He, X.; Li, X.; Tavajohi, N.; et al. A Review of Lithium-Ion Battery Safety Concerns: The Issues, Strategies, and Testing Standards. J. Energy Chem. 2021, 59, 83–99. [Google Scholar] [CrossRef]
  45. Kisters, T.; Sahraei, E.; Wierzbicki, T. Dynamic Impact Tests on Lithium-Ion Cells. Int. J. Impact Eng. 2017, 108, 205–216. [Google Scholar] [CrossRef]
  46. Blomgren, G.E. The Development and Future of Lithium Ion Batteries. J. Electrochem. Soc. 2016, 164, A5019. [Google Scholar] [CrossRef]
  47. Zhang, X.; Sahraei, E.; Wang, K. Deformation and Failure Characteristics of Four Types of Lithium-Ion Battery Separators. J. Power Sources 2016, 327, 693–701. [Google Scholar] [CrossRef]
  48. Sahraei, E.; Hill, R.; Wierzbicki, T. Calibration and Finite Element Simulation of Pouch Lithium-Ion Batteries for Mechanical Integrity. J. Power Sources 2012, 201, 307–321. [Google Scholar] [CrossRef]
  49. Time Step Size. Available online: https://www.dynasupport.com/tutorial/ls-dyna-users-guide/time-step-size (accessed on 19 July 2023).
  50. Morgan, R.M.; Cui, C.; Digges, K.H.; Cao, L.; Kan, C.-D. (Steve) Impact and Injury Patterns in Between-Rails Frontal Crashes of Vehicles with Good Ratings for Frontal Crash Protection. Ann. Adv. Automot. Med. Annu. Sci. Conf. 2012, 56, 255–265. [Google Scholar]
  51. Kan, C.-D.; Marzougui, D.; Bahouth, G.T.; Bedewi, N.E. Crashworthiness Evaluation Using Integrated Vehicle and Occupant Finite Element Models. Int. J. Crashworthiness 2001, 6, 387–398. [Google Scholar] [CrossRef]
  52. Reichert, R.; Mohan, P.; Marzougui, D.; Kan, C.-D.; Brown, D. Validation of a Toyota Camry Finite Element Model for Multiple Impact Configurations; SAE International: Warrendale, PA, USA, 2016. [Google Scholar]
  53. Eskandarian, A.; Marzougui, D.; Bedewi, N.E. Finite Element Model and Validation of a Surrogate Crash Test Vehicle for Impacts with Roadside Objects. Int. J. Crashworthiness 1997, 2, 239–258. [Google Scholar] [CrossRef]
  54. Simulation Vehicle Models|NHTSA. Available online: https://www.nhtsa.gov/crash-simulation-vehicle-models (accessed on 11 August 2024).
  55. Center for Collision Safety and Analysis–Finite Element Models. Available online: https://www.ccsa.gmu.edu/models/ (accessed on 18 July 2023).
  56. Powers, R.; Boodlal, K.; Durkos, J.; Boodlal, L.; Marzougui, D.; Kan, C.D.; Opiela, K.; Tahan, F. Roadside Barrier Designs near Bridge Rail Ends with Restricted Rights-of-Way: A Guide; Transportation Research Board: Washington, DC, USA, 2022; ISBN 978-0-309-68750-8. [Google Scholar]
  57. Marzougui, D.; Kan, C.-D.; Mahadevaiah, U.; Tahan, F.; Story, C.; Dolci, S.; Moreno, A.; Opiela, K.S.; Powers, R. Evaluating the Performance of Longitudinal Barriers on Curved, Superelevated Roadway Sections; Transportation Research Board: Washington, DC, USA, 2019; ISBN 978-0-309-48578-4. [Google Scholar]
  58. Center for Collision Safety and Analysis–2010 Toyota Yaris. Available online: https://www.ccsa.gmu.edu/models/2010-toyota-yaris/ (accessed on 19 July 2023).
  59. 2024 Nissan LEAF|All-Electric Vehicle. Available online: https://www.nissanusa.com/vehicles/electric-cars/leaf.html (accessed on 19 July 2023).
  60. Online Circuit Simulator & Schematic Editor. Available online: https://www.circuitlab.com/ (accessed on 4 February 2021).
  61. Kalnaus, S.; Kumar, A.; Lebrun-Grandie, D.T.; Simunovic, S.; Slattery, S.R.; Turner, J.A.; Wang, H.; Allu, S.; Gorti, S.B.; Turcksin, B.R. Crashworthiness Models for Automotive Batteries-Report on Project 2088-A031-15 for DOT/NHTSA; Oak Ridge National Lab. (ORNL): Oak Ridge, TN, USA, 2016. [CrossRef]
  62. Livermore Software Technology LS-DYNA Manual Volume III Multiphysics. Available online: https://lsdyna.ansys.com/manuals/ (accessed on 11 August 2024).
  63. Air-Thermal Conductivity vs. Temperature and Pressure. Available online: https://www.engineeringtoolbox.com/air-properties-viscosity-conductivity-heat-capacity-d_1509.html (accessed on 21 July 2023).
  64. Water-Thermal Conductivity vs. Temperature. Available online: https://www.engineeringtoolbox.com/water-liquid-gas-thermal-conductivity-temperature-pressure-d_2012.html (accessed on 21 July 2023).
  65. Ahmeid, M.; Muhammad, M.; Lambert, S.; Attidekou, P.S.; Milojevic, Z. A Rapid Capacity Evaluation of Retired Electric Vehicle Battery Modules Using Partial Discharge Test. J. Energy Storage 2022, 50, 104562. [Google Scholar] [CrossRef]
  66. Braco, E.; San Martín, I.; Sanchis, P.; Ursúa, A. Fast Capacity and Internal Resistance Estimation Method for Second-Life Batteries from Electric Vehicles. Appl. Energy 2023, 329, 120235. [Google Scholar] [CrossRef]
  67. Bao, Y.; Gong, Y. Li-Ion Battery Charge Transfer Stability Studies with Direct Current Impedance Spectroscopy. Energy Rep. 2023, 9, 34–41. [Google Scholar] [CrossRef]
  68. Turner, J.A.; Kalnaus, S.; Wang, H.; Simunovic, S.; Kumar, A.; Gorti, S.; Allu, S. Crashworthiness Models for Automotive Batteries. A Report on the Department of Energy Project 2088-A031-15 for the National Highway Traffic Safety Administration. 2019. Available online: https://rosap.ntl.bts.gov/view/dot/41005 (accessed on 11 August 2024).
  69. Nigel 2010 Nissan Leaf. Available online: https://www.batterydesign.net/2010-nissan-leaf/ (accessed on 2 November 2023).
  70. Jones, J. Laboratory Test Procedure for FMVSS No. 214, Dynamic Side Impact Protection Rigid Pole Side Impact Test Requirements; TP-214P-01; Enforcement Office of Vehicle Safety Compliance, Department of Transportation: Washington, DC, USA, 2012.
Figure 1. Thermal runaway of lithium-ion battery in electric vehicle.
Machines 12 00596 g001
Figure 2. Vehicle crash safety FE models developed by the CCSA team [55]. The models with * were created by others and improved by CCSA.
Machines 12 00596 g002
Figure 3. Multi-physics FE models (indicated by squares) and simulation cases (indicated by rounded squares) developed in this work.
Machines 12 00596 g003
Figure 4. Representative finite element model of Leaf battery cell (top left); representative separator is modeled with “Wrinkles” (top right). Model detail and place to define electric potential difference (bottom).
Machines 12 00596 g004
Figure 5. Electric current at ampere meter “AM1” between LS-DYNA (solid line) and CircuitLab (dash line) (left). Randles circuit model in CircuitLab in external short circuit (right).
Machines 12 00596 g005
Figure 6. Nissan Leaf cell spherical punch test [61] vs. simulation result.
Machines 12 00596 g006
Figure 7. Sample thermal–mechanical contact card for heat transfer in air. Kair = 0.024 W/m as shown in the red box. This card is used to define thermal contact outside the battery cell.
Machines 12 00596 g007
Figure 8. Sample thermal–mechanical contact card for heat transfer in water. Kwater = 0.58 W/m as shown in the red box. This card is used to define thermal contact within the battery cell.
Machines 12 00596 g008
Figure 9. A thermal–mechanical–electrical-coupled representative FE model for Nissan Leaf module.
Machines 12 00596 g009
Figure 10. Two different battery cells connected in serial. CircuitLab simulation diagram (top); time history of current at meter “AM1” of LS-DYNA and CircuitLab (bottom left); LS-DYNA simulation current density contour (bottom right).
Machines 12 00596 g010
Figure 11. Two different battery cells in parallel. Current density (top left); CircuitLab simulation diagram (top right); current at the “AM1” between LS-DYNA and CircuitLab (bottom).
Machines 12 00596 g011
Figure 12. Randles circuit in CircuitLab (top) and electrical calibration (bottom). External short is formed at 5 × 10⁻⁴ s.
Machines 12 00596 g012
Figure 13. Battery module current density distribution (left) and temperature distribution of the cathode layer in external short-circuit test (right).
Machines 12 00596 g013
Figure 14. Experiment setup [26,61,68] (top left), simulation model (top middle), and force vs. displacement (bottom) in spherical indentation.
Machines 12 00596 g014
Figure 15. Temperature contour of battery module simulation: anode aluminum current collector sheet (A), anode graphite coating (B), separator (C), cathode lithium material coating (D). Cathode copper current collector sheet (E). Plastic cell wrapper (F). Soft cushion (G). Module case cover (H).
Machines 12 00596 g015
Figure 16. Temperature rise caused by side pole impact on a battery module with 4 cells. Exterior temperature (left). Interior in critical area (right).
Machines 12 00596 g016
Figure 17. Battery module coarse model.
Machines 12 00596 g017
Figure 18. Temperature in the side pole impact (top). Joule heating power in the side pole impact (top right). Joule heating power in impact area (bottom).
Machines 12 00596 g018
Figure 19. EV top view (upper left); front view (upper right); battery pack location (lower left); EV ISO view (lower right).
Machines 12 00596 g019
Figure 20. EV battery pack electric potential (left); current density of battery pack (right).
Machines 12 00596 g020
Figure 21. The temperature contour (bottom) for a normal discharging battery pack in EV.
Machines 12 00596 g021
Figure 22. Voltage (top left), current density (top right), and temperature (bottom) of battery pack in external short.
Machines 12 00596 g022
Figure 23. Maximum temperature for different parts of battery cell in external short circuit.
Machines 12 00596 g023
Figure 24. A generic EV model (left) with 24 active cells (right) in a fully coupled electric–thermal–mechanical.
Machines 12 00596 g024
Figure 25. Bottom view of EV pole impact at 20 mph: deformation at t = 0.05 s (top left). Deformation at t = 0.12 s (top right). Cathode layers temperature in Kelvin at t = 0.05 s (bottom left). Cathode layers temperature in Kelvin at t = 0.12 s (bottom right).
Machines 12 00596 g025
Figure 26. Maximum temperature (top) and maximum plastic strain (bottom) at the cathode layer of EV cells in pole impact simulation. Dashed line represents the cell far away from the impact area. Solid line represents the cell close to the impact area.
Machines 12 00596 g026
Figure 27. Temperature distribution at maximum intrusion moment in pole impact at 25 mph impact speed.
Machines 12 00596 g027
Figure 28. Maximum temperature (top) and maximum plastic strain (bottom) at the cathode layer of EV cells under pole impact. Dashed line represents the cell far away from the impact area. Solid line represents the cell close to the impact area.
Machines 12 00596 g028
Figure 29. Plastic strain at the cathode layer indicates permanent damage to the cell: pole impact speed at 20 mph (left). Pole impact speed at 25 mph (right).
Machines 12 00596 g029
Figure 30. Plastic strain contour of cell porch bag at impact speed: 20 mph (left); 25 mph (middle); 30 mph (right).
Machines 12 00596 g030
Figure 31. Maximum plastic strain of cell porch bag at impact speed: 20 mph (gray); 25 mph (orange); 30 mph (blue).
Machines 12 00596 g031
Table 1. Impedance measurement of Leaf battery module.
AC Impedance at 1 kHzDC Internal Resistance
“CHI660E” Test Data5.61 mΩ6.46 mΩ
“YR1035+” Test Data4.89 mΩN/A
Literature [66]1.08–2.06 mΩ2–6 mΩ
LS-DYNA SimulationN/A2.927 mΩ
Table 2. Battery thermal runaway prediction for BEV side pole impact with different impact speeds.
Immediate Thermal RunawayRisk of Thermal Runaway with Continued UseCell Leakage
20 mphNoNoNo
25 mphNoYesNo
30 mphYesN/AYes
Disclaimer/Publisher’s Note: The statements, opinions and data contained in all publications are solely those of the individual author(s) and contributor(s) and not of MDPI and/or the editor(s). MDPI and/or the editor(s) disclaim responsibility for any injury to people or property resulting from any ideas, methods, instructions or products referred to in the content.

