Abstract
Background: We performed in silico prediction of the interactions between compounds of Jamu herbs and human proteins by utilizing data-intensive science and machine learning methods. Verifying the proteins that are targeted by compounds of natural herbs will be helpful to select natural herb-based drug candidates. Methods: Initially, data related to compounds, target proteins, and interactions between them were collected from open access databases. Compounds are represented by molecular fingerprints, whereas amino acid sequences are represented by numerical protein descriptors. Then, prediction models that predict the interactions between compounds and target proteins were constructed using support vector machine and random forest. Results: A random forest model constructed based on MACCS fingerprint and amino acid composition obtained the highest accuracy. We used the best model to predict target proteins for 94 important Jamu compounds and assessed the results by supporting evidence from published literature and other sources. There are 27 compounds that can be validated by professional doctors, and those compounds belong to seven efficacy groups. Conclusion: By comparing the efficacy of predicted compounds and the relations of the targeted proteins with diseases, we found that some compounds might be considered as drug candidates.
1. Introduction
Identification of compounds derived from herbal medicines and natural products has shown potential in drug discovery and drug development [1,2]. Many useful compounds have been found and utilized from herbal medicines and natural products to treat various diseases, such as oseltamivir [3] and roscovitine [4]. Oseltamivir is a neuraminidase inhibitor used in the treatment and prophylaxis of both influenza A and influenza B, whereas roscovitine is known as an anticancer drug. However, the process of identification of compound and target protein interactions in vivo and in vitro requires enormous effort. Therefore, efficient in silico screening methods are needed to predict the interaction between compounds and target proteins. In this light, in silico prediction of the interactions between compounds and target proteins can help in making the efforts easier.
As a country with the largest medicinal plant species in the world, Indonesians utilize medicinal plants as a constituent of herbal medicines [5,6,7]. These are known as Indonesian Jamu. Currently, Jamu is produced commercially on an industrial scale under the supervision of the National Agency of Drug and Food Control (NADFC) of Indonesia. Jamu, like the other herbal medicine systems, i.e., traditional Chinese medicine, Japanese Kampo, Ayurveda, and Unani, can be considered as a new resource for compound screening. The molecules might be from a specific part of a plant used as a Jamu ingredient, such as rhizome of Java ginger (Curcuma xanthorrhiza), leaf of kecibeling (Strobilanthes crispus), or fruit of tamarind (Tamarindus indica). The utilization of herbal medicines in drug screening is very promising because of the lack of side effects [8,9]. In addition, the high biodiversity in Indonesia has great advantages in the process of finding potential compounds in Jamu. Furthermore, the systematization of Jamu medicine might help not only to obtain information about the major ingredient plants in Jamu medicines, but also to find compound and protein interactions to explain formulation of Jamu. The information on interactions between Jamu compounds and human target proteins will allow understanding the mechanisms of how Jamu medicines work against diseases and will be helpful for finding new drugs based on a scientific basis.
Various screening approaches have been developed to determine candidate compounds from herbal medicines and natural products in drug discovery. One category of the popular approaches is machine learning techniques. This approach can learn from the data, and the resulting model can be applied to make a prediction. Support vector machine (SVM) and random forest are machine learning methods for supervised learning, and they have been used in many research fields with success [10,11,12]. In order to obtain a good model, the machine learning method requires a great number of data samples. Nowadays, there are many open access databases that can be used to support the prediction of compound and protein interactions, such as KEGG [13], DrugBank [14], KNApSAcK [15], UniProt [16], and Online Mendelian Inheritance in Man (OMIM) [17]. Prediction of compound–protein interactions can exploit these databases to identify candidate compounds. In terms of Indonesian Jamu, IJAH Analytics can be considered as a good reference for Jamu because it has information about plant species used in Jamu formulas. In addition, plant species information can be associated with information regarding compounds, target proteins, diseases, and interactions between entities. It is hoped that the more efficient and effective application of natural products will improve the drug discovery process.
Many studies on the prediction of interactions between compounds and target proteins have been reported. Yamanishi et al. implemented a systematic study on the prediction of compound–target protein interactions by utilizing supervised learning using a bipartite graph [18]. The interactions were predicted by utilizing the structural similarity of compounds and the similarity of amino acid sequences. They computed the structural similarities between compounds using SIMCOMP and the sequence similarities between proteins using normalized Smith–Waterman scores [19,20]. In the prediction methods, they applied the bipartite local model (BLM) and SVM to predict compound–target protein interactions [21,22]. BLM predicts target proteins of a given compound using the structural similarity of compounds, proteomic similarity, and information of interactions between compounds and target proteins, whereas SVM was used as the classifier for the BLM.
In this study, we applied machine learning techniques to predict the interaction between compound and protein. SVM and random forest have been chosen as classifiers, and compound and protein are represented by fingerprint and numerical representation of amino acid, respectively. The accuracy, sensitivity, and specificity were used in the evaluation of the models. After we confirmed the best model obtained in the prediction of compound–protein interactions, we determine targeted proteins for candidate compounds obtained from plants used in the Jamu formulas for different efficacies [11]. The objective was not only to identify targeted proteins for developing new drugs, but also to give a comprehensive understanding of Jamu medicines on the molecular level.
2. Materials and Methods
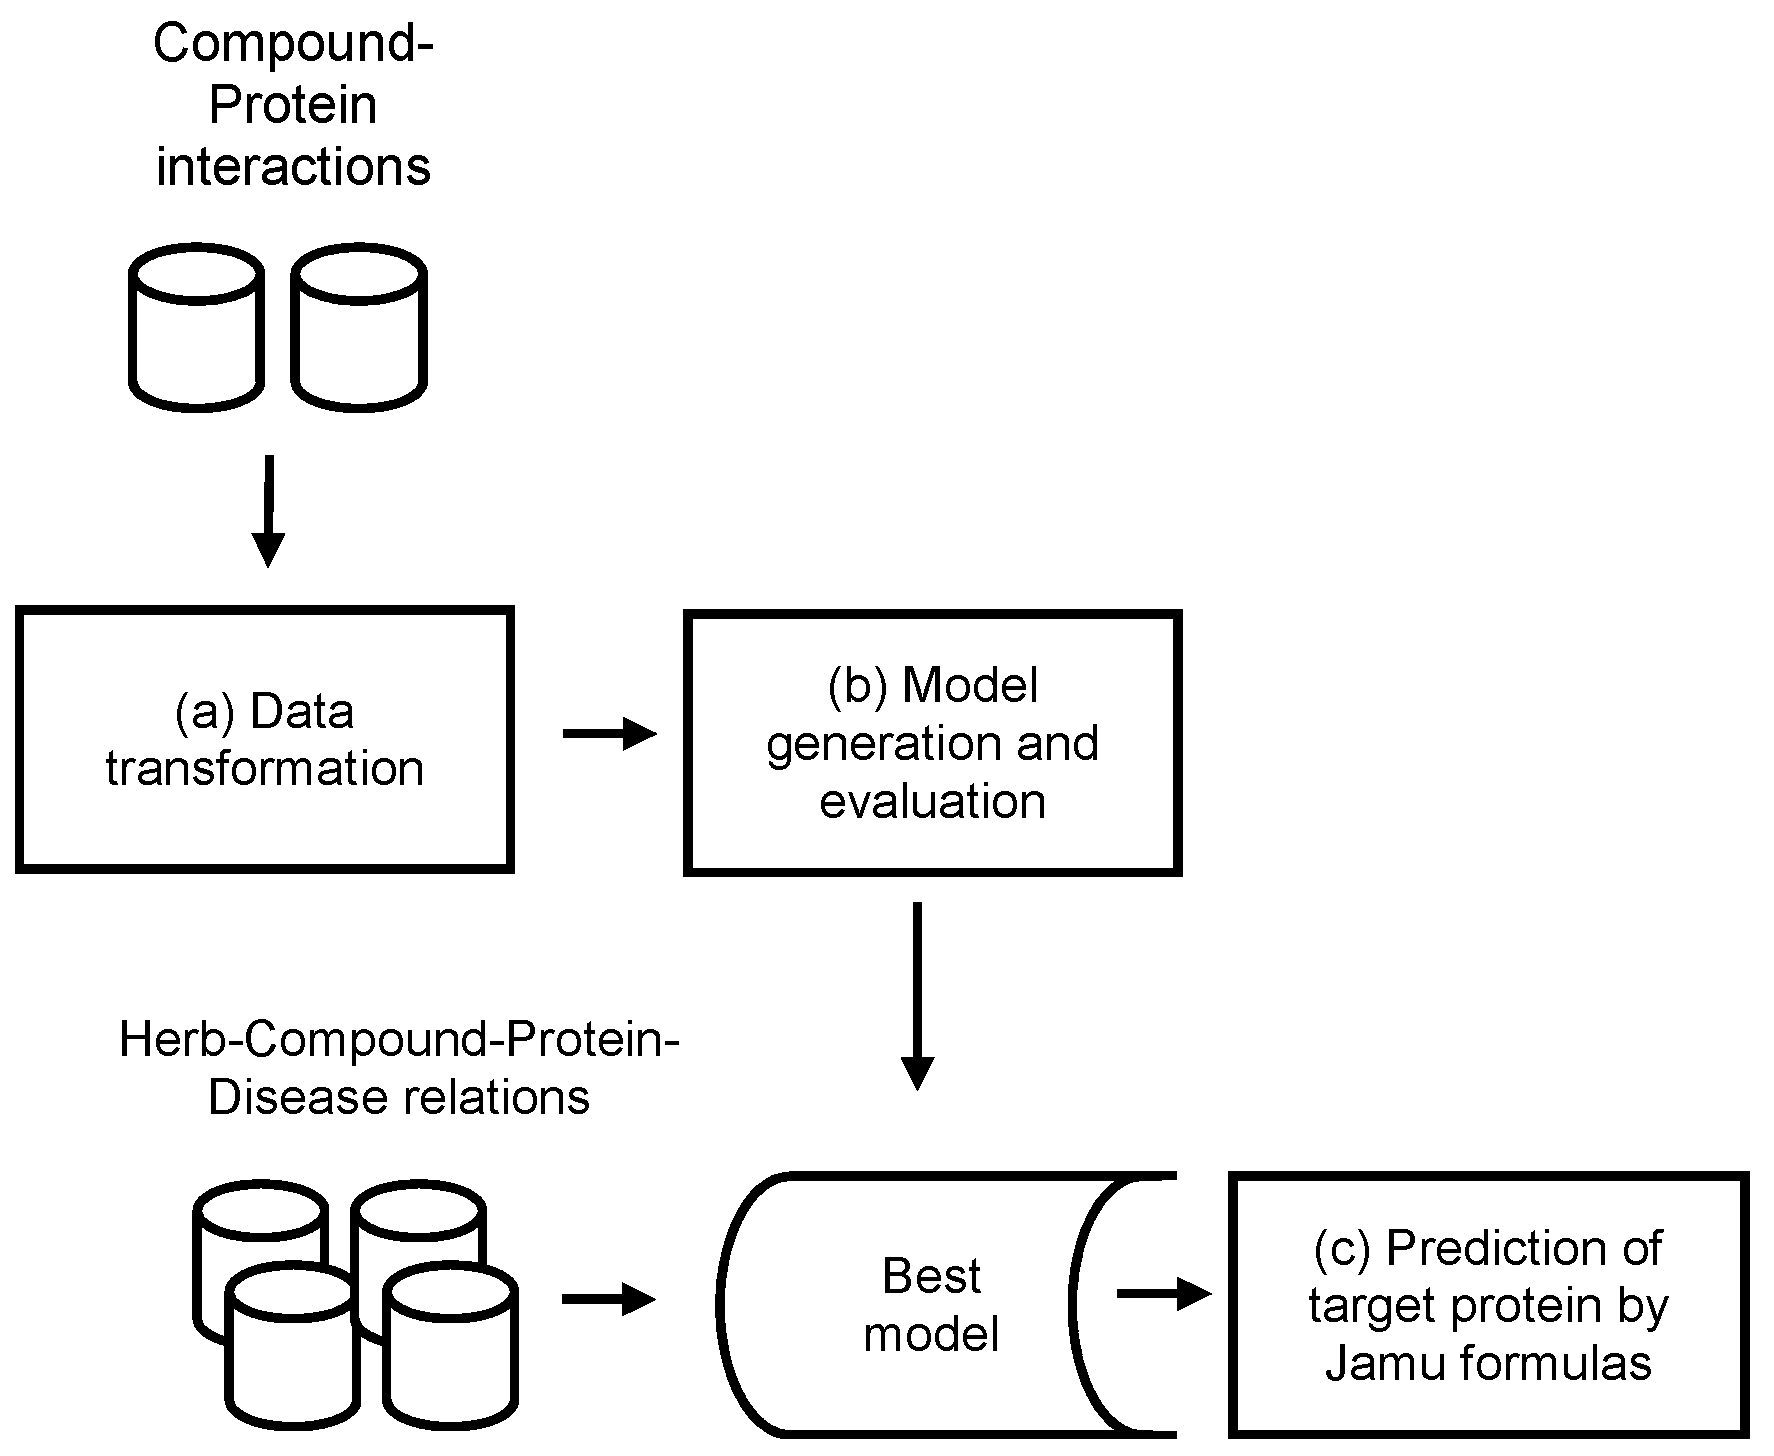
Jamu medicines consist of a combination of medicinal plants and are used to treat various diseases. In this work, we exploit information about compound and protein interactions from open access databases to predict compound–protein interactions in the context of Jamu formulas. The concept of the proposed method is depicted in Figure 1, which mainly consists of three processes: (a) data transformation, (b) model generation and evaluation, and (c) prediction of targeted proteins by Jamu formulas.

Figure 1.
Concept of the methodology.
Initially, we collected the required data for this study from open access databases such as DrugBank, PubChem [23], KNApSAcK, UniProt, KEGG, OMIM, Matador [24], and Indonesian Jamu Herbs (IJAH Analytics, http://ijah.apps.cs.ipb.ac.id, accessed on 20 August 2021). The acquisition of data for generating the prediction model includes compounds, target proteins, and interactions between them. The chemical structures of the compounds were represented by Simplified Molecular Input Line Entry Specification (SMILES) codes. Many databases, such as DrugBank, provide SMILES of each compound [25]. We eliminated some compounds that have ambiguous SMILES or do not have SMILES information. Compounds with known SMILES codes were used in the training process to generate a model for predicting compound–protein interactions. In addition, the information about target proteins was also collected from public databases, especially the IJAH database, and these data were represented by amino acid sequences using FASTA format. In the case of interactions, we gathered that information from IJAH, Matador, and KEGG databases. We also collected the candidate compounds of Jamu formulas associated with efficacy groups from a previous study [11] and used those as test data.
2.1. Data Transformation
We transformed information about compounds and amino acid sequences into fingerprints and numerical representations of amino acids, respectively. In the case of compounds, we examined two different fingerprint representations, namely the binary representation of the Molecular Access System (MACCS) and PubChem fingerprints [12,26,27]. Therefore, each compound was represented as 166 and 881 binary vectors, respectively. In the case of proteins, we transformed amino acid sequences into the amino acid composition (AAC) and dipeptide composition descriptors [28]. The AAC represents an amino acid sequence as a fraction of each amino acid type within a protein, and it will produce 20-dimensional AAC vectors. The fractions of all 20 natural amino acids are calculated as:
where is the number of the amino acid type r and N is the length of the sequence. In addition, dipeptide composition will produce 400-dimensional descriptors, defined as:
where Nrs is the number of dipeptides represented by amino acid type r and type s.
After we transformed compounds and proteins into fingerprints and numerical descriptors, we created four datasets consisting of all combinations of compound and protein vectors for generating the model as follows: a combination of MACCS fingerprint and AACs (called dataset 1), a combination of MACCS fingerprint and dipeptide descriptor (called dataset 2), a combination of PubChem fingerprint and AACs (called dataset 3), and a combination of PubChem fingerprint and dipeptide descriptor (called dataset 4). Figure 2 illustrates the data representation of compounds, proteins, and interactions between them. In the case of testing data, we built combinations of candidate compounds from medicinal plants in Jamu and proteins.
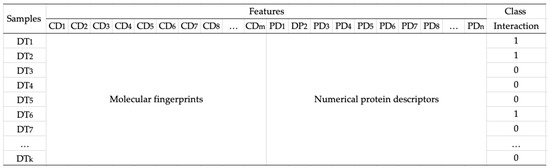
Figure 2.
Data representation. Each data sample DTk is composed of molecular fingerprints (CD1, CD2, CD3, …, CDm) and numerical protein descriptors (PD1, PD2, PD3, …, PDn).
2.2. Model Generation and Evaluation
We applied SVM and random forest in the model generation step. SVM is a binary classifier based on constructing an optimal linear model, which has the largest margin between two classes. The linear separator is constructed by simultaneous minimization of the empirical classification error and maximization of the geometric margin [29]. If we have training data pairs, , where is a vector representing compound and protein and is the class of . The decision function of SVM is defined as , where is the weight vector and is a scalar. The optimization problem that SVMs aim to minimize is shown in Equation (3):
subject to , where C is a trade-off between the width of the margin and the number of misclassifications, and is a slack variable. SVM can be extended to classify data that are not linearly separable by utilizing a kernel technique. There are two kernel functions that we applied in this study, namely the linear kernel and radial basis function (RBF) kernel , where is the inverse of the radius of influence of samples selected by the model as support vectors [10,30].
In addition, random forest is an ensemble method composed of many decision trees. For each classification tree, a bootstrap sample of the data is generated, and at each split, the candidate set of variables is a random subset of the variables [31,32,33]. Given a set of training samples , where is a vector of predictor variables representing compound–protein data and is the class label. Random forest targets generating a number of ntree decision trees from these samples. The same number of samples is randomly selected with replacement (bootstrap resampling) for each tree to form a new training set, and the samples not selected are called out-of-bag (OOB) samples. Using this new training set, a decision tree is grown to the largest extent possible without any pruning according to the classification and regression tree (CART) methodology [34]. The Gini index is used during the development process of a decision tree. The Gini index at node , , is shown in Equation (4).
where is the proportion of class observations at node [35]. Then, the Gini information gain of for splitting node into two child nodes, , is shown in Equation (5):
where and are the left and right child nodes of , and are the proportions of instances assigned to the left and right child nodes, and and are the instances in the left and right child nodes. At each node, a random set of features out of is evaluated, and the feature with the maximum is used for splitting the node . The OOB error is estimated in the process of constructing the forest. After constructing the entire forest, OOB classification results for each sample are used to determine a decision for this sample via a majority-voting rule.
We defined and compared the performance of the resulting models by using accuracy, sensitivity, and specificity [36,37]. The higher the accuracy is, the better the performance of the classifier is. We measured the accuracies of SVM with two different kernels and random forest using four data representations (datasets 1–4). In order to estimate the performance of random forest and SVM with two different kernels, 10-fold cross-validation was used [21]. Each of the datasets was divided into 10 subsamples. Then, nine samples were used as a training dataset to make a classification model, and the remaining sample was used as a validation dataset for testing the model. In the model evaluation step, we selected the best classifier and data representation of compounds and amino acid sequences for which we obtained the best result and used that for the prediction of target proteins.
2.3. Prediction of the Target Protein by Jamu Formulas
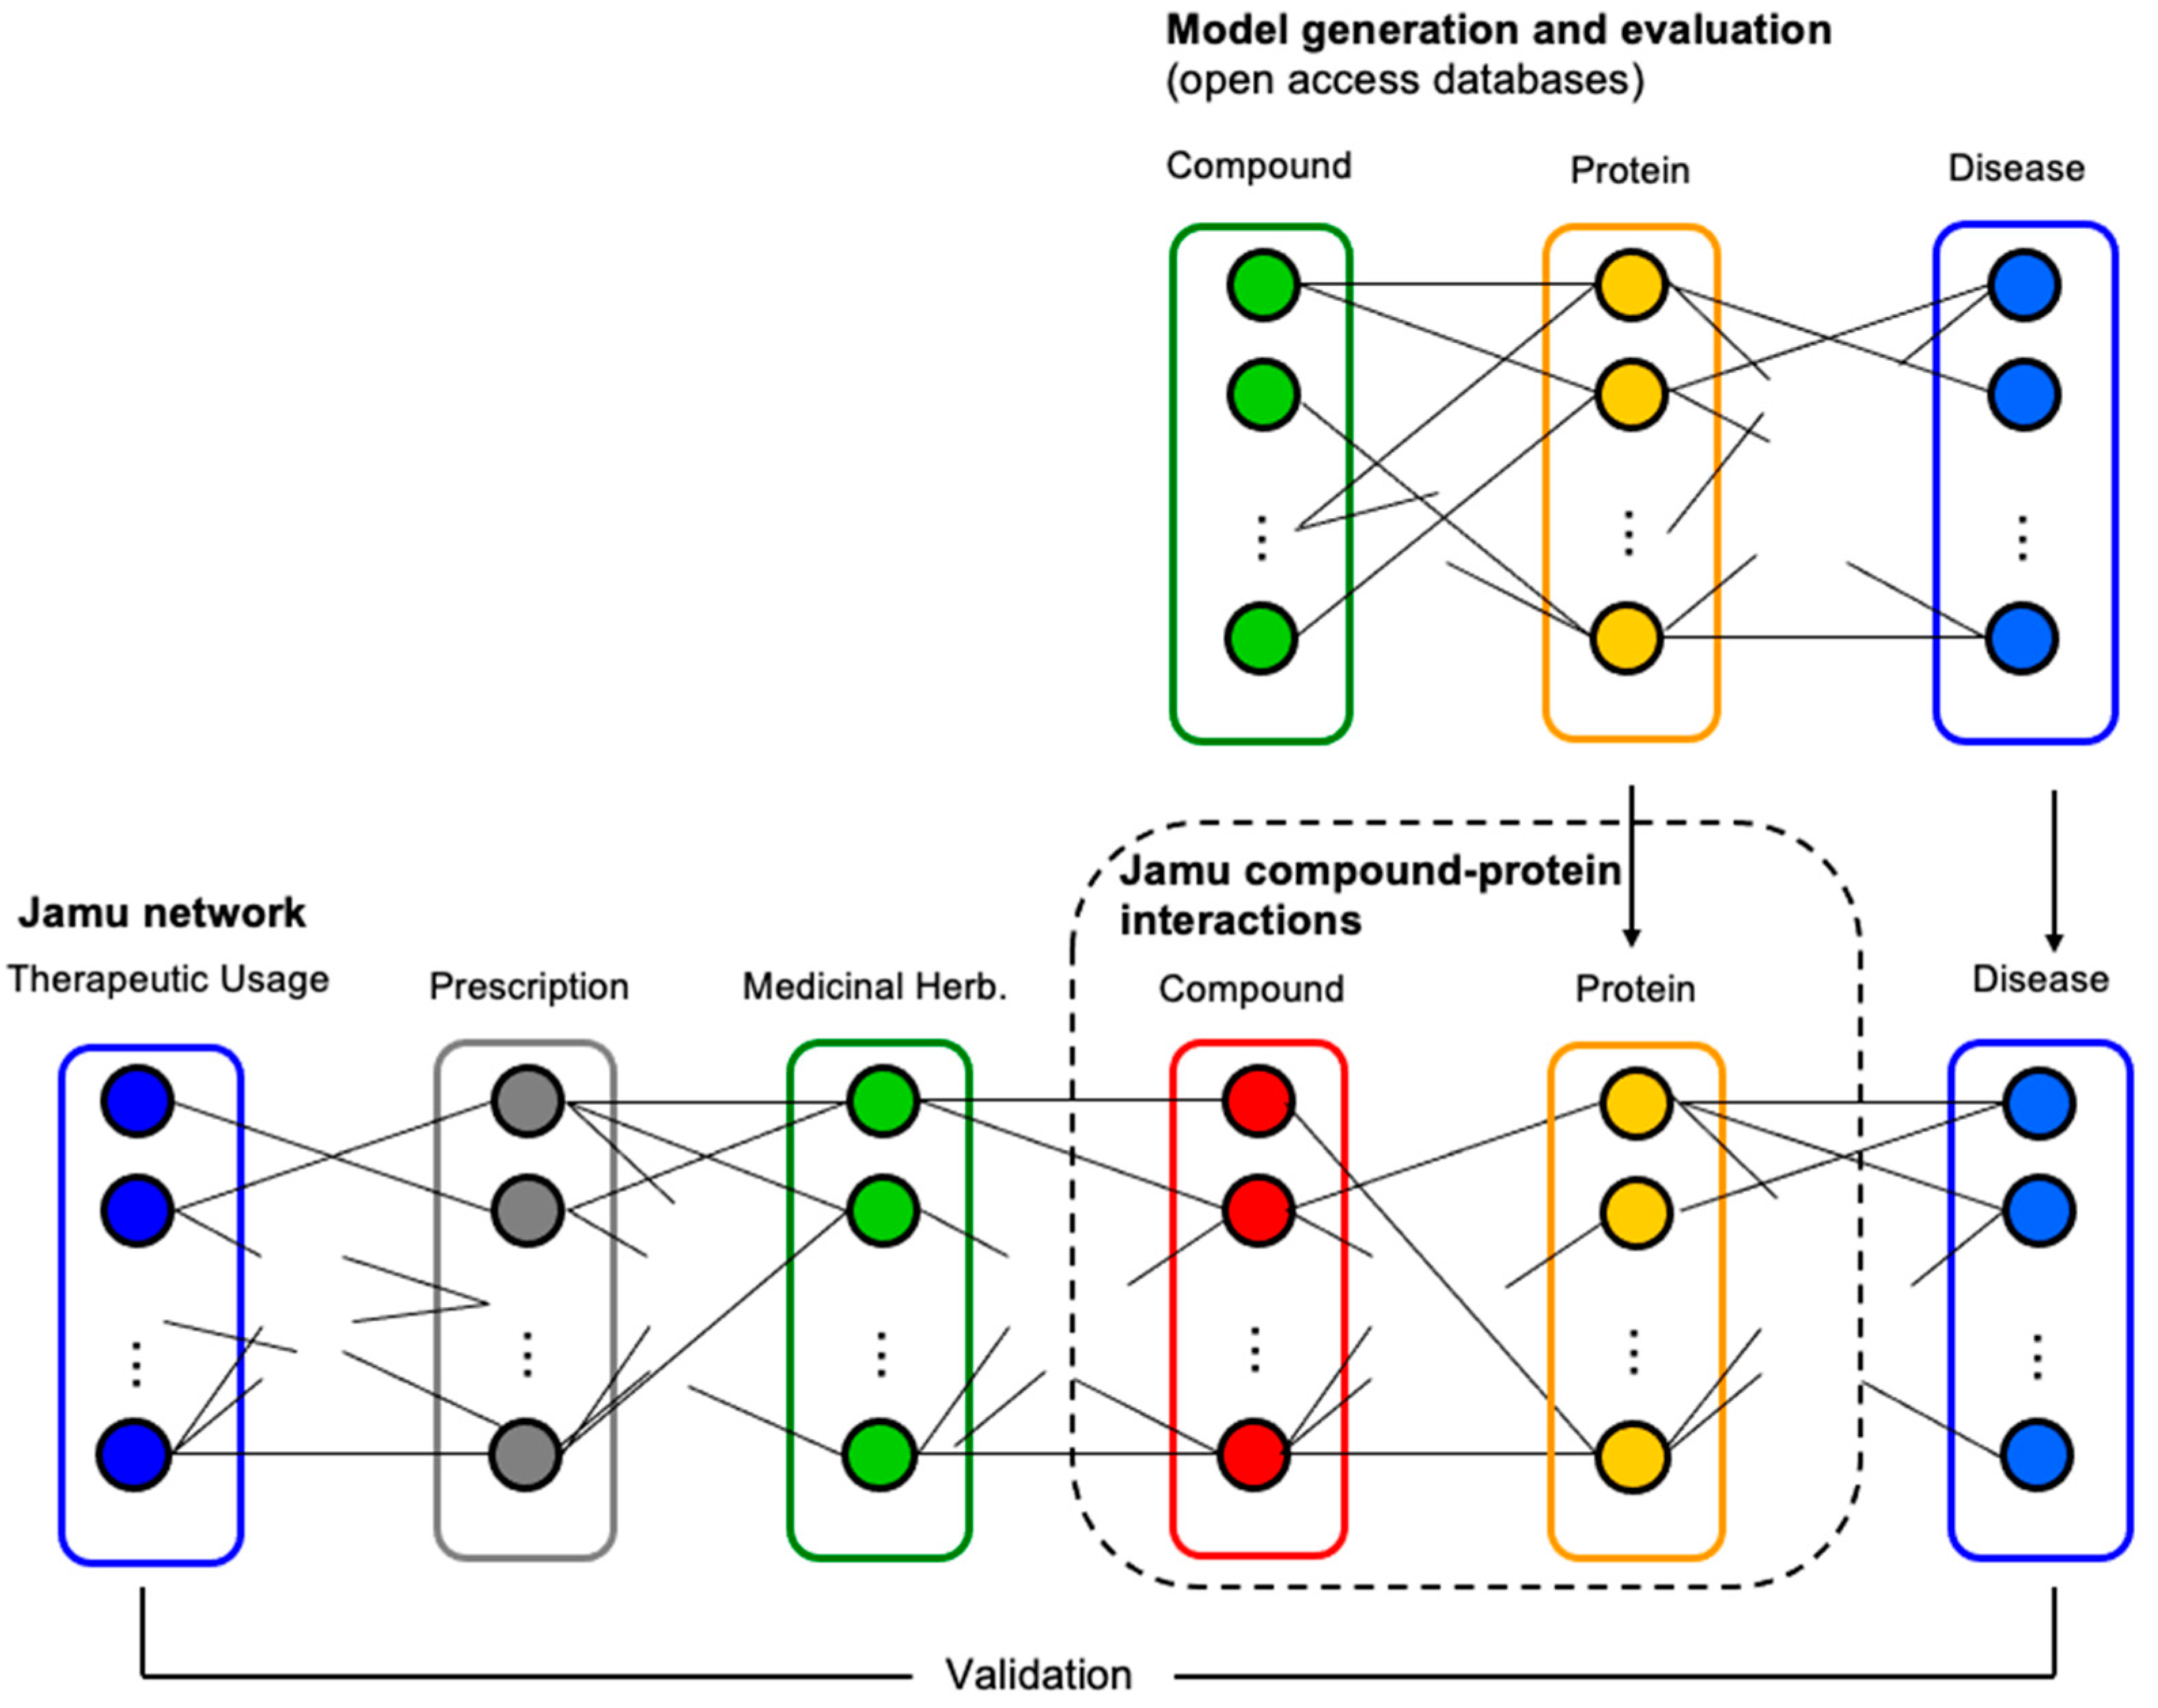
The best model with the highest accuracy was applied for the prediction of compound–protein interactions concerning Jamu formulas used as the testing dataset. In this case, we accepted compound–protein interactions as true interactions when the probability was greater than a threshold. Figure 3 illustrates the relations among different entities involving comprehensive Jamu research, where a dotted rectangle indicates the focus of the present work. Figure 3 also shows how we validate our results by comparing efficacy–compound and protein–disease relations. We validated the results by comparing the therapeutic usage of predicted compounds and the relations of the targeted proteins with diseases. We assessed and discussed the results with supporting evidence from published literature and comments from professional doctors.

Figure 3.
The process of prediction and identification of targeted proteins. Initially, we developed a prediction model of compound–protein interactions by utilizing compound–protein data. Then, the best model was used to predict interaction between compounds of Jamu formulas and their targeted proteins (in the dotted rectangle).
3. Results and Discussion
The summary of data used in this study is shown in Table 1. We utilized compounds that are reported to be available in the herbs used as Jamu ingredients. There are 17.227 compounds belonging to 4.984 Indonesian herbs collected from KNApSAcK, IJAH, PubChem, and KEGG databases. In addition, the number of target proteins collected from UniProt and IJAH databases is 3.334, and the number of interactions collected from UniProt, IJAH, Matador, and KEGG databases is 7.989. Initially, we removed the data that do not have necessary properties, such as the SMILES in the case of the compounds and the amino sequence in the case of target proteins. Furthermore, we removed the compounds and proteins that are not included in the compound–protein interactions data. We also considered only those compounds that target human proteins. Therefore, the numbers of compounds, proteins, and interactions used in this experiment are 2.146, 3.334, and 7.216, respectively.

Table 1.
The distribution of compound, protein, and interaction between them as training and testing data.
3.1. Preprocessing of Compound and Protein Data
The transformation of compounds from SMILES to fingerprints was done by utilizing ChemDes web-based software and PaDEL descriptor [27,38]. Compounds were transformed to MACCS and PubChem fingerprints. Moreover, we used the protr package in R to generate AAC and dipeptide as numerical representation schemes of protein sequences [28]. We eliminated two amino acid sequences in the preliminary study, i.e., Q9NZV5 and P36969, because they showed unrecognized amino acid type when transforming amino acid sequences to AAC. Therefore, there were 3.332 proteins left for further processes.
After data transformation finished, we created datasets for compound–protein prediction using both compound and protein space information. Each sample vector is composed of a fingerprint and numerical descriptor of compound and protein. Therefore, for two different compound fingerprints and two protein numerical descriptors, we constructed four matrices with dimensions (2.146 × 3.332) by (166 + 20) for MACCS + AAC, (166 + 400) for MACCS + dipeptide, (881 + 20) for PubChem + AAC, and (881 + 400) for PubChem + dipeptide. The information of interactions between compounds and proteins is considered as a positive class, whereas unknown interactions are considered as a negative class. As the number of samples in the negative class is significantly large (number of compounds multiplies the number of proteins), we randomly selected 7.216 samples for the negative class, the same as the number of positive samples. We determined positive and negative class interactions as classes 1 and 0, respectively.
Wijaya et al. [11] identified 94 significant compounds associated with twelve efficacy groups, and 28 of them were validated by published literature. In this case, the efficacy refers to broad disease classes which are as follows: blood and lymph diseases (E1), cancers (E2), the digestive system (E3), female-specific diseases (E4), the heart and blood vessels (E5), male-specific diseases (E6), muscle and bone (E7), nutritional and metabolic diseases (E8), respiratory diseases (E9), skin and connective tissue (E10), the urinary system (E11), and mental and behavioral disorders (E12). We considered those 94 compounds as test data in this study. Table 2 shows the number of candidate compounds for each efficacy. We transformed the compounds into fingerprints according to the best results we obtained.
Table 2.
The number of compounds for predicting target proteins. All data are classified by efficacies, and some compounds are related to one or more efficacy groups.
3.2. Prediction Performance
We applied the R packages named e1071 ver. 1.7–4 to implement the SVM method [39] and randomForest ver.4.6–14 to implement random forest (https://cran.r-project.org/web/packages/randomForest/, accessed on 9 August 2020). The optimal parameters used in the model generations were obtained by utilizing best.tune and tuneRF functions for SVM and random forest, respectively. In the SVM, the regulation parameter C depends on numerical protein descriptors. In the case of AACs, C is equal to 1, whereas C is equal to 1000 in dipeptide. The values of datasets 1–4 are 0.00763, 0.00177, 0.00437 and 0.00078, respectively. In random forest, the appropriate number of trees for datasets 1 and 3 is the same, 1000. Additionally, the ntree values for datasets 2 and 4 are 2000 and 500, respectively. The values for dataset 2 and 4 are the same, i.e., 10, whereas those for datasets 1 and 2 are 6 and 15, respectively.
Table 3 shows the prediction performance for each type of dataset and each model. Representation of amino acid sequences using AAC descriptor in datasets 1 and dataset 3 obtains better accuracy compared to dipeptide descriptor on both classifiers and compound fingerprints. Furthermore, if we compare the performance of random forest and support vector machine classifiers, the classification accuracy of random forest using AAC descriptor is better than SVM with both kernels. In the case of fingerprints that are used to represent the compounds, MACCS obtains slightly better classification results than PubChem features. One of the reasons for the poor classification results on the dataset using the dipeptide descriptor is the number of features produced by the method. Dipeptide makes 400 features, causing the number of compound–protein features representing the input data to increase. Many features have zero values and affect the resulting model. It is very challenging to determine the most appropriate features because machine learning methods generally rely on feature engineering [40]. This can also be observed in datasets 2 and 4 between MACCS and PubChem fingerprints; when the number of features increases, this also reduces the resulting accuracy. Since this represents sufficiently high performance, the model can be applied to predict interactions between the Jamu compounds and target proteins.
Table 3.
The evaluation of generated models.
3.3. Prediction Results
In order to predict interactions between compounds and target proteins, the classification model was taken from the models that obtained the best classification results. Additionally, a testing dataset was constructed to match the dataset that achieved the best classification result. In this case, we utilized MACCS fingerprint to represent Jamu compounds, AAC descriptor to represent amino acid sequences, and random forest as a classifier. Since we focused on whether compounds bind to target proteins, we created a matrix containing all combinations of candidate compounds of Jamu formulas and target proteins as shown in Figure 2. Then, the prediction model was applied to predict whether compound and protein have an interaction or not. We accepted compound–protein interactions as true interactions when their classification probability was greater than 0.85. Not all candidate compounds identified in the work of Wijaya et al. have interactions with one or more proteins that were utilized in the current experiment. Here, we predicted 168 compound–protein interactions of Jamu formulas, involving 68 candidate compounds. Moreover, the professional doctors validated the predicted compound–protein interactions by comparing the efficacy of predicted compounds and the relations of the targeted proteins with diseases, as shown in Figure 3. Based on the current results, interactions involving 27 compounds can be validated, and those compounds belong to seven efficacy groups. Table 4 summarizes predicted compound–protein interactions by Jamu formulas that have been validated by professional doctors, and all of them are presented under respective efficacies. We also discovered a protein is targeted by many compounds and a compound has interaction with many target proteins. For instance, P02768, known as human serum albumin (HSA), is targeted by caffeic acid, diacetoxy-6-gingerdiol, gallic acid, luteolin, quercitrin, tricin, and ursolic acid. In addition, ursolic acid targets Q92887, Q9NPD5, Q9Y6L6, P08185, and P02768. Further investigation of the predicted compound–protein interactions was also done by finding supporting evidence from published literature, such as HSA being targeted by luteolin [41]. This result indicates that there are some compounds that might be considered as drugs in herbs. This also implies that the prediction model performs well and proteins that are not confirmed yet by any evidence can be candidates to have a relation with the corresponding efficacy group.
Table 4.
Predicted compound–protein interactions by Jamu formulas. Compound ID is an identifier taken from PubChem CID (https://pubchem.ncbi.nlm.nih.gov, accessed on 20 August 2021) and KNApSAcK ID (http://kanaya.naist.jp/KNApSAcK_Family/, accessed on 20 August 2021). If the Compound ID cannot be found in PubChem or KNApSAcK databases, we assigned N/A.
4. Conclusions and Future Works
We constructed classification–prediction models that predict the interactions between compounds and target proteins using a machine learning approach. The model was created by utilizing compound–protein interaction data obtained from open access databases, and the data were represented by a combination of fingerprint and amino acid sequences. The results showed very good prediction performances, around 90% when the compounds were transformed to MACCS fingerprint, amino acid sequences were transformed to AAC descriptor, and random forest was chosen as a classifier. In addition, some target proteins were predicted from potential compounds of Jamu formulas using the best model obtained in the previous step. By comparing the efficacy of predicted compounds and the relations of the targeted proteins with diseases, we found that some compounds might be considered as drug candidates. There are 27 compounds that can be validated by professional doctors, and those compounds belong to seven efficacy groups. This study is not only determines candidate drugs but also gives a better understanding of Jamu medicine at the omics level. Moreover, further validation of the results of this study can be performed by docking simulation between predicted compound–protein interactions or through in vivo and in vitro validation studies in the laboratory. We can also explore the supporting chemical or biological characteristics in predicted interactions, such as the similarity between the target compound and the known ligands of the predicted protein.
Author Contributions
Conceptualization, S.H.W. and M.A.-U.-A.; data curation, S.H.W.; formal analysis, S.H.W. and F.M.A.; funding acquisition, S.K.; investigation, M.H. and N.O.; methodology, S.H.W. and M.A.-U.-A.; supervision, I.B., S.K. and M.A.-U.-A.; writing—original draft, S.H.W.; writing—review and editing, M.A.-U.-A. All authors have read and agreed to the published version of the manuscript.
Funding
This work was supported by the World Class Professor Program Scheme A of the Ministry of Research, Technology and Higher Education of Indonesia and NAIST Big Data and Interdisciplinary Projects, Japan, and partially supported by the Ministry of Education, Culture, Sports, Science, and Technology of Japan (16K07223 and 17K00406).
Data Availability Statement
Data used in this study were collected from previous studies and open access databases. Data are available from Computational Systems Biology Laboratory, NAIST, and Department of Computer Science of IPB University for researchers who meet the criteria (contact via correspondence authors).
Acknowledgments
We thank Husnawati and Nurida Dessalma Syahrania for validating predicted compound–protein interactions.
Conflicts of Interest
The authors declare no conflict of interest. The funders had no role in the design of the study; in the collection, analyses, or interpretation of data; in the writing of the manuscript; or in the decision to publish the results.
References
- Harvey, A.L. Natural products in drug discovery. Drug Discov. Today 2008, 13, 894–901. [Google Scholar] [CrossRef] [PubMed]
- Mu, C.; Sheng, Y.; Wang, Q.; Amin, A.; Li, X.; Xie, Y. Potential compound from herbal food of Rhizoma Polygonati for treatment of COVID-19 analyzed by network pharmacology: Viral and cancer signaling mechanisms. J. Funct. Foods 2021, 77, 104149. [Google Scholar] [CrossRef]
- Chen, W.; Lim, C.E.D.; Kang, H.-J.; Liu, J. Chinese herbal medicines for the treatment of type A H1N1 influenza: A systematic review of randomized controlled trials. PLoS ONE 2011, 6, e028093. [Google Scholar] [CrossRef] [PubMed] [Green Version]
- Safarzadeh, E.; Shotorbani, S.S.; Baradaran, B. Herbal medicine as inducers of apoptosis in cancer treatment. Adv. Pharm. Bull. 2014, 4, 421–427. [Google Scholar] [CrossRef]
- Schippmann, U.; Leaman, D.J.; Cunningham, A.B. Impact of cultivation and gathering of medicinal plants on biodiversity: Global trends and issues. Biodivers. Ecosyst. Approach Agric. For. Fish. 2002, 1–21. [Google Scholar] [CrossRef]
- Schippmann, U.; Leaman, D.; Cunningham, A. A comparison of cultivation and wild collection of medicinal and aromatic plants under sustainability aspects. In Medicinal and Aromatic Plants; Springer: Dordrecht, The Netherlands, 2006; pp. 75–95. ISBN 9783540563914. [Google Scholar]
- Hanafi, M.; Nina, A.; Fadia, Z.; Nurbaiti, N. Indonesian Country Report on Traditional Medicine; CSIR: New Delhi, India, 2006. [Google Scholar]
- Furnham, A. Why do people choose and use complementary therapies. In Complementary Medicine: An Objective Appraisal; Ernst, E., Ed.; Butterworth-Heinemann: Oxford, UK, 1996; pp. 71–88. [Google Scholar]
- Ernst, E. Herbal medicines put into context: Their use entails risks, but probably fewer than with synthetic drugs. BMJ Br. Med. J. 2003, 327, 881. [Google Scholar] [CrossRef]
- Mahadevan, S.; Shah, S.L.; Marrie, T.J.; Slupsky, C.M. Analysis of metabolomic data using support vector machines. Anal. Chem. 2008, 80, 7562–7570. [Google Scholar] [CrossRef]
- Wijaya, S.H.; Batubara, I.; Nishioka, T.; Altaf-Ul-Amin, M.; Kanaya, S. Metabolomic studies of Indonesian Jamu medicines: Prediction of Jamu efficacy and identification of important metabolites. Mol. Inform. 2017, 36, 1700050. [Google Scholar] [CrossRef] [PubMed]
- Nasution, A.K.; Wijaya, S.H.; Kusuma, W.A. Prediction of drug-target interaction on Jamu formulas using machine learning approaches. In Proceedings of the ICACSIS 2019: 11th International Conference on Advanced Computer Science and Information Systems, Nusa Dua, Indonesia, 12–13 October 2019; pp. 169–174. [Google Scholar] [CrossRef]
- Kanehisa, M.; Goto, S. KEGG: Kyoto encyclopedia of genes and genomes. Nucleic Acids Res. 2000, 28, 27–30. [Google Scholar] [CrossRef]
- Law, V.; Knox, C.; Djoumbou, Y.; Jewison, T.; Guo, A.C.; Liu, Y.; MacIejewski, A.; Arndt, D.; Wilson, M.; Neveu, V.; et al. DrugBank 4.0: Shedding new light on drug metabolism. Nucleic Acids Res. 2014, 42, 1091–1097. [Google Scholar] [CrossRef] [PubMed] [Green Version]
- Afendi, F.M.; Okada, T.; Yamazaki, M.; Hirai-Morita, A.; Nakamura, Y.; Nakamura, K.; Ikeda, S.; Takahashi, H.; Altaf-Ul-Amin, M.; Darusman, L.K.; et al. KNApSAcK family databases: Integrated metabolite-plant species databases for multifaceted plant research. Plant Cell Physiol. 2012, 53, e1. [Google Scholar] [CrossRef] [Green Version]
- Bateman, A.; Martin, M.J.; O’Donovan, C.; Magrane, M.; Apweiler, R.; Alpi, E.; Antunes, R.; Arganiska, J.; Bely, B.; Bingley, M.; et al. UniProt: A hub for protein information. Nucleic Acids Res. 2015, 43, D204–D212. [Google Scholar] [CrossRef]
- Hamosh, A.; Scott, A.F.; Amberger, J.S.; Bocchini, C.A.; McKusick, V.A. Online mendelian inheritance in man (OMIM), a knowledgebase of human genes and genetic disorders. Nucleic Acids Res. 2005, 33, 514–517. [Google Scholar] [CrossRef]
- Yamanishi, Y.; Araki, M.; Gutteridge, A.; Honda, W.; Kanehisa, M. Prediction of drug-target interaction networks from the integration of chemical and genomic spaces. Bioinformatics 2008, 24, 232–240. [Google Scholar] [CrossRef]
- Hattori, M.; Okuno, Y.; Goto, S.; Kanehisa, M. Development of a chemical structure comparison method for integrated analysis of chemical and genomic information in the metabolic pathways. J. Am. Chem. Soc. 2003, 125, 11853–11865. [Google Scholar] [CrossRef]
- Smith, T.F.; Waterman, M.S. Identification of common molecular subsequences. J. Mol. Biol. 1981, 147, 195–197. [Google Scholar] [CrossRef]
- Bleakley, K.; Yamanishi, Y. Supervised prediction of drug-target interactions using bipartite local models. Bioinformatics 2009, 25, 2397–2403. [Google Scholar] [CrossRef] [Green Version]
- Gunn, S.R. Support Vector Machines for Classification and Regression; University of Southampton: Southampton, UK, 1998; Volume 14. [Google Scholar]
- Bolton, E.E.; Wang, Y.; Thiessen, P.A.; Bryant, S.H. PubChem: Integrated platform of small molecules and biological activities. In Annual Reports in Computational Chemistry; Wheeler, R.A., Spellmeyer, D.C., Eds.; Elsevier: Amsterdam, The Netherlands, 2008; pp. 217–241. [Google Scholar]
- Gunther, S.; Kuhn, M.; Dunkel, M.; Campillos, M.; Senger, C.; Petsalaki, E.; Ahmed, J.; Urdiales, E.G.; Gewiess, A.; Jensen, L.J.; et al. SuperTarget and matador: Resources for exploring drug-target relationships. Nucleic Acids Res. 2008, 36, 919–922. [Google Scholar] [CrossRef]
- Wishart, D.S. DrugBank and its relevance to pharmacogenomics. Pharmacogenomics 2008, 9, 1155–1162. [Google Scholar] [CrossRef]
- Durant, J.L.; Leland, B.A.; Henry, D.R.; Nourse, J.G. Reoptimization of MDL keys for use in drug discovery. J. Chem. Inf. Comput. Sci. 2002, 42, 1273–1280. [Google Scholar] [CrossRef] [Green Version]
- Yap, C.W. PaDEL-descriptor: An open source software to calculate molecular descriptors and fingerprints. J. Comput. Chem. 2011, 32, 1466–1474. [Google Scholar] [CrossRef]
- Xiao, N.; Cao, D.S.; Zhu, M.F.; Xu, Q.S. Protr/ProtrWeb: R package and web server for generating various numerical representation schemes of protein sequences. Bioinformatics 2015, 31, 1857–1859. [Google Scholar] [CrossRef] [Green Version]
- Vapnik, V. Statistical Learning Theory (Adaptive and Cognitive Dynamic Systems: Signal Processing, Learning, Communications and Control); John Wiley & Sons: Hoboken, NJ, USA, 1998; pp. 1–740. [Google Scholar]
- Hussain, M.; Wajid, S.K.; Elzaart, A.; Berbar, M. A comparison of SVM kernel functions for breast cancer detection. In Proceedings of the 2011 8th International Conference on Computer Graphics, Imaging and Visualization (CGIV 2011), Singapore, 17–19 August 2011; pp. 145–150. [Google Scholar]
- Breiman, L. Random forests. Mach. Learn. 2001, 45, 5–32. [Google Scholar] [CrossRef] [Green Version]
- Díaz-Uriarte, R.; De Andres, S.A. Gene selection and classification of microarray data using random forest. BMC Bioinform. 2006, 7, 3. [Google Scholar] [CrossRef] [Green Version]
- Jiang, R.; Tang, W.; Wu, X.; Fu, W. A random forest approach to the detection of epistatic interactions in case-control studies. BMC Bioinform. 2009, 10, S65. [Google Scholar] [CrossRef] [Green Version]
- Duda, R.O.; Hart, P.E.; Stork, D.G. Pattern Classification; John Wiley & Sons: Hoboken, NJ, USA, 2012. [Google Scholar]
- Deng, H.; Runger, G. Gene selection with guided regularized random forest. Pattern Recognit. 2013, 46, 3483–3489. [Google Scholar] [CrossRef] [Green Version]
- Zhu, W.; Zeng, N.; Wang, N. Sensitivity, specificity, accuracy, associated confidence interval and ROC analysis with practical SAS® implementations. In Proceedings of the NESUG: Health Care and Life Sciences, Baltimore, MA, USA, 14–17 November 2010; pp. 1–9. [Google Scholar]
- Wijaya, S.H.; Husnawati, H.; Afendi, F.M.; Batubara, I.; Darusman, L.K.; Altaf-Ul-Amin, M.; Sato, T.; Ono, N.; Sugiura, T.; Kanaya, S. Supervised clustering based on DPClusO: Prediction of plant-disease relations using Jamu formulas of KNApSAcK database. Biomed Res. Int. 2014, 2014, 831751. [Google Scholar] [CrossRef] [Green Version]
- Dong, J.; Cao, D.S.; Miao, H.Y.; Liu, S.; Deng, B.C.; Yun, Y.H.; Wang, N.N.; Lu, A.P.; Zeng, W.B.; Chen, A.F. ChemDes: An integrated web-based platform for molecular descriptor and fingerprint computation. J. Cheminform. 2015, 7, 60. [Google Scholar] [CrossRef] [Green Version]
- Meyer, D.; Dimitriadou, E.; Hornik, K.; Weingessel, A. e1071: Misc Functions of the Department of Statistics (e1071); R Package Version 1(3); TU Wien: Vienna, Austria, 2014; pp. 1–62. [Google Scholar]
- Yang, S.; Zhu, F.; Ling, X.; Liu, Q.; Zhao, P. Intelligent health care: Applications of deep learning in computational medicine. Front. Genet. 2021, 12, 607471. [Google Scholar] [CrossRef]
- Jurasekova, Z.; Marconi, G.; Sanchez-Cortes, S.; Torreggiani, A. Spectroscopic and molecular modeling studies on the binding of the flavonoid luteolin and human serum albumin. Biopolymers 2009, 91, 917–927. [Google Scholar] [CrossRef]

Publisher’s Note: MDPI stays neutral with regard to jurisdictional claims in published maps and institutional affiliations. |
© 2021 by the authors. Licensee MDPI, Basel, Switzerland. This article is an open access article distributed under the terms and conditions of the Creative Commons Attribution (CC BY) license (https://creativecommons.org/licenses/by/4.0/).