Abstract
Legumes, including lentil, are a valuable source of carbohydrates, fiber, protein and vitamins and minerals. Their nutritional characteristics have been associated with a reduction in the incidence of various cancers, HDL cholesterol, type 2 diabetes and heart disease. Among these quality parameters, lectins have been associated with reducing certain forms of cancer, activating innate defense mechanisms and managing obesity. Protease inhibitors such as trypsin and chymotrypsin inhibitors have been demonstrated to reduce the incidence of certain cancers and demonstrate potent anti-inflammatory properties. Angiotensin I-converting enzyme (ACE) inhibitor has been associated with a reduction in hypertension. Therefore, legumes, including lentils, should be part of our daily food intake. However, high temperatures at the terminal stage is a major abiotic constraint leading to a reduction in lentil yield and seed quality. Thus, the selection of heat-tolerant genotypes is essential to identifying the potential for high yields with stable performance. To select lentil genotypes, an experiment was conducted with 60 genotypes including local landraces, advanced breeding lines, commercial varieties and exotic germplasm under stress and non-stress conditions from 2019 to 2020. This study was followed by a subset study involving screening based on a few physicochemical parameters and reproductive traits along with field performances. Different tolerance indices (i.e., stress susceptible index (SSI), relative heat index (RHI), tolerance (TOL), mean productivity (MP), stress tolerance index (STI), geometric mean productivity (GMP), yield index (YI), yield stability index (YSI), heat-resistance index (HRI), modified stress-tolerance index (MSTI), abiotic tolerance index (ATI) and stress susceptibility percentage (SSPI)) were used for the selection of the genotypes along with field performance. Biplot analysis was further performed for choosing the most suitable indices. Based on principal components analysis, the GMP, MP, RRI, STI, YI, YSI, ATI and MSTI indices were identified as the most reliable stress indicators, and these indicators might be used for distinguishing heat-tolerant genotypes. Based on the stress indices, the genotypes BLX 05002-3, BLX 10002-20, LRIL-21-1-1-1-1, LRIL-21-1-1-1-1-6 and BLX 09015 were selected as the most stable and heat-tolerant genotypes. In contrast, the genotypes LG 198, Bagura Local, BLX 0200-08-4, RL-12-178, Maitree, 91517 and BLX 11014-8 were selected as the most heat sensitive. Data also exhibited an average yield reduction of 59% due to heat stress on the lentils. Moreover, eight heat-tolerant (HT) genotypes (BLX 09015, PRECOZ, LRL-21-112-1-1-1-1-6, BLX 05002-3, LR-9-25, BLX 05002-6, BARI Masur-8 and RL-12-181), and two heat-susceptible (HS) genotypes (BLX 12009-6, and LG 198) were selected from the screened genotypes and subjected to further analysis by growing them in the following year under similar conditions to investigate the mechanisms associated with heat tolerance. Comparative studies on reproductive function and physiochemical traits revealed significantly higher pollen viability, proline accumulation, relative water content, chlorophyll concentration and a lower membrane stability index in HT genotypes under heat stress. Therefore, these heat-tolerant genotypes could be used as the parents in the hybridization program for achieving heat-tolerant transgressive segregation.
1. Introduction
Lentil is a prehistorically domesticated crop and is one of the legumes consumed for food globally [1]. Worldwide, lentil production is 6.54 million tons with a cultivated area of 5 million hectares and an average yield of 1305 kg ha−1 [2]. The central origin of lentil is Central Asia, and a major share of production comes from Asia [2]. It is a major winter food legume in Bangladesh based on consumer preference, although grass pea ranks in the first position due to its area coverage and production [3]. Low temperatures are essential for lentil vegetative growth, but warm temperatures are required at the maturity stage. However, 18–30 °C has been reported as the optimum temperature for its ideal growth and crop production [4,5].
In Bangladesh, the lentil-sowing date is delayed due to late harvesting of the preceding crop, such as late sown Aman rice in the north-western part of Bangladesh, and early vegetable cultivation is increasing in the western part of Bangladesh. In most cultivated areas, the lentil reproductive stage, especially the grain-filling stage, suffers adversely from elevated temperatures [6]. Generally, crop-growth stages such as germination, vegetative growth, dry-matter partitioning, reproductive organ development, reproductive processes [7,8] and grain filling [9], along with grain quality [10,11], are interrupted by stresses. However, among the various developmental process of the plant, the reproductive and grain-filling stages are more vulnerable to temperature stress in legume crops [12,13,14,15]. For instance, the temperature rising for a substantial period decreased the grain weight linearly. A temperature of 15–25 °C is optimum at the reproductive stage for legume crops, especially lentils [13], peas [14], and chickpeas [15]. Pollen sterility was recorded at over 32 °C at the reproductive stage in chickpeas [16] and lentils [17]. The greater sensitivity of the reproductive stage to heat stress compared to the vegetative stage is mainly attributed to damage to male components, which are severely impacted as a result of the disruption of developmental as well as functional aspects, such as sucrose and starch accumulation in pollen grains [18]. However, a global 28% yield loss of lentils was recorded due to abiotic constraints where as 13% yield reduction has been recorded due to heat stress, cold and frost in South Asia, 8% in Sub-Saharan Africa and 13% in CWANA [19].
A combined package of genetic improvement and cultural practices can help minimize the detrimental effects of various abiotic stresses on agricultural productivity [18]. Genetic improvement deals with the development of cultivars that perform better under stressful environments (high temperature, drought and salinity) leading to better economic yields [20]. However, screening cultivars under field conditions against heat involves significant challenges owing to interactions with various environmental factors but multiple screenable traits are available for successful selection [21], although the selection process is more expensive [22]. The cultivars or varieties identified through selection as tolerant are more durable, and form an eco-friendly variety-improvement process for increasing the production of any crop against adverse environmental effects. This is why this screening program based on stress and non-stress environments was undertaken to uncover selection criteria for the identification of tolerant sources from our existing local and foreign cultivars of lentils. For instance, exploiting stresses using heat or drought tolerance indices has been suggested by many researchers for the identification of stress-tolerant genotypes, comparing yield performances in chickpeas in stress and non-stress environments [23,24]. Likewise, several quantitative drought-tolerance indices, such as the stress-tolerance index (STI), mean productivity (MP), geometric mean productivity (GMP), harmonic mean (HARM), and stress tolerance (TOL), have been used widely for the evaluation of genotypes with better stress tolerances, such as drought-stress tolerance, in many crops [13,25,26,27]. Siahsar et al. [28] reported that STI, GMP and HARM were the best indices for the selection of lentil lines under drought stress. In addition, the adaptation mechanism of a genotype to terminal drought and heat stress is a desirable strategy to minimize the economic impact of climate change on agriculture [29,30,31]. Therefore, these tolerance indices were used for selecting the superior genotypes among the studied genotypes of lentils under heat stress conditions for future lentil-breeding programs.
2. Materials and Methods
2.1. Materials of the Study
A total of 60 lentil genotypes consisting of commercial varieties, local landraces, advanced breeding materials and foreign germplasms were collected from the world’s largest collection center, the International Centre for Agricultural Research in Dry Areas (ICARDA), to be used in this screening program (Table S1). Following further investigation related to reproductive function and physicochemical traits associated with heat mechanisms, a subset of eight heat-tolerant genotypes (HT), and two heat-susceptible genotypes (HS) were evaluated in the following year under a similar environment and management practice (Table S2).
2.2. Location and Prevailing Weather Conditions
This particular study was carried out at the research farm of PRC, BARI, Ishurdi, Pabna, Bangladesh. The daily maximum and minimum air temperature were recorded on the Zeal Maximum Minimum temperature scale under polythene shades and outside of the experiment to compare the raising temperature under the polythene shades and in control conditions during the crop season 2019–20 and 2020–21(Figure 1; Table S3). The rising temperature was recorded and the temperature under polythene shades was 3–4 °C higher compared to the non-stress condition during the whole crop cycle of the lentil plant (Figure 1).
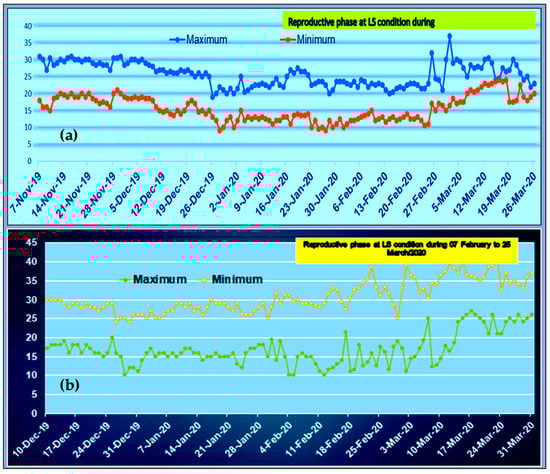
Figure 1.
(a) The daily maximum and minimum temperature at the OS experimental field of lentils during growing seasons; (b): The daily maximum and minimum temperature at the LS experimental field (covered by polythene shed) of lentils during growing seasons.
2.3. Experimental Treatments and Design
In the 1st year, all collected genotypes were sown under two conditions: (1) one set was sown at the optimum sowing time on 7 November (OS) when day/night temperatures were within 32/8 °C (Figure 1) at their reproductive phase, and (2) another set was sown on 10 December (LS), (one month delay compared to the optimum sowing time) and the LS experimental plot was covered by polythene shades for raising the temperature for the whole life cycle of the crop. All treatments were arranged in an alpha-lattice design and repeated three times. The unit plot was 2.5 m long with two rows; the row-to-row distance was 30 cm with continuous seed sowing by hand. Seeds were placed at 3–5 cm depth and covered by surface soil. To ensure optimum germination, post-irrigation was applied just after sowing both sets of seeds, because the initial moisture of the soil was not sufficient. In the next season’s evaluation involving a reduced set of genotypes, the experiments (OS, LS) were laid out in a randomized complete block design in tree replication with 8 rows, 4 m long. Excluding the border rows, only the inner rows were used for physiochemical data collection, while only the middle 4 rows were used for collecting the yield and yield-contributing traits.
2.4. Observations Recorded
2.4.1. First-Year Study
In the present study, consisting of sixty genotypes under OS and LS conditions, observations of several parameters were recorded. Days to flowering were counted from the sowing to the point at which 50% of flowers were visible in the plants on a plot basis. The canopy width of randomly selected plants was measured in cm in three positions of the planted rows. The height of five selected plants was measured in cm, representing the average height at the maturity stage. A hundred randomly selected seeds were weighed in grams on a plot basis. For the estimation of grain yield/plant, the whole plot yield divided by the total number of final plant stands was used, before storing the seeds at 8–10% moisture content. The straw yield was the average biomass yield of the five randomly selected plants after oven drying at 72 °C for three days.
The harvest index was counted using the following equation:
2.4.2. Estimation of Stress Tolerance indices
2.4.2.1. Estimations of Heat-Tolerance Indices
Heat tolerance indices (stress susceptible index (SSI), relative heat index (RHI), tolerance (TOL), mean productivity (MP), stress tolerance index (STI), geometric mean productivity (GMP), yield index (YI), yield stability index (YSI), heat-resistance index (HRI), modified stress-tolerance index (MSTI), abiotic tolerance index (ATI) and stress susceptibility percentage (SSPI)) were estimated for the selection of the heat-tolerant genotypes and these heat-tolerant indices were calculated using the MS Excel program following these formulas:
- Stress-susceptibility index [32]
- The relative heat index [33]
- Tolerance (TOL) = Yp − Ys [34]
- Mean productivity [35]
- Stress-tolerance index [36]
- Geometric mean productivity [37]
- Yield index [35]
- Yield-stability index [38]
- Heat-resistance index [39]
- Modified stress-tolerance index (MSTI) = K1STI, and where ki is the correlation coefficient
- Abiotic tolerance index [40]
- Stress-susceptibility percentage (SSPI) = [40]
where Yp, Ys, p and s indicate the yield under normal sowing, yield under late sowing for each genotype, and mean yield in normal and late sowing conditions for all genotypes, respectively. For screening heat-tolerant genotypes, a rank-sum (RS) was calculated using the following relationship [41]:
Rank sum (RS) = Rank mean (R) + Standard deviation of rank (SDR)
2.4.2.2. Estimations of Thermal Unit Indices
Different thermal unit indices, such as growing degree days (GDDs), helio-thermal units (HTU), pheno-thermal index (PTI) and heat-use efficiency (HUE), were calculated at the maturity stage according to Singh et al. [42]. GDDs were computed with 5 °C as the base temperature based on the daily mean temperature from the following equation:
where Tmax = maximum temperature, Tmin = minimum max min temperature and Tb = base temperature of lentil.
HTUs (degree-days hours) of successive growth phases were calculated based on GDD and sunshine hours using the following formula:
HTU (degree-days hours) = [GDD] × Duration of sunshine hours
The duration of sunshine hours per day of successive growth phases was calculated by the following equation:
PTI (degree-days day−1) was calculated using the following equation:
Heat-use efficiency (HUE) (kg ha degrees-day) was calculated with the help of the following equation:
2.4.3. Physicochemical and Reproductive Trait Study of Screened Lentil Genotypes
Some physiological traits, such as proline content, chlorophyll content, relative water content (%), membrane thermal stability index, and one reproductive trait, pollen viability (%), were studied in the following year for further analysis to assess the tolerance mechanism with the association of rising temperature, and methodology of the assessment of these physiochemical traits is described in brief as follows:
2.4.3.1. Chlorophyll Content (mg g−1 DW)
Before flowering, 0.1 g of fresh leaves from the control and stress treatment of each genotype were taken in an amber-colored bottle. Following this, 10 mL 80% acetone was mixed with the leaf sample and kept in a dark place for more than 24 h to dissolve the chlorophyll concentration following the procedure of Awasthi et al. [43]. After 24 h, the supernatant of leaves from the acetone solution was run in a spectrophotometer at 645 and 663 nm against 80% acetone as black. Total chlorophyll was then measured according to the following formula [44]:
where A = absorbance at a specific wavelength of the spectrophotometer; V = final volume of chlorophyll extract in 80% acetone; W = fresh weight of tissue extracted
mg Total chl/g tissue = Chl a + Chl b
2.4.3.2. Proline Detection (mg g−1)
Proline content was detected following the ninhydrin method according to the procedure described by Bates et al. [45], which follows:
2.4.3.3. Relative Water Content (RLWC)
Relative leaf water content (RLWC) was determined following the methods of Barrs and Weatherley [46]. Before flowering, all fresh leaf samples from each control and stress genotype were collected and weighed (fresh wt). Leaves were then submerged in distilled water for 8 h in a Petri dish. After eight hours’ soaking, the water was removed from the Petri dish and the leaf samples were smoothed and surface dried with filter papers and weighed (turgid wt), then the leaf samples were oven-dried for up to 72 h at 70 °C and reweighed (dry wt). Finally, RLWC was calculated using the following equation:
2.4.3.4. Membrane Thermostability Index (MSI)
The leaf membrane thermostability index (MSI) was measured following the protocol of Premachandra et al. [47] as modified by Sainnan [48]. For determination of leaf MSI, 2 mg fresh leaf of each genotype from control and stress and 20 mL double distilled water were taken in a Falcon tube. The Falcon tube was then placed in the water bath for boiling at 40 °C for 30 min. After that, the electrical conductivity (C1) of this boiling sample was measured by an electrical conductivity meter. Consequently, another sample of leaves of the same genotype was placed in a water bath for boiling at 100 °C for 10 min and electrical conductivity was recorded in the same way (C2). Finally, MSI was estimated with the following equation:
MSI = {1 − (C1/C2)}∗100
2.4.3.5. Pollen Viability
During the days to flowering of each control and stress genotype, pollen grains were collected from opened flowers on the same days. The collected pollen grains were polled, and the section was prepared based on the size and shape of the pollen and stained with 0.5% acetocarmine/Alexander stain at 10 min [49]. The pollen grains were collected from flowers that opened on the same day. About 200 pollen grains were tested for pollen viability, and 5–10 microscopic field pictures were taken by stereo-microscope [50]. The collected pollen grains from the flowers were pooled and tested for their viability. To select viable pollen grains, the selection was made based on the size and shape (triangular or spherical) of the pollen, and the concentration of the stain taken up by the pollen [50].
2.5. Statistical Analysis
An analysis of variance of different yield and yield-contributing traits, principal component analysis (PCA), and a correlation study were analyzed by a statistical software program [51]. Additionally, a multicollinearity test was performed to discover the most suitable and powerful explanatory indices against the stress-tolerance genotypes using the same statistical software program [51].
3. Results
3.1. Screening Based on Field Performance
Sixty lentil genotypes were screened based on the field performance of different phenological and yield-contributing traits, such as days to flowering, plant height, canopy width, 100-seed weight, straw yield per plant, grain yield per plant and harvest index. Observations showed that in late-sown environments, all genotypes flowered earlier, ranging from 46 to 67, except genotype 7 (check variety BARI Masur-9) compared with optimum-sown conditions (range 36–73 days for flowering) (Table 1). Among all the genotypes, 55, 59, 29, 7, 8, 9, 53, 54 and 58 flowered early (45–52 days) under stress conditions, while genotypes 57, 47, 45, 46, 44, 40, 16, 48, 15, 23, and 41 flowered late (67–62 days). The average plant height of all genotypes was found to be shorter in optimum-sown (49.02 cm) compared to late-sown conditions (52.11 cm) except genotypes 8, 29, 32, 37, 41, 43, and 57. Canopy width was found to be narrow (28.18 cm) in late-sown compared to optimum-sown conditions (31.76 cm) in all genotypes except genotypes 10 and 11.

Table 1.
Phenology of 60 lentil genotypes under optimum- and late-sown conditions. The mean ± SE for each genotype in both conditions was calculated from three replications.
The hundred-seed weight (HSW) in OS plants ranged from 1.69–3.34 g, while LS plants ranged from 1.47–3.01 g (Table 2). In a stress environment, genotypes 16, 52, 59, 48, 58 and 41 produced the largest seeds (HSW 3.011–2.426 g) while genotypes 44, 11, 4, 1, 25 and 22 produced the lightest seeds (HSW 1.528–1.685 g) among all the genotypes. Grain weight per plant (GYP) in OS ranged from 0.68–3.57 g plant−1. In contrast, LS plants ranged from 0.22–1.37 g plant−1 (Table 2). In LS conditions, the genotypes 58, 54, 59, 29, 48, 9 and 8 produced the maximum GYP (1.369–0.940 g plant−1) while the genotypes 44, 57, 24, 47, 46 and 13 produced the minimum GYP (0.222–0.362 g plant−1) (Table 2). Straw yield per plant (SYP) in OS ranged from 1.54–4.99 g plant−1 while in LS plants this ranged from 0.83–3.14 g plant−1. In heat-stress conditions, genotypes 48, 57, 16, 22, 2 and 36 produced the maximum SYP (3.137–1.965 g plant−1) while genotypes 52, 8, 3, 43 and 7 produced the lowest SYP (0.828–1.031 g plant−1). The average harvest index (HI) ranged from 18.86–53.27% estimated in OS plants to 10.25–52.26% in LS plants. Among the genotypes 8 (52.26%), 54 (48.77%), 52 (48.28%), 29 (46.84%), 53 (45.48%) and 43 (41.92) gave the maximum HI, while the genotypes 57, 44, 46, 24, 25 and 40 showed the lowest, with 10.25%, 15%, 15.96%, 16.65%, 18.07% and 18.75% HI, respectively, in a heat-stress environment (Table 2).
Table 2.
Yield and yield-contributing traits of 60 lentil genotypes under optimum and late sown. The mean ± SE for each genotype in both conditions was calculated from three replications.
3.2. Reduction in Grain Size and Grain Yield under Late-Sown Heat-Stress Conditions
A wide range of variations in grain size and grain yield was revealed among the studied genotypes in both stress and non-stress environments. In LS plants, gain-size reductions of 1–45% were recorded. The maximum grain-size reduction of 45% was observed in genotype 43; the second-highest, 43%, in genotype 49; and the lowest reduction of 1% was observed in genotypes 12, 27 and 38 (Figure 2). Grain-yield reductions of 22–82% due to heat stress were recorded, and genotypes 57, 45, 40, 16, 14 and 44 showed maximum 82, 80, 79, 74, 73 and 72% grain-yield reductions compared to those under OS conditions. The minimum yield reduction of 22% was recorded from genotype 54 followed by genotypes 48, 31, 58 and 29 and the yield loss was estimated at 30, 35, 38 and 39%, respectively.
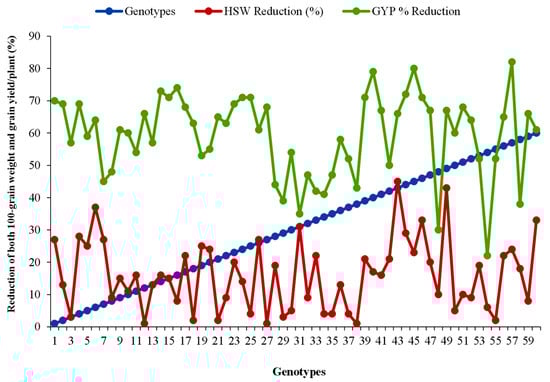
Figure 2.
% Reduction in grain size and yield of 60 lentil genotypes in heat-stress conditions. HSW, 100-seed weight; GYP, grain yield/plant.
3.3. Ranking of Genotypes Based on Heat-Stress-Tolerance Indices
Significant yield variations were observed among all genotypes due to the terminal heat stress (Table 3 and Table 4).
Table 3.
Ranks (R), Ranks mean (MR) and standard deviation of ranks (SDR) of several heat-tolerance indicators (Yp, Ys, TOL, SSI, RHI, MP, STI, GMP and YI) of 60 lentil genotypes.
Table 4.
Ranks (R), Ranks mean (MR) and standard deviation of ranks (SDR) of several heat-tolerance indicators (YSI, HRI, ATI, SSPI, K1STI and K2STI) of 60 lentil genotypes.
The minimum yield reduction was recorded in genotypes 54, 59, 58, 9, 8, 16 and 29 under stress and non-stress environments compared to the other genotypes in the same condition, which means these genotypes were treated as terminal heat-stress tolerant. However, the maximum yield reduction was observed in genotypes 44, 57, 13, 24, 47 and 46. The calculated stress-tolerance attributes (Table 3) indicated that the selection of stress-tolerance genotypes based on a single selection criterion was incongruous. For instance, according to the TOL and SSI, genotypes 54 and 48 were the most desirable heat tolerance genotypes. According to RHI, genotypes 54, 48, 31, 58 and 29 and MP genotypes 59, 16, 58, 9 and 15 were the more relatively heat tolerance genotypes, respectively. According to STI and GMP, genotypes 59, 58, 16, 9, 29, 54, 53 and 15 were the most heat tolerant, whereas genotypes 44, 13, 24, 47, 57 and 12 were the least tolerant genotypes relatively. Following YI, genotypes 58, 54, 59 and 29 were the most—and 44, 57, 13 and 24 the least—tolerant genotypes relatively (Table 3 and Table 4). Based on the YSI and HRI, genotypes 54, 58, 48, 29 and 31 were the most yield-stable genotypes over the stress and non-stress environments. According to ATI and SSPI, genotypes 59, 16, 15 and 9 were the most tolerant genotypes relatively for stress environments with a low fluctuation of yield compared to the non-stress-environment yield performance. According to the K1STI, genotypes 59, 16, 58, 9 and 15—and for K2STI, genotypes 59, 58, 54, 29 and 15—were the most tolerant genotypes relative to the other studied genotypes.
The above-estimated indices of heat tolerance indicated that, based on a single index, the selection of heat-tolerant genotypes was more contradictory. Different indices indicated different genotypes as heat tolerant. For the determination of the most desirable heat-tolerant genotypes according to all studied indices’ mean rank (MR), the standard deviation of ranks (SDR) and rank-sum (RS) were estimated (Table 3 and Table 4). With consideration of all the indices, genotypes 54 (RS =13.55), 29 (RS = 17.55) 58 (RS = 19.73) and 8 (RS = 23.09) were selected as the most heat-tolerant genotypes. In contrast, genotypes 44 (RS = 69.00), 24 (RS = 65.51), 47 (RS = 64.29), 13 (RS = 64.19), 57 (RS = 62.75) and 45 (RS = 61.08) were identified the most sensitive to heat-stress environments among all the studied genotypes.
3.4. Multicollinearity Test
A multicollinearity test was performed among the indices RHI, YI, YSI, HRI, K2STI, TOL, MP, STI, GMP, ATI, SSPI and K1STI (Figure 3). The results showed that the multicollinearity analysis varied from 67.37 to 21,242.66, and their variance inflation factor (VFI) values were >10. To find the more specific correlation among the indices, PCA was also performed.
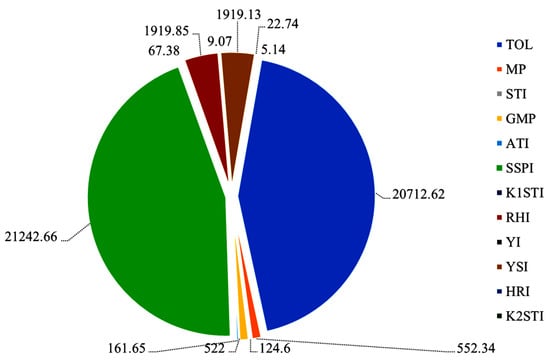
Figure 3.
Multicollinearity diagnosis of Pearson product correlation matrix for 12 indices with their variance inflation factor (VIF). stress-susceptibility index (SSI), relative heat index (RHI), tolerance (TOL), mean productivity (MP), stress-tolerance index (STI), geometric mean productivity (GMP), yield index (YI), yield-stability index (YSI), heat-resistance index (HRI), modified stress-tolerance index (MSTI: K1STI, K2STI), abiotic tolerance index (ATI) and stress susceptibility percentage (SSPI).
3.5. PCA Component Analysis Method
PCA is exploited as a “pattern-finding method” by plant breeders for completing cluster analyses [50]. The PCA method is more adventitious compared to cluster analysis and each statistic can be allocated to a single group only [51]. PCA1 and PCA2 are used for drawing a biplot that graphically represents the interrelationship among the different indices (Figure 4).
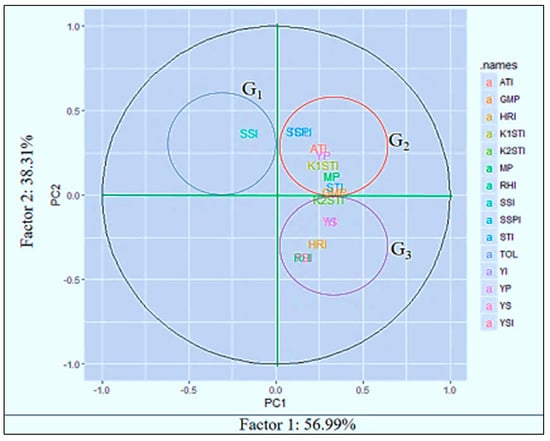
Figure 4.
Biplot for lentil genotypes and stress indices using the first two principal components. Note: stress-susceptibility index (SSI), relative heat index (RHI), tolerance (TOL), mean productivity (MP), stress-tolerance index (STI), geometric mean productivity (GMP), yield index (YI), yield-stability index (YSI), heat-resistance index (HRI), modified stress-tolerance index (MSTI), abiotic tolerance index (ATI) and stress-susceptibility percentage (SSPI).
The first two PCAs explained more than 95% of the total variations. The PCA1 and PCA2 categorized the indices into different groups. From these studies, SSI was categorized as group 1 (G1). The PC axes separated Yp, TOL, SSPI, ATI, K1STI, MP and GMP in group 2 (G2), and Ys, YSI, RHI, HRI, YI and K2STI in group 3 (G3). “High heat tolerance” should be considered in terms of yield stability in a heat-stress environment. The genotypes that perform their yield with low fluctuations under different stress environments can be considered “highly heat tolerant”.
From this study, HRI, K2STI, YI, and RHI might be used for screening “highly heat-tolerant” genotypes, as they have a strong association with the YSI (yield-stability index). In contrast, “heat-tolerance” should be considered based on acceptable yield performance under stress conditions and high-yield performance under normal environments and it not refer to the yield stability in both normal and stress environments. Thus, TOL, SSPI, ATI, K1STI, MP, STI and GMP might be considered tools for screening “heat-tolerant” genotypes as they have no relationship with YSI or their negative correlation. The path view of the biplot (Figure 5) represents a summary of the interrelationship among the heat indicators and also provides the importance of the indices, which is more or less emphasized for the identification of the individual index of the specific stress. Principal component analysis (PCA) showed that a significant positive correlation between grain yield in stress conditions with the TOL, SSPI, ATI, YP, K1STI, MP and GMP criteria; consequently, one can distinguish heat-tolerant genotypes with the same approach. Exploring the biplot diagram (Figure 4), genotypes 58, 59, 53, 54, 48, 31, 33, 28, 29, 19 and 8 were identified as tolerant and genotypes 9, 11, 14, 15, 16, 20, 22, 23, 24, 40, 44, 45, 47, 49, 56 and 57 were identified as sensitive to heat stress.
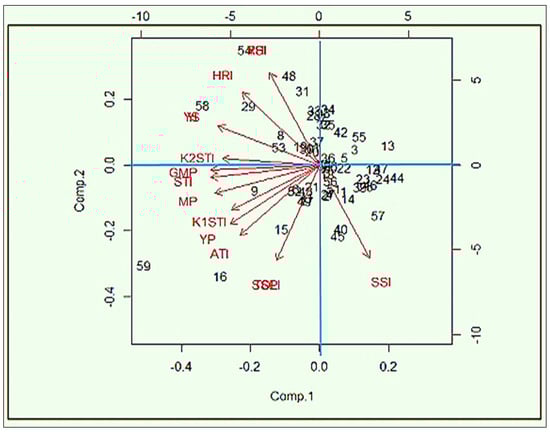
Figure 5.
Biplot of lentil genotype and stress indices based on the first and second components of heat-tolerant indices. Note: stress-susceptibility index (SSI), relative heat index (RHI), tolerance (TOL), mean productivity (MP), stress-tolerance index (STI), geometric mean productivity (GMP), yield index (YI), yield-stability index (YSI), heat-resistance index (HRI), modified stress-tolerance index (MSTI), abiotic tolerance index (ATI) and stress-susceptibility percentage (SSPI).
3.6. Correlation Study among the Stress Indices
A correlation among the study stress indices revealed that yield under a stress environment had a positive (r = 0.55) and significant (p ≤ 0.001) association with that of the normal environment (Table 5).
Table 5.
Correlation coefficients of yield with stress indices under stress and non-stress conditions in 60 lentil genotypes.
All stress indices had a positive and significant relationship with grain yield in the stress environment except SSI (r = −0.74, p ˂ 0.001), TOL (r = 0.03, p ˂ ns) and SSPI (r = 0.03, p ˂ ns) (Table 5). These results indicate GMP, MP, RHI, STI, YI, YSI, DI, ATI, K1STI and K2STI are the most significant and reliable selection indicators for the identification of stress-tolerant genotypes among the 60 genotypes of lentils studied.
3.7. Temperature Scenario and Thermal Unit Indices
The whole life cycle of a lentil is divided into different growth stages, such as seeding, vegetative, reproductive, and mature. The different thermal unit indices were measured at the maturity stage under optimum-sowing (OS), and late-sowing (LS) conditions (Table 6). The days to maturity of each genotype were greater in OS compared to LS condition. The days to maturity ranged from 93 to 119 days in OS, but in LS condition this ranged from 86–107 days. The yield performance of each genotype was also higher in the OS condition compared to the LS condition.
Table 6.
Different thermal unit indices of 60 lentil genotypes with their days to maturity (DM) and yield performance (kg ha−1).
The GDD value is the maximum of each genotype in the LS condition compared to the OS genotypes, except the genotypes 2 and 14. Genotypes 15, 16, 18, 19, 37, 40, 45, 46, 51, 57 and 60 showed higher GDD in OS conditions. The received sunshine hours range was recorded at 6.21 to 6.48 h day−1 in OS, whereas in the LS condition this range was recorded from 5.90 to 6.15 h day−1. The helio-thermal units (HTU) of each genotype were recorded at a maximum in the LS condition compared to the OS except for some genotypes, and ranged was 480.43 to 660.51 in OS. These were recorded from 452.53 to 593.11 degree-day hours in LS condition. The pheno-thermal index (PTI) was recorded from 0.68 to 0.95 degree-day day−1 in OS and ranged from 0.82 to 0.97 degree-day day−1 in LS condition. The heat-use efficiency (HUE) of all genotypes under the OS condition was more or less similar (ranging from 41.42 to 42.82) but significant variance was recorded in LS condition and ranged from 5.72 to 30.26. The minimum HUE was recorded in the case of genotype 57, followed by genotypes 47, 46, 45 and 44. The maximum HUE (30.26) was recorded in genotype 33, followed by genotypes 29 (28.32), 59 (26.80), 58 (26.17), 9 (25.59) and 8 (25.44) with higher yield performance in OS and LS conditions.
3.8. Subset Study on HT and HS Genotypes
3.8.1. Chlorophyll Concentration (mmol g−1 DW)
There was no significant variation among the studied genotypes in Chl a, Chl b and total Chl content. However, a reduction in chlorophyll was shown among all genotypes due to heat-stress conditions (Table 7). Numerically, the maximum total chlorophyll concentration (2.90 mmol g−1) was observed in the genotypes BARI Masur-8 followed by the genotypes LRL-21-112-1-1-1-1-6 and BLX 12009-6 and the minimum chlorophyll content 1.61 was observed in the genotype BLX 09015 under the control condition. In heat-stress conditions, the minimum total chlorophyll content of 0.94 mmol g−1 was observed in the genotype PRECOZ and the maximum total chlorophyll content of 1.56 was recorded in the genotype BARI Masur-8.
Table 7.
Chlorophyll content with standard error of 10 screened lentil genotypes (eight HT and two HS) under OS and LS conditions during the 2020–2021 crop-growing season at PRC, BARI, Ishurdi, Pabna.
3.8.2. Proline Concentration (mg g−1)
Among the different environmental stress conditions, solutes, such as proline, are normally accumulated in large quantities in higher plants for mitigating stress conditions, such as heat and drought. In this present study, proline content increased significantly under the late-sowing condition compared to the control condition due to the terminal heat-stress environment among all genotypes except the susceptible genotype LG 198. The maximum proline accumulation was found in the heat-tolerant genotype LR-9-25 followed by BLX-05002-6 and BLX-05002-3 and the minimum proline content was recorded in the susceptible genotype BLX 12009-6 (Table 8).
Table 8.
Mean value of proline and relative water content (RWC) with increasing or reduction percentage of 10 selective genotypes under optimum- and late-sowing conditions 2020–2021 at PRC, Ishurdi, Pabna.
3.8.3. Relative Water Content (%)
Under the control environment, RWC ranged from 76.67% to 83.67%, which was statistically non-significant, but in the stress condition, significant variations of RWC were recorded among all genotypes. The maximum RWC was recorded in the case of the tolerant genotype BLX 09015, with the minimum reduction percentage (7.17%), followed by the tolerant genotype BLX 05002-6 (7.50% reduction) and LR-9-25 (7.53% reduction) (Table 8). The highest reduction percentage (27.31%) of RWC compared to the respective control was recorded in the susceptible genotype LG-198 and followed by a 22.91% reduction in another susceptible genotype, BLX 12009-6.
3.8.4. Membrane Thermostability Index (MSI)
The membrane thermostability index ranged from 12.00 to 15.53% among the genotypes in the OS condition, which increased from 41.89 to 95.70% due to heat stress in LS condition (Table 9).
Table 9.
Mean values of membrane thermostability index (MSI), and pollen viability with standard error and their reduction or increase in percent of 10 screened lentil genotypes (eight HT, and two HS) under OS and LS conditions during the 2020–2021 crop growing season at PRC, Ishurdi, Pabna.
The maximum membrane thermostability index (27.73%) was recorded in the susceptible genotype LG-198 with the highest increasing rate (95.70%) followed by another susceptible genotype, BLX 12009-6 (25.67% MSI), with the second-highest increasing rate (84.28%) under the LS condition. The minimum MSI (17.77%) was recorded in the heat-tolerant genotype LRL-21-112-1-1-1-1-6 and followed by the tolerant genotypes BLX 05002-6 (18.10% MSI) and BLX 09015 (18.3%).
3.8.5. Pollen Viability (%)
In the OS condition, the individual genotypes’ pollen viability ranged from 72.04 to 86.62%, which decreased by 3.34–21.60% in the terminal heat-stressed samples among all genotypes (Table 9). The maximum pollen viability reduction was recorded at 21.60% in the susceptible genotype LG-198 followed by 19.78% in another susceptive genotype, BLX 12009-6. The minimum pollen viability reduction of 3.34% was found in the heat-tolerant genotype BLX 09015 followed by the genotypes BLX 05002-6 (4.39%), LR-9-25 (4.71%), PRECOZ (7.45%) and BLX 05002-3 (7.50%).
4. Discussion
4.1. Screening Based on Stress Indices
In this present investigation, we imposed elevated temperatures on lentil genotypes by growing them one month later than the recommended date of sowing as well as covering late-sown experimental field with polythene shades, while a controlled plot was sown at the recommended sowing time for lentil crops. Creating high-temperature stress, delaying sowing, and covering the late-sown crops with polyethene shades is a worldwide recognized technique where the plants are grown in cooler weather to avoid high temperatures and drought stress during their reproductive development phase. However, twelve worldwide stress indices were used for the evaluation of these 60 lentil genotypes against high-temperature stress. Exploiting these indices indicated that the identification of heat-tolerant genotypes was more complex when based on a single index. Different indices indicated different genotypes as heat-tolerant; for instance, RHI and MP were found as suitable indices for identifying relatively more heat-tolerant genotypes, such as the genotypes 54, 48, 31, 58, and 29, and 59, 16, 9, and 15, respectively. However, the stress indices TOL and SSI were used for the selection of the most desirable heat-tolerant genotypes in this study, genotypes 54 and 48. On the other hand, the stress indices STI and GMP were used for screening the most heat tolerant and the least tolerant genotypes relatively, and selected the genotypes 59, 58, 16, 9, 29, 54, 53 and 15 as the most heat tolerant and 44, 13, 24, 47, 57 and 12 as the least relative tolerant genotypes. The index YI also indicated that the genotypes 58, 54, 59 and 29 were the most and 44, 57, 13 and 24 were the least tolerant genotypes relatively. On the other hand, TOl, ATI, SSPI and YI indices can be used for the selection of genotypes based on yield stability in the target environment [38]. For instance, Gavuzzi et al. [37] proposed YI as a significant positive index for discriminating genotypes by yield under stress conditions. Similar research findings were reported by Rosielle and Ramblin [35] and Fernanez [36]. They demonstrated that GPM is a powerful tool for separating genotypes by comparing with stress and non-stress environments. STI was used as a moderately heritable index for the selection of high-yielding genotypes in stress and non-stress conditions. Talebi et al. [52] reported that STI, GMP and MP indices could be capable of identifying high-yielding cultivars in both stress and non-stress environment. Puri et al. [53] reported that HTI, GMP and MP could be used as reliable selection criteria for terminal heat-tolerance spring-wheat genotypes in Nepal, whereas utilization of these stress indices for the selection of heat-tolerant genotypes in lentil is rare to date worldwide. From this study, we identified genotypes 44, 57, 13, 24, 47 and 46 as the maximum yield-reduction genotypes. However, genotypes 54, 59, 58, 9, 8, 16 and 29 were selected as yield-stable genotypes with a low fluctuation of yield loss under stress and non-stress environments compared to the other genotypes in the same condition. Considering the mean rank (MR), the standard deviation of ranks (SDR) and rank-sum (RS) of all studied indices to determine the most desirable heat-tolerant genotypes, the genotypes 54, 58 and 8 were selected as the most heat-tolerant genotypes. In contrast, genotypes 44, 24, 47, 13, 57 and 45 were selected as the most sensitive to heat stress environments among all the studied genotypes.
4.2. Screening Based On-Field Performance
Under field conditions, 60 lentil genotypes were sown one month later than the recommended sowing date and this late-sown experimental plot was covered by polythene shades to artificially create a high temperature. Another control experimental plot was sown at the recommended sowing date with the same genotypes, experimental design and management practices without polyethene shades. The temperature was always 3–40 C higher in LS experimental plots than in OS experimental plots. A very limited set of experiments using the late sowing of lentils covered by polyethene shades has been conducted under field conditions globally. To date, one experiment has been performed by Delahunty et al. [54] in Australia, using delayed sowing with polyethene shades, but sowing crops late than the recommended time has been used globally for screening high-temperature-tolerant genotypes of lentil [55] and chickpea [23,56,57] by Kumar et al. [57] and of mungbean by Sharma et al. [58].
In this present study, a significant detrimental effect of high temperature was revealed in the case of yield and all yield-contributing traits except on branches per plant in the LS environment. High temperature has a detrimental effect on growth and reproductive physiology due to lentil’s narrow gene pool [59]. Days to flowering and days to maturity in the LS environment were significantly reduced in all genotypes of lentil except genotype 7 (BARI Masur-9), which flowered late under LS conditions. Genotype 7 (BARI Masur-9) is a short-duration variety that has the capability to escape terminal heat stress. Krishnamurthy et al. [23] reported that high temperature stimulates the flowering and reduces the days to maturity in chickpea, which partially supports the present study in lentil. High temperatures increased the plant height in all genotypes of lentil in LS conditions compared with OS condition, except in genotypes 1, 8, 28, 29, 30, 32, 37, 43, 46 and 57, but reduced canopy width was recorded in the case of all genotypes in the LS environment except genotypes 10 and 11, which indicates that high temperatures enhance the longitudinal expansion of plant cells in lentil. Winter-loving legume pulses are especially sensitive to an elevated temperature at their flowering and pod-development stages. At these stages, if >30 °C temperature was continued for a few days serious yield loss was reported, owing to flower drop and pod abortion [55,60,61,62]. Despite this, this sensitivity to high temperature varies from genotype to genotype. In this investigation, the temperature during the reproduction stage of lentils in the LS environment was above the threshold level (average maximum temperature was >33 °C, Appendix III), which indicated that a suitable environment was created in the LS environment for screening high-temperature-tolerant lentil genotypes. A similar environmental condition was also created by Kumar et al. [57] in lentils and by Krishnamurthy et al. [23] in chickpeas for the field screening of high-temperature-tolerant genotypes. Filled pods per plant were significantly decreased in the LS condition compared with the OS condition in the case of all genotypes in this present study but the decreasing rate of filled pods plant−1 was comparative low in the genotypes 58, 10, 35, 2, 4 and 18. Unfilled pods per plant were significantly higher in the OS condition compared to the LS condition in all studied genotypes; this occurred due to maximum pod abortion in the LS environmental condition as a result of the detrimental effects of high temperature in the lentil’s reproductive stage. Early studies showed that reproductive growth is more penetrating and causes various effects, such as the depletion of buds, flowers, fruits, pods and seeds, resulting in marked reductions in yield potential [63,64]. A significant reduction in grain size and grain yield was observed among the studied genotypes in LS compared with OS environment. On average, 16% gain-size deduction and 59% grain-yield reduction were found among the genotypes in the present investigation. Genotypes 57, 45, 40, 16, 14 and 44 were identified as the most heat-susceptible genotypes and the grain-yield reduction was recorded to be 82, 80, 79, 74, 73 and 72%, respectively, compared to the OS condition. A similar study was performed by Noureddine et al. [65] in lentil and 69.65% yield reduction was observed for heat stress only, and an 83% grain yield loss for a combined heat- and drought-stress environment. Kumar et al. [57] also recorded an average 2.4% to 67.2% grain-size reduction in late sowing conditions over the normal sown conditions in lentils. In our present investigation, grain-size reduction was associated with a reduction in the seed-filling rate and duration. Earlier reports indicated that a decrease in grain weight in response to heat or drought stress during early grain filling may be assigned primarily to a decline in the number of endosperm cells [66]; whereas during later grain filling, to a disturbance of starch synthesis due to the decreased availability of assimilates for developing seeds [67] or direct inhibitory effects of these stresses on the synthesis of storage substances [68]. The seed development stage of all grain crops is a critical growth stage under heat or drought stress and heat stress affects the seed filling adversely by suppressing the transfer of essential assimilates, exacerbating low grain yields and poor grain quality [9]. Due to elevated heat stress, yield reduction was documented in many cultivated crops, including cereals (rice and wheat), pulses (e.g., chickpea, cowpea), and oil crops (mustard, canola) [69,70,71,72]. For every 1 °C increase in seasonal temperature, grain yield in rice was decreased by 4.1 to 10.0% [73]. Late sowing and temperatures over 28–30 °C caused 53–73% yield loss in wheat [74]. In sorghum, a 53% reduction of filled seed weight and a 51% reduction in seed size was recorded due to heat stress, which exacerbated yield loss [75]; in mustard 52% yield reduction was recorded at a high temperature of over 30 °C [76]. In common beans, 26–37% yield reduction was recorded compared to non-stress conditions [77].
4.3. PCA Component Analysis Method
PCA is exploited by plant breeders as a “pattern finding method” for completing cluster analysis [50]. The PCA method is more adventitious compared to cluster analysis and each statistic can be allocated to a single group only [51]. A biplot was drawn based on the PCA1 and PCA2 components, which graphically represented the interrelationship among the different indices. More than 95% of the total variations could be explained based on the first two PCAs. The PCA1 and PCA2 also categorized the indices into different groups. Among the twelve indices, the SSI is categorized as group 1(G1), Yp, TOL, SSPI, ATI, K1STI, MP and GMP in group 2 (G2), and Ys, YSI, RHI, HRI, YI and K2STI in group 3 (G3). “High heat-tolerance” should be considered in yield stability with low fluctuations under different stress environments. The indices HRI, K2STI, YI and RHI could be used for screening “highly heat-tolerant” genotypes as they have a strong association with YSI (yield-stability index). In contrast, “heat-tolerance” should be considered based on acceptable yield performance under stress conditions and high yield performance under normal environments and it should not refer to the yield stability in both normal and stress environments. Thus, TOL, SSPI, ATI, K1STI, MP, STI and GMP could be considered tools for screening “heat-tolerant” genotypes as they have no relationship with YSI or their negative correlation. The path view of the biplot represents a summary of the interrelationships among the heat indicators and also provides the importance of the indices, which is more or less emphasized for the identification of the individual index of the specific stress. Principal component analysis (PCA) showed that a significant positive correlation was observed between grain yield in stress conditions with the criteria TOL, SSPI, ATI, YP, K1STI, MP and GMP; consequently, they can distinguish heat-tolerant genotypes with the same approach. Exploring these indices for the selection of heat-tolerant genotypes in lentils is very rare globally but very common in durum and bread wheat [39,46] for the screening of drought-tolerant genotypes under water-stress conditions. Similarly, HTI, GMP and MP indices were identified as trustworthy selection indicators for terminal heat-tolerance spring-wheat genotypes in Nepal [78]. Mohammadi et al. [78] and Sareen et al. [79] also reported similar findings in other environments for screening selection criteria of terminal heat-tolerant indices. The biplot diagram was used for the screening of tolerant and sensitive genotypes from this study. The genotypes 58, 59, 53, 54, 48, 29, 31 and 19 were identified as tolerant, and in contrast the genotypes 9, 11, 14, 15, 16, 45, 40, 57, 56 and 49 were perceived as sensitive to heat stress. A similar study was performed by Assefa et al. [80] for the identification of drought-tolerant bread-wheat genotypes.
4.4. Multicollinearity Test
Multicollinearity tests are used as a powerful tool by plant breeders to find whether multicollinearity exists between measured traits or indices [81,82]. The results from the present investigation showed that multicollinearity was observed among the indices GMP, YSI, K1STI and K2STI. Thus, these indices could be used for the identification of high-heat-tolerance genotypes based on the stress-tolerance yield performance of the 60 studied lentil genotypes. Many researchers have used multicollinearity better ascertain relationships between interpretive traits and yield performance [83,84].
4.5. Correlation Study among the Indices
A correlation study among the studied indices revealed that GMP, MP, RDI, STI, YI, YSI, DI, ATI, K1STI and K2STI were the most significant and reliable selection indicators for the screening of stress-tolerant genotypes among the 60 studied genotypes of lentil. A similar finding was recorded by Puri et al. [52] in spring wheat in Nepal.
4.6. Temperature Scenario and Thermal Unit Indices
Temperature, as well as sunshine hours, are significant and basic weather elements for any crop’s growth and development. For development from one growth stage to another, the crop needs a specific time and amount of heat (measured in terms of growing degree days, GDD). In the present study, the 60 lentil genotypes were evaluated based on the different thermal unit indices with their days to maturity and yield performance in OS and LS conditions. In the case of yield performance, each genotype produced a higher yield in the OS condition compared to the LS condition. All studied genotypes showed a higher GDD in LS condition except genotypes 2, 14, 15, 16, 18, 19, 37, 40, 45, 46, 51, 57 and 60. The received sunshine duration of each genotype in hours was maximal in OS compared to LS conditions. The helio-thermal units (HTU), and the pheno-thermal index (PTI) were recorded at their maximum in OS compared to LS conditions for each genotype. The heat-use efficiency (HUE) was more or less stable in each genotype under the OS condition but in LS conditions the HUE declined in the case of all genotypes except genotypes 29, 33, 58, 59, 9 and 8 due to their higher yield performance. Genotypes 29, 33, 58, 59, 9 and 8 were identified as heat-tolerant genotypes based on the thermal unit indices, whereas genotypes 57, 47, 46, 45 and 44 were selected as heat-sensitive genotypes due to their lower yield performance. Similar research was conducted by Islam et al. [85] in the case of mustard varieties. Several previous studies were conducted by Srivastava and Balkrishna [86], Khushu et al. [87] and Singh et al. [42], who indicated that thermal indices influenced crop phenological phases.
4.7. Subset Study on HT and HS Genotypes
4.7.1. Chlorophyll Concentration
The stability of the chlorophyll concentration in plant cells during stress conditions is reported as a potential tool for selection against stressful environments in peanuts [88] and pigeon peas [89]. Chlorophyll concentration was decreased among all tolerant and susceptible genotypes but the concentration reduction was lower in tolerant genotypes compared to the susceptible genotypes. Reduction in chlorophyll concentration occurred in the stress environment, due to the disturbance of chloroplast membranes by direct or indirect effects such as photo-oxidation, which denatures the chlorophyll molecules [90,91,92]. Similar findings have been reported by Dash et al. [93] and Sehgal et al. [8] in lentils. The reduction rate of chlorophyll concentration in the leaves has been also reported more due to drought stress compared to heat stress due to the impact on chlorophyll fluorescence [8].
4.7.2. Proline Content
The genotype LR-9-25 accumulated a higher proline content followed by the genotypes BLX-05002-6 and BLX-05002-3, and the minimum concentration was recorded in the case of the susceptible genotype BLX-12009-6. However, proline accumulations of the studied genotypes were found to be at their maximum in the stress environment compared to those sown at the optimum time. These results clearly indicate that the genotypes LR-9-25, BLX 05002-6 and BLX 05002-3 are more tolerant than the genotypes BLX 12009-6 and LG-198 owing the higher proline concentration under stress conditions. A similar finding was observed by Stoyanov [94] in beans, where susceptible cultivars accumulated a higher content of proline, and the proline content also acted on the reduction in RWC in the plant under water-stress conditions. Increasing proline content in leaves with decreasing water supply in higher plants indicates an efficient mechanism for osmotic regulation. The stabilization of sub-cellular structures and cellular adaptation to water stress occurred in maize [95] and chickpea [96]. In addition, proline acts as an osmolyte for osmotic adjustment, helping to stabilize sub-cellular structures (e.g., membranes and proteins), scavenging free radicals, buffering cellular redox potential, and maintaining the structure of the enzyme and removal of reactive oxygen species under stressed conditions [97].
4.7.3. Relative Water Content (RWC)
The relative water content (RWC) is the percentage of water held by plant tissues. Generally, RWC is at a maximum in plant tissue in control environments compared to stress conditions. From this study, no significant variations were observed in any lentil genotypes during the control condition, but all genotypes exhibited a significant reduction in relative water content during the terminal heat-stress condition, and this reduction was significantly greater in susceptible genotypes than in the tolerant ones. A similar result was observed by Dash et al. [93]. The reduced RWC was also observed by Islam et al. [98], Nazran et al. [99] in mungbean, and Pospíšilová et al. [100] in French beans due to a water-stress environment.
4.7.4. Membrane Thermostability Index (MSI)
Elevated temperature stress affects a plant’s normal physiological parameters adversely, such as membrane stability, photosynthesis, respiration and protein metabolism, which exacerbates low productivity in growth and yield [101]. Several research findings from previous scientists have also confirmed that the membrane thermostability of plant cells is an important factor for screening heat-tolerant genotypes [102,103]. Hence, the MSI has been increased in heat-stress conditions compared to tolerant genotypes, indicating significant membrane damage occurred in the susceptible lentil genotypes in the present investigation. A similar research finding was reported by Almeselmani et al. [104] in wheat genotypes, where a significantly increased membrane-injury index was observed in all genotypes under high temperatures and LS environments.
4.7.5. Pollen Viability
The reproductive stages, especially the flowering and grain-filling stages, are more susceptible to elevated temperature stress; a few degrees of rise in temperature may lead to complete crop loss during the pollen-development stage [105,106,107]. The research findings of Kaushal et al. [18], Jiang et al. [108] and Sage et al. [109] indicate that the pollen viability of legume crops is more susceptible to high-temperature stress interrupting the reproductive function by altering the concentrations of phytohormones such as abscisic acid [110] and auxins [111]. However, in this present investigation, all lentil genotypes received more than 32 °C temperature during their reproductive stages, such as the pollen-development stage, due to the high temperatures imposed by the polythene shades and LS conditions (Table S3). In this study, the reduction in pollen viability was higher in susceptible genotypes compared to the tolerant genotypes, which may have reduced fertilization leading to flower abortion [16,112]. A similar finding was reported by Sita et al. [20].
5. Conclusions
Stress indices are successfully used for the identification of superior genotypes with tolerant genetic resources and better agronomical performance in a stressful environment. However, twelve stress indices were explored in this present investigation and among these indices, GMP, MP, RDI, STI, YI, YSI, DI, ATI, K1STI and K2STI have been identified as the most significant and reliable selection indicators for the evaluation of heat-tolerant genotypes based on comparing the performance of the 60 lentil genotypes under stress and non-stress environments. With consideration of all the indices, genotypes 54(BLX 10002-20), 29(BLX 05002-6), 58(BLX 05002-3) and 8(LRIL-21-67-1-1-1-1) were selected as the most heat-tolerant genotypes. In contrast, genotypes 44 (Bagura local), 24 (BLX 0200-8-4), 47 (Maitree), 13 (91517), 57 (LG 198) and 45 (RL-12-178) were identified as the most sensitive to heat-stress environments among all the studied genotypes. Simultaneously, considering the field performance under stress and non-stress environments indicated that the genotypes 54 (BLX 10002-20), 58 (BLX 05002-3) and 29 (BLX 05002-6) showed the maximum harvest index, with a minimum yield reduction of 22, 38 and 39%, respectively, in the heat-stress environment. In contrast, genotypes 57(LG 198), 40 (BLX 12004-5) and 44 (Bagura local) showed the minimum harvest index with the maximum yield reductions of 82, 79, and 72%, respectively. The average yield loss due to heat stress in lentils was recorded at 59% in this present investigation.
Supplementary Materials
The following supporting information can be downloaded at: https://www.mdpi.com/article/10.3390/life12111719/s1, Table S1: List of 60 lentil genotypes with the source of collection, and present status; Table S2: List of screened genotypes as tolerant and susceptible to terminal heat stress used for physiochemical and reproductive trait study during 2020–21 at PRC, BARI, Ishurdi, Pabna; Table S3: The monthly average temperature at the control and polythene shades with relative humidity, sunshine hours and total rainfall (at the control) during crop season 2020–2021 at PRC, BARI, Ishurdi, Pabna
Author Contributions
Conceptualization: M.A.-U.-Z., M.A.H., A.S., M.A.A. (Md. Ashraful Alam), M.M.R. and M.O.A.; methodology: M.A.-U.-Z., M.A.H., A.S., M.A.A. (Md. Ashraful Alam), M.M.R. and M.O.A.; formal analysis: M.A.-U.-Z., M.A.A. (Md. Ashraful Alam), M.M.R. and A.H.; data curation: M.A.-U.-Z., M.A.A. (Md. Ashraful Alam), and A.H.; statistical expertise: M.A.-U.-Z., M.A.H., A.S., M.A.A. (Md. Ashraful Alam), M.M.R. and M.O.A.; writing—original draft preparation: M.A.-U.-Z., M.A.H., M.A.A. (Md. Ashraful Alam), M.M.R. and M.O.A.; writing—review and editing: A.S., M.O.A., A.G., M.A.A. (Mariam Abdulaziz Alkhateeb) and A.H.; visualization: M.A.-U.-Z., M.A.H., A.S. and M.O.A.; supervision: M.A.H., A.S. and M.O.A.; funding acquisition: A.S., M.O.A., M.A.A. (Mariam Abdulaziz Alkhateeb), A.G. and A.H. All authors have read and agreed to the published version of the manuscript.
Funding
The research work had the financial support of the OCPF-ICARDA-BARI Collaborative project. The research was partially funded by Princess Nourah bint Abdulrahman University Researchers Supporting Project number (PNURSP2022R294), Princess Nourah bint Abdulrahman University, Riyadh, Saudi Arabia.
Institutional Review Board Statement
Not applicable.
Informed Consent Statement
Not applicable.
Data Availability Statement
Data will be available after request.
Acknowledgments
The authors acknowledge Bangladesh Agricultural Research Institute for providing the research farm and laborers for conducting the research work properly. The authors appreciate the Princess Nourah bint Abdulrahman University Researchers Supporting Project number (PNURSP2022R294), Princess Nourah bint Abdulrahman University, Riyadh, Saudi Arabia for providing financial support for the research.
Conflicts of Interest
We, the authors, declare that there is no conflict of interest in this manuscript.
References
- Mishraa, B.K.; Srivastavaa, J.P.; Lalb, J.P.; Sheshshayee, M.S. Physiological and biochemical adaptations in lentil genotypes under drought stress. Russ. J. Plant Physiol. 2016, 63, 695–708. [Google Scholar] [CrossRef]
- FAO Production Crops. FAOSTAT Statistics Database; Food and Agriculture Organization of the United Nations, Statistics Division: Rome, Italy, 2020. Available online: http://www.fao.org/faostat/en/#data/QC/visualize (accessed on 15 July 2022).
- Department of Agricultural Extension (DAE). Agriculture Imformation System; Department of Agricultural Extension: Khamarbari, Dhaka, 2020; p. 1207.
- Sinsawat, V.; Leipner, J.; Stamp, P.; Fracheboud, Y. Effect of heat stress on the photosynthetic apparatus in maize (Zea mays L.) grown at control or high temperature. Environ. Exp. Bot. 2004, 52, 123–129. [Google Scholar] [CrossRef]
- Choudhury, D.R.; Tarafdar, S.; Das, M.; Kundagrami, S. Screening lentil (Lens culinaris Medik.) germplasms for heat tolerance. Trends Biol. Sci. 2012, 5, 143–146. [Google Scholar] [CrossRef]
- Tickoo, J.L.; Sharma, B.; Mishra, S.K.; Dikshit, H.K. Lentil (Lens culinaris) in India: Present status and future perspectives. Indian J. Agric. Sci. 2005, 75, 539–562. [Google Scholar]
- Boyer, J.S.; Westgate, M.E. Grain yield with limited water. J. Exp. Bot. 2004, 55, 2385–2394. [Google Scholar] [CrossRef]
- Prasad, P.V.V.; Pisipati, S.R.; Momcilovic, I.; Ristic, Z. Independent and combined effects of high temperature and drought stress during grain filling on plant yield and chloroplast protein synthesis elongation factor (EFTu) expression in spring wheat. J. Agron. Crop Sci. 2011, 197, 430–441. [Google Scholar] [CrossRef]
- Sehgal, A.; Sita, K.; Kumar, J.; Kumar, S.; Singh, S.; Siddique, K.H.; Nayyar, H. Effects of drought, heat and their interaction on the growth, yield and photosynthetic function of lentil (Lens culinaris Medikus) genotypes varying in heat and drought sensitivity. Front Plant Sci. 2017, 8, 1776. [Google Scholar] [CrossRef] [PubMed]
- Gooding, M.J.; Ellis, R.H.; Shewry, P.R.; Schofield, J.D. Effects of restricted water availability and increased temperature on the grain filling, drying and quality of winter wheat. J. Cereal Sci. 2003, 37, 295–309. [Google Scholar] [CrossRef]
- Britz, S.J.; Prasad, P.V.V.; Moreau, R.A.; Allen, L.H., Jr.; Kremer, D.F.; Boote, K.J. Influence of growth temperature on amounts of to-copherols, to-cotrienols and γ-oryzanol in brown rice. J. Agric. Food Chem. 2007, 5, 7559–7565. [Google Scholar] [CrossRef] [PubMed]
- Mahdavi, S.; Arzani, A.; Maibody, S.A.; Mehrabi, A.A. Photosynthetic and yield performance of wheat (Triticum aestivum L.) under sowing in hot environment. Acta Physiol. Plant. 2021, 43, 106. [Google Scholar] [CrossRef]
- Bahrami, F.; Arzani, A.; Rahimmalek, M. Tolerance to high temperature at reproductive stage: Trade-offs between phenology, grain yield and yield-related traits in wild and cultivated barleys. Plant Breed. 2021, 140, 812–826. [Google Scholar] [CrossRef]
- Prasad, P.V.V.; Djanaguiraman, M. Response of floret fertility and individual grain weight of wheat to high temperature stress: Sensitive stages and thresholds for temperature and duration. Funct. Plant Biol. 2014, 41, 1261–1269. [Google Scholar] [CrossRef] [PubMed]
- Barghi, S.S.; Mostafaii, H.; Peighami, F.; Zakaria, R.A. Path analysis of yield and its components in lentil under end season heat condition. Int. J. Agric. Res. Rev. 2012, 2, 969–974. [Google Scholar]
- Mahoney, J. Field pea. In New Crops: Agronomy and Potential of Alternative Crop Species; Jessop, R.S., Wright, R.L., Eds.; Kata Press: Melbourne, Sydney, 1991; pp. 53–62. [Google Scholar]
- Wang, J.; Gan, Y.T.; Clarke, F.; McDonald, C.L. Response of chickpea yield to high temperature stress during reproductive development. Crop Sci. 2006, 6, 2171–2178. [Google Scholar] [CrossRef]
- Kaushal, N.; Awasthi, R.; Gupta, K.; Gaur, P.; Siddique, K.H.; Nayyar, H. Heat-stress-induced reproductive failures in chickpea (Cicer arietinum) are associated with impaired sucrose metabolism in leaves and anthers. Funct. Plant Biol. 2013, 40, 1334–1349. [Google Scholar] [CrossRef]
- Bhandari, K.; Siddique, K.H.; Turner, N.C.; Kaur, J.; Singh, S.; Agrawal, S.K.; Nayyar, H. Heat stress at reproductive stage disrupts leaf carbohydrate metabolism, impairs reproductive function, and severely reduces seed yield in lentil. J. Crop Improv. 2016, 30, 118–151. [Google Scholar] [CrossRef]
- Sita, K.; Sehgal, A.; HanumanthaRao, B.; Nair, R.M.; Vara Prasad, P.V.; Kumar, S.; Gaur, P.M.; Farooq, M.; Siddique, K.H.M.; Varshney, R.K.; et al. Food Legumes and Rising Temperatures: Effects, Adaptive Functional Mechanisms Specific to Reproductive Growth Stage and Strategies to Improve Heat Tolerance. Front Plant Sci. 2017, 8, 1658. [Google Scholar] [CrossRef]
- Kumar, S.; Barpete, S.; Kumar, J.; Gupta, P.; Sarker, A. Global Lentil Production: Constraints and Strategies. SATSA Mukhapatra-Annu. Tech. Issue 2013, 17, 1–13. [Google Scholar]
- Tilman, D.; Cassman, K.G.; Matson, P.A.; Naylor, R.; Polasky, S. Agricultural sustainability and intensive production practices. Nature 2002, 418, 671–677. [Google Scholar] [CrossRef]
- Krishnamurthy, L.; Gaur, P.M.; Basu, P.S.; Chaturvedi, S.K.; Tripathi, S.; Vadez, V.; Rathore, A.; Varshney, R.K.; Gowda, C.L. Large genetic variation for heat tolerance in the reference collection of chickpea (Cicer arietinum L.) germplasm. Plant Genet. Resour. 2011, 9, 59–69. [Google Scholar] [CrossRef]
- Hall, A.E. Breeding cowpea for future climates. In Crop Adaptation to Climate Change; Yadav, S.S., Redden, R., Hatfield, J.L., Lotze-Campen, H., Hall, A.J.W., Eds.; John Wiley and Sons: Hoboken, NJ, USA, 2011. [Google Scholar]
- Souza, M.A.; Pimentel, A.J.B.; Ribeiro, G. Breeding for heat-stress tolerance. In Plant Breeding for Abiotic Stress Tolerance; Fritsche-Neto, R., Borém, A., Eds.; Springer: Berlin, Germany, 2012; pp. 137–156. [Google Scholar]
- Devasirvatham, V.; Gaur, P.M.; Raju, T.N.; Trethowan, R.M.; Tan, D.K. Field response of chickpea (Cicer arietinum L.) to high temperature. Field Crops Res. 2015, 172, 59–71. [Google Scholar] [CrossRef]
- Ali, M.B.; El-Sadek, A.N. Evaluation of drought tolerance indices for wheat (Triticumaestivum L.) under irrigated and rainfed conditions. Commun. Biometry Crop Sci. 2016, 11, 77–89. [Google Scholar]
- Naveed, M.; Nadeem, M.; Shafiq, M.; Rafiq, C.M.; Zahid, M.A. Selection of promising chickpea (Cicer arietinum L) genotypes using drought tolerance indices. J. Anim. Plant Sci. 2019, 29, 278–290. [Google Scholar]
- Kakaei, M. Evaluation of Terminal Drought Stress Tolerance in Lentil (Lens culinaris). Isfahan Univ. Technol. J. Crop Prod. Process. 2019, 8, 59–71. [Google Scholar] [CrossRef][Green Version]
- Siahsar, B.A.; Ganjali, S.; Allahdoo, M. Evaluation of drought tolerance indices and their relationship with grain yield of lentil lines in drought-stressed and irrigated environments. Aust. J. Basic Appl. Sci. 2010, 4, 4336–4346. [Google Scholar]
- Benhin, J.K. Climate Change and South African Agriculture: Impacts and Adaptation Options; CEEPA Discussion Paper; Elsevier: Amsterdam, The Netherlands, 2006. [Google Scholar]
- Dube, T.; Moyo, P.; Ncube, M.; Nyathi, D. The impact of climate change on agro-ecological based livelihoods in Africa: A review. J. Sustain. Dev. 2016, 9, 256–267. [Google Scholar] [CrossRef]
- Nhemachena, C.; Mano, R. Assessment of the Economic Impacts of Climate Change on Agriculture in Zimbabwe: A Ricardian Approach; The World Bank: Washington, DC, USA, 2007. [Google Scholar]
- Fischer, R.A.; Maurer, R. Drought resistance in spring wheat cultivars. I. Grain yield responses. Aust. J. Agric. Res. 1978, 29, 897–912. [Google Scholar] [CrossRef]
- Rosielle, A.A.; Hamblin, J. Theoretical aspects of selection for yield in stress and non-stress environment. Crop Sci. 1981, 21, 943–946. [Google Scholar] [CrossRef]
- Fernandez, G.C.J. Effective selection criteria for assessing stress tolerance. In Proceedings of the International Symposium on Adaptation of Vegetables and Other Food Crops in Temperature and Water Stress, Tainan, Taiwan, 13–18 August 1992; Kuo, C.G., Ed.; AVRDC Publication: Tainan, Taiwan, 1992; pp. 257–270. [Google Scholar]
- Gavuzzi, P.; Rizza, F.; Palumbo, M.; Campanile, R.G.; Ricciardi, G.L.; Borghi, B. Evaluation of field and laboratory predictors of drought and heat tolerance in winter cereals. Can. J. Plant Sci. 1997, 77, 523–553. [Google Scholar] [CrossRef]
- Bouslama, M.; Schapaugh, W.T. Stress Tolerance in Soybeans. I. Evaluation of Three Screening Techniques for Heat and Drought Tolerance. Crop Sci. 1984, 24, 933–937. [Google Scholar] [CrossRef]
- Lan, J. Comparison of evaluating methods for agronomic drought resistance in crops. Acta Agric. Bor-Occidsinic 1998, 7, 85–87. [Google Scholar]
- Moosavi, S.S.; YazdiSamadi, B.; Naghavi, M.R.; Zali, A.A.; Dashti, H.; Pourshahbazi, A. Introduction of new indices to identify relative drought tolerance and resistance in wheat genotypes. Desert 2008, 12, 165–178. [Google Scholar]
- Farshadfar, E.; Elyasi, P.; Aghaee, M. In Vitro selection for drought tolerance in common wheat (Triticum aestivum L) genotypes by mature embryo culture. Am. J. Sci. Res. 2012, 48, 102–115. [Google Scholar]
- Singh, M.P.; Lallu-Singh, N.B. Thermal requirement of Indian mustard (Brassica juncea) at different phonological stages under late sown condition. Indian J. Plant Physiol. 2014, 19, 238–243. [Google Scholar] [CrossRef] [PubMed]
- Awasthi, R.; Kaushal, N.; Vadez, V.; Turner, N.C.; Berger, J.; Siddique, K.H.; Nayyar, H. Individual and combined effects of transientdrought and heat stress on carbon assimilation and seed filling in chick-pea. Funct. Plant Biol. 2014, 41, 1148–1167. [Google Scholar] [CrossRef]
- Arnon, D.I. Copper enzyme in isolated chloroplast: Polyphenol oxidase in Beta vulgaris. Plant Physiol. 1949, 24, 1–15. [Google Scholar] [CrossRef] [PubMed]
- Bates, L.S.; Waldeen, R.P.O.; Teare, I.D. Rapid determination of free proline in water stress studies. Plant Soil 1973, 39, 205–207. [Google Scholar] [CrossRef]
- Barrs, H.D.; Weatherley, P.E. A re-examination of the relative turgidity technique for estimating waterdeficits in leaves. Aust. J. Biol. Sci. 1962, 24, 519–570. [Google Scholar] [CrossRef]
- Premchandra, G.S.; Sanoeka, H.; Ogata, S. Cell membrane stability, an indicator of drought tolerance as affected by applied nitrogen in soybean. J. Agric. Sci. 1990, 115, 6–66. [Google Scholar]
- Sainnan, R.K. Effect of moisture stress on physiological activities of two contrasting wheat genotypes. Indian J. Exp. Biol. 1994, 32, 594–597. [Google Scholar]
- Alexander, M.P. Differential staining of aborted and non-aborted pollen. Stain Technol. 1969, 44, 117–122. [Google Scholar] [CrossRef] [PubMed]
- Ceylan, H.A.; Türkan, I.; Sekmen, A.H. Effect of coronatine on antioxidant enzyme response of chickpea roots to combination of PEG-induced osmotic stress and heat stress. J Plant Growth Regul. 2013, 32, 72–82. [Google Scholar] [CrossRef]
- R Core Team. R: A Language and Environment for Statistical Computing; R Foundation for Statistical Computing: Vienna, Austria, 2017; Available online: https://www.R-project.org/ (accessed on 15 June 2022).
- Talebi, R.; Fayaz, F.; Naji, A.M. Effective selection criteria for assessing drought stress tolerance in durum wheat (Triticum durum DESF). Gen. Appl. Plant Physiol. 2009, 35, 64–74. [Google Scholar]
- Puri, R.R.; Gautam, R.R.; Joshi, A.K. Exploring stress tolerance indices to identify terminal heat tolerance in spring wheat in Nepal. J. Wheat Res. 2015, 1, 13–17. [Google Scholar]
- Delahunty, A.; Nuttall, J.; Nicolas, M.; Brand, J. Genotypic heat-tolerance in lentil. In Proceedings of the 17th ASA Conference, Hobart, Australia, 20–24 September 2015; pp. 20–24. [Google Scholar]
- Khodadadi, M.; Fotokian, M.H.; Miransari, M. Genetic diversity of wheat (Triticum aestivum L.) genotypes based on cluster and principal component analyses for breeding strategies. Aust. J. Crop Sci. 2011, 5, 17–24. [Google Scholar]
- Kishor, P.B.K.; Hong, Z.; Milao, G.H.; Hu, C.A.A.; Verma, D.P.S. Overexpression of (delta)-pyrroline-5-carboxylate synthetase increases proline production and confers osmotolerance in transgenic plants. Plant Physiol. 1995, 108, 1387–1394. [Google Scholar] [CrossRef] [PubMed]
- Kumar, J.; Kant, R.; Kumar, S.; Basu, P.S.; Sarker, A.; Singh, N.P. Heat tolerance in lentil under field conditions. Legume Genom. Genet. 2015, 7, 1–11. [Google Scholar] [CrossRef]
- Sharma, L.; Priya, M.; Bindumadhava, H.; Nair, R.M.; Nayyar, H. Influence of high temperature stress on growth, phenology and yield performance of mungbean [Vignaradiata (L.) Wilczek] under managed growth conditions. Sci. Hortic. 2016, 213, 379–391. [Google Scholar] [CrossRef]
- Abbo, S.; Berger, J.; Turner, N.C. Evolution of cultivated chick-pea: Four bottlenecks limit diversity and constrain adaptation. Funct. Plant Biol. 2003, 30, 1081–1087. [Google Scholar] [CrossRef] [PubMed]
- Gopesh, C.S.; Sarker, A.; Chen, W.; Vandemark, G.J.; Muehlbauer, F.J. Inheritance and linkage map positions of genes conferring agromorphological traits in Lens culinaris Medik. Int. J. Agron. 2013, 2013, 618926. [Google Scholar]
- Sarker, A.; Erskine, W.; Sharma, B.; Tyagi, M.C. Inheritance and linkage relationships of days to flower and morphological loci in lentil (Lens culinaris Medikus subsp. culinaris). J. Hered. 2013, 90, 270–275. [Google Scholar] [CrossRef]
- Summerfield, R.J.; Roberts, E.H.; Erskine, W.; Ellis, R.H. Effects of temperature and photoperiod on flowering in lentils (Lens culinaris Medik.). Ann. Bot. 1985, 56, 659–671. [Google Scholar] [CrossRef]
- Kaushal, N.; Bhandari, K.; Siddique, K.H.; Nayyar, H. Food crops face rising temperatures: An overview of responses, adaptive mechanisms, and approaches to improve heat tolerance. Cogent Food Agric. 2016, 2, 1134380. [Google Scholar] [CrossRef]
- Thakur, P.; Kumar, S.; Malik, J.A.; Berger, J.D.; Nayyar, H. Cold stress effects on reproductive development in grain crops: An overview. Environ. Exp. Bot. 2010, 67, 429–443. [Google Scholar] [CrossRef]
- Noureddine, E.H.; Rajendran, K.; Smouni, A.; Es-Safi, N.E.; Benbrahim, N.; Mentag, R.; Nayyar, H.H.; Maalouf, F.; Kumar, S. Screening the FIGS Set of lentil (Lens culinaris Medikus) germplasm for tolerance to terminal heat and combined drought-heat stress. Agronomy 2020, 10, 1036. [Google Scholar] [CrossRef]
- Nicolas, M.E.; Gleadow, R.M.; Dalling, M.J. Effect of post anthesis drought on cell division and starch accumulation in developing wheat grains. Ann. Bot. 1985, 55, 433–444. [Google Scholar] [CrossRef]
- Blum, A. Improving wheat grain filling under stress by stem reserve mobilization. Euphytica 1998, 100, 77–83. [Google Scholar] [CrossRef]
- Yang, J.C.; Zhang, J.H.; Wang, Z.Q.; Xu, G.W.; Zhu, Q.S. Activities of key enzymes in sucrose-to-starch conversion in wheat grains subjected to water deficit during grain filling. Plant Physiol. 2004, 135, 1621–1629. [Google Scholar] [CrossRef]
- Zhang, X.; Cai, J.; Wollenweber, B.; Liu, F.; Dai, T.; Cao, W.; Jiang, D. Multiple heat and drought events affect grain yield and accumulations of high molecular weight glutenin subunits and glutenin macropolymers in wheat. J. Cereal Sci. 2013, 57, 134–140. [Google Scholar] [CrossRef]
- Ahamed, K.U.; Nahar, K.; Fujita, M.; Hasanuzzaman, M. Variation in plant growth, tiller dynamics and yield components of wheat (Triticumaestivum L.) due to high temperature stress. Adv. Agric. Bot. 2010, 2, 213–224. [Google Scholar]
- Kalra, N.; Chakrabort, D.; Sharma, A.; Rai, H.K.; Jolly, M.; Chander, S.; Kumar, P.R.; Bhadraray, S.; Barman, D.; Mittal, R.B.; et al. Effect of increasing temperature on yield of some winter crops in northwest India. Curr. Sci. 2008, 94, 82–88. [Google Scholar]
- Hatfield, J.L.; Boote, K.J.; Kimball, B.A.; Ziska, L.H.; Izaurralde, R.C.; Ort, D.; Thomson, A.; Wolfe, D. Climate impacts on agriculture: Implications for crop production. Agron. J. 2011, 103, 351–370. [Google Scholar] [CrossRef]
- Wang, X.; Cai, J.; Liu, F.; Jin, M.; Yu, H.; Jiang, D.; Wollenweber, B.; Dai, T.; Cao, W. Pre-anthesis high temperature acclimation alleviates the negative effects of post-anthesis heat stress on stem stored carbohydrates remobilization and grain starch accumulation in wheat. J. Cereal Sci. 2012, 55, 331–336. [Google Scholar] [CrossRef]
- Yamamoto, Y.; Aminaka, R.; Yoshioka, M.; Khatoon, M.; Komayama, K.; Takenaka, D.; Yamashita, A.; Nijo, N.; Inagawa, K.; Morita, N.; et al. Quality control of photosystem II: Impact of light and heat stresses. Photosynth. Res. 2008, 98, 589–608. [Google Scholar] [CrossRef]
- Mohammed, A.R.; Tarpley, L. Effect of high night temperature and spikelet position on yield-related parameters of rice (Oryza sativa L.) plants. Eur. J. Agron. 2010, 33, 117–123. [Google Scholar] [CrossRef]
- Hasanuzzaman, M.; Nahar, K.; Alam, M.M.; Roychowdhury, R.; Fujita, M. Physiological, biochemical, and molecular mechanisms of heat stress tolerance in plants. Int. J. Mol. Sci. 2013, 14, 9643–9684. [Google Scholar] [CrossRef] [PubMed]
- Vargas, Y.; Mayor-Duran, V.M.; Buendia, H.F.; Ruiz-Guzman, H.; Raatz, B. Physiological and genetic characterization of heat stress effects in a common bean RIL population. PLoS ONE 2021, 16, e0249859. [Google Scholar] [CrossRef]
- Mohammadi, M.R.; Karimizadeh, R.; Abdipour, M. Evaluation of drought tolerance in bread wheat genotypes under dry land and supplemental irrigation conditions. Aust. J. Crop Sci. 2009, 5, 487–493. [Google Scholar]
- Sareen, S.; Tyagi, B.S.; Tiwari, V.; Sharma, I. Response estimation of wheat synthetic lines to terminal heat stress using stress indices. J. Agric. Sci. 2012, 4, 97–104. [Google Scholar] [CrossRef][Green Version]
- Assefa, A.; Mekbib, F.; Tadesse, W.; Tesfaye, K. Screening of drought tolerant bread wheat (Triticumaestivum L.) genotypes using yield based drought tolerance indices. Ethiop. J. Agric. Sci. 2019, 29, 1–16. [Google Scholar]
- Cruz, C.; Regazzi, A.; Carneiro, P.J.V.U. Modelos Biométricos Aplicados ao Melhoramento Genético, 5th ed.; UFV Francisco São José: Viçosa, Brazil, 2012. [Google Scholar]
- Olivoto, T.; de Souza, V.Q.; Nardino, M.; Carvalho, I.R.; Ferrari, M.; de Pelegrin, A.J.; Szareski, V.J.; Schmidt, D. Multicollinearity in path analysis: A simple method to reduce its effects. Agron. J. 2017, 109, 131–142. [Google Scholar] [CrossRef]
- Al-Ashkar, I.; Alotaibi, M.; Refay, Y.; Ghazy, A.; Zakri, A.; Al-Doss, A. Selection criteria for high-yielding and early-flowering bread wheat hybrids under heat stress. PLoS ONE 2020, 15, e0236351. [Google Scholar]
- Bojarian, M.; Asadi-Gharneh, H.A.; Golabadi, M. Factor analysis, stepwise regression and path coefficient analyses of yield, yield-associated traits, and fruit quality in tomato. Int. J. Veg. Sci. 2019, 25, 542–553. [Google Scholar] [CrossRef]
- Islam, M.R.; Alam, M.A.; Kamal, M.M.; Zaman, R.; Hossain, A.; Alharby, H.; Bamagoos, A.; Farooq, M.; Hossain, J.; Barutcular, C.; et al. Assessing impact of thermal units on growth and development of mustard varieties grown under optimum sown conditions. J. Agrometeorol. 2019, 21, 270–281. [Google Scholar] [CrossRef]
- Srivastava, J.P. Environmental parameters influencing phenological development of mustard in relation to yield. Indian J. Plant Physiol. 2003, 8, 349–353. [Google Scholar]
- Khushu, M.K.; Naseer-Ur, R.; Singh, M.; Tiku, A.K.; Bali, A.S. Thermal time indices for some mustard genotypes in the Jammu region. J. Agrometeorol. 2008, 10, 224–227. [Google Scholar] [CrossRef]
- Arunyanark, A.; Jogloy, S.; Akkasaeng, C.; Vorasoot, N.; Kesmala, T.; Nageswara, R.C.; Wright, G.C.; Patanothai, A. Chlorophyll stability is an indicator of drought tolerance in peanut. J. Agron. Crop Sci. 2008, 194, 113–125. [Google Scholar] [CrossRef]
- Singh, A.K.; Srivastava, J.P.; Singh, R.M.; Singh, M.N.; Kumar, M. Selection parameters for pigeonpea (Cajanus cajan L. Millsp.) genotypes at early growth stages against soil moisture stress. J. Food Legume 2013, 26, 97–102. [Google Scholar]
- Kotak, S.; Larkindale, J.; Lee, U.; von Koskull-Doring, P.; Vierling, E.; Scharf, K.D. Complexity of the heat stress response in plants. Curr. Opin. Plant Biol. 2007, 10, 310–316. [Google Scholar] [CrossRef]
- Ristic, Z.; Bukovnik, U.; Prasad, P.V.V. Correlation between heat stability of thylakoid membranes and loss of chlorophyll in winter wheat under heat stress. Crop Sci. 2007, 47, 2067–2073. [Google Scholar] [CrossRef]
- Djanaguiraman, M.; Prasad, P.V.V.; Seppanen, M. Selenium protects sorghum leaves from oxidative damage under high temperature stress by enhancing antioxidant defense system. Plant Physiol. Biochem. 2010, 48, 999–1007. [Google Scholar] [CrossRef] [PubMed]
- Dash, A.P.; De, D.K.; Nath, R.; Sarkar, A.; Mohanty, S. Comparative study of relative water, chlorophyll and proline content in drought tolerant and susceptible genotypes of lentil (Lens culinaris Medik). Res. J. Agric. Sci. 2017, 8, 1081–1086. [Google Scholar]
- Stoyanov, Z.Z. Effect of water stress on leaf water relations of young bean plants. J. Cent. Agric. 2005, 6, 5–14. [Google Scholar]
- Valentovic, P.; Luxova, M.; Kolarovic, L.; Gasparikova, O. Effect of osmotic stress on compatible solutes content, membrane stability and water relations in two maize cultivars. Plant Soil Environ. 2006, 4, 186–191. [Google Scholar]
- Gunes, A.; Pilbeam, D.J.; Inal, A.; Coban, S. Influence of silicon on sunflower cultivars under drought stress, I: Growth, antioxidant mechanisms, and lipid peroxidation. Commun. Soil Sci. Plant Anal. 2008, 39, 1885–1903. [Google Scholar] [CrossRef]
- Ashraf, M.; Foolad, M.R. Roles of glycine betaine and proline in improving plant abiotic stress resistance. Environ. Exp. Bot. 2007, 59, 206–216. [Google Scholar] [CrossRef]
- Islam, M.R.; Kamal, M.; Alam, M.A.; Hossain, J.; Soufan, W.; Skalicky, M.; Brestic, M.; Habib-ur-Rahman, M.; Sabagh, A.E. Physiochemical Changes of Mung Bean [Vigna radiata (L.) R. Wilczek] in Responses to Varying Irrigation Regimes. Horticulturae 2021, 2021, 565. [Google Scholar] [CrossRef]
- Nazran, A.; Ahmed, J.U.; Karim, A.J.M.S.; Ghosh, T.K. Physiological responses of mungbean (Vignaradiata) varieties to drought stress. Bangladesh J. Agric. Res. 2019, 44, 1–11. [Google Scholar] [CrossRef]
- Pospíšilová, J.; Dodd, I.C. Role of plant growth regulators in stomatal limitation to photosynthesis during water stress. In Handbook of Photosynthesis, 2nd ed.; Pessarakli, M., Ed.; Taylor and Francis: New York, NY, USA, 2004; pp. 811–825, 24. [Google Scholar]
- Georgieva, K. Some mechanisms of damage and acclimation of the photosynthetic apparatus due to high temperature. Bulg. J. Plant Physiol. 2005, 25, 89–99. [Google Scholar]
- Talwar, H.S.; Chandrasekhar, A.; Rao, N.R.C. Genotypic variability in membrane thermostability in groundnut. Indian J. Plant Physiol. 2002, 7, 97–102. [Google Scholar]
- Agarie, S.; Hanaoka, N.; Kubota, F.; Agata, W.; Kaufman, P.B. Measurement of cell membrane stability evaluated by electrolyte leakage as a drought and heat tolerance test in rice (Oryza sativa L.). J. Fac. Agric. 1995, 40, 233. [Google Scholar] [CrossRef]
- Almeselmani, M.; Deshmukh, P.S.; Sairam, R.K.; Kushwaha, S.R.; Singh, T.P. Protective role of antioxidant enzymes under high temperature stress. Plant Sci. 2006, 171, 382–388. [Google Scholar] [CrossRef] [PubMed]
- Asseng, S.; Foster, I.A.N.; Turner, N.C. The impact of temperature variability on wheat yields. Glob. Chang. Biol. 2011, 17, 997–1012. [Google Scholar] [CrossRef]
- Wiebe, K.; Lotze-Campen, H.; Sands, R.; Tabeau, A.; van der Mensbrugghe, D.; Biewald, A.; Bodirsky, B.; Islam, S.; Kavallari, A.; Mason-D’Croz, D.; et al. Climate change impacts on agriculture in 2050 under a range of plausible socioeconomic and emissions scenarios. Environ. Res. Lett. 2015, 10, 085010. [Google Scholar] [CrossRef]
- Wheeler, T.R.; Craufurd, P.Q.; Ellis, R.H.; Porter, J.R.; Prasad, P.V. Temperature variability and the yield of annual crops. Agric. Ecosyst. Environ. 2000, 82, 159–167. [Google Scholar] [CrossRef]
- Jiang, Y.; Lahlali, R.; Karunakaran, C.; Kumar, S.; Davis, A.R.; Bueckert, R.A. Seed set, pollen morphology and pollen surface composition response to heat stress in field pea. Plant Cell Environ. 2015, 38, 2387–2397. [Google Scholar] [CrossRef]
- Sage, T.L.; Bagha, S.; Lundsgaard-Nielson, V.; Branchd, H.A.; Sultmanis, S.; Sage, R.F. The effect of high temperature stress on male and female reproduction in plants. Field Crop Res. 2015, 182, 30–42. [Google Scholar] [CrossRef]
- Todaka, D.; Nakashima, K.; Shinozaki, K.; Yamaguchi-Shinozaki, K. Toward understanding transcriptional regulatory networks in abiotic stress responses and tolerance in rice. Rice 2012, 5, 1. [Google Scholar] [CrossRef]
- Teale, W.D.; Paponov, I.A.; Palme, K. Auxin in action: Signalling, transport and the control of plant growth and development. Nat. Rev. Mol. Cell Biol. 2006, 7, 847–859. [Google Scholar] [CrossRef]
- Prasad, P.V.; Bheemanahalli, R.; Jagadish, S.K. Field crops and the fear of heat stress-Opportunities, challenges and future directions. Field Crops Res. 2017, 200, 114–121. [Google Scholar] [CrossRef]


Publisher’s Note: MDPI stays neutral with regard to jurisdictional claims in published maps and institutional affiliations. |
© 2022 by the authors. Licensee MDPI, Basel, Switzerland. This article is an open access article distributed under the terms and conditions of the Creative Commons Attribution (CC BY) license (https://creativecommons.org/licenses/by/4.0/).