Article

Significant Differences in Microbial Soil Properties, Stoichiometry and Tree Growth Occurred within 15 Years after Afforestation on Different Parent Material

Faculty of Forestry, Kahramanmaras Sutcu Imam University, 46050 Kahramanmaras, Turkey
Life 2024, 14(9), 1139; https://doi.org/10.3390/life14091139
Submission received: 6 August 2024 / Revised: 6 September 2024 / Accepted: 8 September 2024 / Published: 9 September 2024

Abstract

:
The mineralogical composition of the parent material, together with plant species and soil microorganisms, constitutes the foundational components of an ecosystem’s energy cycle. Afforestation in arid-semi arid regions plays a crucial role in preventing erosion and enhancing soil quality, offering significant economic and ecological benefits. This study evaluated the effects of afforestation and different parent materials on the physicochemical and microbiological properties of soils, including microbial basal respiration (MR), as well as how these changes in soil properties after 15 years influence plant growth. For this purpose, various soil physicochemical parameters, MR, soil microbial biomass carbon (Cmic), stoichiometry (microbial quotient = Cmic/Corg = qMic and metabolic quotient = MR/Cmic = qCO2), and tree growth metrics such as height and diameter were measured. The results indicated that when the physicochemical and microbiological properties of soils from different bedrock types, along with the average values of tree growth parameters, were analyzed, afforestation areas with limestone bedrock performed better than those with andesite bedrock. Notably, sensitive microbial properties, such as Cmic, MR, and qMic, were positively influenced by afforestation. The highest values of Cmic (323 μg C g−1) and MR (1.3 CO2–C g−1 h−1) were recorded in soils derived from limestone. In contrast, the highest qCO2 was observed in the control plots of soils with andesite parent material (7.14). Considering all the measured soil properties, the samples can be ranked in the following order: limestone sample (LS) > andesite sample (AS) > limestone control (LC) > andesite control (AC). Similarly, considering measured plant growth parameters were ranked as LS > AS. As a result, the higher plant growth capacity and carbon retention of limestone soil indicate that it has high microbial biomass and microbial activity. This study emphasizes the importance of selecting suitable parent material and understanding soil properties to optimize future afforestation efforts on bare lands.

1. Introduction

Soil is formed under the influence of bedrock, climate, vegetation, and topographic factors. However, the dominance of one factor over the others can lead to variations in soil properties and land productivity [1]. Semi-arid and arid ecosystems, for example, are primarily influenced by parent material and the continental climate, with summer drought being a critical stress factor [2,3]. The physical properties, mineral composition, and texture of the parent material significantly affect the soil formation rate and the characteristics of the resulting soil [4]. The hardness of rocks is also crucial; soils formed on hard rocks have lower formation rates than the rate of soil loss through erosion, leading to poor habitat characteristics. Birkeland [5] ranked bedrock stability against soil formation factors as follows: quartzite, chert > granite, basalt > sandstone, siltstone > dolomite, limestone.
The parent material contributes to the nutrient cycle by releasing nutrients through weathering and maintaining a balance between nutrient loss and storage [1,4]. After climate, plant and microorganism activities play the most important roles in soil formation. Trees, in particular, influence parent material through biomechanical, chemical, and biological effects [1,3]. Traditionally, studies have focused on the biochemical, ecological, and edaphic influences on soils, but the significance of biomechanical effects is increasingly recognized [6,7,8]. Most research on the biomechanical effects of vegetation has centered on tree root growth, but trees also impact the physical displacement of regolith materials and the formation of root debris and exudates [9]. Plant roots mechanically break down rocks during growth, accelerating soil formation processes. Additionally, root exudates and mechanical root activities help reduce erosion, stabilizing soil ecosystems [10]. Organic acids and exudates produced by plants and microorganisms enhance the chemical weathering of minerals and the release of nutrients [11].
Over the last 20 years, the Turkish Ministry of Agriculture and Forestry has conducted afforestation activities to increase forest cover to 30% of Turkey’s surface area. Scots pine and black locust are commonly used for erosion control due to their high tolerance to drought and poor soil conditions [12]. Planting native tree species has accelerated natural succession [13] and carbon sequestration [14]. Plants, known as the organisms with the largest biomass in terrestrial ecosystems, contribute greatly to the formation and development of soils through litter residues, leaves, branches, roots, and exudates of their aboveground biomass [15,16]. In addition, vegetation affects the organic carbon (OC) concentration added to soils and the diversity, quality, and quantity of soil microorganisms [17]. For example, the biomass of microbial organisms in soils converted from forest to agriculture decreases significantly [18,19]. Similarly, agricultural land contains less soil organic C (SOC) and Cmic compared to native forests [20]. Vegetation type strongly influences soil-forming processes, contributing significantly to organic matter and microbial community development and activity [21,22]. Microbial stoichiometric indices such as microbial basal respiration (MR), microbial quotient (qMic), metabolic quotient (qCO2), and C mineralization are related to the SOC cycle in the environment. With the help of these stoichiometric indices, the effects of changes in land use or ecosystem on soil quality, microbial populations, and microbial activity rates can be estimated [23,24].
While many studies suggest that microbial biomass is controlled by soil physicochemical properties [25,26], others indicate that the aboveground vegetation type has a stronger influence on microbial biomass and activity [27,28]. Kara et al. [10] found positive effects of ecosystem changes on microbial biomass and activity in afforested areas in both the short and long term. Studies on afforested ecosystems indicate that vegetation accelerates soil formation processes, promoting organic matter accumulation and the development of microbial communities [21,29,30]. Trees provide nutrients to the soil through dead plant residues and root secretions, which microorganisms break down and mineralize, forming a usable nutrient source for plants [31]. Microbial organisms decompose this litter, returning essential organic nutrients to the soil. This process enriches the growing environment, enhancing the productivity of the soil. As a result, plant growth parameters, such as tree height (TH) and diameter at breast height (DBH), improve significantly. The upper soil horizon, a reservoir for soil microbial biomass, is crucial for decomposition and nutrient cycling [32]. This symbiotic relationship underpins the nutrient cycle, essential for ecosystem health.
Soil microorganisms are the most rapidly affected by environmental conditions, various forestry management practices, and sudden changes on or within the soil surface. Consequently, measuring microbial activities and properties following forestry management activities is essential for monitoring changes in soil fertility. Changes in microbial properties can provide early indications of potential ecosystem disruptions [31,33,34,35,36]. Assessing microbial biomass in soils is crucial in many soil monitoring studies and programs [34], but it should be considered alongside other habitat parameters for a comprehensive ecological assessment. Although recent studies focus on the effects of soil microbiological properties on soil fertility, there is still limited information on their relationship with tree growth. This research aimed to new perspectives on the effects of physicochemical, microbial properties, and stoichiometry of soils derived from different bedrocks on seedling growth parameters, highlighting the importance of evaluating soil quality parameters in forests.

2. Materials and Methods

2.1. Study Sites

The study was conducted in Gümüşhane Province, located in the Northeast Black Sea mountainous region of Turkey (40°19′–40°23′ N and 39°30′–39°38′ E). The elevation ranges from 1400 to 1600 m, with steep slopes (45–50%) covered by shallow soil (typically 50 cm or less) on a west-southwest aspect. The region has a “Warm, dry-summer continental climate” (Dsb) according to the Köppen-Geiger climate classification (https://koeppen-geiger.vu-wien.ac.at/; accessed on 1 July 2024). Weather data, including long-term averages (1990–2018) for monthly air temperature and precipitation in Gümüşhane Province, were obtained from the Turkish State Meteorological Service (www.mgm.gov.tr; accessed on 20 June 2024). The annual mean temperature is 9.4 °C, with a high of 39.5 °C in July and a low of −19.0 °C in February. The topsoil temperature drops below 0 °C and freezes during the winter. Annual precipitation is 461 mm, with about 54% occurring during the growing season between April and September. The main soil type in the area is Entisol, characterized by minimal horizon development. The rugged topography consists of andesitic and limestone bedrock. Table 1 provides a detailed characterization of the study site.

2.2. Experimental Design, Soil Sampling, and Pretreatment

This study was conducted in Scots pine (Pinus sylvestris L.) afforestation areas in June 2019. These areas were afforested by the Turkish General Directorate of Afforestation in 2005, initially prepared with an excavator, and the seedlings were supported with irrigation and fertilization for the first five years after planting. The control area was severely degraded grassland with less than 5% vegetation cover, exposed to erosion, and left unfertilized. A grid-based sampling design was used to select three 10 m × 10 m experimental areas from different bedrocks, representing a total of 30 hectares [37]. Tree growth parameters, such as tree height (TH) and diameter of breast height (DBH), were directly measured within each 100 m2 area using a Blume-Leiss and compass, respectively. TH and DBH were measured in 53 trees (in andesite) and 64 trees (in limestone) within the afforested study site. Soil samples were collected from Scots pine plantations and adjacent bare control plots during periods of optimal moisture and temperature for microbial activity. In particular, clearings adjacent to afforestation areas were selected as control areas to better identify the differences in bedrock and afforestation effects. The sampling locations were on afforested terraces within 10 m × 10 m plots. For each parent material, a total of 10 soil samples were taken, as two of the selected trial sites with different parent materials had three terrace rows, while one had four terrace rows. A total of 40 soil samples (4 different sites × 10 spots = 40 soil samples) were systematically selected from two different parent materials afforested (LS = limestone sample and AS = Andesite sample) and control areas (LC = limestone control and AC = Andesite control). The disturbed and microbial soil samples were collected separately from the topsoil layer at 0–20 cm depth. Before collecting disturbed mineral soil samples, the litter, root debris, and stones were removed and stored in plastic bags. In the field, microbial soil samples were first sieved using <2 mm sieve, then distilled water was added until 50–60% moisture content to ensure optimal conditions for microbial activity, which is crucial for accurate measurement of microbial properties and quickly transferred to the laboratory for storage in a 4 °C refrigerator before analysis [22]. Disturbed soil samples were dried by spreading them in drying cabinets to make them air-dried; after drying, the soils were ground and sieved (<2 mm) to determine the physicochemical parameters of the soil.

2.3. Physical and Chemical Properties of Soils

Soil moisture content was determined gravimetrically by oven-drying samples at 105 °C until a stable weight was achieved. Soil particle size (PS) was measured using the hydrometer method [38]. Soil pH and electrical conductivity (EC) were assessed using a 1:2.5 soil/water suspension for pH and a 1:5 soil/water suspension for EC, measured with appropriate meters. Soil organic carbon (SOC) was estimated using the potassium dichromate oxidation method [39], total nitrogen by the Kjeldahl method [40], and total lime (CaCO3) content was determined using the Scheibler calcimeter method [41].

2.4. Microbial Biomass C (Cmic)

The chloroform-fumigation-extraction method was performed to determine soil microbial biomass carbon (Cmic) [42]. For microbial analysis, 30 g of each soil sample was taken in two replicates and fumigated with ethanol-free chloroform in a heavy vacuum desiccator at 25 ° C for 24 h. Similarly, the second part of the microbial soil samples weighed 30 g and were not fumigated with chloroform in the desiccator. Both fumigated and non-fumigated soil samples were mixed in 0.5 M K2SO4 (1:4 w/v), followed by shaking the suspension for 30 min at 200 rpm in an oscillator. The extracts were filtered through the Whatman-42 filter paper and stored before titration. Total organic carbon in both fumigated and non-fumigated extracts was estimated as specified by the Walkley Black method [43,44]. Cmic was calculated from the difference in extractable organic C between fumigated and unfumigated soil samples using the formula: biomass C = 2.64 × EC, where EC refers to the difference in extractable organic C between the treatments; 2.64 is the proportionality factor for biomass C released by fumigation extraction [42,44]. The microbial quotient (Cmic/Corg or qMic) was calculated by expressing microbial C as a percentage of total soil organic C.

2.5. Microbial Respiration

Microbial respiration was determined using the absorption method to quantify carbon dioxide (CO2) [45]. Moist soil samples (50 g dry weight equivalent) were placed in 60-mL beakers and incubated in the dark at 25 °C in 500 mL airtight, sealed jars along with 10 mL 0.1 M NaOH. After 7-day incubation, the CO2 generated was measured by titration of the excess NaOH with 0.05 M HCl [46]. An empty jar without soil was used as the control. The difference in the volume of HCl consumed between the treatment and the control was used to calculate CO2 emission from soil microorganisms. The metabolic quotient qCO2 is an important parameter that can be used to estimate soil quality and stress response. It was calculated as the microbial respiration rate (μg CO2-C h−1) per mg of Cmic [45].

2.6. Statistical Analyses

The data were tested for normality and homogeneity of distribution using skewness, kurtosis, and Shapiro–Wilk tests. Parameters that deviated from normal distribution were log-transformed (log10) before analyzing variance. The skewness and kurtosis values were between −2 and +2, indicating that the variables were normally distributed [47]. In the study, while parent material (Andesite and Limestone) and location (control and afforested) factors were taken in the statistical model, it was investigated whether there was a statistical difference between the application and bedrock averages and the existence of an interaction. Therefore, parametric test techniques were applied: an independent T-test was used for comparisons of the means of DBH and TH characteristics of pine in different parent material, and the two-way ANOVA (two-way Analysis of Variance) test was applied to the penetration area and maximum penetration properties and the sand, clay and silt percentage properties that did not meet the prerequisites of the parametric tests, after applying the inverse angle (arcsin) transformation, followed by Duncan’s multiple comparison tests (α = 0.05) for comparisons independent variables. After confirming that the data met the assumptions for parametric tests, Pearson’s linear correlation analysis was also conducted to assess the relationships between soil properties and plant growth characteristics. Discriminant analysis (DA) was employed to analyze the differences between groups of multivariate data using one or more discriminant functions to maximally separate the identified groups. The statistical analyses were carried out using the R studio 20.0 (R Core Team) and Statistical Package for the Social Sciences 22.0 (SPSS Inc., Chicago, IL, USA) and figures were generated by using the XLSTAT Windows 2018 software package.

3. Results

Under similar ecological conditions, soils formed from different bedrocks exhibited significant differences in physical and chemical properties, including sand, silt, clay content, pH, EC, SOC, TN, and C/N ratio. These variations also extended to microbial activity indicators such as MR, Cmic, qMic, and qCO2. Consequently, these differences in soil properties and microbial activity led to significant variations in the growth characteristics of the seedlings planted in the area (Table 2, Table 3 and Table 4).

3.1. Physicochemical Properties of the Soil

The results indicated significant differences in the analyzed properties of soils developed on different parent materials, with notable improvements in soils from post-afforestation sites. The two-way ANOVA test revealed that these soils’ physical, chemical, and microbiological properties were significantly different from each other and the control areas. These differences in soil properties influenced soil fertility, resulting in varying development rates among the seedlings planted in the various areas. The mean values of some physicochemical soil properties are presented in Table 2 and Table 3.
According to international soil texture classifications [48], the soils at the research sites displayed varying textures based on parent material. In the afforestation site, soils derived from limestone were classified as loamy clay, while those in the limestone control site were also clay loam. Soils from andesite were identified as sandy clay loam in the afforestation sites and sandy loam in the control area. The percentages of sand, silt, and clay differed significantly depending on the parent material. Soils from andesite had significantly higher sand content (75.25 ± 0.41 in AC and 72.58 ± 0.67 in AS) compared to those from limestone (Table 2). The difference between the average sand ratio of andesite (72.58 ± 0.674) and the average limestone sand ratio (53.50 ± 0.297) in afforested areas is statistically significant (p < 0.05). Similarly, the difference between the average andesite and limestone sand ratio in control areas is statistically significant (p < 0.05) (Table 3). Conversely, the average silt and clay contents were significantly higher in limestone-derived soils (Table 2).
The mean soil reaction (pH) values of the limestone soils statistically differed from the andesite soils (p < 0.001) (Table 3). The mean pH value in all soil samples, including controls, was found to be the highest in the LC site (Table 2). However, the lowest mean pH value was observed in the soils of the areas with AC location. Moreover, the mean pH’s (8.05 ± 0.031 and 8.17 ± 0.027) in the LS sites were higher than AS and AC sites, with 7% and 8%, respectively. The pH classification of limestone bedrock was moderately alkaline in afforestation and control sites and slightly alkaline in andesite bedrock afforestation (7.59) and control (7.56) sites. While the mean electrical conductivity (EC) values were found to be statistically different in different parent materials (p < 0.05), they were not different for locations (p > 0.05) (Table 3). On the other hand, EC values of LS soils were found to be 30% higher than AC soils and 42% higher than AS soils (Table 2).
As expected, SOC and TN contents differed significantly among parent materials and location levels (p < 0.001), but no statistically significant difference was found in the mean SOC and TN values of control plots (p > 0.05). The average SOC contents of the afforestation sites were 1.65% in andesite and 2.40% in limestone, while TN content was 0.10% in andesite and 0.19% in limestone. SOC and TN amounts in afforestation sites increased by 300% in limestone and 333% in andesite compared to control sites. These results indicate that SOC and TN levels were highest in LS (Table 2). The highest annual mean C/N ratio was observed in the AC site (22.74 ± 0.99), followed by the LC (18.76 ± 0.36), the AS, and finally, the lowest in the LS (12.61 ± 0.59). The mean C/N ratio of the AC site was 17%, 29%, and 44% higher than the LC, AS, and LS sites, respectively (Table 2). Additionally, the soil CaCO3 percentage was significantly higher in soils derived from limestone compared to andesite. After afforestation, this value decreased by 30% in limestone parent material and by 36% in andesite parent material compared to the control sites.

3.2. Soil Microbiological Properties and Stoichiometric Indices

The significant changes were determined in the Cmic values of the areas after afforestation. The highest average Cmic values in soil samples were found in the LS site (323.20 ± 20.50 μg C g−1), while the lowest was found in the AC site (35.09 ± 1.09 μg C g−1) (Table 2). In addition, statistically significant differences were determined between the Cmic amount of afforested and control areas in andesite locations (p < 0.001) (Table 3). Similarly, the highest average microbial respiration (MR) rate (1.30 ± 0.08 μg CO2–C g−1 h−1) from different soil samples was found in LS soil, followed by AS (0.62 ± 0.05 μg CO2–C g−1 h−1), LC (0.35 ± 0.01 μg CO2–C g−1 h−1) and AC (0.25 ± 0.008 μg CO2–C g−1 h−1), respectively (Table 2). Cmic and MR values of soils increased by approximately 530% with afforestation on both parent materials. The highest mean value of the Cmic/Corg (qMic) ratio was found in the LS site at 1.39 ± 0.07, while the lowest value was observed in AC sites at 0.59 ± 0.03 (Table 2). MR, Cmic, and qMic values were ranked from largest to smallest as LS > AS > LC > AC. The highest and lowest qCO2 values of soil samples were recorded in AC (7.14 ± 0.24) and AS (3.37 ± 0.27) sites, respectively (Table 2). The qCO2 values of control sites were found to be significantly higher than afforested sites. Additionally, significant statistical differences were found between the qCO2 amounts of afforested areas in andesite locations and control areas (p < 0.001) (Table 3). The qCO2 index order is AC > LC > LS > AS, unlike other microbial properties and indices.

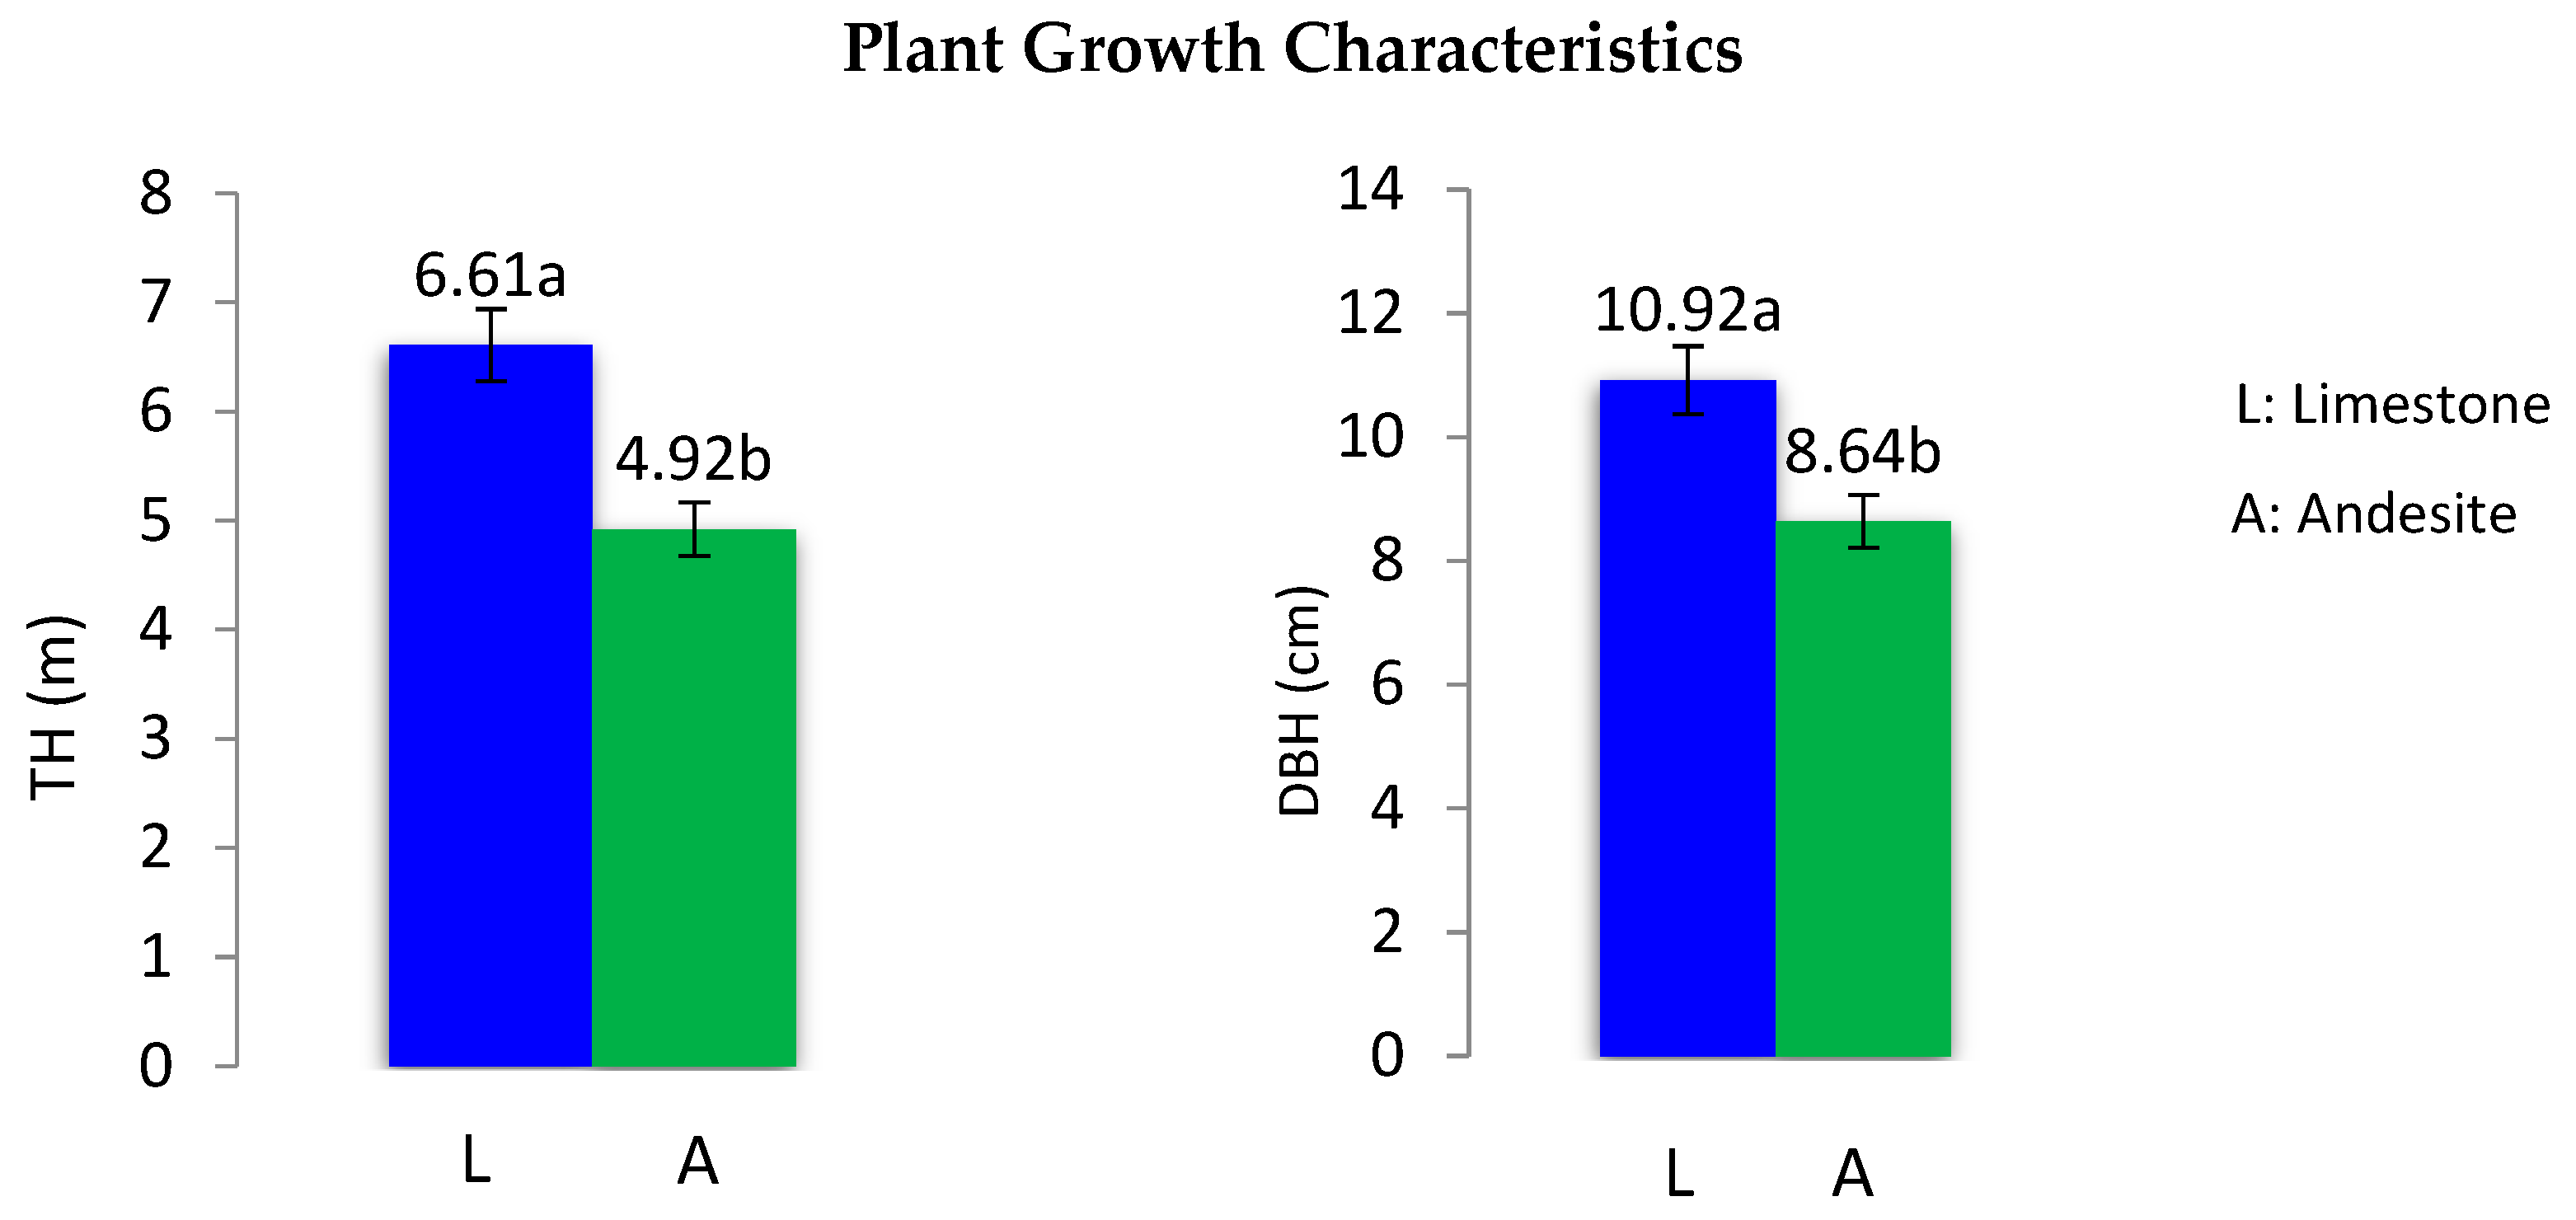
3.3. Plant Growth Characteristics

Independent T-test revealed that plant growth traits were significantly different according to parent materials. The average diameter at breast height (DBH) of the saplings on limestone bedrock was 10.92 cm, compared to 8.64 cm on andesite parent material. Similarly, the average tree height (TH) of saplings on limestone parent material was 6.61 m, while it was 5.54 m on andesite parent material (Table 4 and Figure 1). These results indicate that, following afforestation, the average height and diameter of saplings on limestone parent material were 20% and 25% higher, respectively, than those on andesite parent material, despite the presence of the same tree species and ecological conditions (Figure 1).
The Pearson correlation coefficients between TH, DBH, Cmic, MR, qMic, qCO2, SOC, TN, pH, EC, CaCO3, sand, silt, and clay were calculated for both afforested and control areas (Figure 2). It was determined that there were positive correlations between TH and dust, clay, pH, EC, SOC, TN, CaCO3, Cmic, and DBH (p ≤ 0.001). The highest positive correlations with TH were shown by clay, CaCO3, DBH, and Cmic, respectively. Again, the highest positive correlation values were found between DBH and CaCO3, Cmic, MR, and Clay, from largest to smallest, respectively. Here, it was determined that microbial parameters had a positive effect on plant growth parameters, at least at the significance level of 0.05. In addition, all of the physicochemical properties of the soils, except sand and C/N ratio, showed positive correlations with plant growth parameters. Other interesting positive correlation values were found between Cmic, SOC, and TN. On the other hand, the highest negative correlations were found between plant growth parameters and sand and C/N (Figure 2a).
In addition, when the relationships of soil properties in control areas belonging to different bedrocks were examined according to Pearson correlation, it was determined that sand, C/N, and qCO2 values had a significant negative relationship with clay, silt, pH, EC, CaCO3, Cmic, MR, qMic. Except for qCO2, the microbial indices of the soil showed the highest positive correlation with clay, dust, and CaCO3 among the physicochemical properties (p < 0.001) (Figure 2b).
Discriminant analysis (DA) was able to distinguish between soils formed from limestone and andesite bedrocks in terms of physicochemical, microbiological properties, and plant growth parameters (Figure 3). The soil variables contributing to the classification and the values of the three canonical functions are shown in Table 4. Evaluations were made by accepting significant values above 0.3 [49]. Eigenvalues for the first two axes in all soil samples were 1.027 and 0.841, respectively, and explained 61.53% and 24.25% of the total variance (Figure 3). Correlation coefficients show that DA axis 1 has the strongest correlation with qMic, C/N, qCO2, TH, DBH, and clay, respectively. DA axis 2 is seen to be mainly related to SOC, TN, Cmic, and MR, respectively, with the strongest correlation (Figure 3). Standardized canonical discriminant function coefficients of soil properties are given in Table 5.

4. Discussion

In this study, it was revealed that physicochemical and microbiological soil properties, as well as plant growth parameters, were significantly affected by the type of parent material. Limestone soils formed fine-grained soils with significantly lower sand and higher silt and clay. In other words, andesite produced coarse-grained soils with significantly higher sand and lower silt and clay percentages. Notably, the afforestation sites decreased sand and dust percentages compared to the control sites, while the clay percentages increased (Table 2). Some studies indicated that soils developed from limestone bedrock had lower sand and higher clay and silt contents than other bedrock types, such as granite acrostic [4] and andesite [1]. Similarly, ref. [3] determined that the grain sizes of soils from granite, granodiorite, and schist bedrocks were different.
The parent material difference also influenced the chemical properties of soils, such as pH, EC, SOC, TN, and CaCO3, in both control and afforestation sites. Previous studies have reported significant variations in soil pH values due to differences in parent material [1,3,4]. The EC values of soils from both parent materials at the study sites were below the critical salinity level of 0.20 dS m−1. SOC and TN content differed significantly depending on the parent material and were higher in afforestation sites compared to control sites. The increase in carbon and nitrogen sources in soils after afforestation affects the quality and quantity of organic material, including litter production [50], root exudates [51], and microbial community structure and activity [15]. Plant residues such as leaves, cones, and branches contribute to increased SOC and TN levels in the ecosystem [31,52,53]. Moreover, factors like higher clay content, tree presence [54,55,56], root exudates, and plant residues [15] promote soil formation. While the effect of bedrock on soil properties was observed in control sites, afforestation, particularly with Scots pine, appears to have significantly contributed to the increases in SOC and TN. The concentration of SOC and TN in the study area may be lower than in mature forests, as only fifteen years have passed since afforestation. It may take a longer period for litter to accumulate on the soil surface and integrate into the soil. Typically, SOC and TN concentrations are higher in the topsoil layer (0–20 cm) due to litter accumulation [4,31,32]. As expected, CaCO3 content was significantly higher in soils with limestone parent material, attributed to the inherent lime content of limestone. There was a notable decrease in CaCO3 content after afforestation, likely due to plant influence on soil formation. It has been reported that afforestation with different species can reduce the amount of lime in the soil, particularly in the topsoil [1]. Limestone soils are characterized by alkaline properties and texture variations between sand (sandstone) and clay (shale) [57].
The chemical properties of soils, such as pH, SOC, and TN, and microbial properties of Cmic, Nmic, MR, and other indices are important sensitive indicators affected by several factors such as seasonality, tree species, bedrock properties, and soil properties [16,58]. The available Cmic in soils directly indicates the microbial biomass pool in the soil. The study results illustrated that the parent material significantly affects the Cmic concentrations in soils. Mahia et al. [50] stated that schist was significantly different from granite parent material in Cmic, while Babur [1] reported that soils developed from limestone parent material had higher Cmic than andesite. In addition, the afforestation of bare land contributes to the nutrient cycle of the ecosystem, ecosystem productivity, soil quality, and the increase in the amount of soluble and storable organic C in the soil with the input of organic matter from litter and dead roots [59,60]. Increased organic carbon in soil also affects the biological properties of soils [61]. Soil Cmic is generally dependent on soil organic matter as a substrate [24]. In addition, exudates brought to the soil by plant roots can increase Cmic accumulation, especially in topsoil [62]. In this article, it was confirmed that the increased organic matter input after afforestation also significantly increased the Cmic amount.
Microbial respiration (MR) is a key factor in monitoring decomposition processes in soils [34,46]. MR reflects the oxidation status of the soil by microbes and is considered one of the most important and sensitive indicators of the soil carbon cycle [63,64]. Babur et al. [32] found significant differences in microbial biomass carbon (Cmic) and MR values among different tree species. Similarly, it was reported that optimum soil temperature and moisture content, which enhance microbial activities in different tree plantations, typically occur during rainy seasons [65].
The qMic values of all soil samples were found to be within the range suggested by Anderson and Domsch [66]. qMic can be used to quickly estimate the change in organic C [67] and to compare soil quality parameters in ecosystems with different organic matter [61]. The qMic ratio is determined by using the relationship between microbial biomass carbon and soil organic carbon [68]. The qMic ratio of andesite soils of the study areas was lower than that of limestone. This provided more suitable conditions for the growth of soil microorganisms in the limestone bedrock. Although the average qMic values increased after afforestation, this value remained low for fertile lands and did not reach equilibrium 15 years after afforestation. The qMic value is estimated by microbial activity, i.e., soil basal respiration and organic carbon cycling within an ecosystem [34,69]. Higher MR and Cmic amounts in limestone soils indicated that it had more microbial activity, proving faster decomposition.
The qCO2 is often used to describe the soil stress response of an ecosystem [69]. Environmental stresses, nutrient scarcity, and substrate resistance to decomposition can increase qCO2 [70]. On the other hand, the productivity of the area can be increased by using natural vegetation in stressed areas [71]. Although Anderson [69] reported that qCO2 values in neutral soils ranged from 0.5 to 2.0 μg CO2-C g−1Cmic h−1, in this study, the average qCO2 values in areas afforested with andesite and limestone bedrocks were found to be 3.37 to 4.06 μg CO2-C g−1Cmic h−1, respectively. This may cause microbial respiration to increase, decomposition to slow down, and energy to be consumed in it. Low qCO2 rate in soils provides positive information about efficient carbon use for that soil, low environmental stress levels, usable nutrients being free in the area, microbial activity, and soil quality [22].
The qCO2 and OC mineralization rates in soil constitute the basis of the carbon cycle in terrestrial ecosystems [10,72]. SOC content negatively correlated with the metabolic coefficient in both parent materials. Some studies have noted that OC and qCO2 in different forest soils are closely related [1,62]. As a result of the correlation analysis, it was determined that basal respiration was positively correlated with soil organic carbon in both parent materials. Similar results were found with Cheng and Xia [73].
Differences in parent material and soil properties showed significant differences in plant growth parameters such as TH and DBH. In particular, Scots pines on limestone bedrock were 20% and 25% larger in height and diameter than on andesite bedrock, respectively. There are many studies on the importance of the effects of habitat properties on plant yield and growth characteristics [74,75,76]. Microbiological, physical, and chemical soil properties can improve as the age of the afforested area. Afforestation and rehabilitation practices in forest management contribute to the health and productivity of soils and support the restoration of soil microbial activities [10,52].
Available C fractions are one of the most important environmental factors affecting soil microbial activity [22,59]. Analyses performed on soil samples, particularly microbial biomass, MR, and other indices, may be responsible for the separation of different parent materials and control areas with DA because the parent material is an important factor in soil formation, and tall plants also provide more living space and substrate for microbial communities in soils with their aboveground and belowground biomass and waste. Improvement of microorganisms’ living environments can also be understood by the increase in qMic value and decrease in qCO2 value [77,78]. In fact, from our research, it was determined that there was an increase in qMic amount and a decrease in qCO2 amount in soils on both bedrocks after afforestation. Both growth data (DBH and TH) were positively correlated with all soil properties except sand percentage and C/N. These results provide strong evidence that afforestation on different bedrocks results in different soil properties and microbial communities compared to bare lands.

5. Conclusions

In this study, it was determined that the physicochemical and microbiological properties of soils formed from different parent materials were different, and this significantly affected the growth parameters of the planted seedlings. It was determined that the fertility of soils in terrestrial ecosystems was significantly affected primarily by the type of parent material and then by the presence of vegetation on it. The fact that limestone parent rock can be easily decomposed compared to andesite and that it creates deep and fertile soil allowed Scots pine trees to grow better on limestone parent rocks. It was shown that afforestation contributed to the increase in organic C and N, especially in the upper soils in bare lands, and this contributed to the increase in microbial biomass and activity in the soils. Soils from limestone parent rocks afforested with Scots pine were energetically more efficient (had a lower qCO2) with more microbial biomass and a higher qMic (Cmic/Corg) compared to andesite soils. This study emphasized how important parent material is in terrestrial ecosystems and that it directly affects soil microbial activity. In particular, afforestation provides substrate and C to the ecosystem via tree litter, thus increasing soil microbial communities and activities. Since the measured microbial parameters are sensitive to changes in the ecosystem, they may have the potential to be used as indicators of forest management on soil organic matter quality. In order to ensure data continuity in such areas and to verify the data of afforestation sites in arid and semi-arid areas, more comprehensive studies are required. In afforestation to be made on andesite bedrocks, more care should be taken, and maintenance, fertilization, and even irrigation during periods of water stress can contribute to the growth of seedlings and environmental fertility. In the afforestation of arid and semi-arid areas, should be paid to selecting local species and close origins. In addition, it would be more appropriate to make afforestation using mixed species with leaves and conifers to increase the ecological sensitivity limit. Thus, ecosystem diversity, nutrient cycle, and soil C input will be supported.

Funding

This research received no external funding.

Institutional Review Board Statement

Not applicable.

Informed Consent Statement

Not applicable.

Data Availability Statement

The original contributions presented in the study are included in the article, further inquiries can be directed to the corresponding author.

Acknowledgments

Thank Muhammed PALA for helping me in my field study.

Conflicts of Interest

The author declares no conflicts of interest.

References

  1. Babur, E. Effects of parent material on soil microbial biomass carbon and basal respiration within young afforested areas. Scand. J. For. Res. 2019, 34, 94–101. [Google Scholar] [CrossRef]
  2. Lavee, H.; Imeson, A.C.; Sarah, P. The impact of climate change on geomorphology and desertification along a Mediterranean-arid transect. Land Degrad. Dev. 1998, 9, 407–424. [Google Scholar] [CrossRef]
  3. Kooijman, A.M.; Jongejans, J.; Sevink, J. Parent material effects on Mediterranean woodland ecosystem in NE Spain. Catena 2005, 59, 55–68. [Google Scholar] [CrossRef]
  4. Gökbulak, F.; Özcan, M. Hydro-physical properties of soils developed from different parent materials. Geoderma 2008, 145, 376–380. [Google Scholar] [CrossRef]
  5. Birkeland, P.W. Pedology, Weathering and Geomorphological Research; Oxford University Press: New York, NY, USA, 1974. [Google Scholar]
  6. Johnson, D.L. Darwin would be proud: Bioturbation, dynamic denudation, and the power of theory in science. Geoarchaeology 2002, 17, 7–40. [Google Scholar] [CrossRef]
  7. Gabet, E.J.; Reichmann, O.J.; Seabloom, E.W. The effects of bioturbation on soil processes and sediment transport. Annu. Rev. Earth Planet. Sci. 2003, 31, 249–273. [Google Scholar] [CrossRef]
  8. Phillips, J.D.; Marion, D.A. Biomechanical effects, litholological variability, and pedodiversity in some forest soils of Arkansas. Geoderma 2004, 124, 73–89. [Google Scholar] [CrossRef]
  9. Phillips, J.D.; Marion, D.A. Biomechanical Effects of Trees on Soil and Regolith: Beyond Treethrow. Ann. Assoc. Am. Geogr. 2006, 96, 233–247. [Google Scholar] [CrossRef]
  10. Kara, O.; Babur, E.; Altun, L.; Seyis, M. Effects of afforestation on microbial biomass C and respiration in eroded soils of Turkey. J. Sustain. For. 2016, 35, 385–396. [Google Scholar] [CrossRef]
  11. Anderson, D.W. The effect of parent material and soil development on nutrient cycling in temperate ecosystems. Biogeochemistry 1988, 5, 71–97. [Google Scholar] [CrossRef]
  12. Turkish Ministry of Agriculture and Forestry. The Afforestation and Erosion Control National Mobilization Action Plan (2008–2012) and Combating with Erosion Action Plan (2013–2017); Turkish Ministry of Agriculture and Forestry: Ankara, Turkey, 2008.
  13. Lamb, D.; Erskine, P.D.; Parrotta, J.A. Restoration of degraded tropical forest landscapes. Science 2005, 310, 1628–1632. [Google Scholar] [CrossRef]
  14. Silver, W.L.; Kueppers, L.M.; Lugo, A.E.; Ostertag, R.; Matzek, V. Carbon sequestration and plant community dynamics following reforestation of tropical pasture. Ecol. Appl. 2004, 14, 1115–1127. [Google Scholar] [CrossRef]
  15. Grayston, S.J.; Vaughan, D.; Jones, D. Rhizosphere carbon flow in trees, in comparison with annual plants: The importance of root exudation and its impact on microbial activity and nutrient availability. Appl. Soil Ecol. 1996, 5, 29–56. [Google Scholar] [CrossRef]
  16. Babur, E.; Dindaroglu, T.; Danish, S.; Haggblom, M.M.; Ozlu, E.; Gozukara, G.; Uslu, O.S. Spatial responses of soil carbon stocks, total nitrogen, and microbial indices to post-wildfire in the Mediterranean red pine forest. J. Environ. Manag. 2022, 320, 115939. [Google Scholar] [CrossRef]
  17. Bauhus, J.D.; Pare, D.; Cote, L. Effects of tree species, stand age, and soil type on soil microbial biomass and its activity in a southern boreal forest. Soil Biol. Biochem. 1998, 30, 1077–1089. [Google Scholar] [CrossRef]
  18. Kara, O.; Bolat, I. The effect of different land uses on soil microbial biomass carbon and nitrogen in Bartin Province. Turk. J. Agric. For. 2008, 32, 281–288. [Google Scholar]
  19. Yang, Y.; Guo, J.; Chen, G.; Yin, Y.; Gao, R.; Lin, C. Effects of forest conversion on soil labile organic carbon fractions and aggregate stability in subtropical China. Plant Soil 2009, 323, 153–162. [Google Scholar] [CrossRef]
  20. Pandey, C.B.; Singh, G.B.; Singh, S.K.; Singh, R.K. Soil nitrogen and microbial biomass carbon dynamics in native forests and derived agricultural land uses in a humid tropical climate of India. Plant Soil 2010, 333, 453–467. [Google Scholar] [CrossRef]
  21. Korkanç, S.Y. Effects of afforestation on soil organic carbon and other soil properties. Catena 2014, 123, 62–69. [Google Scholar] [CrossRef]
  22. Babur, E.; Dindaroglu, T.; Solaiman, Z.M.; Battaglia, M.L. Microbial Respiration, Microbial Biomass and Activity Are Highly Sensitive to Forest Tree Species and Seasonal Patterns in the Eastern Mediterranean Karst Ecosystems. Sci. Total Environ. 2021, 775, 145868. [Google Scholar] [CrossRef]
  23. Wang, B.; Jiang, Y.; Wei, X.; Zhao, G.; Guo, H.; Bai, X. Effects of forest type, stand age, and altitude on soil respiration in subtropical forests of China. Scand. J. For. Res. 2011, 26, 40–47. [Google Scholar] [CrossRef]
  24. Babur, E.; Kara, O.; Fathi, R.; Susam, Y.; Riaz, M.; Arif, M.; Akhtar, K. Wattle fencing improved soil aggregate stability, organic carbon stocks and biochemical quality by restoring highly eroded mountain region soil. J. Environ. Manag. 2021, 288, 112489. [Google Scholar] [CrossRef] [PubMed]
  25. Singh, B.K.; Munro, S.; Potts, J.M.; Millard, P. Influence of grass species and soil type on rhizosphere microbial community structure in grassland soils. Appl. Soil Ecol. 2007, 36, 147–155. [Google Scholar] [CrossRef]
  26. Wakelin, S.A.; Macdonald, L.M.; Rogers, S.L.; Gregg, A.L.; Bolger, T.P.; Baldock, J.A. Habitat selective factors influencing the structural composition and functional capacity of microbial communities in agricultural soils. Soil Biol. Biochem. 2008, 40, 803–813. [Google Scholar] [CrossRef]
  27. Bezemer, T.M.; Lawson, C.S.; Hedlund, K.; Edwards, A.R.; Brook, A.J.; Igual, J.M.; Van Der Putten, W.H. Plant species and functional group effects on abiotic and microbial soil properties and plant-soil feedback responses in two grasslands. J. Ecol. 2006, 94, 893–904. [Google Scholar] [CrossRef]
  28. Lamb, E.G.; Kennedy, N.; Siciliano, S.D. Effects of plant species richness and evenness on soil microbial community diversity and function. Plant Soil 2011, 338, 483–495. [Google Scholar] [CrossRef]
  29. Fernández-Ondoño, E.; Rojo Serrano, L.; Jiménez, M.N.; Navarro, F.B.; Díez, M.; Martín, F.; Aguilar, J. Afforestation improves soil fertility in south-eastern Spain. Eur. J. For. Res. 2010, 129, 707–717. [Google Scholar] [CrossRef]
  30. Prescott, C.E.; Grayston, S.J. Tree species influence on microbial communities in litter and soil: Current knowledge and research needs. For. Ecol. Manag. 2013, 309, 19–27. [Google Scholar] [CrossRef]
  31. Babur, E.; Dindaroğlu, T.; Riaz, M.; Uslu, O.S. Seasonal Variations in Litter Layers’ Characteristics Control Microbial Respiration and Microbial Carbon Utilization under Mature Pine, Cedar, and Beech Forest Stands in the Eastern Mediterranean Karstic Ecosystems. Microb. Ecol. 2022, 84, 153–167. [Google Scholar] [CrossRef]
  32. Sariyildiz, T.; Tüfekçioglu, A.; Küçük, M. Comparison of Decomposition Rates of Beech (Fagus orientalis Lipsky) and Spruce (Picea orientalis (L.) Link) Litter in Pure and Mixed Stands of Both Species in Artvin, Turkey. Turk. J. Agric. For. 2005, 29, 429–438. [Google Scholar]
  33. Babur, E.; Dindaroğlu, T.; Roy, R.; Seleiman, M.F.; Ozlu, E.; Battaglia, M.L.; Uslu, Ö.S. Relationship between organic matter and microbial biomass in different vegetation types. In Microbial Syntrophy-Mediated Eco-Enterprising; Elsevier: Amsterdam, The Netherlands, 2022; pp. 225–245. [Google Scholar]
  34. Winding, A.; Hund-Rinke, K.; Rutgers, M. The use of microorganisms in ecological soil classification and assessment concepts. Ectoxicol. Environ. Saf. 2005, 62, 230–248. [Google Scholar] [CrossRef]
  35. Akburak, S.; Son, Y.; Makineci, E.; Çakir, M. Impacts of Low-Intensity Prescribed Fire on Microbial and Chemical Soil Properties in a Quercus Frainetto Forest. J. For. Res. 2018, 29, 687–696. [Google Scholar] [CrossRef]
  36. Bolat, I. Microbial Biomass, Basal Respiration, and Microbial Indices of Soil in Diverse Croplands in a Region of Northwestern Turkey (Bartın). Environ. Monit. Assess. 2019, 191, 695. [Google Scholar] [CrossRef] [PubMed]
  37. Lawrence, P.G.; Roper, W.; Morris, T.F.; Guillard, K. Guiding soil sampling strategies using classical and spatial statistics: A review. Agron. J. 2020, 112, 493–510. [Google Scholar] [CrossRef]
  38. Bouyoucos, G.J. Hydrometer method improved for making particle size analyses of soils. Agron J. 1962, 54, 464–465. [Google Scholar] [CrossRef]
  39. Walkley, A.; Black, A.I. An examination of the Degtjareff method for determining soil organic matter, and proposed modification of the chromic acid titration method. Soil Sci. 1934, 37, 29–38. [Google Scholar] [CrossRef]
  40. Bremner, J.M.; Mulvaney, C.S. Nitrogen-total. In Methods of Soil Analysis, Part 2 Chemical and Microbiological Properties. SSSA Book Series No: 9; Page, A.L., Ed.; Madison: London, UK, 1982; pp. 595–622. [Google Scholar]
  41. Rowell, D.L. Soil Science; Methods and Applications; Longman Publishers (Pte) Ltd.: Singapore, 1994; p. 350. [Google Scholar]
  42. Horwath, W.R.; Paul, E.A. Microbial biomass. In Methods of Soil Analysis, Part 2. Microbiological and Biochemical Properties-SSSA Book Series, No. 5; Soil Science Society of America: Madison, WI, USA, 1994; pp. 753–773. [Google Scholar]
  43. Brookes, P.C.; Landman, A.; Pruden, G.; Jenkinson, D.S. Chloroform Fumigation and the Release of Soil Nitrogen: A Rapid Direct Extraction Method to Measure Microbial Biomass Nitrogen in Soil. Soil Biol. Biochem. 1985, 17, 837–842. [Google Scholar] [CrossRef]
  44. Vance, E.D.; Brookes, P.C.; Jenkinson, D.S. An extraction method for measuring soil microbial biomass C. Soil Biol. Biochem. 1987, 19, 703–707. [Google Scholar] [CrossRef]
  45. Dilly, O.; Munch, J.C. Ratios between estimates of microbial biomass content and microbial activity in soils. Biol. Fertil. Soils 1998, 27, 374–379. [Google Scholar] [CrossRef]
  46. Alef, K. Soil respiration. In Methods in Applied Soil Microbiology and Biochemistry; Alef, K., Nannipieri, P., Eds.; Academic: London, UK, 1995; pp. 214–219. [Google Scholar]
  47. George, D.; Mallery, P. SPSS for Windows Step by Step: A Simple Guide and Reference, 17.0 Update, 10th ed.; Pearson: Boston, MA, USA, 2010. [Google Scholar]
  48. USDA. Department of Agriculture Soil Survey of Lafayette Parish; USDA: Alexandria, LA, USA, 1977; p. 92.
  49. Hair, J.F.; Anderson, R.E., Jr.; Tatham, R.L.; Black, W.C. Multivariate Data Analysis: With Readings; Macmillan: New York, NY, USA, 1992. [Google Scholar]
  50. Mahía, J.; Pérez-Ventura, L.; Cabaneiro, A.; Díaz-Raviña, M. Soil microbial biomass under pine forests in the north-western Spain: Influence of stand age, site index and parent material. Sist Rec. For. 2006, 15, 152–159. [Google Scholar] [CrossRef]
  51. Paul, K.I.; Polglase, P.J.; Nyakuengama, J.G.; Khanna, P.K. Change in soil carbon following afforestation. For. Ecol. Manag. 2002, 168, 241–257. [Google Scholar] [CrossRef]
  52. Babur, E.; Dindaroglu, T. Seasonal changes of soil organic carbon and microbial biomass carbon in different forest ecosystems. In Environmental Factors Affecting Human Health, Ivan Uher; IntechOpen: London, UK, 2020. [Google Scholar]
  53. Rothe, A.; Cromack KJr Resh, S.C.; Makineci, E.; Son, Y. Soil carbon and nitrogen changes under Douglas-fir with and without red alder. Soil Sci. Soc. Am. J. 2002, 66, 1988–1995. [Google Scholar] [CrossRef]
  54. Abdalmoula, M.M.; Makineci, E.; Özturna, A.G.; Pehlivan, S.; Şahin, A.; Tolunay, D. Soil organic carbon accumulation and several physicochemical soil properties under stone pine and maritime pine plantations in coastal dune, Durusu-Istanbul. Environ. Monit. Assess 2019, 191, 312–326. [Google Scholar] [CrossRef] [PubMed]
  55. Oostra, S.; Majdi, H.; Olsson, M. Impact of tree species on soil carbon stocks and soil acidity in southern Sweden. Scand. J. For. Res. 2006, 21, 364–371. [Google Scholar] [CrossRef]
  56. Yildiz, O.; Esen, D.; Karaoz, O.M.; Sarginci, M.; Toprak, B.; Soysal, Y. Effects of different site preparation methods on soil carbon and nutrient removal from Eastern beech regeneration sites in Turkey’s Black Sea region. Appl. Soil Ecol. 2010, 45, 49–55. [Google Scholar] [CrossRef]
  57. Kantarcı, D. Soil Science Lessons Book; Publications of Istanbul University, Faculty of Forestry, Department of Soil Science and Ecology: Istanbul, Turkey, 2000; p. 420. [Google Scholar]
  58. Das, S.; Deb, S.; Sahoo, S.S.; Sahoo, U.K. Soil Microbial Biomass Carbon Stock and Its Relation with Climatic and Other Environmental Factors in Forest Ecosystems: A Review. Acta Ecol. Sin. 2023, 43, 933–945. [Google Scholar] [CrossRef]
  59. Yüksek, T. The restoration effects of black locust (Robinia pseudoacacia L.) plantation on surface soil properties and carbon sequestration on lower hillslopes in the semi-humid region of Coruh Drainage Basin in Turkey. Catena 2012, 90, 18–25. [Google Scholar] [CrossRef]
  60. Uslu, O.S.; Babur, E.; Battaglia, M.L.; Turkkaya, E.; Seleiman, M.F.; Roy, R.; Dindaroglu, T. Effects of gyttja applications on hay yield and quality of a rangeland in the Mediterranean region. Int. J. Environ. Sci. Technol. 2023, 20, 4139–4150. [Google Scholar] [CrossRef]
  61. Wang, Q.K.; Wang, S.L. Soil organic matter under different forest types in Southern China. Geoderma 2007, 142, 349–356. [Google Scholar] [CrossRef]
  62. Tian, J.; Fan, M.; Guo, J.; Marschner, P.; Li, X.; Kuzyakov, Y. Effects of land use intensity on dissolved organic carbon properties and microbial community structure. Euro. J. Soil Biol. 2012, 52, 67–72. [Google Scholar] [CrossRef]
  63. Soong, J.L.; Fuchslueger, L.; Marañon-Jimenez, S.; Torn, M.S.; Janssens, I.A.; Penuelas, J.; Richter, A. Microbial Carbon Limitation: The Need for Integrating Microorganisms into Our Understanding of Ecosystem Carbon Cycling. Glob. Chang. Biol. 2020, 26, 1953–1961. [Google Scholar] [CrossRef] [PubMed]
  64. Tomar, U.; Baishya, R. Seasonality and Moisture Regime Control Soil Respiration, Enzyme Activities, and Soil Microbial Biomass Carbon in a Semi-Arid Forest of Delhi, India. Ecol. Process 2020, 9, 50. [Google Scholar] [CrossRef]
  65. Edwards, C.A.; Arancon, N.Q. The Role of Earthworms in Organic Matter and Nutrient Cycles. In Biology and Ecology of Earthworms; Springer: New York, NY, USA, 2022; pp. 233–274. [Google Scholar] [CrossRef]
  66. Anderson, T.H.; Domsch, K.H. Ratios of microbial biomass carbon to total organic carbon in arable soils. Soil Biol. Biochem. 1989, 21, 471–479. [Google Scholar] [CrossRef]
  67. Sparling, G.P. Ratio of microbial biomass carbon to soil organic carbon as a sensitive indicator of changes in soil organic matter. Soil Res. 1992, 30, 195–207. [Google Scholar] [CrossRef]
  68. Insam, H.; Domsch, K.H. Relationship between soil organic carbon and microbial biomass on chronosequences of reclamation sites. Microb. Ecol. 1988, 15, 177–188. [Google Scholar] [CrossRef] [PubMed]
  69. Anderson, T.H. Microbial eco-physiological indicators to assess soil quality. Agr. Ecosyst. Environ. 2003, 98, 285–293. [Google Scholar] [CrossRef]
  70. Spohn, M. Microbial respiration per unit microbial biomass depends on litter layer carbon-to-nitrogen ratio. Biogeoscience 2015, 12, 817–823. [Google Scholar] [CrossRef]
  71. Sinsabaugh, R.L.; Manzoni, S.; Moorhead, D.L.; Richter, A.; Elser, J. Carbon use efficiency of microbial communities: Stoichiometry, methodology and modeling. Ecol. Lett. 2013, 16, 930–939. [Google Scholar] [CrossRef]
  72. Hartman, W.H.; Ye, R.; Horwath, W.R.; Tringe, S.G. A genomic perspective on stoichiometric regulation of soil carbon cycling. ISME J. 2017, 11, 2652–2665. [Google Scholar] [CrossRef]
  73. Cheng, Y.B.; Xia, Y.D. Soil microbial and enzymatic activities across a chronosequence of Chinese Pine plantation development on the Loess Plateau of China. Pedosphere 2012, 22, 1–12. [Google Scholar]
  74. Khalil, H.A.; Hossain, M.S.; Rosamah, E.; Azli, N.A.; Saddon, N.; Davoud Poura, Y.; Islam, M.N.; Dungani, R. The role of soil properties and it’s interaction towards quality plant fiber: A review. Renew. Sustain. Energy Rev. 2015, 43, 1006–1015. [Google Scholar] [CrossRef]
  75. Lembrechts, J.J.; Rossi, E.; Milbau, A.; Nijs, I. Habitat properties and plant traits interact as drivers of non-native plant species’ seed production at the local scale. Ecol. Evol. 2018, 8, 4209–4223. [Google Scholar] [CrossRef] [PubMed]
  76. Martins-Noguerol, R.; Matías, L.; Pérez-Ramos, I.M.; Moreira, X.; Francisco, M.; Pedroche, J.; DeAndrés-Gil, C.; Gutiérrez, E.; Salas, J.J.; Moreno-Pérez, A.J.; et al. Soil Physicochemical Properties Associated with the Yield and Phytochemical Composition of the Edible Halophyte Crithmum Maritimum. Sci. Total Environ. 2023, 869, 161806. [Google Scholar] [CrossRef] [PubMed]
  77. Sarkara, S.; Dasb, D.K.; Singhc, A.; Laikd, R.; Singh, S.K.; van Es, H.M.; Krishnanf, K.; Singhg, A.K.; Dasa, A.; Singh, U.; et al. Seasonal variations in soil characteristics control microbial respiration and carbon use under tree plantations in the Middle Gangetic region. Heliyon 2024, 10, e35593. [Google Scholar] [CrossRef]
  78. Babur, E. Short-term monitoring of the winching and skidding effects on soil microbial biomass in Turkish red pine in the Mediterranean Region. Eurasian J. Forest Sci. 2021, 9, 107–121. [Google Scholar] [CrossRef]
Figure 1. Changes in plant growth characteristics in different parent material sites. Different letters above the bars indicate significant differences at p < 0.05 among the land use types.
Life 14 01139 g001
Figure 2. Correlation maps of soil samples of different parent material afforested (a) and control (b) sites according to correlation coefficient matrix (R-values) for physical, chemical, and microbiological characteristics of soils in different land uses.
Life 14 01139 g002
Figure 3. Scatter plot of the first two discriminant function values in soil samples.
Life 14 01139 g003
Table 1. Study site characteristics.
Environmental FactorsLimestoneAndesite
SampleControlSampleControl
Longitude39°33′19″39°33′46″39°33′43″39°33′23″
Latitude40°21′08″40°21′23″40°21′20″40°21′07″
Altitude mean (m)1480152015001450
Slope degree mean (%)50404550
Afforestation date2005-2005-
Vegetation typeScots PineBare spaceScots PineBare space
Stand canopy (%)70–100-70–100-
Soil textureLoamy clayClay loamSandy clay loamSandy loam
pH classModerately AlkalineSlightly AlkalineModerately AlkalineSlightly Alkaline
Table 2. Mean ± standard deviation and Duncan multiple comparison results for the soil properties considered for each parent material and location.
Soil PropertiesLocationsParent MaterialParent Material
Mean ± SE
AndesiteLimestone
Sand (%)Afforested72.6 ± 0.674 Ab53.5 ± 0.297 Bb63.04 ± 2.2
Control75.3 ± 0.408 Aa59.7 ± 0.286 Ba67.47 ± 1.8
Location Mean ± SE73.9 ± 0.49156.6 ± 0.739
Clay (%)Afforested16.8 ± 0.683 Ba31.1 ± 0.840 Aa23.96 ± 1.7
Control11.1 ± 0.467 Bb18.4 ± 0.429 Ab14.77 ± 0.89
Location Mean ± SE13.98 ± 0.76624.75 ± 1.530
Silt (%)Afforested10.6 ± 0.334 Bb15.40 ± 0.918 Aa13.00 ± 0.73
Control13.7 ± 0.255 Bb21.90 ± 0.212 Aa17.81 ± 0.95
Location Mean ± SE12.16 ± 0.41218.65 ± 0.875
pHAfforested7.59 ± 0.030 Aa8.05 ± 0.031 Ab7.82 ± 0.06
Control7.56 ± 0.043 Ba8.17 ± 0.027 Aa7.87 ± 0.08
Location Mean ± SE7.57 ± 0.0268.11 ± 0.025
EC (dS m−1)Afforested0.12 ± 0.0070.18 ± 0.0120.15± 0.01
Control0.13 ± 0.0020.18 ± 0.0050.16± 0.01
Location Mean ± SE0.13 ± 0.004 b0.18 ± 0.006 a
SOC (%)Afforested1.65 ± 0.014 Ba2.40 ± 0.254 Aa2.03 ± 0.15
Control0.61 ± 0.035 Ab0.79 ± 0.031 Ab0.70 ± 0.03
Location Mean ± SE1.13 ± 0.1211.60 ± 0.223
TN (%)Afforested0.10 ± 0.005 Ba0.19 ± 0.014 Aa0.15 ± 0.01
Control0.03 ± 0.002 Ab0.04 ± 0.001 Ab0.04 ± 0.00
Location Mean ± SE0.07 ± 0.0090.12 ± 0.018
C/NAfforested16.22 ± 0.75612.61 ± 0.59314.42 ± 0.63 b
Control22.74 ± 0.98518.72 ± 0.35620.73 ± 0.69 a
Location Mean ± SE19.48 ± 0.961 a15.67 ± 0.778 b
CaCO3 (%)Afforested4.62 ± 1.660 Aa26.66 ± 2.780 Ba15.64 ± 2.98
Control4.85 ± 0.608 Aa32.07 ± 1.920 Bb18.46 ± 3.27
Location Mean ± SE4.74 ± 0.859 b29.37 ± 1.760 a
CmicAfforested183 ± 2.950 Ab323 ± 20.500 Bb253 ± 19.00
Control35.1 ± 1.090 Aa59.0 ± 2.060 Aa47.1 ± 2.97
Location Mean ± SE109 ± 17.000191 ± 31.900
MRAfforested0.62 ± 0.049 Ba1.30 ± 0.075 Aa0.96 ± 0.090
Control0.25 ± 0.008 Aa0.35 ± 0.011 Ab0.30 ± 0.013
Location Mean ± SE0.43 ± 0.0480.82 ± 0.115
qMicAfforested1.11 ± 0.0231.39 ± 0.0651.25 ± 0.047 a
Control0.59 ± 0.0260.76 ± 0.0340.67 ± 0.028 b
Location Mean ± SE0.85 ± 0.062 b1.07 ± 0.081 a
qCO2Afforested3.37 ± 0.270 Bb4.06 ± 0.205 Ab3.72 ± 0.183
Control7.14 ± 0.237 Aa5.99 ± 0.296 Ba6.56 ± 0.227
App. Mean ± SE5.26 ± 0.4675.02 ± 0.282
Abbreviations: EC = electrical conductivity (dSm−1); TN = total soil N (%); SOC = soil organic carbon (%); Cmic = carbon in the microbial biomass (μg g−1); MR= microbial basal respiration (μg CO2–C g−1 soil h−1); qMic = microbial quotient; qCO2 = metabolic quotient. Significant at p < 0.05; Comparisons of the bedrock at each location are shown in capital letters, and comparisons of location levels at each bedrock level are shown in lowercase letters.
Table 3. F and p-values of the ANOVA for the effects of parent material, location, and their interactions on soil physicochemical, microbial properties, and stoichiometric indices.
Soil PropertiesModelsF-Valuep-Value
Sand (%)Parent material99.46<0.000
Location1516.62<0.000
Parent material x Location15.75<0.000
Clay (%)Parent material214.64<0.000
Location295.11<0.000
Parent material x Location31.26<0.000
Silt (%)Parent material86.84<0.000
Location157.88<0.000
Parent material x Location10.710.002
pHParent material2.080.158
Location258.03<0.000
Parent material x Location5.630.023
EC (dS m−1)Parent material45.98<0.000
Location1.33 0.257
Parent material x Location0.420.523
SOC (%)Parent material105.48<0.000
Location13.210.001
Parent material x Location4.880.034
TN (%)Parent material208.18<0.000
Location42.13<0.000
Parent material x Location20.76<0.000
C/NParent material78.86<0.000
Location28.78<0.000
Parent material x Location0.080.778
CaCO3 (%)Parent material2.200.147
Location167.32<0.000
Parent material x Location1.840.183
CmicParent material389.60<0.000
Location61.68<0.000
Parent material x Location30.94<0.000
MRParent material209.29<0.000
Location73.73<0.000
Parent material x Location41.71<0.000
qMicParent material205.99<0.000
Location30.49<0.000
Parent material x Location2.070.159
qCO2Parent material125.22<0.000
Location0.840.364
Parent material x Location13.060.001
Table 4. Some descriptive statistics and t-test results of some growth parameters of afforestation made on different bedrocks.
Growth CharacteristicsParent MaterialnMinimumMaximumMean ± SEt-Values
DBH (cm)Andesite534.0013.008.64 ± 0.314 b ***
5.68
Limestone646.0015.0010.92 ± 0.256 a
TH (m)Andesite533.006.204.92 ± 0.107 b ***
12.13
Limestone644.707.706.61 ± 0.091 a
(*** p ≤ 0.001. a, b; Comparisons of the parent materials are shown in lower-case letters) DBH: Diameter at Breast High (cm), TH: Tree Height (m).
Table 5. Standardized canonical discriminant function coefficients of soil properties and plant growth characteristics.
Function
Soil Variables123
TH1.1950.3300.384
DBH1.233−0.133−0.510
Sand−0.6130.900−0.258
Clay−0.9060.000−0.483
pH0.2620.1030.779
EC−1.798−0.646−1.695
SOC17.722.88717.09
TN0.936−0.066−2.746
C/N−0.512−0.197−1.344
CaCO3−0.030−0.2580.436
Cmic−14.30−2.517−11.11
MR−0.4340.4120.607
qMic(Cmic/Corg)7.1580.5905.012
qCO20.9580.0690.004
Disclaimer/Publisher’s Note: The statements, opinions and data contained in all publications are solely those of the individual author(s) and contributor(s) and not of MDPI and/or the editor(s). MDPI and/or the editor(s) disclaim responsibility for any injury to people or property resulting from any ideas, methods, instructions or products referred to in the content.

