
Physiological Parameters of Sleep and the Risk of Obstructive Sleep Apnea in Competitive Athletes with Poor Sleep Quality


Abstract
1. Introduction
2. Methods
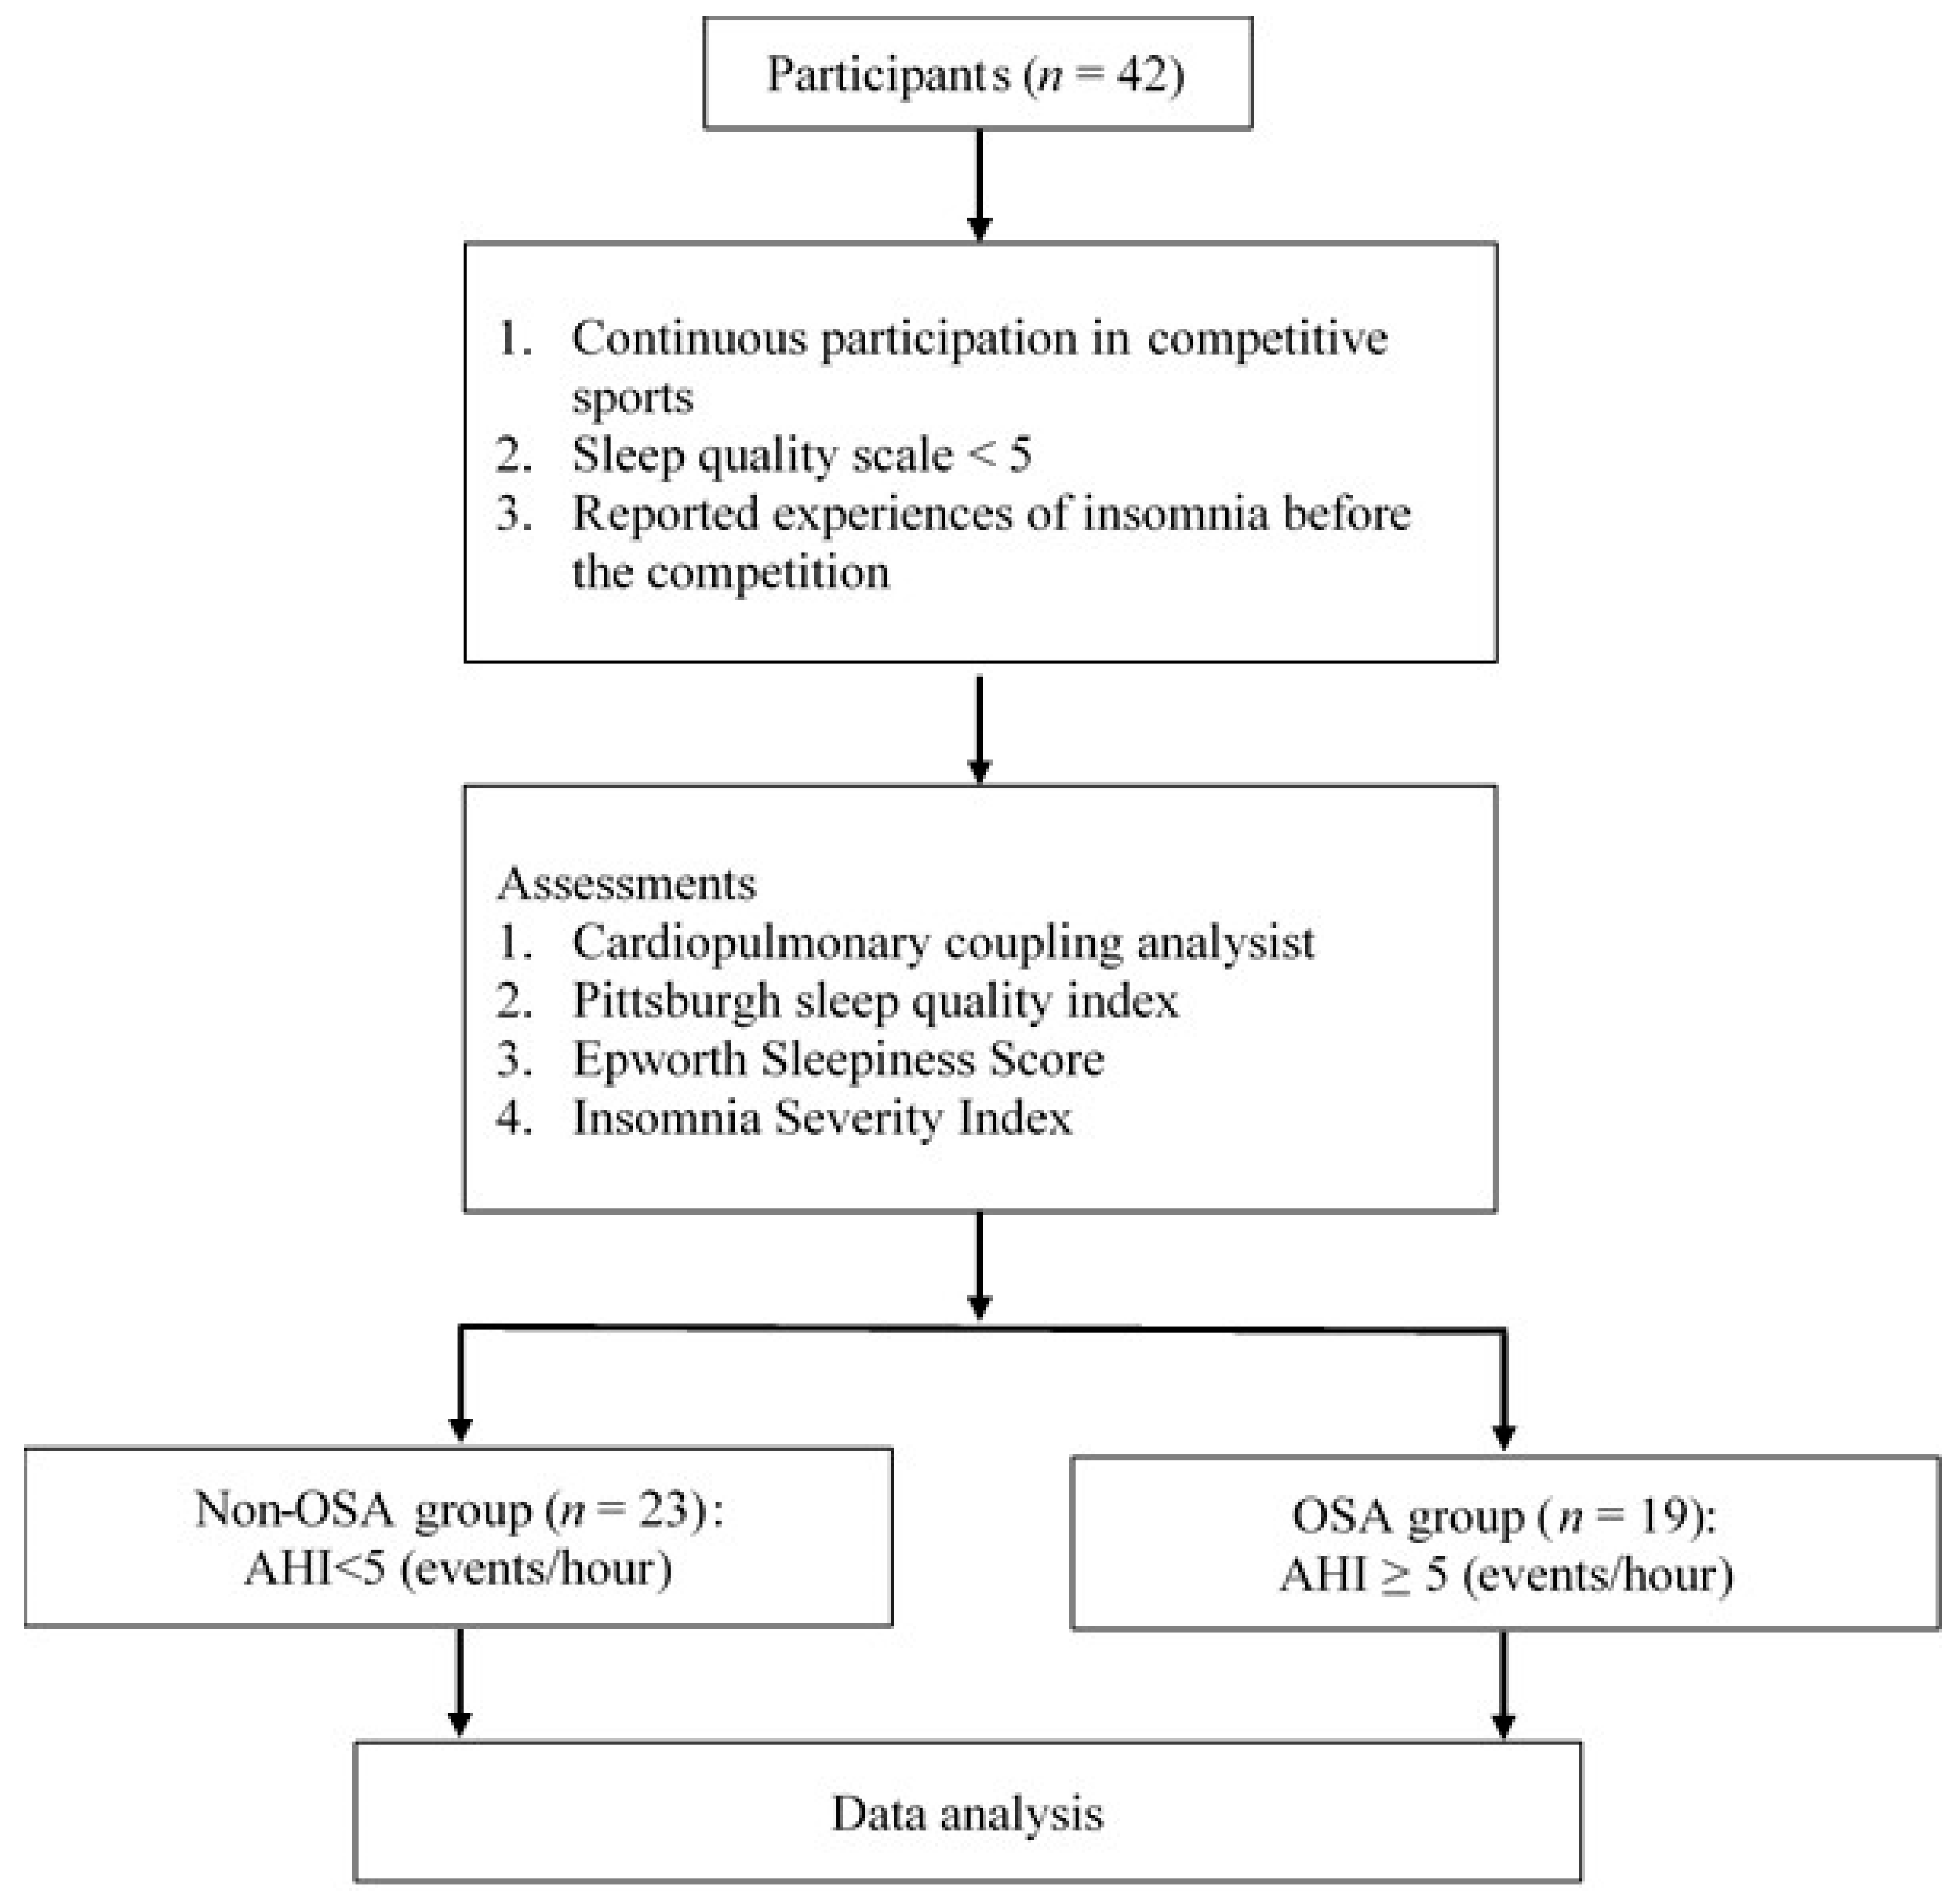
2.1. Participants
2.2. Study Procedures
2.2.1. Assessments
Cardiopulmonary Coupling Analysis
Pittsburgh Sleep Quality Index
Epworth Sleepiness Score
Insomnia Severity Index
2.3. OSA Risk Classification
2.4. Statistical Analysis
3. Results
4. Discussion
5. Conclusions
Author Contributions
Funding
Institutional Review Board Statement
Informed Consent Statement
Data Availability Statement
Acknowledgments
Conflicts of Interest
Abbreviations
| AHI | apnea-hypopnea index |
| CPC | cardiopulmonary coupling |
| HRV | heart rate variability |
| HF | high-frequency |
| LF | low-frequency |
| REM | rapid eye movement |
| PSQI | Pittsburgh Sleep Quality Index |
| ESS | Epworth Sleepiness Score |
| ISI | Insomnia Severity Index |
| SD | standard deviation |
| SDNN | standard deviation of NN intervals |
References
- Creado, S.A.; Advani, S. Sleep disorders in the athlete. Psychiatr. Clin. N. Am. 2021, 44, 393–403. [Google Scholar] [CrossRef] [PubMed]
- Gupta, L.; Morgan, K.; Gilchrist, S. Does elite sport degrade sleep quality? A systematic review. Sports Med. 2017, 47, 1317–1333. [Google Scholar] [PubMed]
- Buckley, G.; Hall, L.E.; Lassemillante, A.M.; Ackerman, K.E.; Belski, R. Retired athletes and the intersection of food and body: A systematic literature review exploring compensatory behaviours and body change. Nutrients 2019, 11, 1395. [Google Scholar] [CrossRef] [PubMed]
- Juliff, L.E.; Halson, S.L.; Peiffer, J.J. Understanding sleep disturbance in athletes prior to important competitions. J. Sci. Med. Sport 2015, 18, 13–18. [Google Scholar] [CrossRef]
- Swinbourne, R.; Gill, N.; Vaile, J.; Smart, D. Prevalence of poor sleep quality, sleepiness and obstructive sleep apnoea risk factors in athletes. Eur. J. Sport Sci. 2016, 16, 850–858. [Google Scholar]
- Asghari, A.; Mohammadi, F. Is apnea-hypopnea index a proper measure for obstructive sleep apnea severity? Med. J. Islam. Repub. Iran 2013, 27, 161–162. [Google Scholar]
- Caia, J.; Halson, S.L.; Scott, A.; Kelly, V.G. Obstructive sleep apnea in professional rugby league athletes: An exploratory study. J. Sci. Med. Sport 2020, 23, 1011–1015. [Google Scholar]
- Craven, J.; McCartney, D.; Desbrow, B.; Sabapathy, S.; Bellinger, P.; Roberts, L.; Irwin, C. Effects of acute sleep loss on physical performance: A systematic and meta-analytical review. Sports Med. 2022, 52, 2669–2690. [Google Scholar]
- Leeder, J.; Glaister, M.; Pizzoferro, K.; Dawson, J.; Pedlar, C. Sleep duration and quality in elite athletesmeasured using wristwatch actigraphy. J. Sports Sci. 2012, 30, 541–545. [Google Scholar]
- Lastella, M.; Lovell, G.P.; Sargent, C. Athletes’ precompetitive sleep behaviour and its relationship with subsequent precompetitive mood and performance. Eur. J. Sport Sci. 2014, 14, 123–130. [Google Scholar]
- Mondal, P.; Gjevre, J.A.; Taylor-Gjevre, R.M.; Lim, H.J. Relationship between the Pittsburgh Sleep Quality Index and the Epworth Sleepiness Scale in a sleep laboratory referral population. Nat. Sci. Sleep 2013, 5, 15–21. [Google Scholar] [PubMed]
- Buysse, D.J.; Hall, M.L.; Strollo, P.J.; Kamarck, T.W.; Owens, J.; Lee, L.; Reis, S.E.; Matthews, K.A. Relationships between the Pittsburgh Sleep Quality Index (PSQI), Epworth Sleepiness Scale (ESS), and clinical/polysomnographic measures in a community sample. J. Clin. Sleep Med. 2008, 4, 563–571. [Google Scholar] [PubMed]
- Snyder, E.; Cai, B.; DeMuro, C.; Morrison, M.F.; Ball, W. A New single-item sleep quality scale: Results of psychometric evaluation in patients with chronic primary insomnia and depression. J. Clin. Sleep Med. 2018, 14, 1849–1857. [Google Scholar] [PubMed]
- Lu, M.; Fang, F.; Sanderson, J.E.; Ma, C.; Wang, Q.; Zhan, X.; Xie, F.; Xiao, L.; Liu, H.; Liu, H.; et al. Validation of a portable monitoring device for the diagnosis of obstructive sleep apnea: Electrocardiogram-based cardiopulmonary coupling. Sleep Breath. 2019, 23, 1371–1378. [Google Scholar]
- Straus, M.A.; Savage, S.A. Neglectful behavior by parents in the life history of university students in 17 countries and its relation to violence against dating partners. Child Maltreat. 2005, 10, 124–135. [Google Scholar]
- Tsai, P.S.; Wang, S.Y.; Wang, M.Y.; Su, C.T.; Yang, T.T.; Huang, C.J.; Fang, S.C. Psychometric evaluation of the Chinese version of the Pittsburgh Sleep Quality Index (CPSQI) in primary insomnia and control subjects. Qual. Life Res. 2005, 14, 1943–1952. [Google Scholar]
- Johns, M. A new method for measuring daytime sleepiness: The Epworth Sleepiness Scale. Sleep 1991, 14, 540–545. [Google Scholar]
- Lapin, B.R.; Bena, J.F.; Walia, H.K.; Moul, D.E. The Epworth Sleepiness Scale: Validation of One-Dimensional Factor Structure in a Large Clinical Sample. J. Clin. Sleep Med. 2018, 14, 1293–1301. [Google Scholar]
- Bastien, C.H.; Vallières, A.; Morin, C.M. Validation of the Insomnia Severity Index as an outcome measure for insomnia research. Sleep Med. 2001, 2, 297–307. [Google Scholar]
- Cao, W.; Luo, J.; Xiao, Y. A Review of Current Tools Used for Evaluating the Severity of Obstructive Sleep Apnea. Nat. Sci. Sleep 2020, 12, 1023–1031. [Google Scholar]
- Mukaka, M.M. Statistics corner: A guide to appropriate use of correlation coefficient in medical research. Malawi Med. J. 2012, 24, 69–71. [Google Scholar] [PubMed]
- Halson, S.L. Sleep in elite athletes and nutritional interventions to enhance sleep. Sports Med. 2014, 44, 13–23. [Google Scholar] [CrossRef] [PubMed]
- Pallesen, S.; Sivertsen, B.; Nordhus, I.H.; Bjorvatn, B. A 10-year trend of insomnia prevalence in the adult Norwegian population. Sleep Med. 2013, 15, 173–179. [Google Scholar] [CrossRef] [PubMed]
- Benjafield, A.V.; Ayas, N.T.; Eastwood, P.R.; Heinzer, R.; Ip, M.S.M.; Morrell, M.J.; Nunez, C.M.; Patel, S.R.; Penzel, T.; Pépin, J.L.; et al. Estimation of the global prevalence and burden of obstructive sleep apnoea: A literature-based analysis. Lancet Respir. Med. 2019, 7, 687–698. [Google Scholar] [CrossRef]
- Ballesio, A.; Vacca, M.; Bacaro, V.; Benazzi, A.; De Bartolo, P.; Alivernini, F.; Lucidi, F.; Lombardo, C.; Baglioni, C. Psychological correlates of insomnia in professional soccer players: An exploratory study. Eur. J. Sport Sci. 2021, 22, 897–905. [Google Scholar] [CrossRef]
- Khalladi, K.; Farooq, A.; Souissi, S.; Herrera, C.P.; Chamari, K.; Taylor, L.; El Massioui, F. Inter-relationship between sleep quality, insomnia and sleep disorders in professional soccer players. BMJ Open Sport Exerc. Med. 2019, 5, e000498. [Google Scholar] [CrossRef]
- Montero, A.; Stevens, D.; Adams, R.; Drummond, M. Sleep and mental health issues in current and former athletes: A mini review. Front. Psychol. 2022, 13, 868614. [Google Scholar] [CrossRef]
- Kim, W.Y.; Hong, S.N.; Yang, S.K.; Nam, K.J.; Lim, K.H.; Hwang, S.J.; Seo, M.Y.; Lee, S.H. The effect of body position on airway patency in obstructive sleep apnea: CT imaging analysis. Sleep Breath. 2019, 23, 911–916. [Google Scholar] [CrossRef]
- Joosten, S.A.; O’Driscoll, D.M.; Berger, P.J.; Hamilton, G.S. Supine position related obstructive sleep apnea in adults: Pathogenesis and treatment. Sleep Med. Rev. 2014, 18, 7–17. [Google Scholar] [CrossRef]
- Tuomilehto, H.; Seppä, J.; Uusitupa, M. Obesity and obstructive sleep apnea-clinical significance of weight loss. Sleep Med. Rev. 2013, 17, 321–329. [Google Scholar] [CrossRef]
- Watson, A.M. Sleep and athletic performance. Curr. Sports Med. Rep. 2017, 16, 413–418. [Google Scholar] [CrossRef] [PubMed]
- Jansson-Fröjmark, M.; Norell-Clarke, A. The cognitive treatment components and therapies of cognitive behavioral therapy for insomnia: A systematic review. Sleep Med. Rev. 2018, 42, 19–36. [Google Scholar] [CrossRef] [PubMed]
- Nedelec, M.; Aloulou, A.; Duforez, F.; Meyer, T.; Dupont, G. The variability of sleep among elite athletes. Sports Med. Open 2018, 4, 34. [Google Scholar] [CrossRef]
- Thornton, A.; Maijer, R.; Schramm, P. Snoring and insomnia- neurocognitive consequences in professional athletes. Sleep Med. 2017, 40, e327. [Google Scholar] [CrossRef]
- Zhai, F.; Li, Y.; Chen, J. Comparison of polysomnography, sleep apnea screening test and cardiopulmonary coupling in the diagnosis of pediatric obstructive sleep apnea syndrome. Int. J. Pediatr. Otorhinolaryngol. 2021, 149, 110867. [Google Scholar] [CrossRef]
- Park, D.H.; Shin, C.J.; Hong, S.C.; Yu, J.; Ryu, S.H.; Kim, E.J.; Shin, H.B.; Shin, B.H. Correlation between the severity of obstructive sleep apnea and heart rate variability indices. J. Korean Med. Sci. 2008, 23, 226–231. [Google Scholar] [CrossRef]
- Saul, J.P.; Berger, R.D.; Chen, M.H.; Cohen, R.J. Transfer function analysis of autonomic regulation. II. Respiratory sinus arrhythmia. Am. J. Physiol. 1989, 256, 153–161. [Google Scholar] [CrossRef]
- Roche, F.; Gaspoz, J.M.; Court-Fortune, I.; Minini, P.; Pichot, V.; Duverney, D.; Costes, F.; Lacour, J.R.; Barthélémy, J.C. Screening of obstructive sleep apnea syndrome by heart rate variability analysis. Circulation 1999, 100, 1411–1415. [Google Scholar] [CrossRef]
- Kim, Y.S.; Kim, S.Y.; Park, D.Y.; Wu, H.W.; Hwang, G.S.; Kim, H.J. Clinical implication of heart rate variability in obstructive sleep apnea syndrome patients. J. Craniofac. Surg. 2015, 26, 1592–1595. [Google Scholar] [CrossRef]
- McCraty, R.; Shaffer, F. Heart Rate Variability: New perspectives on physiological mechanisms, assessment of self-regulatory capacity, and health risk. Glob. Adv. Health Med. 2015, 4, 46–61. [Google Scholar] [CrossRef]
- Aydin, M.; Altin, R.; Ozeren, A.; Kart, L.; Bilge, M.; Unalacak, M. Cardiac autonomic activity in obstructive sleep apnea: Time-dependent and spectral analysis of heart rate variability using 24-hour Holter electrocardiograms. Tex. Heart Inst. J. 2004, 31, 132–136. [Google Scholar] [PubMed]
- Narkiewicz, K.; Montano, N.; Cogliati, C.; van de Borne, P.J.; Dyken, M.E.; Somers, V.K. Altered cardiovascular variability in obstructive sleep apnea. Circulation 1998, 98, 1071–1077. [Google Scholar] [PubMed]
- Gula, L.J.; Krahn, A.D.; Skanes, A.; Ferguson, K.A.; George, C.; Yee, R.; Klein, G.J. Heart rate variability in obstructive sleep apnea: A prospective study and frequency domain analysis. Ann. Noninvasive Electrocardiol. 2003, 8, 144–149. [Google Scholar] [PubMed]
- Pumprla, J.; Howorka, K.; Groves, D.; Chester, M.; Nolan, J. Functional assessment of heart rate variability: Physiological basis and practical applications. Int. J. Cardiol. 2002, 84, 1–14. [Google Scholar]
- Shahid, A.; Shen, J.; Shapiro, C.M. Measurements of sleepiness and fatigue. J. Psychosom. Res. 2010, 69, 81–89. [Google Scholar]
- Miyahara, L.K.; Stefanini, R.; Suguri, V.M.; Wawginiak, G.H.; Balsalobre, R.A.; Haddad, F.L.M. Evaluation of sleep quality and risk of obstructive sleep apnea in patients referred for aesthetic rhinoplasty. Sleep Sci. 2019, 12, 126–131. [Google Scholar] [CrossRef]
- Kim, S.A.; Koo, B.B.; Kim, D.E.; Hwangbo, Y.; Yang, K.I. Factors affecting fatigue severity in patients with obstructive sleep apnea. Clin. Respir. J. 2017, 11, 1045–1051. [Google Scholar] [CrossRef]
- Hossain, J.L.; Ahmad, P.; Reinish, L.W.; Kayumov, L.; Hossain, N.K.; Shapiro, C.M. Subjective fatigue and subjective sleepiness: Two independent consequences of sleep disorders? J. Sleep Res. 2005, 14, 245–253. [Google Scholar]
- Stepnowsky, C.J.; Palau, J.J.; Zamora, T.; Ancoli-Israel, S.; Loredo, J.S. Fatigue in sleep apnea: The role of depressive symptoms and self-reported sleep quality. Sleep Med. 2011, 12, 832–837. [Google Scholar] [CrossRef]

| Total (n = 42) | Non-OSA Risk (n = 23) | OSA Risk (n = 19) | p | |
|---|---|---|---|---|
| Gender (male/female) | 17/25 | 7/16 | 10/9 | 0.14 |
| Age (years) | 21.14 ± 2.25 | 20.74 ± 1.36 | 21.63 ± 2.97 | 0.24 |
| Height (cm) | 168.62 ± 7.83 | 167.41 ± 6.77 | 170.08 ± 8.92 | 0.29 |
| Weight (kg) | 60.90 ± 11.28 | 60.67 ± 9.61 | 61.18 ± 13.29 | 0.89 |
| BMI (kg/m2) | 21.36 ± 3.07 | 21.65 ± 2.82 | 21.01 ± 3.40 | 0.52 |
| Body fat (%) | 18.82 ± 8.78 | 20.91 ± 8.71 | 16.29 ± 8.41 | 0.09 |
| Muscle mass (kg) | 46.33 ± 8.46 | 44.84 ± 6.84 | 48.13 ± 9.98 | 0.23 |
| Frequency of insomnia (times/week) | 2.46 ± 1.35 | 2.59 ± 1.41 | 2.32 ± 1.29 | 0.52 |
| Self-reported sleep quality | 5.12 ± 1.47 | 5.22 ± 1.76 | 5.01 ± 1.05 | 0.62 |
| AHI (events/hour) | 6.23 ± 5.27 | 2.45 ± 1.59 | 10.79 ± 4.47 | 0.001 * |
| Non-OSA Risk (n = 23) | OSA Risk (n = 19) | Cohen’s d | t | p | |
|---|---|---|---|---|---|
| Sleep architecture | |||||
| Total time in bed (min) | 438.26 ± 94.98 | 405.53 ± 86.51 | 0.36 | 1.17 | 0.25 |
| Sleep period time (min) | 418.96 ± 94.88 | 385.68 ± 88.63 | 0.36 | 1.17 | 0.25 |
| Total sleep time (min) | 393.74 ± 93.09 | 366.89 ± 86.32 | 0.29 | 0.97 | 0.34 |
| Sleep efficiency (%) | 89.70 ± 6.28 | 90.72 ± 4.82 | 0.18 | −0.59 | 0.56 |
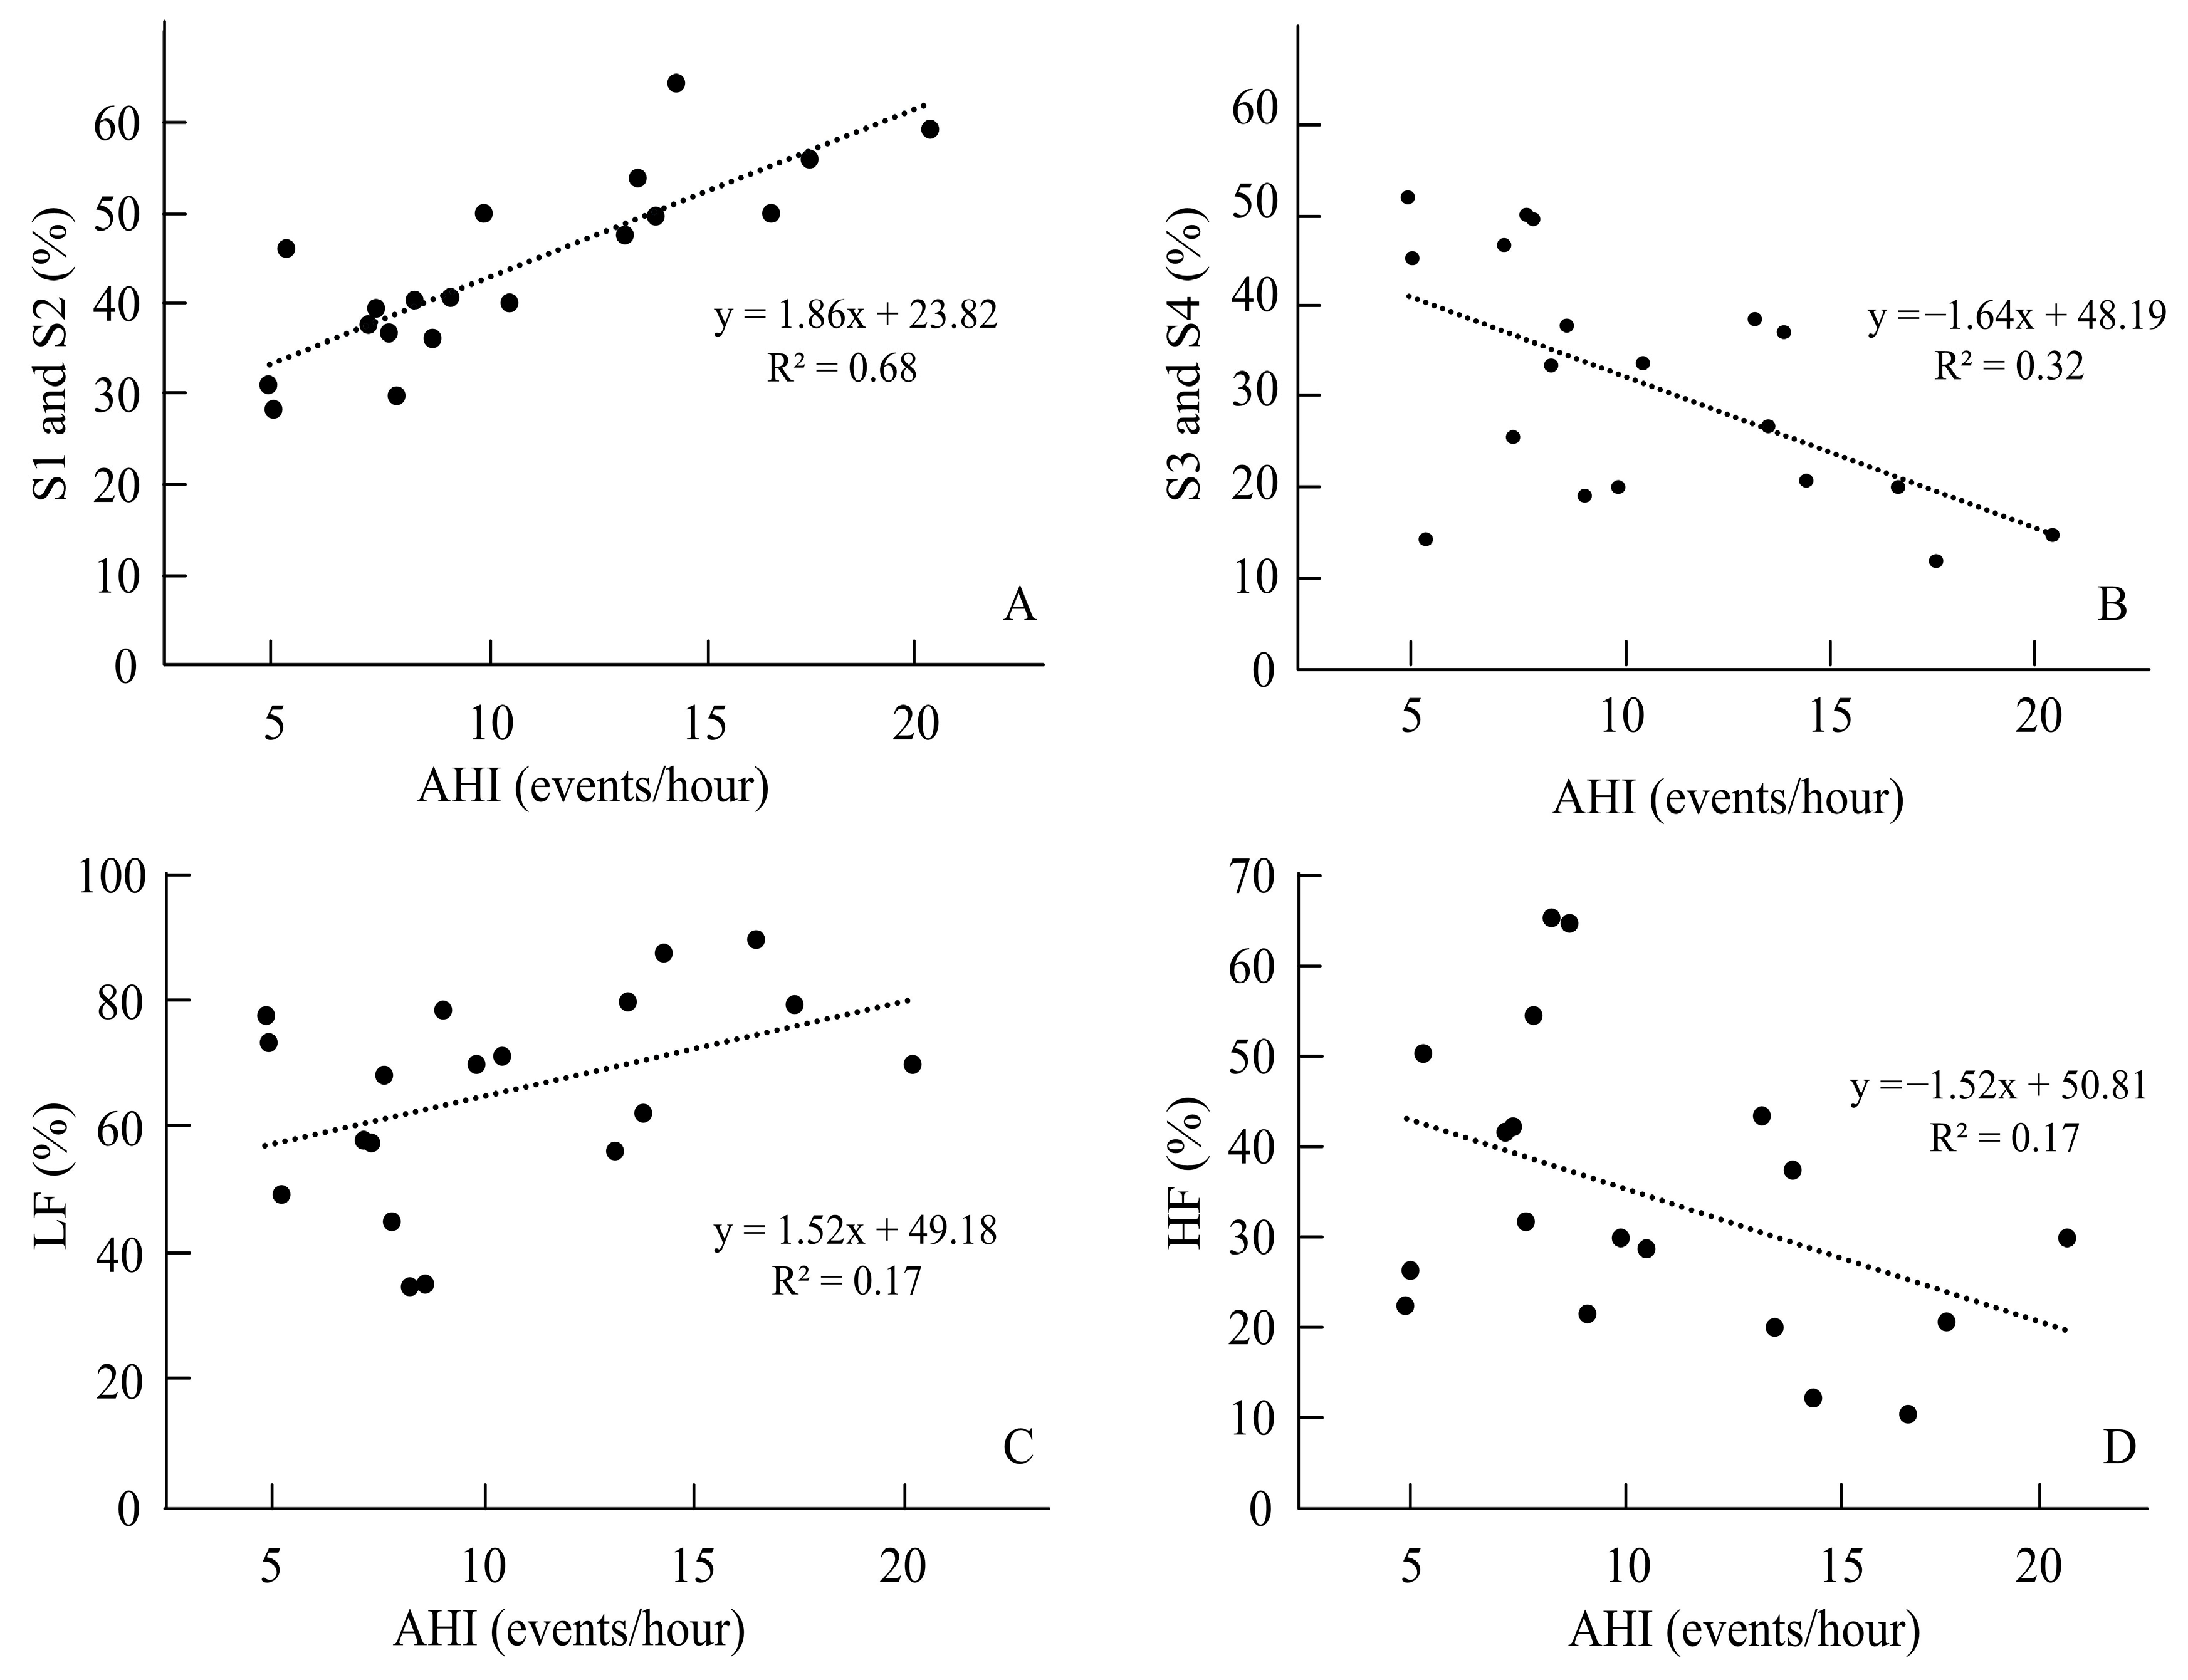
| Duration in S1 and S2 (min) | 109.83 ± 46.85 | 165.58 ± 48.56 | 1.16 | −3.76 | 0.001 * |
| Percentage of S1 and S2 (%) | 26.79 ± 10.11 | 43.98 ± 10.10 | 1.70 | −5.49 | 0.001 * |
| Duration in S3 and S4 (min) | 202.26 ± 68.09 | 116.05 ± 54.79 | 1.39 | 4.55 | 0.001 * |
| Percentage of S3 and S4 (%) | 49.73 ± 11.74 | 30.41 ± 12.86 | 1.56 | 4.78 | 0.001 * |
| Duration in REM (min) | 81.48 ± 34.91 | 85.26 ± 45.87 | 0.09 | −0.03 | 0.77 |
| Percentage of REM (%) | 19.62 ± 6.42 | 21.66 ± 8.63 | 0.26 | −0.85 | 0.40 |
| Sleeping posture | |||||
| Duration in supine (min) | 284.39 ± 107.36 | 274.47 ± 97.22 | 0.09 | 0.31 | 0.76 |
| Supine in S1 and S2 (min) | 72.78 ± 42.08 | 119.21 ± 49.06 | 1.01 | −3.25 | 0.001 * |
| Supine in S3 and S4 (min) | 149.00 ± 66.79 | 86.26 ± 46.41 | 1.09 | 3.58 | 0.001 * |
| Supine in REM (min) | 52.96 ± 29.55 | 60.37 ± 42.27 | 0.20 | −0.65 | 0.52 |
| Duration in left side-lying (min) | 50.83 ± 44.19 | 50.63 ± 36.93 | 0.01 | 0.02 | 0.99 |
| Left side-lying in S1 and S2 (min) | 16.78 ± 18.23 | 22.26 ± 19.94 | 0.28 | −0.92 | 0.36 |
| Left side-lying in S3 and S4 (min) | 19.35 ± 25.52 | 12.47 ± 16.24 | 0.32 | 1.06 | 0.30 |
| Left side-lying in REM (min) | 12.00 ± 10.98 | 13.79 ± 13.39 | 0.14 | −0.47 | 0.64 |
| Duration in right side-lying (min) | 64.17 ± 52.94 | 42.26 ± 38.13 | 0.47 | 1.56 | 0.13 |
| Right side-lying in S1 and S2 (min) | 15.96 ± 14.43 | 18.32 ± 20.03 | 0.13 | −0.43 | 0.67 |
| Right side-lying in S3 and S4 (min) | 29.61 ± 30.72 | 12.42 ± 15.46 | 0.70 | 2.35 | 0.02 * |
| Right side-lying in REM (min) | 13.96 ± 11.68 | 9.05 ± 8.07 | 0.48 | 1.60 | 0.12 |
| Duration in prone (min) | 9.70 ± 19.57 | 13.11 ± 30.41 | 0.13 | −0.42 | 0.68 |
| Prone in S1 and S2 (min) | 3.17 ± 5.89 | 5.53 ± 16.56 | 0.18 | −0.59 | 0.56 |
| Prone in S3 and S4 (min) | 3.09 ± 10.17 | 4.89 ± 11.59 | 0.16 | −0.53 | 0.60 |
| Prone in REM (min) | 2.26 ± 4.72 | 1.95 ± 4.21 | 0.06 | 0.23 | 0.82 |
| Non-OSA Risk (n = 23) | OSA Risk (n = 19) | Cohen’s d | t | p | |
|---|---|---|---|---|---|
| HRV | |||||
| Heart rate (beats/min) | 60.57 ± 9.50 | 57.58 ± 9.17 | 0.32 | 1.03 | 0.31 |
| SDNN (ms) | 100.74 ± 34.88 | 97.00 ± 49.75 | 0.08 | 0.28 | 0.78 |
| RMSSD (ms) | 95.52 ± 44.63 | 74.89 ± 38.01 | 0.49 | 1.62 | 0.11 |
| LF power (ms2) | 2434.46 ± 3352.13 | 1959.81 ± 1914.66 | 0.17 | 0.57 | 0.57 |
| LF (%) | 53.82 ± 18.37 | 65.63 ± 16.09 | 0.68 | −2.22 | 0.03 * |
| HF power (ms2) | 1698.62 ± 1294.93 | 790.24 ± 595.24 | 0.90 | 3.00 | 0.01 * |
| HF (%) | 46.18 ± 18.37 | 34.37 ± 16.09 | 0.68 | 2.22 | 0.03 * |
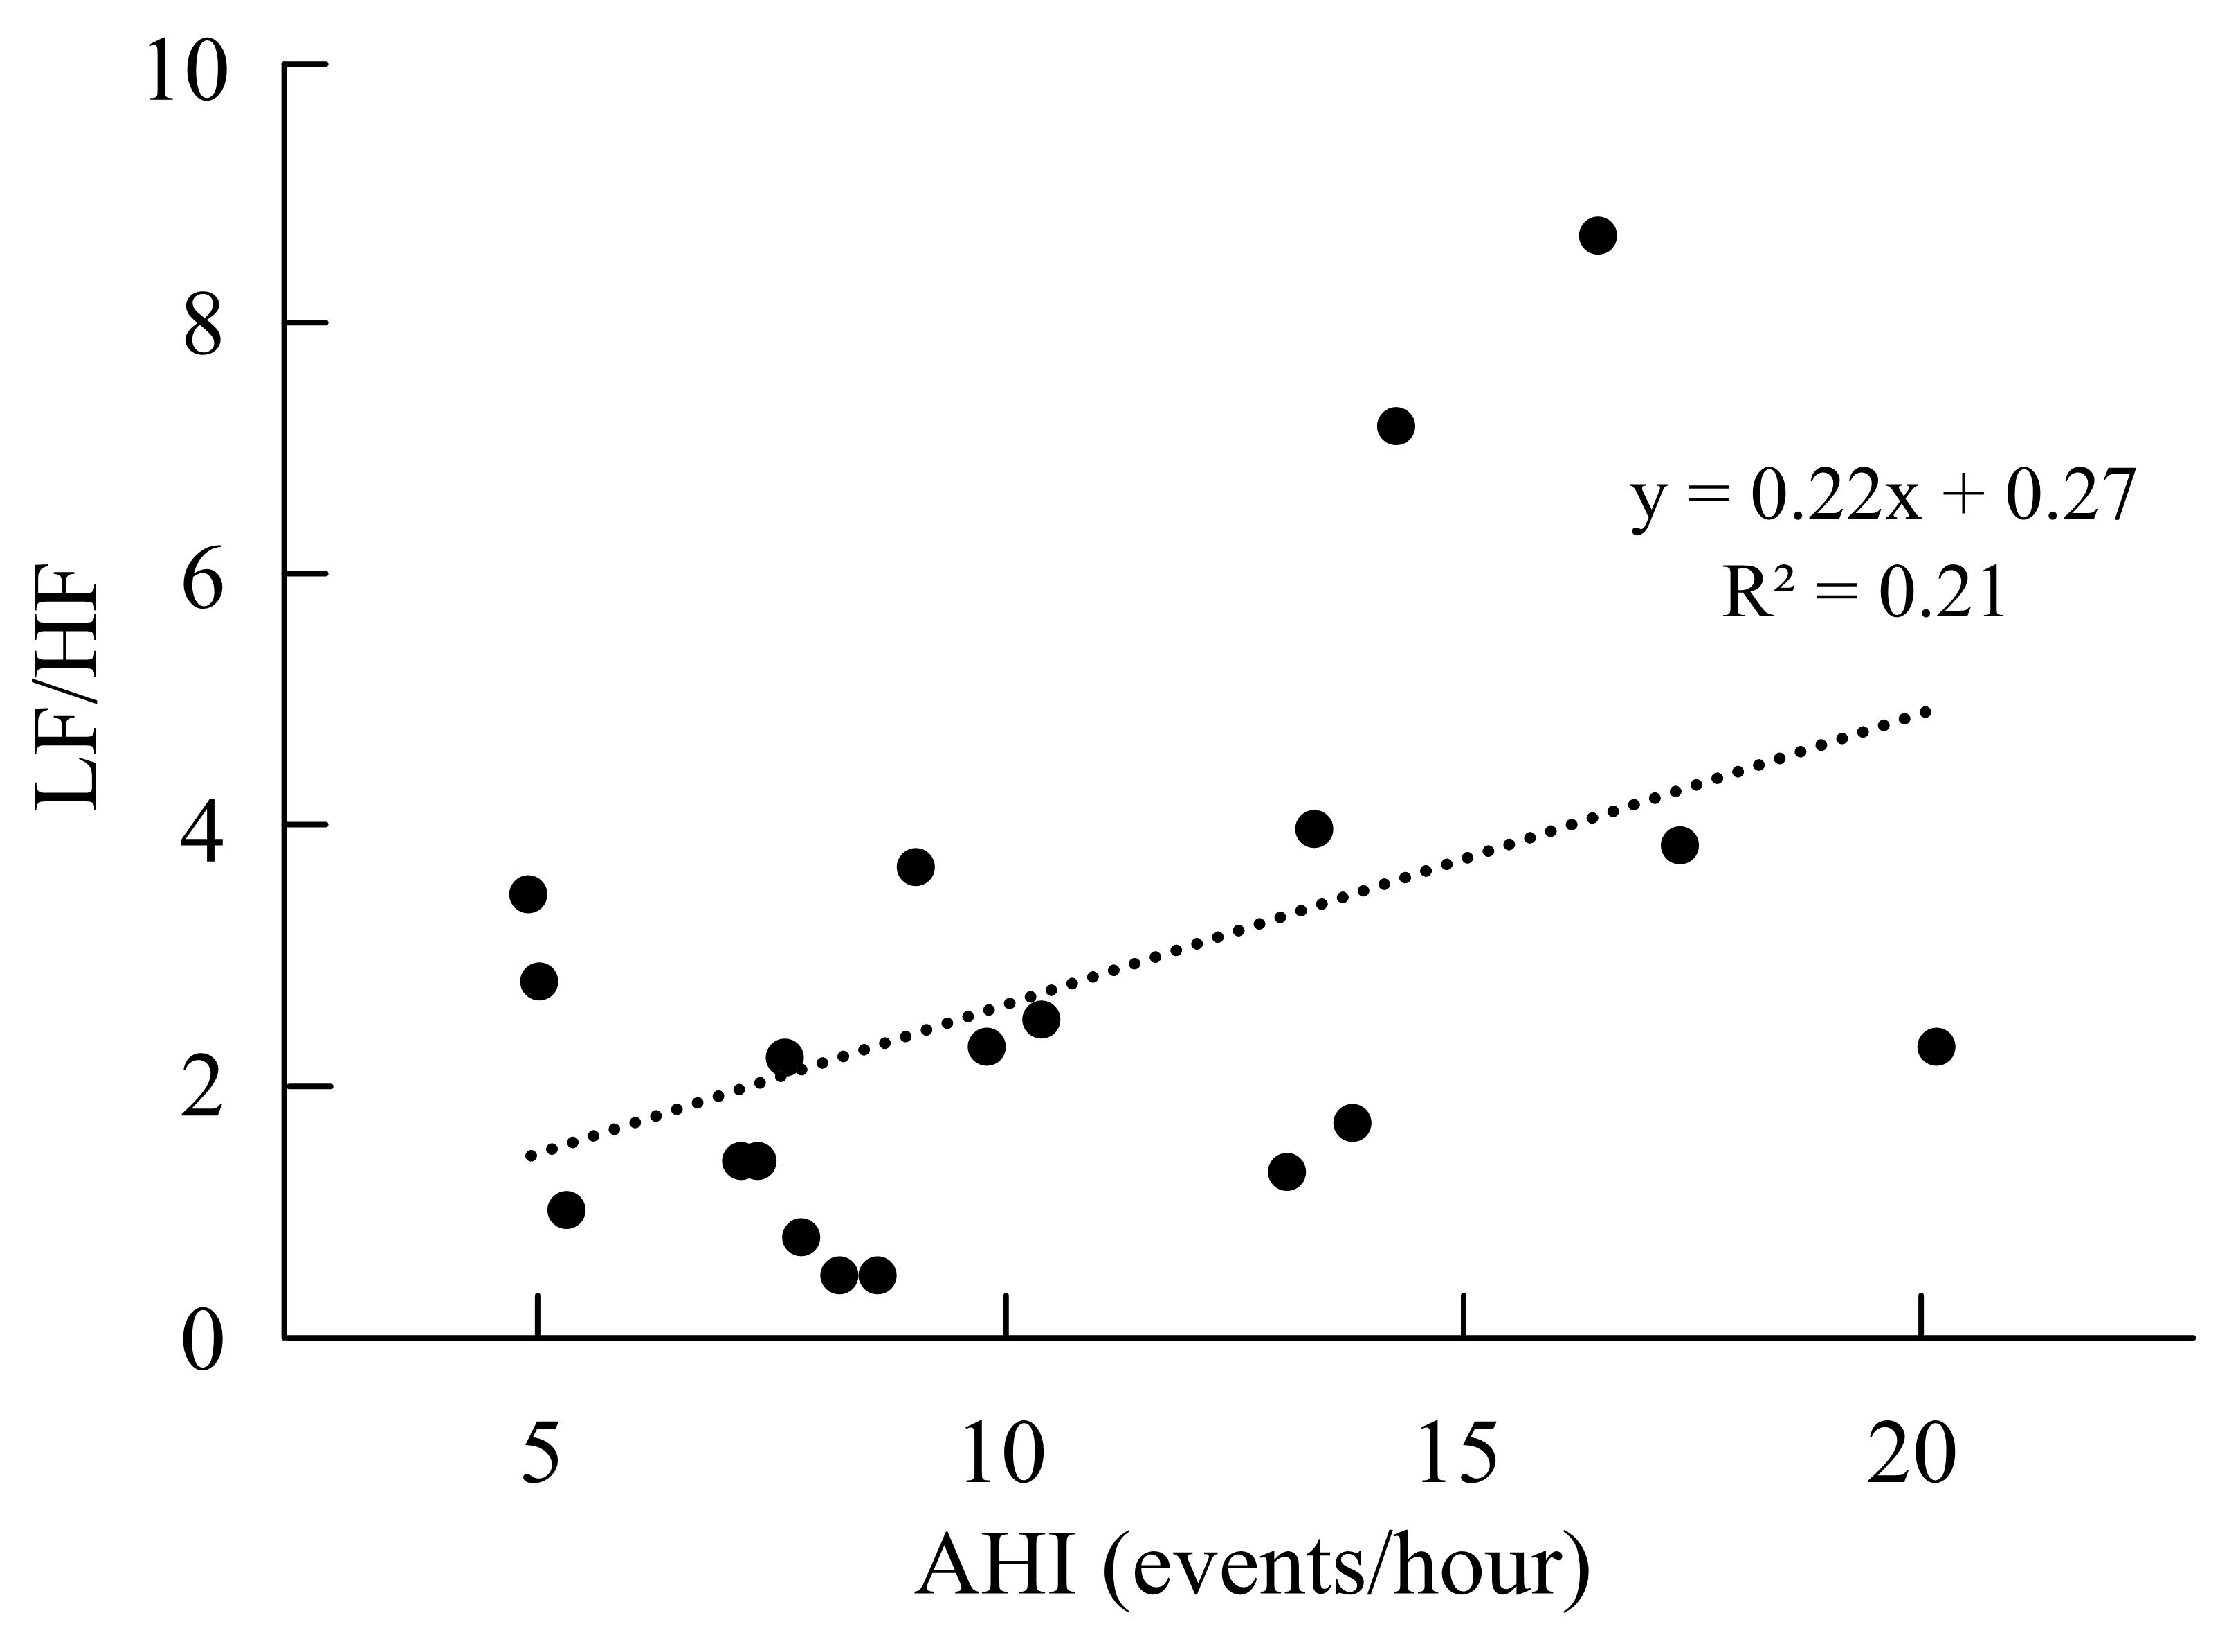
| LF/HF ratio | 1.59 ± 1.25 | 2.72 ± 2.16 | 0.64 | −2.01 | 0.04 * |
| pNN50 (%) | 56.46 ± 15.54 | 48.98 ± 18.54 | 0.43 | 1.40 | 0.17 |
| PSQI | 9.61 ± 2.92 | 9.42 ± 2.81 | 0.06 | 0.21 | 0.83 |
| ISI | 13.70 ± 5.51 | 13.21 ± 3.74 | 0.10 | 0.33 | 0.74 |
| ESS | 11.17 ± 3.82 | 10.58 ± 2.55 | 0.18 | 0.60 | 0.55 |
Disclaimer/Publisher’s Note: The statements, opinions and data contained in all publications are solely those of the individual author(s) and contributor(s) and not of MDPI and/or the editor(s). MDPI and/or the editor(s) disclaim responsibility for any injury to people or property resulting from any ideas, methods, instructions or products referred to in the content. |
© 2025 by the authors. Licensee MDPI, Basel, Switzerland. This article is an open access article distributed under the terms and conditions of the Creative Commons Attribution (CC BY) license (https://creativecommons.org/licenses/by/4.0/).
Share and Cite
Chen, F.-Y.; Tsou, Y.-A.; Chang, N.-J.; Chang, W.-D. Physiological Parameters of Sleep and the Risk of Obstructive Sleep Apnea in Competitive Athletes with Poor Sleep Quality. Life 2025, 15, 610. https://doi.org/10.3390/life15040610
Chen F-Y, Tsou Y-A, Chang N-J, Chang W-D. Physiological Parameters of Sleep and the Risk of Obstructive Sleep Apnea in Competitive Athletes with Poor Sleep Quality. Life. 2025; 15(4):610. https://doi.org/10.3390/life15040610
Chicago/Turabian StyleChen, Feng-Yin, Yung-An Tsou, Nai-Jen Chang, and Wen-Dien Chang. 2025. "Physiological Parameters of Sleep and the Risk of Obstructive Sleep Apnea in Competitive Athletes with Poor Sleep Quality" Life 15, no. 4: 610. https://doi.org/10.3390/life15040610
APA StyleChen, F.-Y., Tsou, Y.-A., Chang, N.-J., & Chang, W.-D. (2025). Physiological Parameters of Sleep and the Risk of Obstructive Sleep Apnea in Competitive Athletes with Poor Sleep Quality. Life, 15(4), 610. https://doi.org/10.3390/life15040610