Abstract
This is the studyto investigate the correlation between macular cone density (MCD) and flicker electroretinogram (ERG) response in healthy eyes. In this exploratory study, 23 eyes from 12 healthy subjects were enrolled in this study. The fixed-luminance flicker full-field electroretinogram (ffERG) responses of the retina and MCDs at 24 locations were measured using the Diopsys® NOVA™ system and the rtx1 adaptive optics retinal camera, respectively. Regression analysis was employed to evaluate the correlations. The mean age of the subjects was 30 ± 3 years. The average magnitudes of the flicker response and phase response were 13.44 ± 4.88 μV and 332.63 ± 22.12°, respectively. The MCDs for all 24 locations were 15,043 ± 3511 cones/mm². Among all locations, regression analysis revealed a significant correlation only at one specific location (0, −4°) between cone density and both the mean magnitude and phase of the flicker response, with p-values of 0.005 and 0.004, respectively.In conclusion, we identified a significant correlation between MCD and ffERG responses at a specific retinal locus (0, −4°). This finding may be attributed to the distribution of different cone types throughout the retina and the possibility that various cone types may contribute differently to ERG. Further studies are required to investigate this finding.
1. Introduction
The assessment of retinal function and its relationship to the underlying retinal structure plays a crucial role in diagnosing and monitoring various retinal disorders. One widely used tool to evaluate retinal function is the full-field electroretinogram (ffERG), which is a measure of the electrophysiological response of the entire retina to flashes of light [1]. By analyzing light-adapted 30 Hz flicker responses, the flicker ERG enables us to evaluate cone function in both hereditary and acquired retinal diseases, such as cone-rod dystrophy, achromatopsia, and diabetic retinopathy [2,3,4,5,6,7,8,9,10,11,12]. However, the conventional ERG recording method takes a long time and may not be suitable for all patients due to factors such as severe photophobia [13]. Diopsys® NOVA™ (Diopsys®, Inc., Pine Brook, NJ, USA) is a patient-friendly, office-based device allowing for the assessment of retinal function. Unlike conventional ERG systems, which often require a dark room, Diopsys offers testing procedures that can be integrated into regular ophthalmic examinations, enhancing patient comfort and compliance [8].
The macula, specifically the fovea, plays a critical role in central high-acuity vision. The fovea is characterized by the absence of retinal vasculature, the excavation of the inner retina, and a lack of rod photoreceptors. It is also home to the highest density of cone photoreceptors in the human retina [14,15], which contributes to visual acuity and color vision [14,15,16]. Furthermore, the unique distribution of foveal cones, with a much higher density compared to peripheral cones, leads to an increased cortical sampling of foveal cones and a larger representation in the primary visual cortex [17,18]. The density of cones gradually decreases with increasing distance from the fovea, with the most substantial decline occurring within 1 to 2 mm of the fovea [19].
Adaptive optics (AO) systems minimize optical aberrations and enable the high-resolution imaging of retinal structures at a microscopic level. This technology allows for the study of cone density and arrangement at the macula, which is crucial for understanding both normal and pathological conditions of the retina [14,15].
Despite the essential roles of macular cone density (MCD) and the ERG in assessing retinal structure and function, the precise relationship between these two measures remains unclear. Establishing a correlation between MCD and flicker ERG responses may offer an alternative imaging biomarker not only for diagnosing and monitoring retinal diseases but also for evaluating, monitoring, and detecting age-related physiological changes and early pathological alterations associated with premature retinal degeneration.
This study aimed to investigate the relationship between MCD and fixed-luminance flicker ffERG responses using an AO fundus camera.
2. Methods
2.1. Study Design
This exploratory study was conducted from January 2023 to February 2023. All subjects underwent a comprehensive eye examination to exclude any ocular pathology. The inclusion criteria required participants to have a best-corrected visual acuity of 20/20 or better. Additionally, the spherical equivalent of their refraction had to fall within the range of +5.25 to −6.00 diopters to maintain consistency among participants. As this was an exploratory study, the sample size was not determined based on a formal statistical power calculation. Prior to the commencement of the research, institutional review board (IRB) approval was obtained from the Stanford IRB, ensuring compliance with ethical standards (IRB-41266). All participants were provided with detailed information about the study procedures, risks, and benefits, and a written consent form was obtained from all participants. The study adhered to the principles outlined in the Declaration of Helsinki.
2.2. ERG Recordings by Diopsys® NOVA™ Fixed-Luminance Flicker Testing
The ffERG recordings were conducted using Diopsys® NOVA™ (Diopsys, lnc., Middletown, PA, USA), an in-office ERG device, in a well-illuminated room free from any visual or auditory distractions. Standard procedures similar to those that have been detailed previously were followed to ensure consistent and accurate measurements [20]. To begin, the lower eyelids and forehead of the patient were thoroughly cleansed using alcohol swabs, with additional cleansing of the forehead using skin prep gel (NuPrep®, Weaver and Company, Aurora, CO, USA). Hypoallergenic skin electrodes were positioned below each lower eyelid, while a third electrode was attached to the forehead. The electrodes were then connected to the ERG device, with the contralateral eyelid electrode serving as a reference during recordings from either eye. The participant was instructed to hold the hand-held Mini Ganzfeld Stimulator over the eye being tested and maintain fixation on a center target with the other eye open. The full-field stimulus employed in the ffERG recording consisted of white flashes flickering at a frequency of 32 Hz over a white background. The luminosity of the white flash was set at 3 cd.s/m2 (600 cd/m2 as 5 ms flashes) over a white background of 30 cd/m2 adhering to the ISCEV standard protocol for ffERG [1]. Contamination by eye blinks or gross eye saccades was automatically rejected by the device through the exclusion of voltages exceeding a threshold of 50 μV [20,21].
Implicit time, which is reported in conventional ERG, refers to the duration from the onset of the stimulus to the peak of the relevant wave component [22]. Phase, as measured by Diopsys and reported in degrees, is related to implicit time, with a phase closer to 360 degrees corresponding to an implicit time closer to 0. Magnitude reflects the level of responsiveness of a subject’s retina to a light stimulus [23].
2.3. Macular Cone Density Recordings by the rtx1TM Adaptive Optics Fundus Camera
The assessment of macular cone density involved the utilization of high-resolution retinal imaging using the rtx1™ adaptive optics retinal flood-illumination camera (Imagine Eyes, Orsay, France). This noncontact “en face” imaging system is comprised of three main components: a high-resolution fundus camera, a Shack–Hartmann wave-front sensor, and a deformable mirror, enabling the real-time correction of ocular wavefront aberrations. Infrared illumination with a wavelength of 850 nm was employed, providing a resolution of approximately 2 μm. The field of view (FOV) captured was 4 × 4°, corresponding to approximately 1.2 × 1.2 mm on the retinal surface based on the axial length of the eye. Standardized imaging protocols were followed for acquiring images from the study eyes. Participants were instructed to fixate on an internal red fixation cross, which was monitored through a video camera incorporated into the rtx1TM device to ensure proper fixation during image acquisition. A series of 40 images were captured over a duration of 4 s. Before image acquisition, the degree of adaptive optics correction displayed on the camera software panel was confirmed to be less than 1 milliradian, ensuring the effective correction of optical aberrations and improved image quality [17]. The cone mosaic was imaged at 24 center points surrounding the fovea, where the maximum cone density is found, spaced 2 degrees apart vertically and horizontally (Figure 1A). The regions of interest (ROIs), corresponding to central vision and including 2° and 4° eccentricities along the horizontal and vertical meridians (the center locus was unmeasurable), were montaged afterward to evaluate the accuracy of the captured images. The foveal reference point for each patient was determined by identifying the central point of the image acquired when the patient fixated on an internal fixation cross set at 0° angle (x = 0° and y = 0°). Eccentricity along the orthogonal meridians was measured as the distance between the ROIs and the foveal reference point [24].
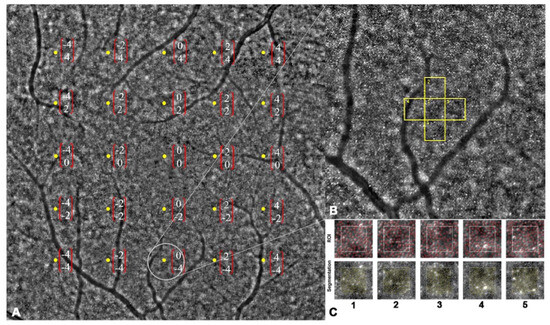
Figure 1.
Montage of 24 captured images. (A) Macular cone density was measured in 24 predetermined locations (center locus was unmeasurable). (B,C) Regions of interest were segmented and analyzed by integrated software (followed by manual adjustment by an expert grader).
Retinal images were acquired and assessed for image quality using AO Image (Imagine Eyes, Orsay, France). Then, the acquired images were processed using proprietary software AO detect (Imagine Eyes, Orsay, France) provided by the manufacturer. This processing involved generating a high-contrast image of the retina within a 4 × 4° area, enhancing the signal-to-noise ratio, and achieving a resolution of 0.8 μm/pixel (Figure 1B,C). To avoid blood vessels, the ROIs could be shifted within a range of 50 μm, if necessary [25]. Cone cells in each location were automatically detected using the AOdetect software (ver. 3.0), followed by manual adjustment by an expert grader (A.A.). Cone density in each specific location was calculated by measuring the mean density in five adjacent central ROIs.
2.4. Statistical Analysis
The collected data were analyzed using IBM SPSS Statistics for Windows, version 23 (IBM Corp., Armonk, NY, USA). The mean and standard deviations were employed to describe the statistical measures, and the unpaired sample t-test was utilized to identify any significant differences between groups. Pearson’s correlation was used to evaluate the relationship. In all statistical analyses, a probability value of 0.05 was considered the threshold for significance.
3. Results
Our study included 23 eyes of 12 healthy subjects. Demographic information is included in Table 1.

Table 1.
Demographic characteristics of study subjects.
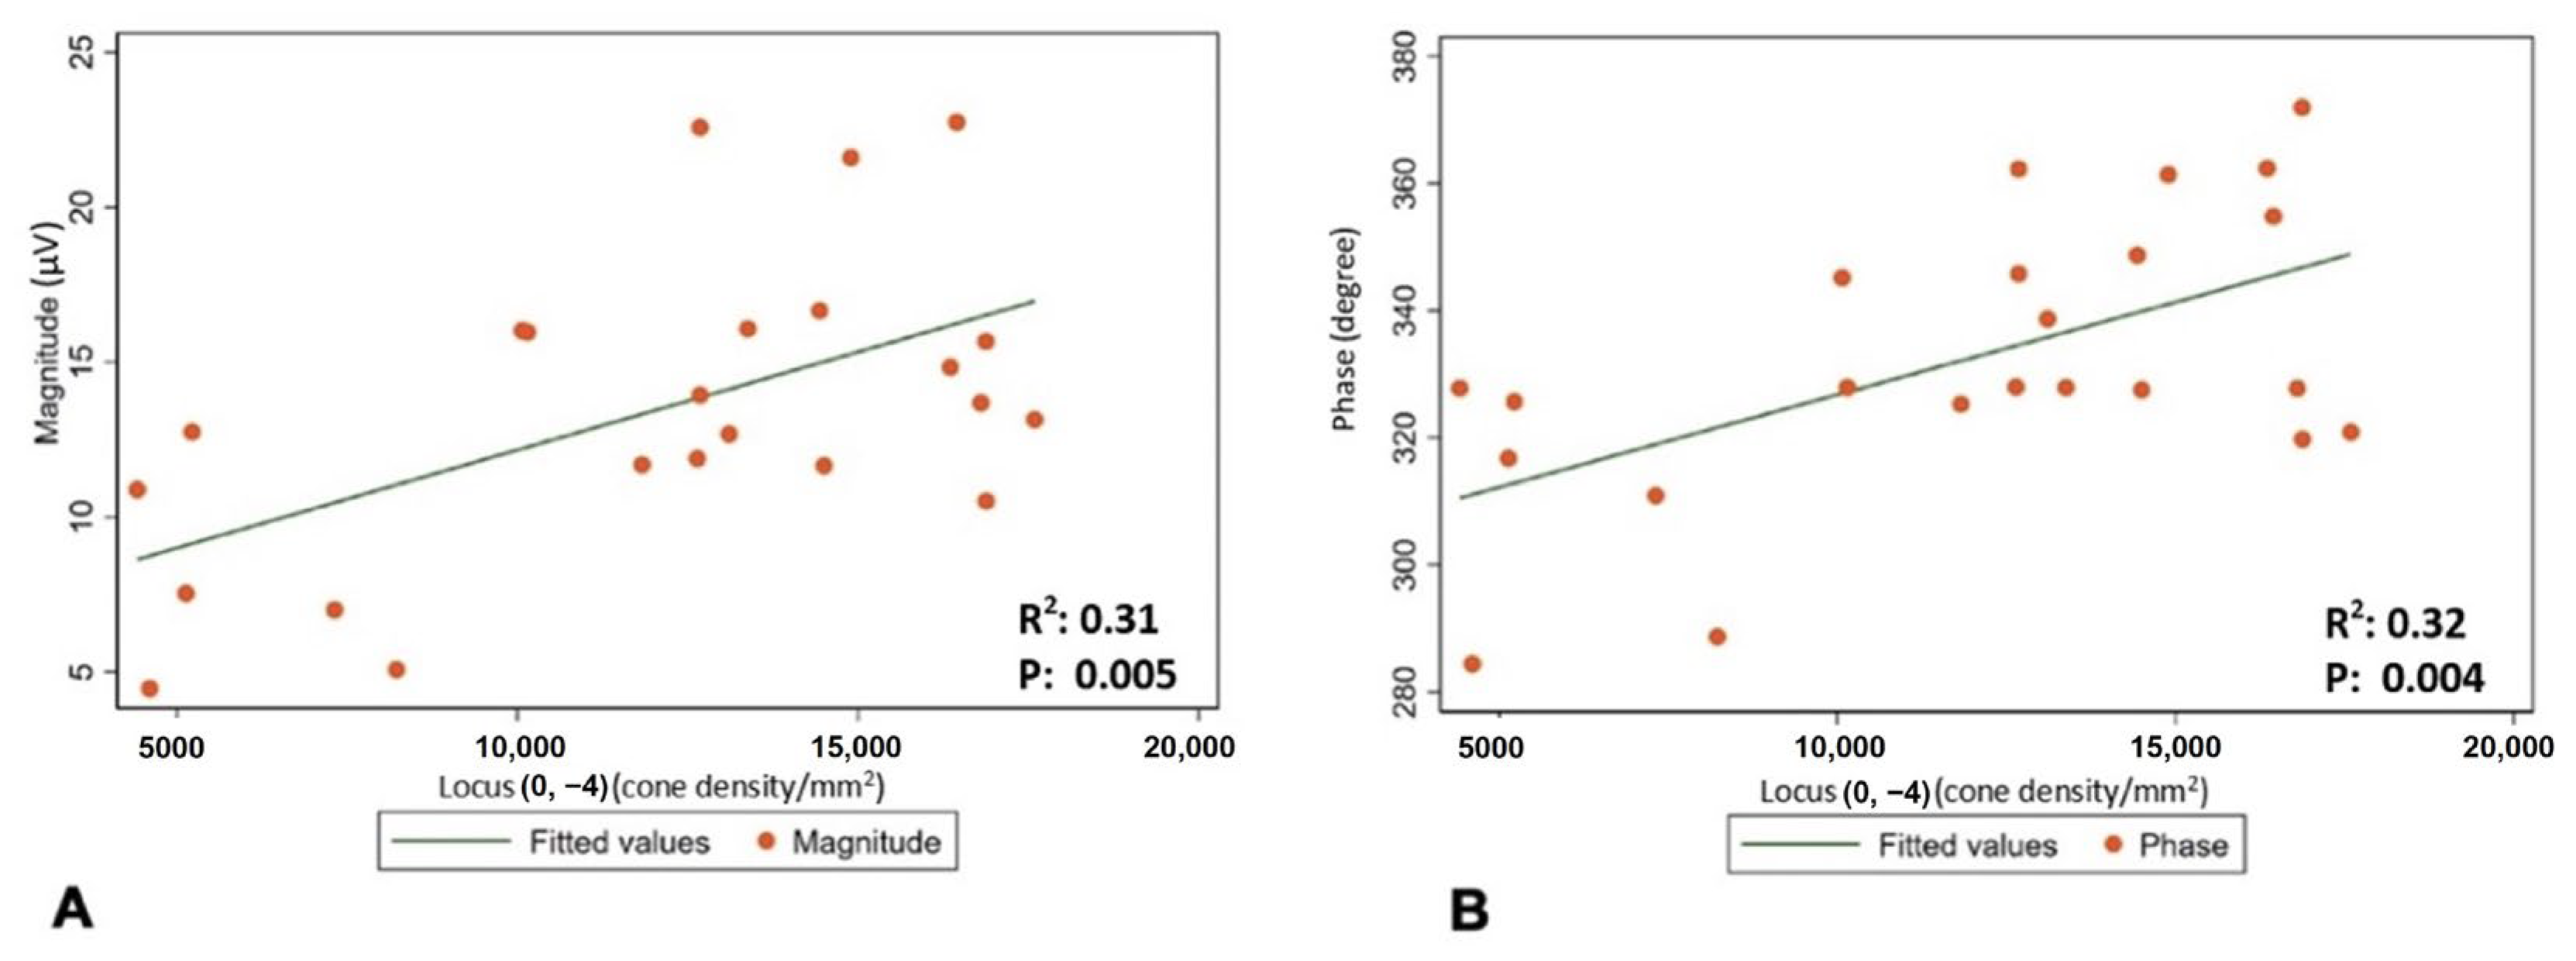
The mean (±SD) spherical equivalent (SE) was −0.48 (±0.23) D. The mean (±SD) magnitude of flicker response was 13.44 ± 4.88 µV, and the mean (±SD) phase of the flicker response was 332.63 ± 22.12 °. The total mean (±SD) was 14,648.64 cones/mm2 (±5489.59). Minimum number of cones was found to be in location , and it was 10,858 (±3945.52). The maximum number of cones was found to be in location , and it was 21,324.32 (±5162.36) (Figure 2 and Table 2). Regression analysis was performed to evaluate correlation between the magnitude and phase of the ffERG and macular cone density and showed a significant correlation in location (p-value 0.005 and 0.004, and R2 0.31 and 0.32, respectively) (Table 3 and Figure 3A,B).
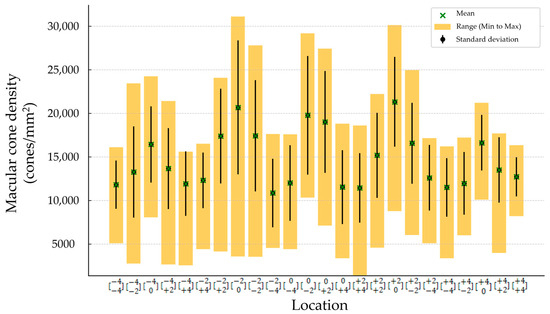
Figure 2.
Macular cone density in each location.
Table 2.
Mean (±SD), minimum, and maximum measurements of macular cone density at 24 locations.
Table 3.
Correlation between magnitude and phase of ffERG and cone density at 24 locations.
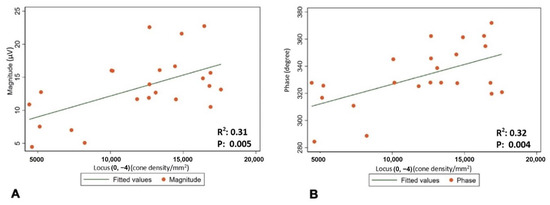
Figure 3.
(A) Correlation between cone density in location and mean magnitude of flicker response. (B) Correlation between cone density in location and mean phase of flicker response.
4. Discussion
The observed correlation between the macular cone density and magnitude and phase of Diopsys fixed-luminance flicker full-field ERG (ffERG) carries promising clinical implications. Full-field flicker ERG is a comprehensive method to evaluate cone cell function throughout the retina, but its limitations in terms of time consumption and patient discomfort, especially for those with photophobia, necessitate the evaluation of alternative approaches. Our results showed a statistically significant correlation between macular cone density at location and fixed-luminance flicker ffERG parameters. This could be associated with the unique organization of the human trichromatic cone mosaic, the fact that the signal from the M cone contributes more to the ERG than the signal from other cones, and the distribution of various types of cones throughout the retina [26].
By establishing a statistically significant correlation between macular cone density at location and fixed-luminance flicker ffERG parameters, our findings suggest a potential link between the structural characteristics of the macular cones and their functional performance, as assessed by the flicker ffERG, and provide a promising avenue for early diagnosis and the monitoring of retinal diseases that affect cone function.
By establishing a relationship between the macular cone density and magnitude and phase of the fixed-luminance flicker ffERG, clinicians may be able to identify subtle and localized changes in cone density even before the onset of noticeable symptoms or significant functional impairments. These changes might not have a substantial impact on the flicker ffERG; however, they can be identified through rtx1TM. This early detection could be crucial in initiating timely interventions and treatment strategies, ultimately leading to better patient outcomes. Moreover, the correlation between the macular cone density and magnitude and phase of flicker ffERG provides a non-invasive and relatively quick alternative for assessing cone function compared to flicker ffERG techniques. Flicker ffERG can be time-consuming, requires high level of patient compliance, and involves exposing patients to bright flashes of light, which can be challenging for individuals with photophobia or those who may have difficulty tolerating such stimuli. By utilizing the rtx1TM measurement, which are less invasive and more patient-friendly, clinicians can potentially overcome these limitations and expand the accessibility of diagnostic assessments for a broader range of patients.
This finding also opens possibilities for further research and advancements in understanding retinal diseases. By exploring the relationship between macular cone density and flicker ffERG in different patient populations and disease conditions, researchers can gain insights into the underlying mechanisms of cone dysfunction.
While the findings of the study provide valuable insights into the relationship between these variables, it is important to acknowledge the limitations that may have influenced the results and interpretation of the findings.
Firstly, the small sample size used in the study limits the generalizability of the results. With a limited number of participants, the findings may not adequately represent the broader population or allow for robust statistical analyses. As this was an exploratory study, a formal sample size calculation to ensure statistical power was not performed. Secondly, the mean age of the studied subjects was 35.2 years, as participants were selected based on their health status to exclude systemic diseases. This preference for younger, healthy individuals introduces a potential selection bias and may limit the applicability of the findings to older populations or those with systemic conditions. Thirdly, the study was conducted in a single tertiary hospital located in the western United States, limiting the ethnic diversity of the study population. As the findings may not fully represent populations from other geographic regions or ethnic backgrounds. Future research with larger sample sizes, including diseased retinas and incorporating multicenter and multinational studies, would be necessary to confirm the observed correlations, provide a more comprehensive evaluation of these relationships, and enhance the reliability of the findings.
Another limitation of the study lies in the subjective nature of the rtx1TM measurement technique for determining the foveal center point. The identification of the foveal center point relies on the operator’s skills and the patient’s compliance, introducing potential variability and measurement errors. Different operators may have different levels of expertise or interpretations, leading to inconsistencies in identifying the exact foveal center point. Consequently, such a subjective aspect could introduce bias and impact the accuracy of the cone density measurements.
Furthermore, the assumption made by the rtx1TM device, which considers the center of the image as the center of the fovea, may not always align with the true anatomical center of the fovea [27]. This discrepancy introduces a potential source of error in determining the exact location for cone density measurements. Variations in the actual position of the foveal center among individuals could affect the correlation results between the cone density and the Diopsys flicker ffERG variables. If the patient maintains fixation on the target and sustains it throughout the study, the discrepancy may not have a significant impact on the results. However, even subtle instances of fixation loss during the imaging process could potentially have a significant effect on the results.
Additionally, the study identified the subjective and operator-dependent nature of adjusting the focus for each image as a limitation [28]. Achieving optimal focus for every image is crucial to obtain accurate measurements of cone density. However, differences in operator technique or interpretation may result in variations in focus adjustments, potentially leading to inconsistencies and affecting the precision of the cone density measurements. The lack of standardized protocols for adjusting focus across different operators further exacerbates this limitation.
Considering these limitations, it is important to interpret the findings of this study with caution. While the observed correlations between the macular cone density at location and magnitude and phase of Diopsys flicker ffERG provide initial evidence of a relationship, the small sample size, subjective nature of the rtx1TM measurements, reliance on operator skills, and potential inconsistencies in determining the foveal center point and adjusting focus introduce uncertainties.
Future research should aim to address these limitations by employing larger sample sizes, implementing standardized protocols for measurements, and exploring alternative objective techniques for determining the foveal center. By addressing these limitations, future studies can enhance the reliability and validity of the findings, providing a more comprehensive understanding of the relationship between macular cone density and Diopsys flicker ffERG variables.
5. Conclusions
The observed correlation between the macular cone density in location and magnitude and phase of Diopsys full-field flicker ERG may hold important clinical implications for the diagnosis and monitoring of retinal diseases affecting the cone. The correlation also offers a non-invasive and relatively quick alternative to traditional ERG techniques, which can be time-consuming and difficult for certain patients. Future research is necessary to enhance our understanding of the relationship between macular cone density and full-field flicker ERG variables.
Author Contributions
Conceptualization, S.S.M. and Q.D.N.; Methodology, S.S.M.; Formal analysis, S.S.M. and W.-S.Y.; Investigation, A.M., V.B., A.A., D.E.F., O.E., J.-H.H., C.Y., A.G., T.J., B.G., T.B.N., A.K. and Z.X.T.; Data curation, S.S.M. and W.-S.Y.; writing—original draft preparation, S.S.M.; Writing—review and editing, S.S.M., W.-S.Y., N.Y., H.K.J., C.O., A.M., V.B., A.A., D.E.F., O.E., J.-H.H., C.Y., A.G., T.J., B.G., T.B.N., A.K. and Z.X.T.; Visualization, S.S.M. and W.-S.Y.; supervision, D.D. and Q.D.N.; Project administration, Q.D.N.; Funding acquisition, Q.D.N. All authors have read and agreed to the published version of the manuscript.
Funding
The Byers Eye Institute is supported by funding from the National Eye Institute (1P30EY026877-22A1) and from the Research to Prevent Blindness, Inc.
Institutional Review Board Statement
The study was conducted in accordance with the Declaration of Helsinki and approved by the Institutional Review Board of Stanford University (IRB-41266).
Informed Consent Statement
Informed consent was obtained from all subjects involved in the study.
Data Availability Statement
The data presented in this study are available in this article.
Conflicts of Interest
The authors declare no conflicts of interest.
References
- Robson, A.G.; Frishman, L.J.; Grigg, J.; Hamilton, R.; Jeffrey, B.G.; Kondo, M.; Li, S.; McCulloch, D.L. ISCEV Standard for full-field clinical electroretinography (2022 update). Doc. Ophthalmol. 2022, 144, 165–177. [Google Scholar] [CrossRef]
- Bresnick, G.H.; Palta, M. Temporal aspects of the electroretinogram in diabetic retinopathy. Arch. Ophthalmol. 1987, 105, 660–664. [Google Scholar] [CrossRef]
- Good, P.; Searle, A.; Campbell, S.; Crews, S. Value of the ERG in congenital nystagmus. Br. J. Ophthalmol. 1989, 73, 512–515. [Google Scholar] [CrossRef] [PubMed]
- Massof, R.; Johnson, M.; Sunness, J.; Perry, C.; Finkelstein, D. Flicker electroretinogram in retinitis pigmentosa. Doc. Ophthalmol. 1986, 62, 231–245. [Google Scholar] [CrossRef] [PubMed]
- Hood, D.C.; Birch, D.G. Abnormalities of the retinal cone system in retinitis pigmentosa. Vis. Res. 1996, 36, 1699–1709. [Google Scholar] [CrossRef] [PubMed]
- Francis, P.J.; Marinescu, A.; Fitzke, F.W.; Bird, A.C.; Holder, G.E. Acute zonal occult outer retinopathy: Towards a set of diagnostic criteria. Br. J. Ophthalmol. 2005, 89, 70–73. [Google Scholar] [CrossRef]
- Weleber, R.G.; Watzke, R.C.; Shults, W.T.; Trzupek, K.M.; Heckenlively, J.R.; Egan, R.A.; Adamus, G. Clinical and electrophysiologic characterization of paraneoplastic and autoimmune retinopathies associated with antienolase antibodies. Am. J. Ophthalmol. 2005, 139, 780–794. [Google Scholar] [CrossRef]
- Tahara, K.; Matsuura, T.; Otori, T. Diagnostic evaluation of diabetic retinopathy by 30-Hz flicker electroretinography. Jpn. J. Ophthalmol. 1993, 37, 204–210. [Google Scholar]
- Johnson, M.; Marcus, S.; Elman, M.; McPhee, T. Electroretinographic abnormalities associated with neovascularization in central retinal vein occlusion. Arch. Ophthalmol. 1988, 106, 348–352. [Google Scholar] [CrossRef]
- Larsson, J.; Andréasson, S. Photopic 30 Hz flicker ERG as a predictor for rubeosis in central retinal vein occlusion. Br. J. Ophthalmol. 2001, 85, 683–685. [Google Scholar] [CrossRef]
- Ponjavic, V.; Andréasson, S. Multifocal ERG and full-field ERG in patients on long-term vigabatrin medication. Doc. Ophthalmol. 2001, 102, 63–72. [Google Scholar] [CrossRef] [PubMed]
- Zoumalan, C.I.; Zamanian, R.T.; Doyle, R.L.; Marmor, M.F. ERG evaluation of daily, high-dose sildenafil usage. Doc. Ophthalmol. 2009, 118, 225–231. [Google Scholar] [CrossRef]
- Otsuka, Y.; Oishi, A.; Miyata, M.; Oishi, M.; Hasegawa, T.; Numa, S.; Ikeda, H.O.; Tsujikawa, A. Wavelength of light and photophobia in inherited retinal dystrophy. Sci. Rep. 2020, 10, 14798. [Google Scholar] [CrossRef]
- Curcio, C.A.; Sloan, K.R.; Kalina, R.E.; Hendrickson, A.E. Human photoreceptor topography. J. Comp. Neurol. 1990, 292, 497–523. [Google Scholar] [CrossRef] [PubMed]
- Dacey, D.M. The mosaic of midget ganglion cells in the human retina. J. Neurosci. 1993, 13, 5334–5355. [Google Scholar] [CrossRef]
- Curcio, C.A.; Allen, K.A. Topography of ganglion cells in human retina. J. Comp. Neurol. 1990, 300, 5–25. [Google Scholar] [CrossRef]
- Duncan, R.O.; Boynton, G.M. Cortical magnification within human primary visual cortex correlates with acuity thresholds. Neuron 2003, 38, 659–671. [Google Scholar] [CrossRef] [PubMed]
- Hendrickson, A. Organization of the Adult Primate Fovea. In Macular Degeneration; Penfold, P.L., Provis, J.M., Eds.; Springer: Berlin/Heidelberg, Germany, 2005; pp. 1–23. [Google Scholar]
- Jonas, J.B.; Schneider, U.; Naumann, G.O. Count and density of human retinal photoreceptors. Graefe’s Arch. Clin. Exp. Ophthalmol. 1992, 230, 505–510. [Google Scholar] [CrossRef]
- Wroblewski, J.J.; McChancy, C.; Pickel, K.; Buterbaugh, H.; Wieland, T.; Gonzalez, A. Reproducibility of fixed-luminance and multi-luminance flicker electroretinography in patients with diabetic retinopathy using an office-based testing paradigm. J. Diabetes Sci. Technol. 2020, 14, 1095–1103. [Google Scholar] [CrossRef]
- Mobasserian, A.; Zaidi, M.; Halim, S.; Hwang, J.J.; Regenold, J.; Akhavanrezayat, A.; Karaca, I.; Khojasteh Jafari, H.; Yavari, N.; Matsumiya, W.; et al. Effect of Pupil Size on Fixed-Luminance Flicker Full-Field Electroretinogram Magnitude. Clin. Ophthalmol. 2022, 16, 3733–3740. [Google Scholar] [CrossRef]
- Creel, D.J. Electroretinograms. Handb. Clin. Neurol. 2019, 160, 481–493. [Google Scholar] [CrossRef] [PubMed]
- Regenold, J.; Doan, H.L.; Ghoraba, H.; Khojasteh, H.; Jaclyn Hwang, J.J.; Yavari, N.; Akhavanrezayat, A.; Than, N.T.T.; Le, A.H.D.; Halim, M.S.; et al. Evaluation of correlation between Diopsys® NOVA™ fixed-luminance flicker ERG and Diagnosys® Espion 2™ flicker ERG parameters. Doc. Ophthalmol. 2023, 146, 257–266. [Google Scholar] [CrossRef] [PubMed]
- Legras, R.; Gaudric, A.; Woog, K. Distribution of cone density, spacing and arrangement in adult healthy retinas with adaptive optics flood illumination. PLoS ONE 2018, 13, e0191141. [Google Scholar] [CrossRef]
- Soliman, M.K.; Sadiq, M.A.; Agarwal, A.; Sarwar, S.; Hassan, M.; Hanout, M.; Graf, F.; High, R.; Do, D.V.; Nguyen, Q.D.; et al. High-Resolution Imaging of Parafoveal Cones in Different Stages of Diabetic Retinopathy Using Adaptive Optics Fundus Camera. PLoS ONE 2016, 11, e0152788. [Google Scholar] [CrossRef] [PubMed]
- Hofer, H.; Carroll, J.; Neitz, J.; Neitz, M.; Williams, D.R. Organization of the human trichromatic cone mosaic. J. Neurosci. 2005, 25, 9669–9679. [Google Scholar] [CrossRef]
- Roshandel, D.; Sampson, D.M.; Mackey, D.A.; Chen, F.K. Impact of Reference Center Choice on Adaptive Optics Imaging Cone Mosaic Analysis. Investig. Ophthalmol. Vis. Sci. 2022, 63, 12. [Google Scholar] [CrossRef]
- Alonso-Caneiro, D.; Sampson, D.M.; Chew, A.L.; Collins, M.J.; Chen, F.K. Use of focus measure operators for characterization of flood illumination adaptive optics ophthalmoscopy image quality. Biomed. Opt. Express 2018, 9, 679–693. [Google Scholar] [CrossRef]


Disclaimer/Publisher’s Note: The statements, opinions and data contained in all publications are solely those of the individual author(s) and contributor(s) and not of MDPI and/or the editor(s). MDPI and/or the editor(s) disclaim responsibility for any injury to people or property resulting from any ideas, methods, instructions or products referred to in the content. |
© 2025 by the authors. Licensee MDPI, Basel, Switzerland. This article is an open access article distributed under the terms and conditions of the Creative Commons Attribution (CC BY) license (https://creativecommons.org/licenses/by/4.0/).