

Assessment of Body Morphometry to Classify Two Colombian Creole Pigs Using Statistical and Machine Learning Methods
 , and
, and
Abstract
:1. Introduction
2. Materials and Methods
2.1. Study Site
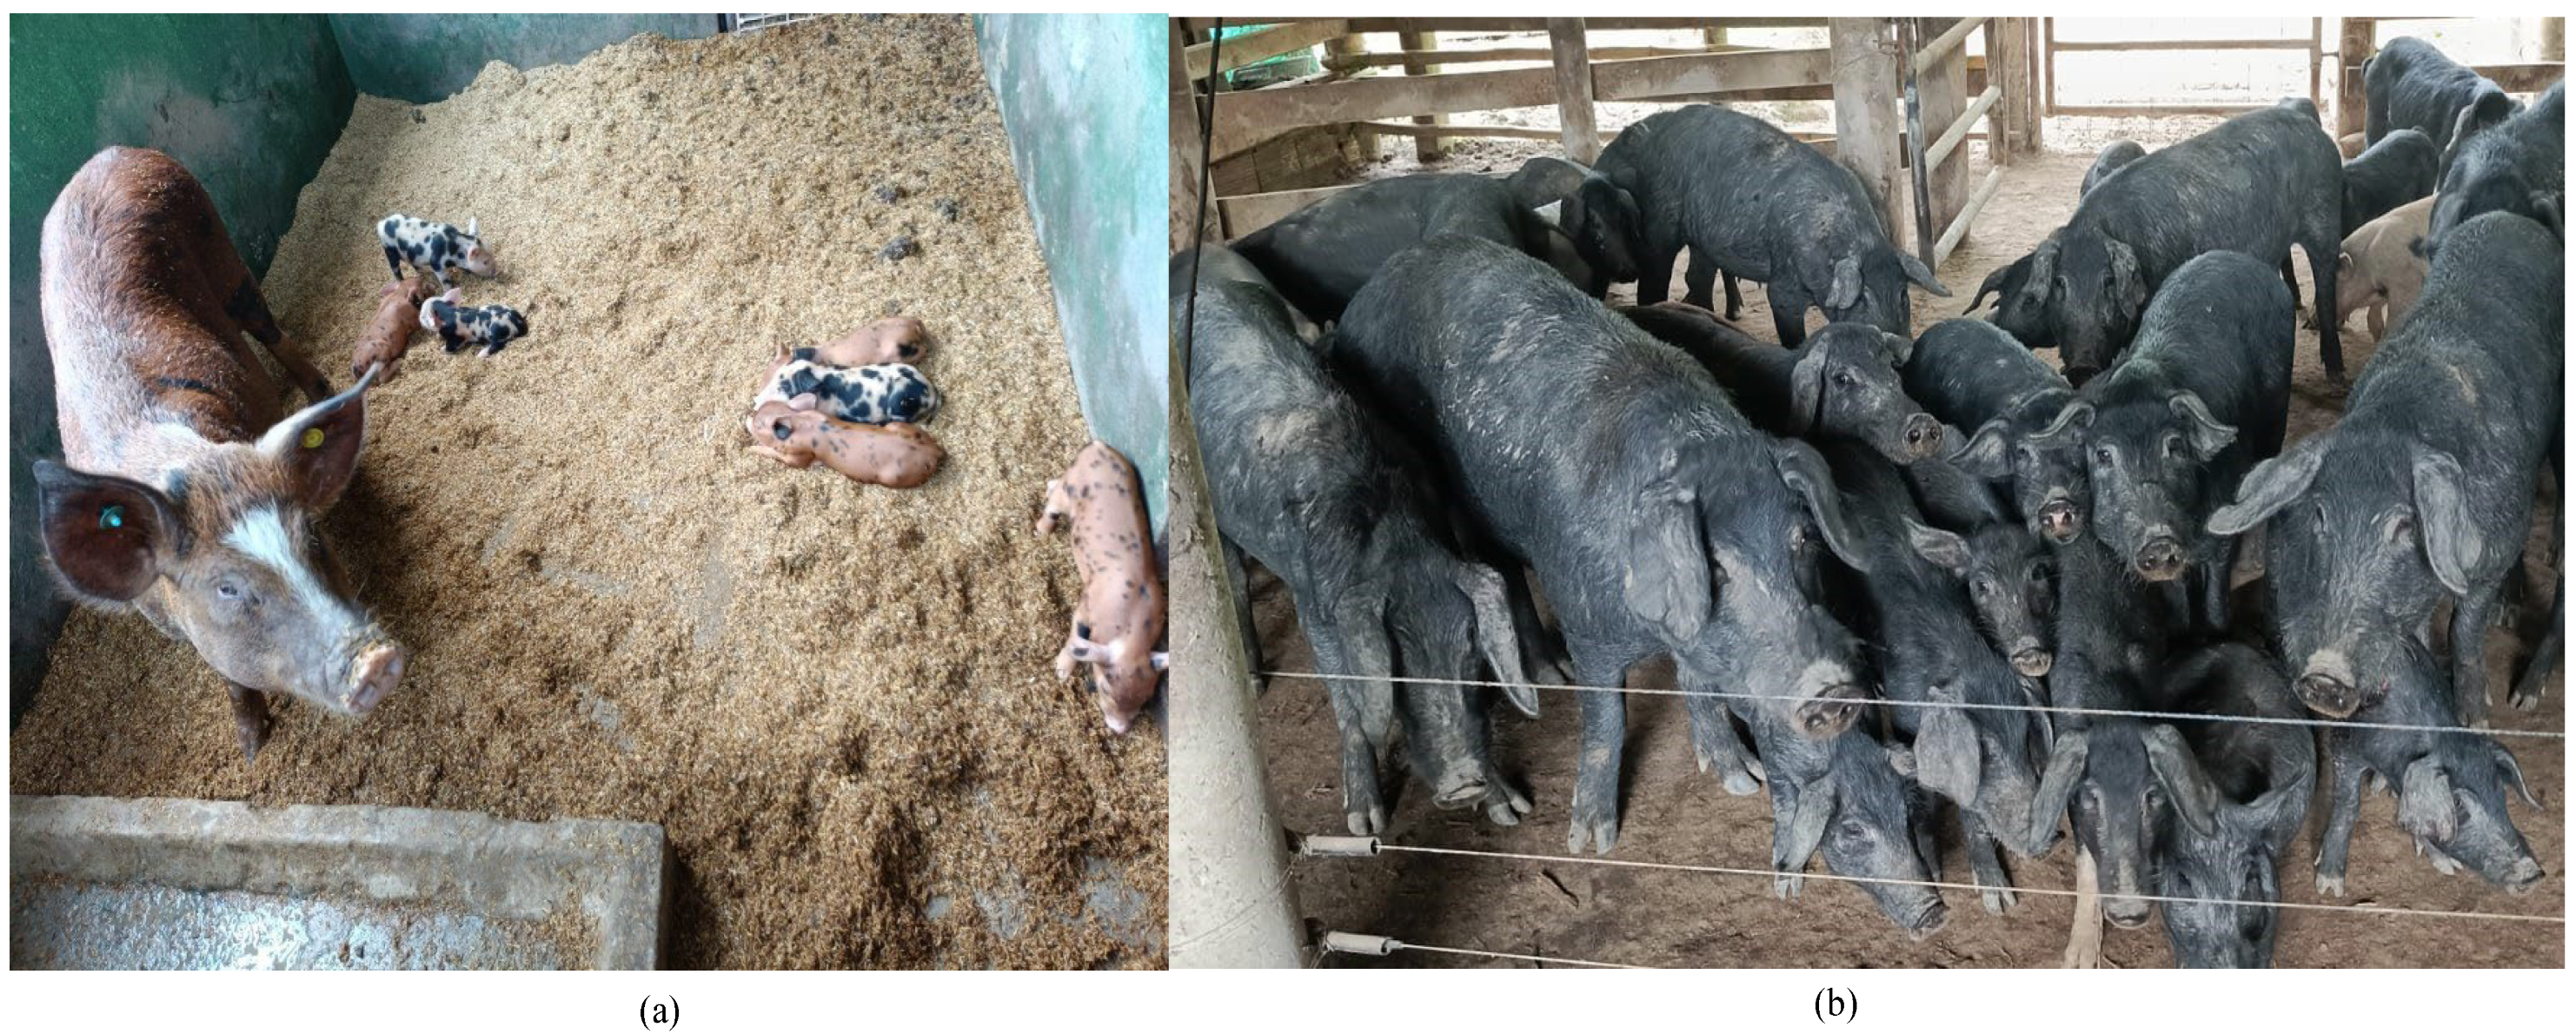
2.2. Animals Sampled
2.3. Measured Variables
2.4. Statistical Analysis
3. Results
4. Discussion
5. Conclusions
Author Contributions
Funding
Institutional Review Board Statement
Informed Consent Statement
Data Availability Statement
Acknowledgments
Conflicts of Interest
References
- Benítez, O.W.; Sánchez, M.D.; Los Cerdos Locales en Los Sistemas Tradicionales de Producción. Producción y Sanidad Animal. Estudio FAO 148. 2002. Available online: http://www.fao.org/3/a-y2292s.pdf (accessed on 4 November 2024).
- Ramirez, O.; Ojeda, A.; Tomas, A.; Gallardo, D.; Huang, L.S.; Folch, J.M.; Clop, A.; Sánchez, A.; Badaoui, B.; Hanotte, O.; et al. Integrating Y-chromosome, mitochondrial, and autosomal data to analyze the origin of pig breeds. Mol. Biol. Evol. 2009, 26, 2061–2072. [Google Scholar] [CrossRef] [PubMed]
- Pinzón, E. El cerdo ibérico, ascentro del porcino criollo. Rev. Carta Ganad. 1993, 30, 18–22. [Google Scholar]
- Espinosa, C.; Ly, J. Cerdos criollos colombianos y agricultura sostenible. Rev. Comput. Produc. Porc. 2015, 22, 1–9. [Google Scholar]
- Linares, V.; Linares, L.; Mendoza, G. Caracterización etnozootécnica y potencial carnicero de Sus scrofa“cerdo criollo” en Latinoamérica. Sci. Agropec. 2011, 2, 97–110. [Google Scholar] [CrossRef]
- Hurtado, E.; Gonzalez, C.; Vecchionacce, H. Los Sistemas de Producción del Cerdo Criollo en Los Estados Llaneros de Venezuela. In Proceedings of the VII Encuentro de Nutrición y Producción de Animales Monogástricos, Merida, Yucatán, México, 2–3 May 2003. [Google Scholar]
- Hurtado, E.; González, C.; Vecchionacce, H. Estudio morfológico del cerdo criollo del estado Apure, Venezuela. Zootec. Trop. 2005, 23, 17–25. [Google Scholar]
- Cortés, O.; Martínez, A.M.; Cañon, J.; Sevane, N.; Gama, L.T.; Ginja, C.; Landi, V.; Zaragoza, P.; Carolino, N.; Vicente, A.; et al. Conservation priorities of Iberoamerican pig breeds and their ancestors based on microsatellite information. Heredity 2016, 117, 14–24. [Google Scholar] [CrossRef]
- Espinosa Pullaguari, J.D. Caracterización Fenotípica del Cerdo Criollo en Los Cantones Zapotillo y Puyangode la Provincia de Loja; Título Médico Veterinario y Zootecnista; Universidad Nacional de Loja: Loja, Ecuador, 2016. [Google Scholar]
- Galíndez, R.; Ramis, C.; Martínez Galíndez, R.; Ángulo, L.; Bedoya, A.; de Farías, Y. Variabilidad genética de seis poblaciones del cerdo Criollo venezolano usando marcadores microsatélites. Rev. Fac. Agron. (UCV) 2016, 42, 91–100. [Google Scholar]
- Barrera, G.P.; Martínez, R.A.; Ortegón, J.; Ortiz, A.; Moreno, F.; Velázquez, H.; Pérez, J.E.A.Y. Cerdos Criollos Colombianos, Caracterización Racial, Productiva y Genética; CORPOICA. 2007. Available online: https://repositorio.minciencias.gov.co/entities/publication/5b28e29e-f471-4b2c-90a6-6e56343647c6 (accessed on 23 April 2025).
- Ocampo-Gallego, R.J.; Tobón-Castaño, J.A.; Martínez-Oquendo, P.Y.; Ramírez-Toro, J.; Lucero-Casanova, C.E. Análisis de diversidad genética en cerdo criollo san pedreño utilizando datos de pedigrí. Ecosist. Rec. Agropec. 2019, 6, 333–341. [Google Scholar] [CrossRef]
- Food and Agriculture Organization of the United Nations (FAO). Domestic Animal Diversity Information System (DAD-IS). Breed Data Sheet. Colombia, Pig. Available online: https://www.fao.org/dad-is/browse-by-country-and-species/en/ (accessed on 4 November 2024).
- Poveda, H.C.A.; Moncada Bueno, A. Cerdo Casco de Mula; Los Animales Domésticos Criollos y Colombianos en la Producción Pecuaria Nacional; ICA: Bogotá, Colombia, 2001. [Google Scholar]
- Food and Agriculture Organization of the United Nations (FAO). Phenotypic Characterization of Animal Genetic Resources. Animal Production and Health Guidelines No. 11. Rome. 2012. Available online: https://www.fao.org/4/i2686e/i2686e00.htm (accessed on 23 April 2025).
- Parés i Casnaova, P.M. Zoometría. In Valoración Morfológica de Los Animales Domésticos. Ministerio de Medio Ambiente y Medio Rural y Marino; Sañudo Astiz, C., Ed.; Artegraf, Industrias Graficas S.A: Madrid, Spain, 2009; pp. 167–198. [Google Scholar]
- Cattáneo, A.; Trigo, M.; Arias, R.; Antonini, A. Uso de Indices Zoométricos en un Hato Caprino Criollo Cruza Como HerramCienta Para evaluar Biotipos Según Categoría. In XIV Jornadas de Divulgación Técnico-Científicas; Jornada Latinoamericana; Universidad Nacional de Rosario: Rosario, Argentina, 2013. [Google Scholar]
- Salako, A. Application of morphological indices in the assessment of type and function in Sheep. Int. J. Morphol. 2006, 24, 13–18. [Google Scholar] [CrossRef]
- Domínguez-García, A.C.; Moclán, A.; Stoetzel, E.; Cucchi, T.; Sevilla, P.; Laplana, C. Morfometría Geométrica y Aprendizaje Automático Aplicados a la Diferenciación de Especies de Roedores del Género Mus Linnaeus, 1758. In Proceedings of the XXXVIII Jornadas de la Sociedad Española de Paleontología, Valencia, Spain, 4–7 October 2023; p. 70. [Google Scholar]
- Jordan, M.I.; Mitchell, T.M. Machine learning: Trends, perspectives, and prospects. Science 2015, 349, 255–260. [Google Scholar] [CrossRef]
- Verma, V.K.; Verma, S. Machine learning applications in healthcare sector: An overview. Mater. Today Proc. 2022, 57, 2144–2147. [Google Scholar] [CrossRef]
- Aracena, C.; Villena, F.; Arias, F.; Dunstan, J. Aplicaciones de aprendizaje automático en salud. Rev. Med. Clin. Las Condes 2022, 33, 568–575. [Google Scholar] [CrossRef]
- Satola, A.; Łuszczyński, J.; Petrych, W.; Satoła, K. Body Weight Prediction from Linear Measurements of Icelandic Foals: A Machine Learning Approach. Animals 2022, 12, 1234. [Google Scholar] [CrossRef] [PubMed]
- He, Y.; Tiezzi, T.; Howard, J.; Maltecca, C. Predicting body weight in growing pigs from feeding behavior data using machine learning algorithms. Comput. Electron. Agric. 2021, 184, e106085. [Google Scholar] [CrossRef]
- Borowski, P.; Chlebus, M. Machine Learning in the Prediction of Flat Horse Racing Results in Poland; Working Papers N° 13/2021 (361); University of Warsaw: Warszawa, Poland, 2021. [Google Scholar]
- Abdul Ghafoor, N.; Sitkowska, B. MasPA: A machine learning application to predict risk of mastitis in cattle from AMS sensor data. AgriEngineering 2021, 3, 575–583. [Google Scholar] [CrossRef]
- Satoła, A.; Bauer, E.A. Predicting subclinical ketosis in dairy cows using machine learning techniques. Animals 2021, 11, 2131. [Google Scholar] [CrossRef]
- Becker, C.A.; Aghalari, A.; Marufuzzaman, M.; Stone, A.E. Predicting dairy cattle heat stress using machine learning techniques. J. Dairy Sci. 2021, 104, 505–524. [Google Scholar] [CrossRef]
- Fogarty, E.S.; Swain, D.L.; Cronin, G.M.; Moraes, L.E.; Bailey, D.W.; Trotter, M. Developing a simulated online model that integrates GNSS, accelerometer and weather data to detect parturition events in grazing sheep: A machine learning approach. Animals 2021, 11, 303. [Google Scholar] [CrossRef]
- Climate Data. Clima: Meta, Colombia. Available online: https://es.climate-data.org/america-del-sur/colombia/meta-77/ (accessed on 24 November 2024).
- Rincón Castillo, A.; Bueno Guzmán, G.A.; Álvarez de León, M.; Pardo Barbosa, O.; Pérez López, O.; Caicedo Guerrero, S. Establecimiento, Manejo y Utilización de Recursos Forrajeros en Sistemas Ganaderos de Suelos Ácidos; Manual Técnico No 15; Produmedios: Bogotá, Colombia, 2010. [Google Scholar]
- R Core Team. R: A Language and Environment for Statistical Computing; R Foundation for Statistical Computing: Vienna, Austria, 2024; Available online: https://www.R-project.org (accessed on 27 December 2024).
- Cerda, J.; Cifuentes, L. Uso de curvas ROC en investigación clínica: Aspectos teórico-prácticos. Rev. Chil. Infectol. 2012, 29, 138–141. [Google Scholar] [CrossRef]
- Sañudo Astiz, C. Valoración morfologica de los animales domésticos. In Ministerio de Medio Ambiente y Medio Rural y Marino; Artegraf, Industrias Graficas S.A: Madrid, Spain, 2009; p. 865. [Google Scholar]
- Francesch, A.; Villalba, I.; Cartañà, M. Methodology for morphological characterization of chicken and its application to compare Penedesenca and Empordanesa breeds. Anim. Genet. 2011, 48, 79–84. [Google Scholar] [CrossRef]
- Benítez, H.A.; Püschel, T.A. Modelando la varianza de la forma: Morfometría Geométrica aplicaciones en Biología Evolutiva. Int. J. Morphol. 2014, 32, 998–1008. [Google Scholar] [CrossRef]
- Martínez Velázquez, G.; Román Ponce, S.I.; Vélez Izquierdo, A.; Cabrera Torres, E.; Cantú Covarrubias, A.; Colín, L.D.C.; Durán Aguilar, M.; Maldonado Jaquez, J.A.; Martínez Silva, F.E.; Ríos Utrera, A.; et al. Morfometría del cerdo de traspatio en áreas rurales de México. Rev. Mex. Cienc. Pecu. 2016, 7, 431–440. [Google Scholar] [CrossRef]
- Montenegro, M.; Castro, G.; Llambí, S.; Barlocco, N.; Vadell, A.; Delgado, J.V.; Barba, C. Comparación de medidas zoométricas entre el cerdo Pampa Rocha y variedades oficialmente reconocidas del cerdo ibérico. Actas Iberoam. Conserv. Anim. 2014, 4, 86–88. [Google Scholar]
- Esmeraldas, R.D.; Armijos, J.R.; Maldonado, D.F.; Delgado, J.V.; Navas, F.J.; Toalombo, P.A. Comparación de las variables morfológicas de cerdos criollos en la provincia de Chimborazo y Loja. Arch. Zootec. 2023, 72, 236–243. [Google Scholar] [CrossRef]
- Jáuregui, R.; Parés-Casanova, P.M.; Lorenzo, C.R. Ausencia de dimorfismo sexual y biotipos en el cerdo criollo de la región de Ch’ortí de Guatemala. Actas Iberoam. Conserv. Anim. 2019, 14, 32–36. [Google Scholar]
- Castro, G.; Montenegro, M.; Barlocco, N.; Vadell, A.; Gagliardi, R.; Llambi, S. Caracterización zoométrica en el cerdo Pampa Rocha de Uruguay (Descriptiva primaria). Actas Iberoam. Conserv. Anim. 2012, 2, 83–86. [Google Scholar]
- Rodero Serrano, E.; González Martínez, A. Las regiones corporales de los animales domésticos. In Valoración Morfológica de los Animales Domésticos. Ministerio de Medio Ambiente y Medio Rural y Marino; Sañudo Astiz, C., Ed.; Artegraf, Industrias Graficas S.A: Madrid, Spain, 2009; pp. 102–137. [Google Scholar]
- Hernández-Baca, M.; Gámez-Rivas, A.; Zeledón-Ortega, Y. Caracterización morfológica del cerdo criollo (Sus scrofa domesticus) en el municipio de Nueva Guinea, RACCS. La Calera-Cienc. Anim. 2017, 17, 21–27. [Google Scholar] [CrossRef]
- Olmedo, W.J.; Toalombo, P.A.; Flores, L.G.; Delgado, J.V.; Navas, F.J.; Duchi, N.A. Caracterización morfológica del cerdo criollo Pillareño del cantón Guamote de Ecuador. Arch. Zootec. 2021, 70, 160–170. [Google Scholar] [CrossRef]
- Arredondo Botero, J.V.; Muñoz Florez, J.E.; Arenas, L.E.; Mosquera, M.; Pacheco, E.; Álvarez, L.Á. Morfometría del cerdo criollo del Pacífico Colombiano. Arch. Latinoam. Produc. Anim. 2021, 29, 215–223. [Google Scholar]
- Reyes, Z.; Yusimy, C.; Robert, R.; Sánchez, N.; Santana, I. Estudio morfométrico de una muestra poblacional de cerdos criollo cubano. Rev. Comput. Produc. Porc. 2018, 25, 79–85. [Google Scholar]
- Salamanca-Carreño, A.; Parés-Casanova, P.M.; Vélez Terranova, O.M.; Castro Rosa, G.; Jáuregui, R. Valoración morfométrica de una población de cerdos criollos araucanos (Colombia). Rev. Investig. Vet. Peru 2022, 33, e23794. [Google Scholar] [CrossRef]
- Herrera, M.; Luque, M. Morfoestructura y sistemas para el futuro en la valoración morfológica. In Valoración Morfológica de los Animales Domésticos. Ministerio de Medio Ambiente y Medio Rural y Marino; Sañudo, C., Ed.; Artegraf, Industrias Graficas S.A: Madrid, Spain, 2009; pp. 83–101. [Google Scholar]
- Revidatti, M.A. Caracterización de Cerdos Criollos del Nordeste Argentino. Ph.D. Thesis, Universidad de Córdoba, Córdoba, Spain, 2009. [Google Scholar]
- Sierra-Vásquez, A.C.; Ortiz-Ortiz, J.R.; Bojórquez-Cat, J.C.; Canul-Solís, M.A.; Tamayo-Canul, J.R.; Rodríguez-Pérez, J.C.; Sanginés-García, J.R.; Magaña-Magaña, M.A.; Montes-Pérez, R.C.; Segura-Correa, J.C. Conservación y uso sustentable del cerdo pelón en Yucatán. Quehacer Cient. Chiapas 2016, 11, 13–28. [Google Scholar]
- Jafari, O.; Ebrahimi, M.; Hedayati, S.A.-A.; Zeinalabedini, M.; Poorbagher, H.; Nasrolahpourmoghadam, M.; Fernandes, J.M.O. Integration of Morphometrics and Machine Learning Enables Accurate Distinction between Wild and Farmed Common Carp. Life 2022, 12, 957. [Google Scholar] [CrossRef] [PubMed]
- Salifu, D.; Ibrahim, E.A.; Tonnang, H.E.Z. Leveraging machine learning tools and algorithms for analysis of fruit fly morphometrics. Sci. Rep. 2022, 12, 7208. [Google Scholar] [CrossRef]
- Bellin, N.; Calzolari, M.; Callegari, E.; Bonilauri, P.; Grisendi, A.; Dottori, M.; Rossi, V. Geometric morphometrics and machine learning as tools for the identification of sibling mosquito species of the Maculipennis complex (Anopheles). Infect. Genet. Evol. 2021, 95, e105034. [Google Scholar] [CrossRef]
- Chicco, D.; Jurman, G. The Matthews correlation coeffi-cient (MCC) should replace the ROC AUC as the standard metric for assessing binary classification. BioData Min. 2023, 16, 4. [Google Scholar] [CrossRef]
- Macleod, N. On the Use of Machine Learning in Morphometric Analysis. Biol. Shape Anal. 2017, 134–171. [Google Scholar] [CrossRef]


| Creole Pig | Variable | Mean | SD | CV (%) | Minimum | Maximum |
|---|---|---|---|---|---|---|
| “Casco de Mula” | BW (kg) | 30.4 | 21.9 | 72.0 | 7.1 | 150.0 |
| TP (cm) | 69.4 | 14.6 | 21.0 | 44.0 | 131.0 | |
| BL (cm) | 58.2 | 11.9 | 20.4 | 38.0 | 120.0 | |
| HaW (cm) | 48.6 | 8.7 | 17.9 | 31.0 | 78.0 | |
| SH (cm) | 24.8 | 4.5 | 18.3 | 12.0 | 34.0 | |
| KP (cm) | 15.0 | 2.8 | 18.9 | 9.0 | 25.0 | |
| HL (cm) | 21.6 | 3.8 | 17.5 | 15.0 | 40.0 | |
| HW (cm) | 8.3 | 1.9 | 22.4 | 5.5 | 17.0 | |
| LEL (cm) | 15.1 | 2.6 | 17.4 | 9.9 | 22.0 | |
| LEW (cm) | 10.6 | 2.0 | 19.0 | 7.0 | 19.0 | |
| REL (cm) | 15.1 | 2.5 | 16.6 | 10.0 | 23.0 | |
| REW (cm) | 10.5 | 1.9 | 18.1 | 7.0 | 16.0 | |
| PCP (cm) | 16.0 | 6.9 | 43.3 | 10.0 | 62.0 | |
| HH (cm) | 19.4 | 2.9 | 15.0 | 15.0 | 29.0 | |
| San Pedreño | BW (kg) | 40.8 | 30.8 | 75.6 | 14.7 | 125.0 |
| TP (cm) | 75.1 | 17.3 | 23.0 | 57.0 | 120.0 | |
| BL (cm) | 63.1 | 13.5 | 21.4 | 41.0 | 91.0 | |
| HaW (cm) | 47.2 | 12.0 | 25.4 | 14.0 | 68.0 | |
| SH (cm) | 22.0 | 5.6 | 25.6 | 12.5 | 33.0 | |
| KP (cm) | 18.3 | 4.3 | 23.4 | 13.0 | 31.0 | |
| HL (cm) | 23.5 | 4.4 | 18.7 | 17.0 | 33.0 | |
| HW (cm) | 9.9 | 1.3 | 13.0 | 7.0 | 13.0 | |
| LEL (cm) | 15.9 | 3.2 | 19.8 | 10.0 | 22.0 | |
| LEW (cm) | 11.4 | 1.7 | 15.0 | 9.0 | 17.0 | |
| REL (cm) | 16.0 | 3.3 | 20.9 | 11.0 | 23.0 | |
| REW (cm) | 11.6 | 1.7 | 14.7 | 9.0 | 17.0 | |
| PCP (cm) | 17.7 | 3.8 | 21.6 | 13.0 | 28.0 | |
| HH (cm) | 19.7 | 2.3 | 11.5 | 16.0 | 23.0 |
| LDA | Observed | LR | Observed | ||
|---|---|---|---|---|---|
| Predicted | CM | SP | Predicted | CM | SP |
| CM | 46 | 7 | CM | 48 | 10 |
| SP | 8 | 23 | SP | 6 | 20 |
| QDA | Observed | CT | Observed | ||
| Predicted | CM | SP | Predicted | CM | SP |
| CM | 45 | 9 | CM | 52 | 5 |
| SP | 9 | 21 | SP | 2 | 25 |
| Model | LDA | QDA | LR | CT |
|---|---|---|---|---|
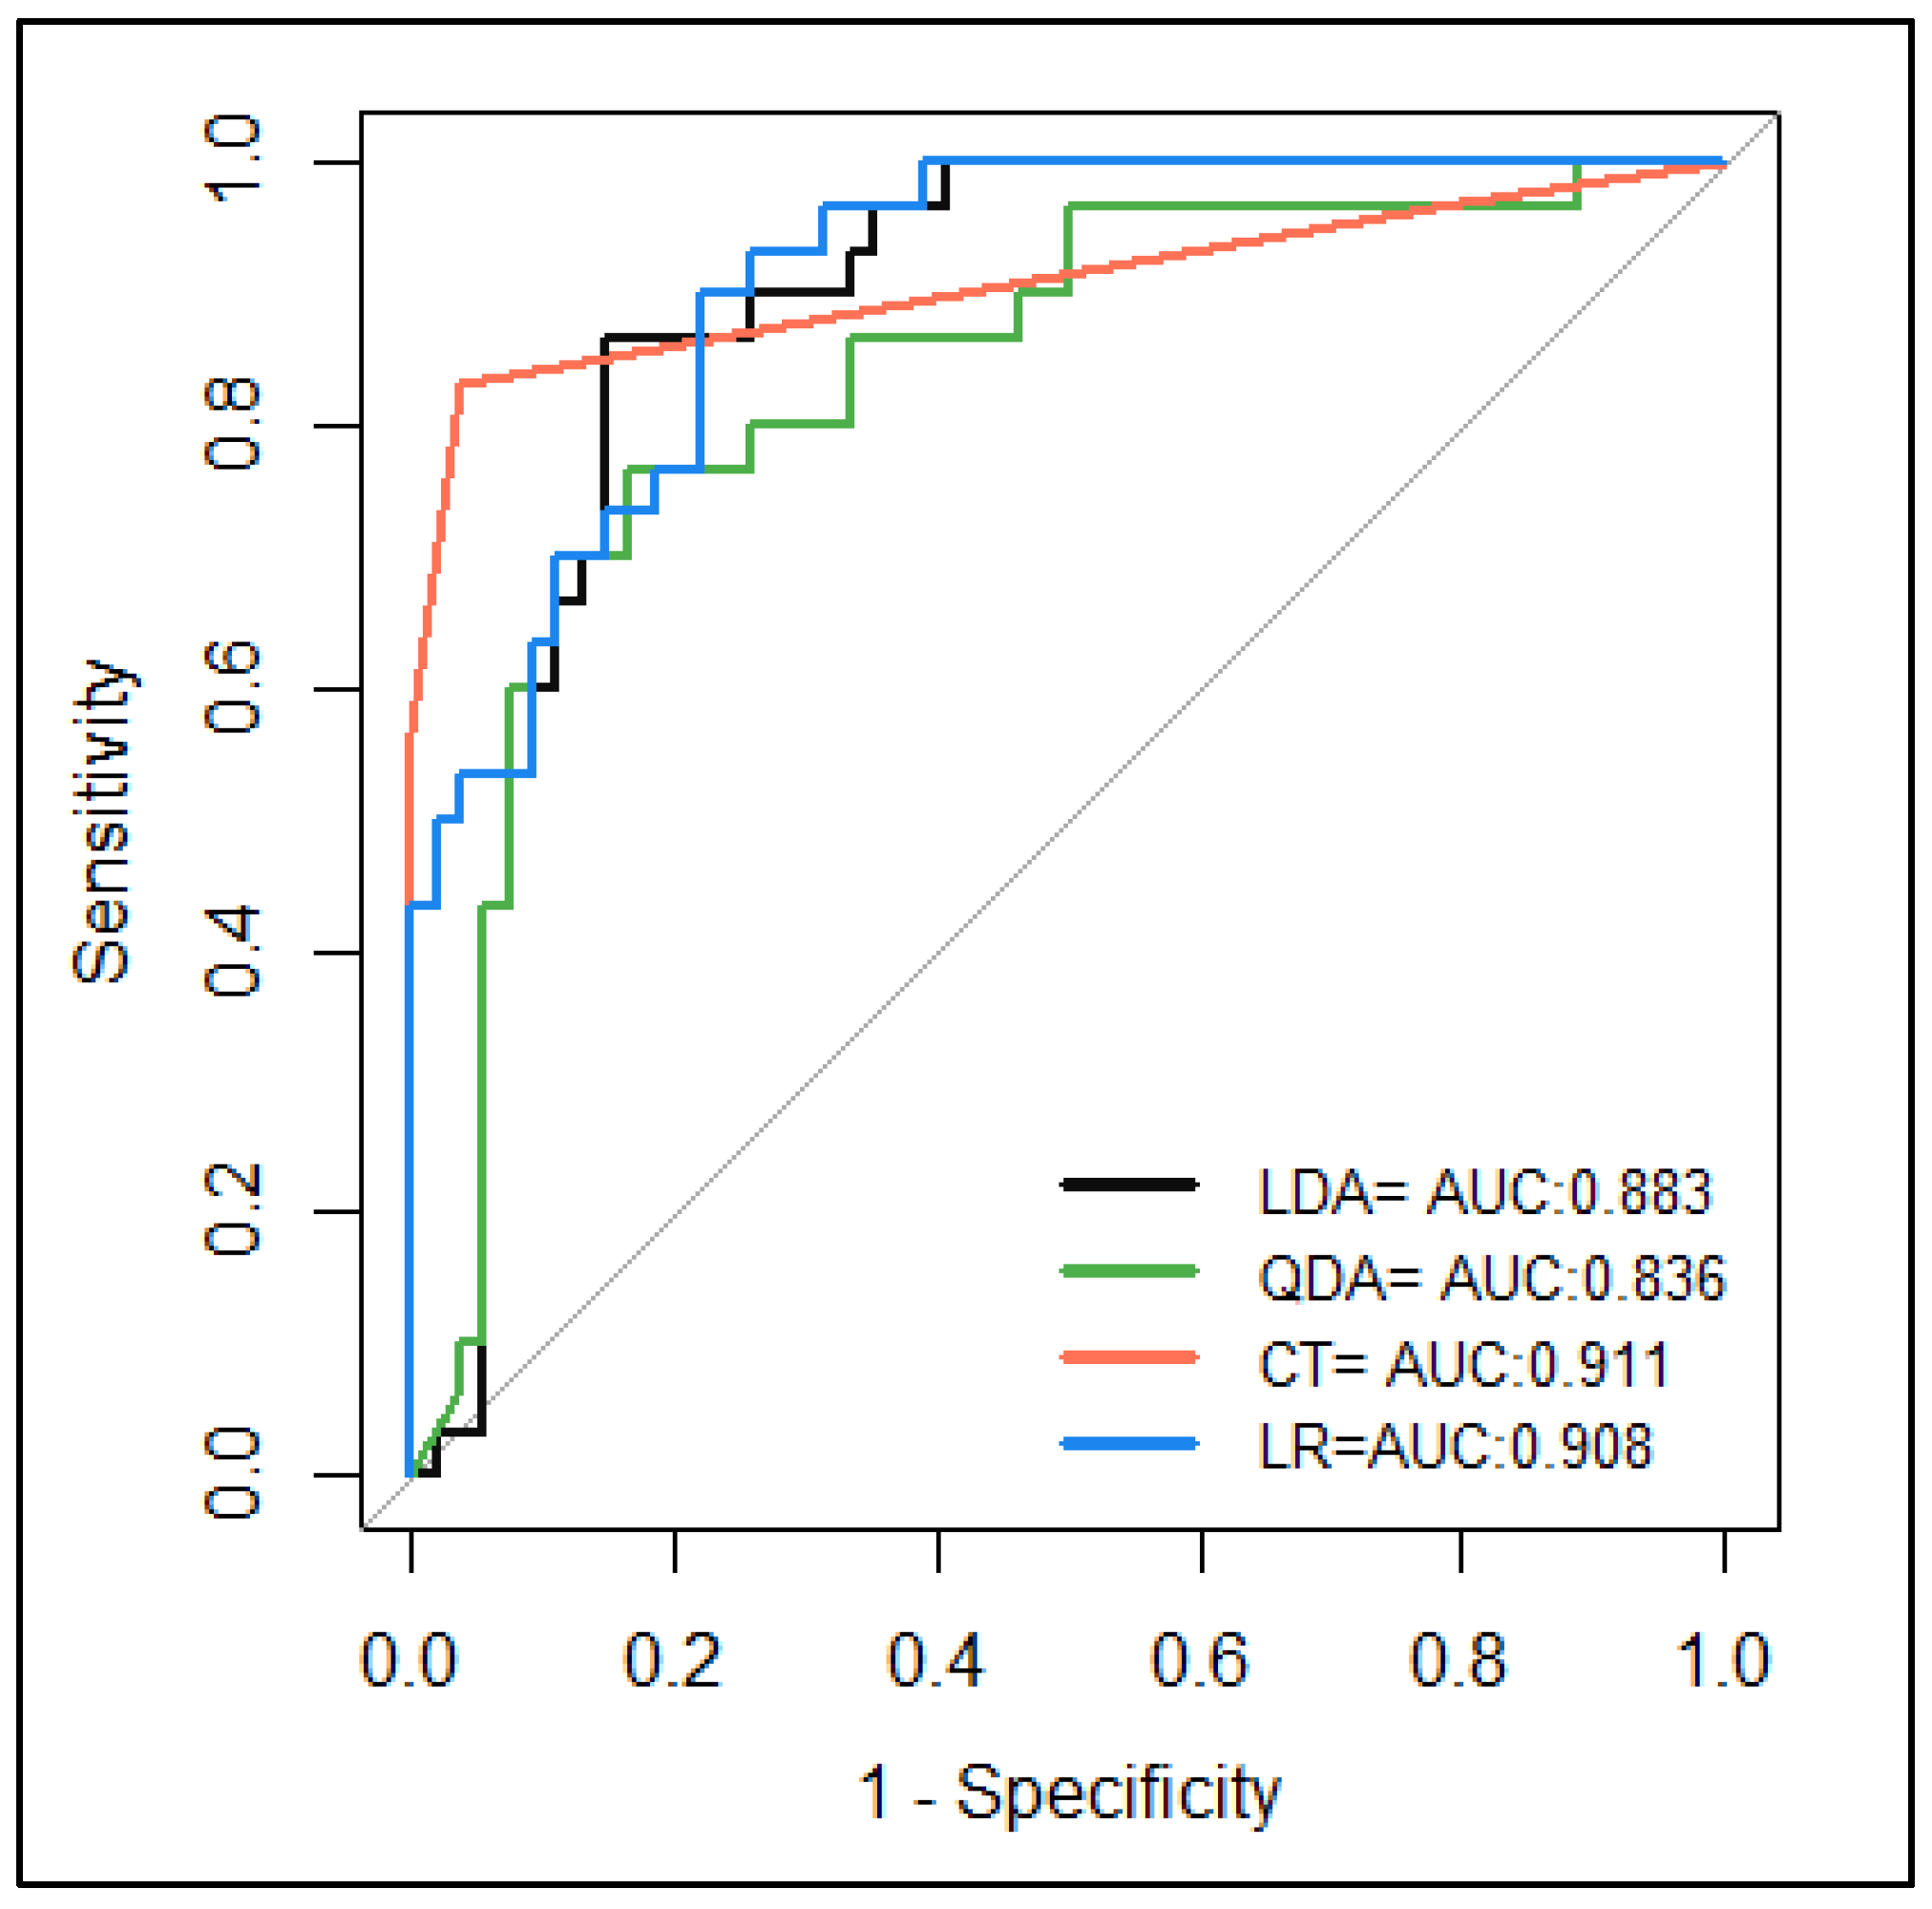
| Accuracy | 0.82 | 0.79 | 0.81 | 0.92 |
| Sensitivity | 0.85 | 0.83 | 0.89 | 0.96 |
| Specificity | 0.77 | 0.70 | 0.67 | 0.83 |
| Precision | 0.87 | 0.83 | 0.83 | 0.91 |
| NPV | 0.74 | 0.7 | 0.77 | 0.93 |
| MCC | 0.61 | 0.53 | 0.58 | 0.82 |
| Error rate | 0.18 | 0.21 | 0.19 | 0.08 |
Disclaimer/Publisher’s Note: The statements, opinions and data contained in all publications are solely those of the individual author(s) and contributor(s) and not of MDPI and/or the editor(s). MDPI and/or the editor(s) disclaim responsibility for any injury to people or property resulting from any ideas, methods, instructions or products referred to in the content. |
© 2025 by the authors. Licensee MDPI, Basel, Switzerland. This article is an open access article distributed under the terms and conditions of the Creative Commons Attribution (CC BY) license (https://creativecommons.org/licenses/by/4.0/).
Share and Cite
Salamanca-Carreño, A.; Vélez-Terranova, M.; Parés-Casanova, P.M.; Toalombo-Vargas, P.A.; Rangel-Pachón, D.E.; Castillo-Pérez, A.F. Assessment of Body Morphometry to Classify Two Colombian Creole Pigs Using Statistical and Machine Learning Methods. Life 2025, 15, 693. https://doi.org/10.3390/life15050693
Salamanca-Carreño A, Vélez-Terranova M, Parés-Casanova PM, Toalombo-Vargas PA, Rangel-Pachón DE, Castillo-Pérez AF. Assessment of Body Morphometry to Classify Two Colombian Creole Pigs Using Statistical and Machine Learning Methods. Life. 2025; 15(5):693. https://doi.org/10.3390/life15050693
Chicago/Turabian StyleSalamanca-Carreño, Arcesio, Mauricio Vélez-Terranova, Pere M. Parés-Casanova, Paula A. Toalombo-Vargas, David E. Rangel-Pachón, and Andrés F. Castillo-Pérez. 2025. "Assessment of Body Morphometry to Classify Two Colombian Creole Pigs Using Statistical and Machine Learning Methods" Life 15, no. 5: 693. https://doi.org/10.3390/life15050693
APA StyleSalamanca-Carreño, A., Vélez-Terranova, M., Parés-Casanova, P. M., Toalombo-Vargas, P. A., Rangel-Pachón, D. E., & Castillo-Pérez, A. F. (2025). Assessment of Body Morphometry to Classify Two Colombian Creole Pigs Using Statistical and Machine Learning Methods. Life, 15(5), 693. https://doi.org/10.3390/life15050693