

Effects of Intermittent Fasting on Liver Steatosis and Fibrosis, Serum FGF-21 and Autophagy Markers in Metabolic Dysfunction-Associated Fatty Liver Disease: A Randomized Controlled Trial

 ,
,  ,
, 
 and
and
Abstract
:1. Introduction
2. Materials and Methods
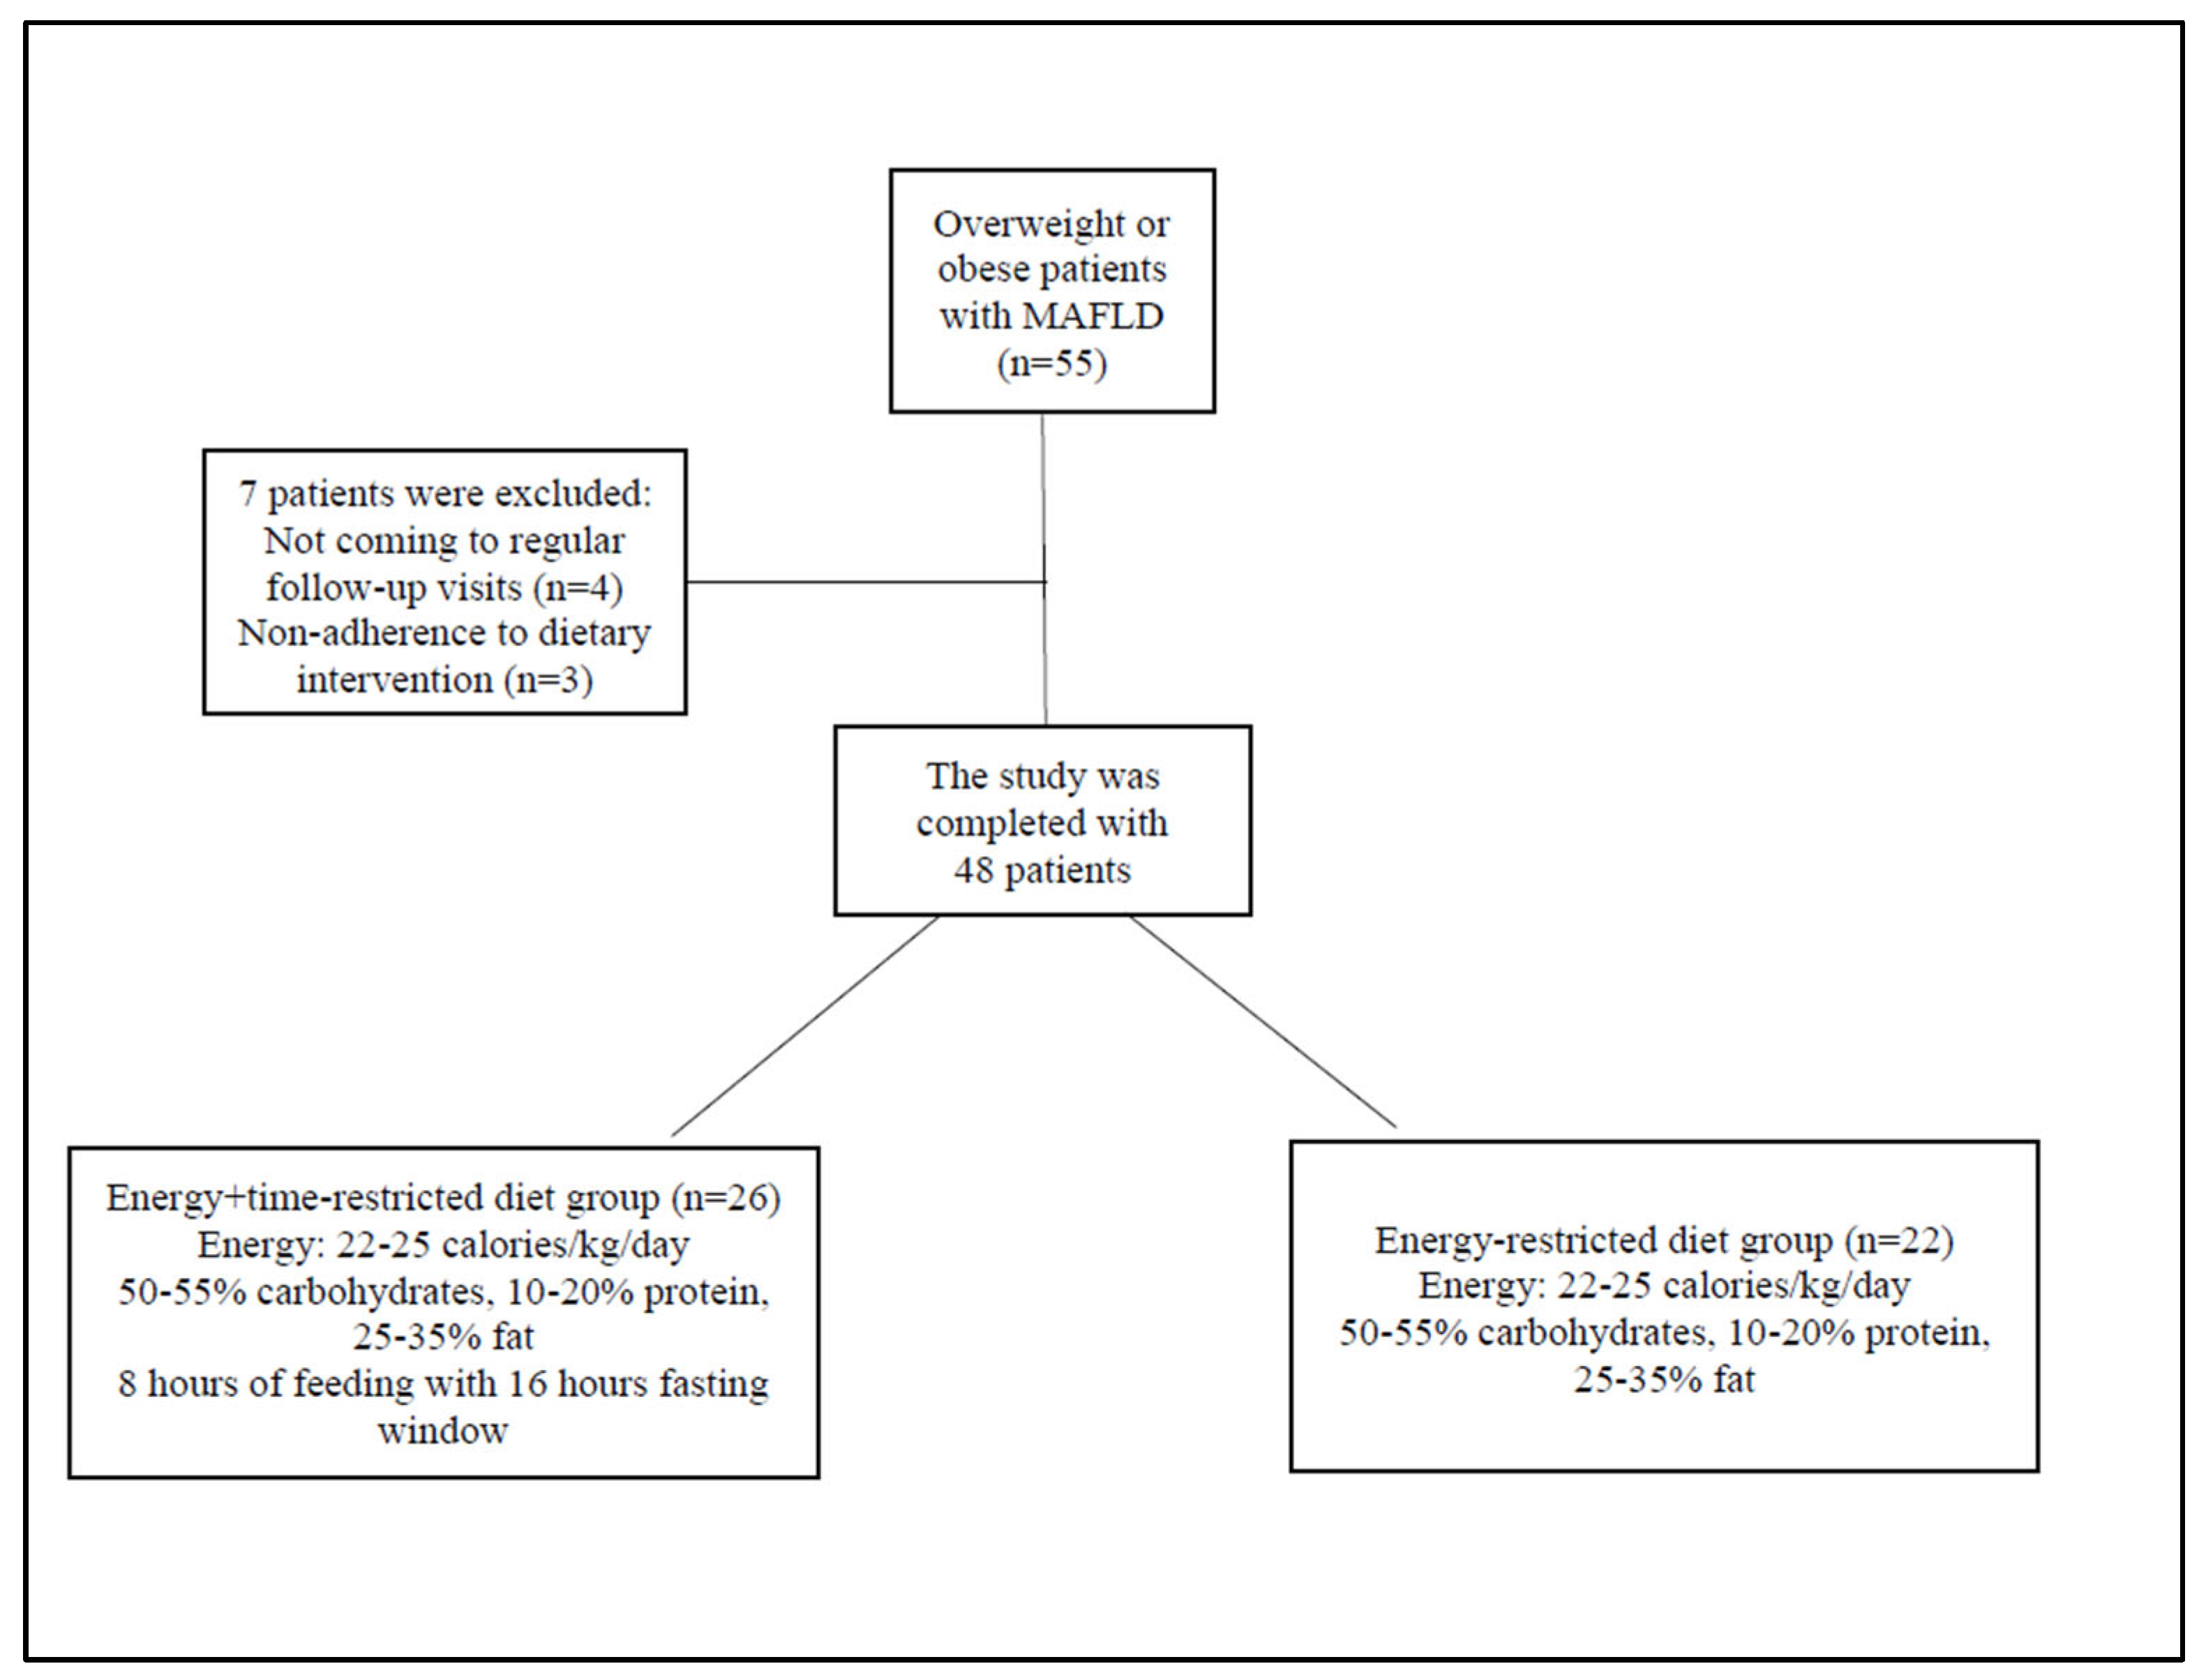
2.1. Patients
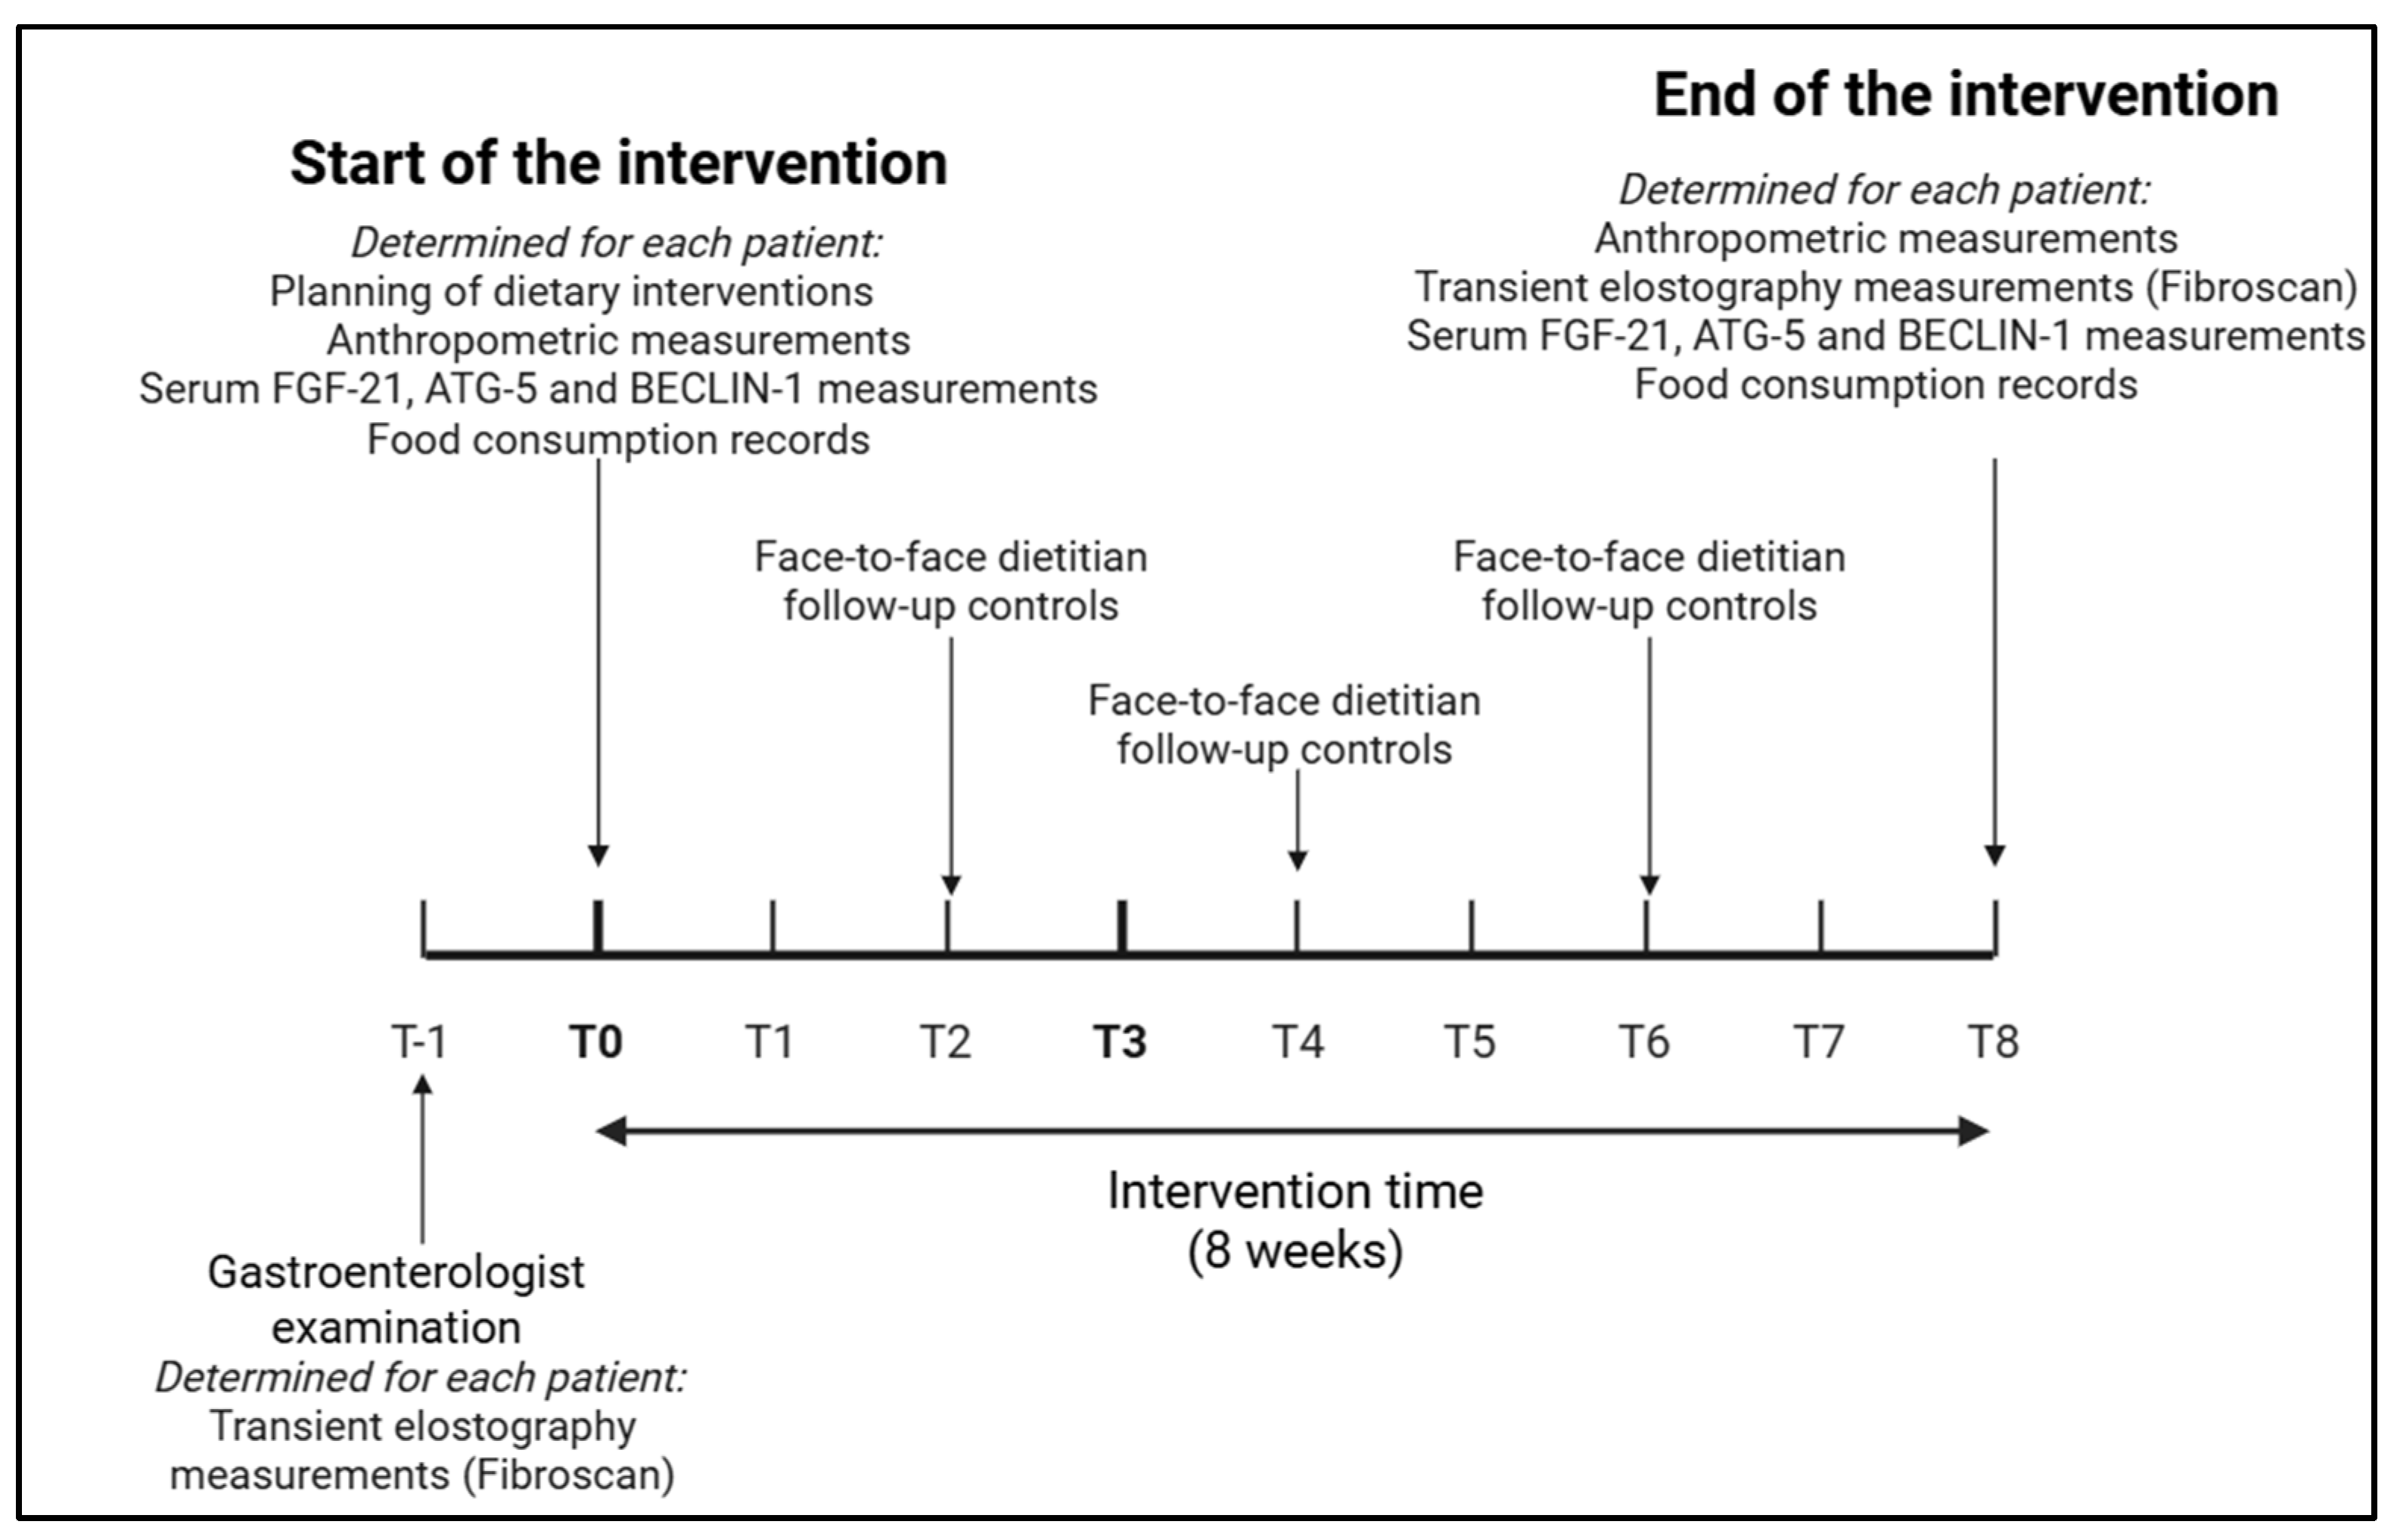
2.2. Study Design
2.3. Dietary Interventions
2.4. Monitoring of Dietary Interventions
2.5. Anthropometric Measurements
2.6. Transient Elastography
2.7. Determination of Serum FGF-21, ATG-5, and Beclin-1
2.8. Statistical Analysis
3. Results
3.1. General Characteristics of the Participants
3.2. Effect of Interventions on Anthropometric and Routine Biochemical Measurements
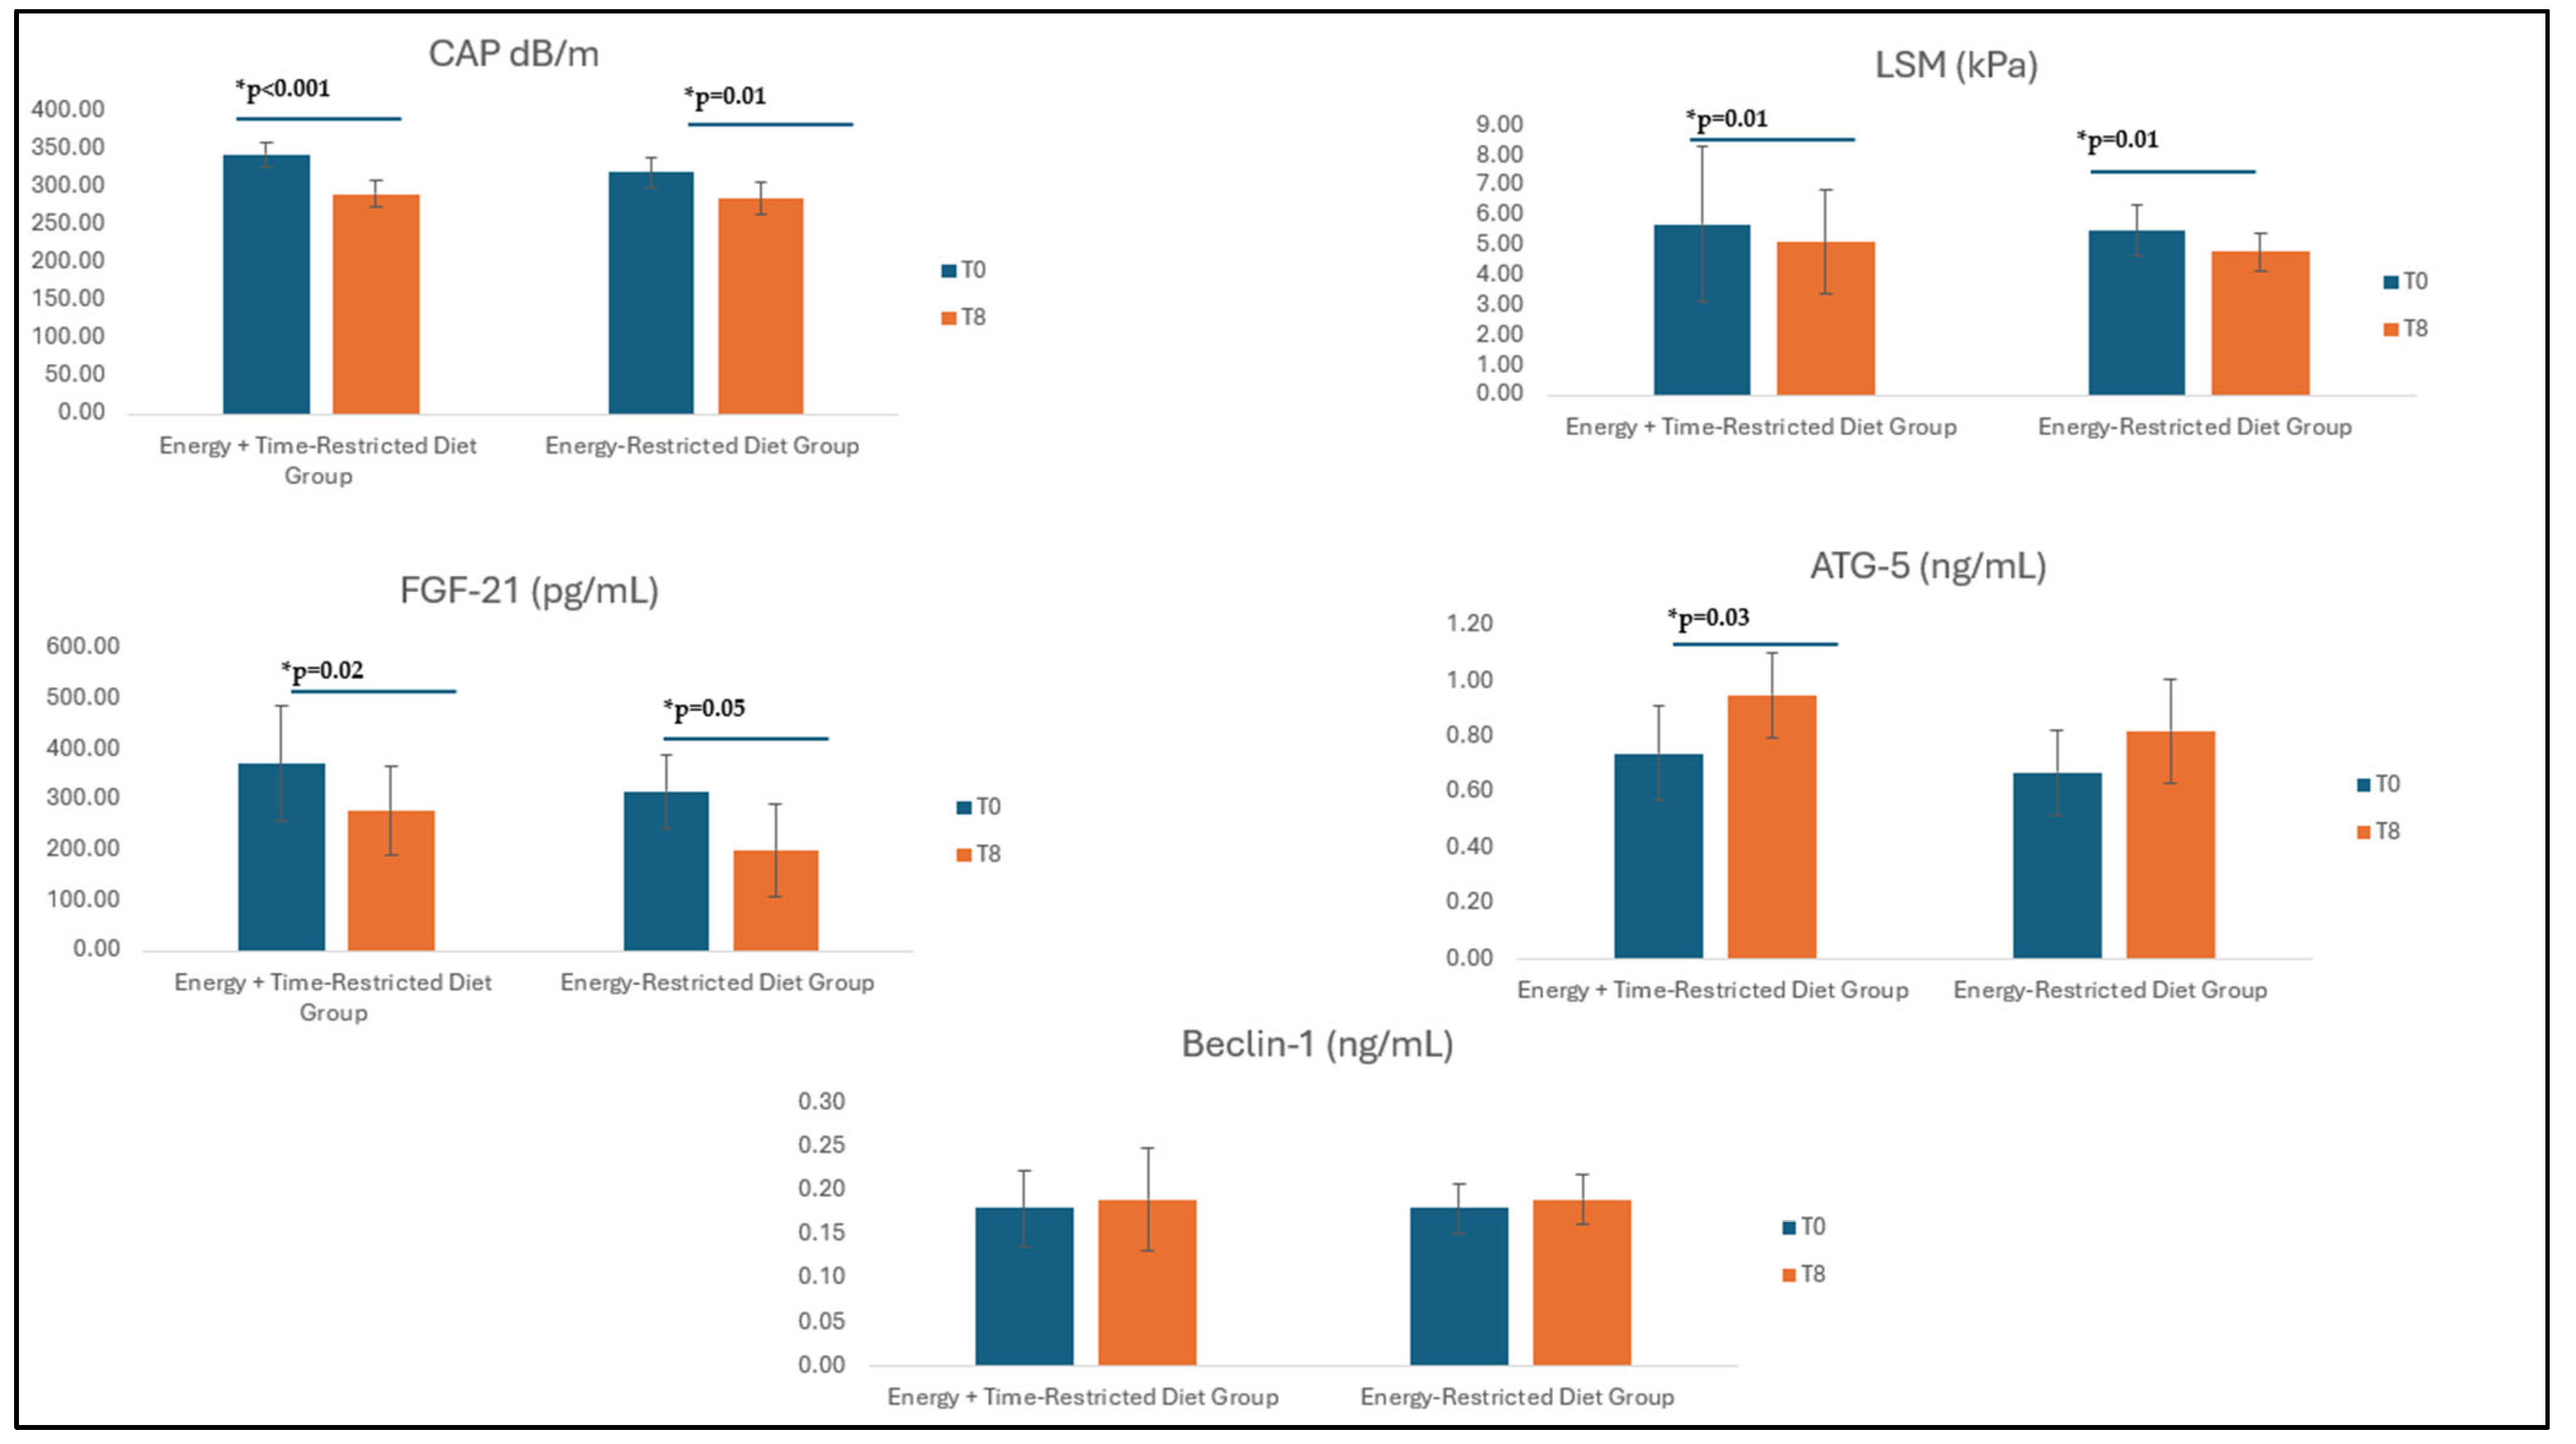
3.3. Effect of Interventions on Fibroscan Measurements
3.4. Effect of Interventions on Serum FGF-21 and Autophagy Markers
3.5. Correlation Between FGF-21, Autophagy Markers, and Liver Disease Parameters
3.6. Dietary Intake of Patients and Changes in Energy and Dietary Intake with Interventions
4. Discussion
5. Conclusions
Author Contributions
Funding
Institutional Review Board Statement
Informed Consent Statement
Data Availability Statement
Acknowledgments
Conflicts of Interest
Abbreviations
| ALT | Alanine Aminotransferase |
| AST | Aspartate Aminotransferase |
| ATG-5 | Autophagy-Related Protein-5 |
| BMI | Body Mass Index |
| CAP | Controlled Attenuation Parameter |
| FGF-21 | Fibroblast Growth Factor-21 |
| GGT | Gamma-Glutamyl Transferase |
| HDL-C | High-Density Lipoprotein Cholesterol |
| LDL-C | Low-Density Lipoprotein Cholesterol |
| LSM | Liver Stiffness Measurement |
| MAFLD | Metabolic Dysfunction-Associated Fatty Liver Disease |
| NAFLD | Non-Alcoholic Fatty Liver Disease |
References
- Liu, J.; Ayada, I.; Zhang, X.; Wang, L.; Li, Y.; Wen, T.; Ma, Z.; Bruno, M.J.; de Knegt, R.J.; Cao, W.; et al. Estimating Global Prevalence of Metabolic Dysfunction-Associated Fatty Liver Disease in Overweight or Obese Adults. Clin. Gastroenterol. Hepatol. 2022, 20, 573–582. [Google Scholar] [CrossRef] [PubMed]
- Yilmaz, Y.; Yilmaz, N.; Ates, F.; Karakaya, F.; Gokcan, H.; Kaya, E.; Adali, G.; Caliskan Kartal, A.; Sen, I.; Ahishali, E.; et al. The prevalence of metabolic-associated fatty liver disease in the Turkish population: A multicenter study. Hepatol. Forum. 2021, 2, 37–42. [Google Scholar] [CrossRef] [PubMed] [PubMed Central]
- Younossi, Z.M.; Paik, J.M.; Al Shabeeb, R.; Golabi, P.; Younossi, I.; Henry, L. Are there outcome differences between NAFLD and metabolic-associated fatty liver disease? Hepatology 2022, 76, 1423–1437. [Google Scholar] [CrossRef] [PubMed]
- Au, K.; Zheng, M.H.; Lee, W.J.; Ghanem, O.M.; Mahawar, K.; Shabbir, A.; le Roux, C.W.; Targher, G.; Byrne, C.D.; Yilmaz, Y.; et al. Resmetirom and Metabolic Dysfunction-Associated Steatohepatitis: Perspectives on Multidisciplinary Management from Global Healthcare Professionals. Curr. Obes. Rep. 2024, 13, 818–830. [Google Scholar] [CrossRef] [PubMed]
- Ullah, R.; Rauf, N.; Nabi, G.; Ullah, H.; Shen, Y.; Zhou, Y.D.; Fu, J. Role of Nutrition in the Pathogenesis and Prevention of Non-alcoholic Fatty Liver Disease: Recent Updates. Int. J. Biol. Sci. 2019, 15, 265–276. [Google Scholar] [CrossRef] [PubMed] [PubMed Central]
- Chalasani, N.; Younossi, Z.; Lavine, J.E.; Charlton, M.; Cusi, K.; Rinella, M.; Harrison, S.A.; Brunt, E.M.; Sanyal, A.J. The diagnosis and management of nonalcoholic fatty liver disease: Practice guidance from the American Association for the Study of Liver Diseases. Hepatology 2018, 67, 328–357. [Google Scholar] [CrossRef] [PubMed]
- European Association for the Study of the Liver (EASL); European Association for the Study of Diabetes (EASD); European Association for the Study of Obesity (EASO). EASL-EASD-EASO Clinical Practice Guidelines for the management of non-alcoholic fatty liver disease. Diabetologia 2016, 59, 1121–1140. [Google Scholar] [CrossRef] [PubMed]
- Moore, M.P.; Cunningham, R.P.; Dashek, R.J.; Mucinski, J.M.; Rector, R.S. A Fad too Far? Dietary Strategies for the Prevention and Treatment of NAFLD. Obesity 2020, 28, 1843–1852. [Google Scholar] [CrossRef] [PubMed] [PubMed Central]
- Sutton, E.F.; Beyl, R.; Early, K.S.; Cefalu, W.T.; Ravussin, E.; Peterson, C.M. Early Time-Restricted Feeding Improves Insulin Sensitivity, Blood Pressure, and Oxidative Stress Even without Weight Loss in Men with Prediabetes. Cell Metab. 2018, 27, 1212–1221.e3. [Google Scholar] [CrossRef] [PubMed] [PubMed Central]
- Tinsley, G.M.; La Bounty, P.M. Effects of intermittent fasting on body composition and clinical health markers in humans. Nutr. Rev. 2015, 73, 661–674. [Google Scholar] [CrossRef] [PubMed]
- Gabel, K.; Hoddy, K.K.; Haggerty, N.; Song, J.; Kroeger, C.M.; Trepanowski, J.F.; Panda, S.; Varady, K.A. Effects of 8-hour time restricted feeding on body weight and metabolic disease risk factors in obese adults: A pilot study. Nutr. Healthy Aging 2018, 4, 345–353. [Google Scholar] [CrossRef] [PubMed] [PubMed Central]
- Cienfuegos, S.; Gabel, K.; Kalam, F.; Ezpeleta, M.; Wiseman, E.; Pavlou, V.; Lin, S.; Oliveira, M.L.; Varady, K.A. Effects of 4- and 6-h Time-Restricted Feeding on Weight and Cardiometabolic Health: A Randomized Controlled Trial in Adults with Obesity. Cell Metab. 2020, 32, 366–378.e3. [Google Scholar] [CrossRef] [PubMed] [PubMed Central]
- Castillo, M.F.; Salgado-Canales, D.; Arrese, M.; Barrera, F.; Mikhailidis, D.P. Effect of Intermittent Fasting on Lipid Profile, Anthropometric and Hepatic Markers in Non-Alcoholic Fatty Liver Disease (NAFLD): A Systematic Review. Curr. Vasc. Pharmacol. 2024, 22, 187–202. [Google Scholar] [CrossRef] [PubMed]
- Saleh, S.A.K.; Santos, H.O.; Găman, M.A.; Cerqueira, H.S.; Zaher, E.A.; Alromaih, W.R.; Arafat, N.S.; Adi, A.R.; Adly, H.M.; Alyoubi, R.; et al. Effects of intermittent fasting regimens on glycemic, hepatic, anthropometric, and clinical markers in patients with non-alcoholic fatty liver disease: Systematic review and meta-analysis of randomized controlled trials. Clin. Nutr. ESPEN 2024, 59, 70–80. [Google Scholar] [CrossRef] [PubMed]
- Hatori, M.; Vollmers, C.; Zarrinpar, A.; DiTacchio, L.; Bushong, E.A.; Gill, S.; Leblanc, M.; Chaix, A.; Joens, M.; Fitzpatrick, J.A.; et al. Time-restricted feeding without reducing caloric intake prevents metabolic diseases in mice fed a high-fat diet. Cell Metab. 2012, 15, 848–860. [Google Scholar] [CrossRef] [PubMed] [PubMed Central]
- Mattson, M.P.; Longo, V.D.; Harvie, M. Impact of intermittent fasting on health and disease processes. Ageing Res. Rev. 2017, 39, 46–58. [Google Scholar] [CrossRef] [PubMed] [PubMed Central]
- Lee, J.M.; Wagner, M.; Xiao, R.; Kim, K.H.; Feng, D.; Lazar, M.A.; Moore, D.D. Nutrient-sensing nuclear receptors coordinate autophagy. Nature 2014, 516, 112–115. [Google Scholar] [CrossRef] [PubMed] [PubMed Central]
- Settembre, C.; De Cegli, R.; Mansueto, G.; Saha, P.K.; Vetrini, F.; Visvikis, O.; Huynh, T.; Carissimo, A.; Palmer, D.; Klisch, T.J.; et al. TFEB controls cellular lipid metabolism through a starvation-induced autoregulatory loop. Nat. Cell Biol. 2013, 15, 647–658, Erratum in: Nat. Cell Biol. 2013, 15, 1016. [Google Scholar] [CrossRef] [PubMed] [PubMed Central]
- Kouroumalis, E.; Voumvouraki, A.; Augoustaki, A.; Samonakis, D.N. Autophagy in liver diseases. World J. Hepatol. 2021, 13, 6–65. [Google Scholar] [CrossRef] [PubMed] [PubMed Central]
- Zhang, N.P.; Liu, X.J.; Xie, L.; Shen, X.Z.; Wu, J. Impaired mitophagy triggers NLRP3 inflammasome activation during the progression from nonalcoholic fatty liver to nonalcoholic steatohepatitis. Lab. Investig. 2019, 99, 749–763. [Google Scholar] [CrossRef] [PubMed]
- Byun, S.; Seok, S.; Kim, Y.C.; Zhang, Y.; Yau, P.; Iwamori, N.; Xu, H.E.; Ma, J.; Kemper, B.; Kemper, J.K. Fasting-induced FGF21 signaling activates hepatic autophagy and lipid degradation via JMJD3 histone demethylase. Nat. Commun. 2020, 11, 807. [Google Scholar] [CrossRef] [PubMed] [PubMed Central]
- Kim, K.E.; Shin, H.J.; Ju, Y.; Jung, Y.; An, H.S.; Lee, S.J.; Jeong, E.A.; Lee, J.; Hwang, G.S.; Roh, G.S. Intermittent Fasting Attenuates Metabolic-Dysfunction-Associated Steatohepatitis by Enhancing the Hepatic Autophagy-Lysosome Pathway. Nutrients 2023, 15, 4574. [Google Scholar] [CrossRef] [PubMed] [PubMed Central]
- Zhang, X.; Yeung, D.C.; Karpisek, M.; Stejskal, D.; Zhou, Z.G.; Liu, F.; Wong, R.L.; Chow, W.S.; Tso, A.W.; Lam, K.S.; et al. Serum FGF21 levels are increased in obesity and are independently associated with the metabolic syndrome in humans. Diabetes 2008, 57, 1246–1253, Erratum in: Diabetes 2019, 68, 235. [Google Scholar] [CrossRef] [PubMed]
- Cuevas-Ramos, D.; Almeda-Valdes, P.; Aguilar-Salinas, C.A.; Cuevas-Ramos, G.; Cuevas-Sosa, A.A.; Gomez-Perez, F.J. The role of fibroblast growth factor 21 (FGF21) on energy balance, glucose and lipid metabolism. Curr. Diabetes Rev. 2009, 5, 216–220. [Google Scholar] [CrossRef] [PubMed]
- Inagaki, T.; Dutchak, P.; Zhao, G.; Ding, X.; Gautron, L.; Parameswara, V.; Li, Y.; Goetz, R.; Mohammadi, M.; Esser, V.; et al. Endocrine regulation of the fasting response by PPARalpha-mediated induction of fibroblast growth factor 21. Cell Metab. 2007, 5, 415–425. [Google Scholar] [CrossRef] [PubMed]
- Kharitonenkov, A.; Shiyanova, T.L.; Koester, A.; Ford, A.M.; Micanovic, R.; Galbreath, E.J.; Sandusky, G.E.; Hammond, L.J.; Moyers, J.S.; Owens, R.A.; et al. FGF-21 as a novel metabolic regulator. J. Clin. Investig. 2005, 115, 1627–1635. [Google Scholar] [CrossRef] [PubMed] [PubMed Central]
- Yilmaz, Y.; Eren, F.; Yonal, O.; Kurt, R.; Aktas, B.; Celikel, C.A.; Ozdogan, O.; Imeryuz, N.; Kalayci, C.; Avsar, E. Increased serum FGF21 levels in patients with nonalcoholic fatty liver disease. Eur. J. Clin. Investig. 2010, 40, 887–892. [Google Scholar] [CrossRef] [PubMed]
- Wang, Y.Y.; Tian, F.; Qian, X.L.; Ying, H.M.; Zhou, Z.F. Effect of 5:2 intermittent fasting diet versus daily calorie restriction eating on metabolic-associated fatty liver disease-a randomized controlled trial. Front. Nutr. 2024, 11, 1439473. [Google Scholar] [CrossRef] [PubMed] [PubMed Central]
- Eslam, M.; Newsome, P.N.; Sarin, S.K.; Anstee, Q.M.; Targher, G.; Romero-Gomez, M.; Zelber-Sagi, S.; Wai-Sun Wong, V.; Dufour, J.F.; Schattenberg, J.M.; et al. A new definition for metabolic dysfunction-associated fatty liver disease: An international expert consensus statement. J. Hepatol. 2020, 73, 202–209. [Google Scholar] [CrossRef] [PubMed]
- Choban, P.; Dickerson, R.; Malone, A.; Worthington, P.; Compher, C.; American Society for Parenteral and Enteral Nutrition. A.S.P.E.N. Clinical guidelines: Nutrition support of hospitalized adult patients with obesity. JPEN J. Parenter. Enter. Nutr. 2013, 37, 714–744, Erratum in: JPEN J. Parenter. Enter. Nutr. 2015, 39, 993. [Google Scholar] [CrossRef] [PubMed]
- Eslamparast, T.; Tandon, P.; Raman, M. Dietary Composition Independent of Weight Loss in the Management of Non-Alcoholic Fatty Liver Disease. Nutrients 2017, 9, 800. [Google Scholar] [CrossRef] [PubMed] [PubMed Central]
- Kenger, E.B.; Guveli, H.; Ergun, C.; Kaya, E.; Yilmaz, Y. The comparison of resting metabolic rate between biopsy-proven non-alcoholic steatohepatitis and non-alcoholic fatty liver patients. Hepatol. Forum. 2020, 1, 14–19. [Google Scholar] [CrossRef] [PubMed] [PubMed Central]
- Boursier, J.; Zarski, J.P.; de Ledinghen, V.; Rousselet, M.C.; Sturm, N.; Lebail, B.; Fouchard-Hubert, I.; Gallois, Y.; Oberti, F.; Bertrais, S.; et al. Determination of reliability criteria for liver stiffness evaluation by transient elastography. Hepatology 2013, 57, 1182–1191. [Google Scholar] [CrossRef] [PubMed]
- Jung, K.S.; Kim, S.U. Clinical applications of transient elastography. Clin. Mol. Hepatol. 2012, 18, 163–173. [Google Scholar] [CrossRef] [PubMed] [PubMed Central]
- Elias, M.C.; Parise, E.R.; de Carvalho, L.; Szejnfeld, D.; Netto, J.P. Effect of 6-month nutritional intervention on non-alcoholic fatty liver disease. Nutrition 2010, 26, 1094–1099. [Google Scholar] [CrossRef] [PubMed]
- Koda, M.; Kawakami, M.; Murawaki, Y.; Senda, M. The impact of visceral fat in nonalcoholic fatty liver disease: Cross-sectional and longitudinal studies. J. Gastroenterol. 2007, 42, 897–903. [Google Scholar] [CrossRef] [PubMed]
- Feehan, J.; Mack, A.; Tuck, C.; Tchongue, J.; Holt, D.Q.; Sievert, W.; Moore, G.T.; de Courten, B.; Hodge, A. Time-Restricted Fasting Improves Liver Steatosis in Non-Alcoholic Fatty Liver Disease-A Single Blinded Crossover Trial. Nutrients 2023, 15, 4870. [Google Scholar] [CrossRef] [PubMed] [PubMed Central]
- Falamarzi, K.; Malekpour, M.; Tafti, M.F.; Azarpira, N.; Behboodi, M.; Zarei, M. The role of FGF21 and its analogs on liver associated diseases. Front. Med. 2022, 9, 967375. [Google Scholar] [CrossRef] [PubMed] [PubMed Central]
- Raptis, D.D.; Mantzoros, C.S.; Polyzos, S.A. Fibroblast Growth Factor-21 as a Potential Therapeutic Target of Nonalcoholic Fatty Liver Disease. Ther. Clin. Risk Manag. 2023, 19, 77–96. [Google Scholar] [CrossRef] [PubMed] [PubMed Central]
- Dushay, J.; Chui, P.C.; Gopalakrishnan, G.S.; Varela-Rey, M.; Crawley, M.; Fisher, F.M.; Badman, M.K.; Martinez-Chantar, M.L.; Maratos-Flier, E. Increased fibroblast growth factor 21 in obesity and nonalcoholic fatty liver disease. Gastroenterology 2010, 139, 456–463. [Google Scholar] [CrossRef] [PubMed] [PubMed Central]
- Giannini, C.; Feldstein, A.E.; Santoro, N.; Kim, G.; Kursawe, R.; Pierpont, B.; Caprio, S. Circulating levels of FGF-21 in obese youth: Associations with liver fat content and markers of liver damage. J. Clin. Endocrinol. Metab. 2013, 98, 2993–3000. [Google Scholar] [CrossRef] [PubMed] [PubMed Central]
- Barb, D.; Bril, F.; Kalavalapalli, S.; Cusi, K. Plasma Fibroblast Growth Factor 21 Is Associated with Severity of Nonalcoholic Steatohepatitis in Patients With Obesity and Type 2 Diabetes. J. Clin. Endocrinol. Metab. 2019, 104, 3327–3336. [Google Scholar] [CrossRef] [PubMed] [PubMed Central]
- Mutanen, A.; Heikkilä, P.; Lohi, J.; Raivio, T.; Jalanko, H.; Pakarinen, M.P. Serum FGF21 increases with hepatic fat accumulation in pediatric onset intestinal failure. J. Hepatol. 2024, 60, 183–190. [Google Scholar] [CrossRef] [PubMed]
- Waluga, M.; Kukla, M.; Zorniak, M.; Kajor, M.; Liszka, L.; Dyaczynski, M.; Kowalski, G.; Zadlo, D.; Waluga, E.; Olczyk, P.; et al. Fibroblast growth factor-21 and omentin-1 hepatic mRNA expression and serum levels in morbidly obese women with non-alcoholic fatty liver disease. J. Physiol. Pharmacol. 2017, 68, 363–374. [Google Scholar] [PubMed]
- Crujeiras, A.B.; Gomez-Arbelaez, D.; Zulet, M.A.; Carreira, M.C.; Sajoux, I.; de Luis, D.; Castro, A.I.; Baltar, J.; Baamonde, I.; Sueiro, A.; et al. Plasma FGF21 levels in obese patients undergoing energy-restricted diets or bariatric surgery: A marker of metabolic stress? Int. J. Obes. 2017, 41, 1570–1578. [Google Scholar] [CrossRef] [PubMed]
- Asghari, S.; Rezaei, M.; Rafraf, M.; Taghizadeh, M.; Asghari-Jafarabadi, M.; Ebadi, M. Effects of Calorie Restricted Diet on Oxidative/Antioxidative Status Biomarkers and Serum Fibroblast Growth Factor 21 Levels in Nonalcoholic Fatty Liver Disease Patients: A Randomized, Controlled Clinical Trial. Nutrients 2022, 14, 2509. [Google Scholar] [CrossRef] [PubMed] [PubMed Central]
- Shen, W.; Yang, M.; Chen, H.; He, C.; Li, H.; Yang, X.; Zhuo, J.; Lin, Z.; Hu, Z.; Lu, D.; et al. FGF21-mediated autophagy: Remodeling the homeostasis in response to stress in liver diseases. Genes Dis. 2023, 11, 101027. [Google Scholar] [CrossRef] [PubMed] [PubMed Central]
- Power Guerra, N.; Leyens, K.; Müller, L.; Brauer, D.; Janowitz, D.; Schlick, S.; Pilz, K.; Grabe, H.J.; Vollmar, B.; Kuhla, A. The effect of different weight loss strategies to treat non-alcoholic fatty liver disease focusing on fibroblast growth factor 21. Front. Nutr. 2022, 9, 935805. [Google Scholar] [CrossRef] [PubMed] [PubMed Central]
- Zhang, Y.; Xie, Y.; Berglund, E.D.; Coate, K.C.; He, T.T.; Katafuchi, T.; Xiao, G.; Potthoff, M.J.; Wei, W.; Wan, Y.; et al. The starvation hormone, fibroblast growth factor-21, extends lifespan in mice. eLife 2012, 1, e00065. [Google Scholar] [CrossRef] [PubMed] [PubMed Central]
- Zhu, S.; Wu, Y.; Ye, X.; Ma, L.; Qi, J.; Yu, D.; Wei, Y.; Lin, G.; Ren, G.; Li, D. FGF21 ameliorates nonalcoholic fatty liver disease by inducing autophagy. Mol. Cell Biochem. 2016, 420, 107–119. [Google Scholar] [CrossRef] [PubMed]
- Ma, Y.N.; Jiang, X.; Tang, W.; Song, P. Influence of intermittent fasting on autophagy in the liver. Biosci. Trends. 2023, 17, 335–355. [Google Scholar] [CrossRef] [PubMed]
- Rickenbacher, A.; Jang, J.H.; Limani, P.; Ungethüm, U.; Lehmann, K.; Oberkofler, C.E.; Weber, A.; Graf, R.; Humar, B.; Clavien, P.A. Fasting protects liver from ischemic injury through Sirt1-mediated downregulation of circulating HMGB1 in mice. J. Hepatol. 2014, 61, 301–308. [Google Scholar] [CrossRef] [PubMed]
- Krasner, Y.A.; Romanov, V.V.; Fazullina, O.N.; Osipenko, M.F.; Klimontov, V.V. Serum levels of proteins involved in apoptosis and autophagy in patients with type 2 diabetes and non-alcoholic fatty liver disease. Sib. Nauchnyj Med. Zhurnal = Sib. Sci. Med. J. 2023, 43, 148–154. (In Russian) [Google Scholar] [CrossRef]
- Tong, M.; Zheng, Q.; Liu, M.; Chen, L.; Lin, Y.H.; Tang, S.G.; Zhu, Y.M. 5-methoxytryptophan alleviates liver fibrosis by modulating FOXO3a/miR-21/ATG5 signaling pathway mediated autophagy. Cell Cycle. 2021, 20, 676–688. [Google Scholar] [CrossRef] [PubMed] [PubMed Central]
- Shayeb, A.E.; Deghedy, A.; Bedewy, E.S.; Badawy, S.; Abdeen, N. Serum Beclin 1 and autophagy-related protein-5 and the risk of hepatocellular carcinoma among cirrhotic hepatitis C patients. Egypt. Liver J. 2021, 11, 81. [Google Scholar] [CrossRef]
- Cavalli, G.; Cenci, S. Autophagy and protein secretion. J. Mol. Biol. 2020, 432, 2525–2545. [Google Scholar] [CrossRef]
- Abu El-Hamd, M.; Abdel-Hamid, S.; Hamdy, A.T.; Abdelhamed, A. Increased serum ATG5 as a marker of autophagy in psoriasis vulgaris patients: A cross-sectional study. Arch. Dermatol. Res. 2024, 316, 491. [Google Scholar] [CrossRef] [PubMed]
- Patterson, R.E.; Laughlin, G.A.; LaCroix, A.Z.; Hartman, S.J.; Natarajan, L.; Senger, C.M.; Martínez, M.E.; Villaseñor, A.; Sears, D.D.; Marinac, C.R.; et al. Intermittent Fasting and Human Metabolic Health. J. Acad. Nutr. Diet. 2015, 115, 1203–1212. [Google Scholar] [CrossRef] [PubMed] [PubMed Central]
- Chawla, S.; Beretoulis, S.; Deere, A.; Radenkovic, D. The Window Matters: A Systematic Review of Time Restricted Eating Strategies in Relation to Cortisol and Melatonin Secretion. Nutrient 2021, 13, 2525. [Google Scholar] [CrossRef] [PubMed] [PubMed Central]
- Zhao, L.; Hutchison, A.T.; Liu, B.; Wittert, G.A.; Thompson, C.H.; Nguyen, L.; Au, J.; Vincent, A.; Manoogian, E.N.C.; Le, H.D.; et al. Time-restricted eating alters the 24-hour profile of adipose tissue transcriptome in men with obesity. Obesity 2023, 31 (Suppl. S1), 63–74. [Google Scholar] [CrossRef] [PubMed] [PubMed Central]
- Xiao, Q.; Bauer, C.; Layne, T.; Playdon, M. The association between overnight fasting and body mass index in older adults: The interaction between duration and timing. Int. J. Obes. 2021, 45, 555–564. [Google Scholar] [CrossRef] [PubMed] [PubMed Central]
- Meng, H.; Zhu, L.; Kord-Varkaneh, H.; OSantos, H.; Tinsley, G.M.; Fu, P. Effects of intermittent fasting and energy-restricted diets on lipid profile: A systematic review and meta-analysis. Nutrition 2020, 77, 110801. [Google Scholar] [CrossRef] [PubMed]
- Enríquez Guerrero, A.; San Mauro Martín, I.; Garicano Vilar, E.; Camina Martín, M.A. Effectiveness of an intermittent fasting diet versus continuous energy restriction on anthropometric measurements, body composition and lipid profile in overweight and obese adults: A meta-analysis. Eur. J. Clin. Nutr. 2021, 75, 1024–1039. [Google Scholar] [CrossRef] [PubMed]
- Berná, G.; Romero-Gomez, M. The role of nutrition in non-alcoholic fatty liver disease: Pathophysiology and management. Liver Int. 2020, 40, 102–108. [Google Scholar] [CrossRef] [PubMed]
- Guveli, H.; Kenger, E.B.; Ozlu, T.; Kaya, E.; Yilmaz, Y. Macro- and micronutrients in metabolic (dysfunction) associated fatty liver disease: Association between advanced fibrosis and high dietary intake of cholesterol/saturated fatty acids. Eur. J. Gastroenterol. Hepatol. 2021, 33, e390–e394. [Google Scholar] [CrossRef] [PubMed]
- Krawczyk, M.; Maciejewska, D.; Ryterska, K.; Czerwińka-Rogowska, M.; Jamioł-Milc, D.; Skonieczna-Żydecka, K.; Milkiewicz, P.; Raszeja-Wyszomirska, J.; Stachowska, E. Gut Permeability Might be Improved by Dietary Fiber in Individuals with Nonalcoholic Fatty Liver Disease (NAFLD) Undergoing Weight Reduction. Nutrients 2018, 10, 1793. [Google Scholar] [CrossRef] [PubMed] [PubMed Central]
- Vancells Lujan, P.; Viñas Esmel, E.; Sacanella Meseguer, E. Overview of Non-Alcoholic Fatty Liver Disease (NAFLD) and the Role of Sugary Food Consumption and Other Dietary Components in Its Development. Nutrients 2021, 13, 1442. [Google Scholar] [CrossRef] [PubMed] [PubMed Central]
- Rizkalla, S.W. Health implications of fructose consumption: A review of recent data. Nutr. Metab. 2010, 7, 82. [Google Scholar] [CrossRef] [PubMed] [PubMed Central]

| Energy + Time-Restricted Diet Group | Energy-Restricted Diet Group | p (Inter-Groups) β | ||
|---|---|---|---|---|
| Anthropometric Measurements | ||||
| Body weight (kg) | T0 | 88.9 (78.0–97.0) | 93.0 (82.4–103.0) | 0.01 |
| T8 | 83.0 (74.6–89.5) | 88.0 (79.9–100.1) | ||
| p (Intra-groups) α | <0.001 | <0.001 | ||
| BMI (kg/m2) | T0 | 32.8 (29.2–35.2) | 33.6 (30.2–37.3) | 0.01 |
| T8 | 30.6 (27.3–33.8) | 32.4 (29.1–35.7) | ||
| p (Intra-groups) α | <0.001 | <0.001 | ||
| Waist circumference (cm) | T0 | 105.0 (96.7–110.2) | 107.0 (100.7–116.5) | 0.03 |
| T8 | 99.0 (92.0–103.2) | 101.0 (96.5–113.0) | ||
| p (Intra-groups) α | <0.001 | <0.001 | ||
| Waist–hip ratio | T0 | 0.95 (0.87–0.97) | 0.95 (0.88–0.99) | 0.09 |
| T8 | 0.92 (0.85–0.94) | 0.93 (0.88–0.98) | ||
| p (Intra-groups) α | 0.02 | 0.06 | ||
| Body fat mass (kg) | T0 | 31.5 (25.5–33.9) | 29.8 (25.5–40.0) | 0.01 |
| T8 | 25.5 (21.6–30.4) | 27.4 (23.6–36.9) | ||
| p (Intra-groups) α | <0.001 | <0.001 | ||
| Body fat percentage (%) | T0 | 34.5 (28.7–38.8) | 34.2 (28.8–38.8) | 0.04 |
| T8 | 31.9 (25.2–37.2) | 32.9 (27.7–537.2) | ||
| p (Intra-groups) α | <0.001 | <0.001 | ||
| Fat-free mass (kg) | T0 | 52.8 (48.9–63.9) | 57.9 (50.1–65.9) | 0.22 |
| T8 | 51.7 (47.6–61.0) | 55.1 (48.8–64.8) | ||
| p (Intra-groups) α | <0.001 | <0.001 | ||
| Biochemical Measurements | ||||
| Fasting Blood Glucose (mg/dL) | T0 | 105.0 (100.7–116.5) | 106.0 (64.7–115.0) | 0.68 |
| T8 | 98.5 (96.0–106.5) | 100.0 (91.0–102.7) | ||
| p (Intra-groups) α | <0.001 | <0.001 | ||
| Triglyceride (mg/dL) | T0 | 167.0 (110.5–229.7) | 183.0 (122.7–200.0) | 0.48 |
| T8 | 147.5 (101.0–201.7) | 167.0 (106.0–188.0) | ||
| p (Intra-groups) α | <0.001 | <0.001 | ||
| LDL-C (mg/dL) | T0 | 154.0 (126.6–180.5) | 150.0 (130.3–171.0) | 0.86 |
| T8 | 135.0 (108.7–145.0) | 127.0 (107.2–150.2) | ||
| p (Intra-groups) α | <0.001 | <0.001 | ||
| HDL-C (mg/dL) | T0 | 43.0 (33.8–48.5) | 38.0 (32.0–47.9) | 0.32 |
| T8 | 43.0 (33.7–46.7) | 38.5 (33.7–46.7) | ||
| p (Intra-groups) α | 0.07 | 0.17 | ||
| Total Cholesterol (mg/dL) | T0 | 213.0 (175.7–242.7) | 219.0 (200.7–251.7) | 0.01 |
| T8 | 187.0 (144.5–209.7) | 199.50 (168.7–209.5) | ||
| p (Intra-groups) α | <0.001 | <0.001 | ||
| AST (IU/L) | T0 | 35.9 (20.8–68.0) | 25.7 (21.7–39.2) | 0.01 |
| T8 | 31.5 (21.0–47.5) | 25.5 (20.7–35.5) | ||
| p (Intra-groups) α | <0.001 | 0.09 | ||
| ALT (IU/L) | T0 | 38.7 (34.1–69.7) | 39.0 (36.7–67.0) | 0.29 |
| T8 | 35.0 (24.5–53.5) | 35.0 (31.0–48.7) | ||
| p (Intra-groups) α | <0.001 | <0.001 | ||
| GGT (IU/L) | T0 | 46.7 (31.0–70.0) | 45.0 (31.5–56.5) | 0.22 |
| T8 | 38.5 (26.7–52.7) | 34.5 (26.2–46.5) | ||
| p (Intra-groups) α | <0.001 | <0.001 | ||
| FGF-21 (pg/mL) | ATG-5 (ng/mL) | Beclin-1 (ng/mL) | ||
|---|---|---|---|---|
| FGF-21 (pg/mL) | R | 0.343 | −0.030 | |
| p | 0.02 | 0.84 | ||
| ATG-5 (ng/mL) | R | 0.343 | 0.342 | |
| p | 0.02 | 0.02 | ||
| Beclin-1 (ng/mL) | R | −0.030 | 0.342 | |
| p | 0.84 | 0.02 |
| FGF-21 Change (pg/mL) | ATG-5 Change (ng/mL) | Beclin-1 Change (ng/mL) | CAP Change (dB/m) | LSM Change (kPa) | AST Change (IU/L) | Body Weight Loss (%) | ||
|---|---|---|---|---|---|---|---|---|
| FGF-21 change (pg/mL) | R | 0.089 | −0.013 | 0.043 | −0.029 | 0.209 | 0.167 | |
| p | 0.54 | 0.93 | 0.77 | 0.84 | 0.15 | 0.25 | ||
| ATG-5 change (ng/mL) | R | 0.089 | −0.218 | 0.131 | 0.069 | 0.029 | 0.095 | |
| p | 0.54 | 0.14 | 0.37 | 0.64 | 0.84 | 0.52 | ||
| Beclin-1 change (ng/mL) | R | −0.013 | −0.218 | −0.029 | −0.164 | 0.056 | −0.056 | |
| p | 0.93 | 0.14 | 0.84 | 0.27 | 0.71 | 0.71 | ||
| CAP change (dB/m) | R | 0.043 | 0.131 | −0.029 | 0.277 | 0.085 | 0.355 | |
| p | 0.77 | 0.37 | 0.84 | 0.05 | 0.56 | 0.01 | ||
| LSM change (kPa) | R | −0.029 | 0.069 | −0.164 | 0.277 | 0.094 | 0.364 | |
| p | 0.84 | 0.64 | 0.27 | 0.05 | 0.52 | 0.01 | ||
| AST change (IU/L) | R | 0.209 | 0.029 | 0.056 | 0.085 | 0.094 | 0.211 | |
| p | 0.15 | 0.84 | 0.71 | 0.56 | 0.52 | 0.15 | ||
| Body Weight Loss (%) | R | 0.167 | 0.095 | −0.056 | 0.355 | 0.364 | 0.211 | |
| p | 0.25 | 0.52 | 0.71 | 0.01 | 0.01 | 0.15 |
| Energy + Time-Restricted Diet Group | Energy-Restricted Diet Group | p (Inter-Groups) β | ||
|---|---|---|---|---|
| Energy (kcal) | T0 | 1882.7 (1596.2–2014.8) | 1919.7 (1749.0–2193.0) | 0.80 |
| T8 | 1577.0 (1488.0–1726.4) | 1687.2 (1499.8–1796.5) | ||
| p (Intra-groups) α | <0.001 | 0.01 | ||
| Carbohydrate (%) | T0 | 43.0 (37.5–48.0) | 41.5 (38.0–50.2) | 0.89 |
| T8 | 53.0 (50.7–55.0) | 52.0 (50.7–53.0) | ||
| p (Intra-groups) α | <0.001 | <0.001 | ||
| Protein (%) | T0 | 15.0 (14.0–17.2) | 16.0 (14.0–17.0) | 0.63 |
| T8 | 19.0 (18.0–20.0) | 19.0 (18.0–20.0) | ||
| p (Intra-groups) α | <0.001 | <0.001 | ||
| Fat (%) | T0 | 42.0 (36.7–46.0) | 42.5 (37.5–46.2) | 0.99 |
| T8 | 28.0 (26.0–30.0) | 29.0 (27.0–30.0) | ||
| p (Intra-groups) α | <0.001 | <0.001 | ||
| Saturated fat (g) | T0 | 31.8 (25.9–37.9) | 31.8 (29.7–36.4) | 0.77 |
| T8 | 18.6 (16.3–19.1) | 19.0 (16.7–20.3) | ||
| p (Intra-groups) α | <0.001 | <0.001 | ||
| Fiber (g) | T0 | 21.4 (15.8–25.2) | 21.5 (18.2–26.2) | 0.21 |
| T8 | 30.1 (27.2–31.2) | 30.1 (28.6–31.2) | ||
| p (Intra-groups) α | <0.001 | <0.001 | ||
| Fructose (g) | T0 | 11.4 (6.3–20.3) | 13.5 (5.0–20.8) | 0.69 |
| T8 | 26.5 (21.0–27.6) | 25.1 (24.6–26.9) | ||
| p (Intra-groups) α | <0.001 | 0.01 |
Disclaimer/Publisher’s Note: The statements, opinions and data contained in all publications are solely those of the individual author(s) and contributor(s) and not of MDPI and/or the editor(s). MDPI and/or the editor(s) disclaim responsibility for any injury to people or property resulting from any ideas, methods, instructions or products referred to in the content. |
© 2025 by the authors. Licensee MDPI, Basel, Switzerland. This article is an open access article distributed under the terms and conditions of the Creative Commons Attribution (CC BY) license (https://creativecommons.org/licenses/by/4.0/).
Share and Cite
Ozlu Karahan, T.; Yilmaz Akyuz, E.; Yilmaz Karadag, D.; Yilmaz, Y.; Eren, F. Effects of Intermittent Fasting on Liver Steatosis and Fibrosis, Serum FGF-21 and Autophagy Markers in Metabolic Dysfunction-Associated Fatty Liver Disease: A Randomized Controlled Trial. Life 2025, 15, 696. https://doi.org/10.3390/life15050696
Ozlu Karahan T, Yilmaz Akyuz E, Yilmaz Karadag D, Yilmaz Y, Eren F. Effects of Intermittent Fasting on Liver Steatosis and Fibrosis, Serum FGF-21 and Autophagy Markers in Metabolic Dysfunction-Associated Fatty Liver Disease: A Randomized Controlled Trial. Life. 2025; 15(5):696. https://doi.org/10.3390/life15050696
Chicago/Turabian StyleOzlu Karahan, Tugce, Elvan Yilmaz Akyuz, Demet Yilmaz Karadag, Yusuf Yilmaz, and Fatih Eren. 2025. "Effects of Intermittent Fasting on Liver Steatosis and Fibrosis, Serum FGF-21 and Autophagy Markers in Metabolic Dysfunction-Associated Fatty Liver Disease: A Randomized Controlled Trial" Life 15, no. 5: 696. https://doi.org/10.3390/life15050696
APA StyleOzlu Karahan, T., Yilmaz Akyuz, E., Yilmaz Karadag, D., Yilmaz, Y., & Eren, F. (2025). Effects of Intermittent Fasting on Liver Steatosis and Fibrosis, Serum FGF-21 and Autophagy Markers in Metabolic Dysfunction-Associated Fatty Liver Disease: A Randomized Controlled Trial. Life, 15(5), 696. https://doi.org/10.3390/life15050696