Article

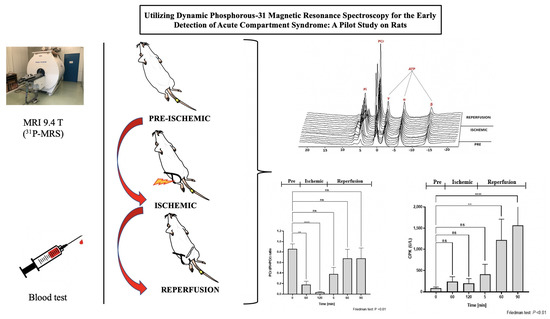
Utilizing Dynamic Phosphorous-31 Magnetic Resonance Spectroscopy for the Early Detection of Acute Compartment Syndrome: A Pilot Study on Rats

1
Division of Regenerative Medicine, Research Center for Medical Sciences, The Jikei University School of Medicine, Tokyo 105-8461, Japan
2
Department of Radiological Sciences, Tokyo Metropolitan University, Tokyo 116-0012, Japan
*
Author to whom correspondence should be addressed.
Hiroki Ohta and Nhat-Minh Van Vo are both primary investigators of this study.
Diagnostics 2021, 11(4), 586; https://doi.org/10.3390/diagnostics11040586
Submission received: 22 February 2021 / Revised: 20 March 2021 / Accepted: 21 March 2021 / Published: 24 March 2021
(This article belongs to the Special Issue Advanced MRI Techniques for Musculoskeletal Imaging)

Abstract

:
Introduction: Disasters, including terrorism and earthquakes, are significant threats to people and may lead to many people requiring rescue. The longer the rescue takes, the higher the chances of an individual contracting acute compartment syndrome (ACS). ACS is fatal if diagnosed too late, and early diagnosis and treatment are essential. Objective: To assess the ability of dynamic phosphorus magnetic resonance spectroscopy (31P-MRS) in the early detection of muscular damage in ACS. Materials and Methods: Six ACS model rats were used for serial 31P-MRS scanning (9.4 Tesla). Skeletal muscle metabolism, represented by the levels of phosphocreatine (PCr), inorganic phosphate (Pi), and adenosine triphosphate (ATP), was assessed. The PCr/(Pi + PCr) ratio, which decreases with ischemia, was compared with simultaneously sampled plasma creatine phosphokinase (CPK), a muscle damage marker. Results: The PCr/(Pi + PCr) ratio significantly decreased after inducing ischemia (from 0.86 ± 0.10 to 0.18 ± 0.06; p < 0.05), while CPK did not change significantly (from 89 ± 29.46 to 241.50 ± 113.28; p > 0.05). The intracellular and arterial pH index decreased over time, revealing significant differences at 120 min post-ischemia (from 7.09 ± 0.01 to 6.43 ± 0.13, and from 7.47 ± 0.03 to 7.39 ± 0.04, respectively). In the reperfusion state, the spectra and pH did not return to the original values. Conclusions: The dynamic 31P-MRS technique can rapidly detect changes in muscle bioenergetics. This technique is a promising non-invasive method for determining early muscular damage in ACS.

Graphical Abstract

1. Introduction

Acute compartment syndrome (ACS) of the extremities, a syndrome that frequently occurs in disaster-prone countries such as Japan, can cause permanent damage to the muscles, nerves, and vasculatures [1,2,3]. Moreover, if left untreated for more than 8 h, limb salvage may be impossible, and it may even cause death [4,5,6]. Thus, early detection and monitoring of the disease progression are essential for evaluating skeletal muscle status, and differentiating reversible and irreversible tissue damage in skeletal muscles.
The initial suspicion of ACS is mostly inferred from observing its classical features, such as pain, pallor, pulselessness, paresthesia, poikilothermy, and paralysis [7]. It is verified either through invasive or non-invasive methods [8,9,10]. A typical invasive method is through measuring and calculating the difference between the mean arterial pressure and the intra-compartmental pressure (ICP) [11]. An absolute ICP of 30 mmHg indicates the immediate need for a fasciotomy. Another invasive procedure is the use of a serum biomarker, specifically creatine phosphokinase (CPK) [12]. A CPK concentration of greater than 4000 U/L is associated with ACS in humans [13]. However, these invasive procedures are not sensitive in the early detection of ACS [7,14,15].
Current non-invasive ACS detection techniques are near-infrared spectroscopy (NIRS), ultrasound, laser Doppler flowmetry, and conventional magnetic resonance imaging (MRI). However, as these are used to monitor changes occurring to the body structures in real-time, they are also incapable of detecting early signs of ACS [16]. Thus, early ACS detection remains a difficult task, as conventional diagnostic techniques often provide insufficient evidence to diagnose a patient’s condition [16].
Selecting the most appropriate diagnostic technique requires a good understanding of ACS’s pathophysiology [17]. For the early diagnosis and treatment of ACS, it is necessary to evaluate muscle bioenergetics and metabolism non-invasively [7,16,18,19,20,21,22]. Magnetic resonance spectroscopy (MRS) is a unique technique for assessing tissue metabolic properties through the quantification of essential metabolites such as inorganic phosphate (Pi), phosphocreatine (PCr), and adenosine triphosphate (ATP) [22,23]. Phosphorus magnetic resonance spectroscopy (31P-MRS) has been used in clinical practice to evaluate high-energy phosphate metabolism changes of muscular and peripheral arterial diseases in humans [21,24,25]. 31P-MRS can dynamically monitor the rate of high-energy phosphate depletion and resynthesis [26]. Additionally, it can measure the intracellular pH and mitochondrial oxidative capacity [19,27]. These are valuable indices that can be used to differentiate between normal and pathological states.
In clinical practice, most MRI machines used to detect ACS have a magnetic field strength of under three Tesla. However, with the development of hardware technology, it is becoming possible to maintain the uniformity of magnetic field at a strength higher than three Tesla [28,29,30,31,32]. Therefore, the clinical utility of ultra-high magnetic field systems is being explored [33,34]. In our pilot experiment, we used a 31P-MRS with an ultra-high magnetic field (9.4 Tesla) to gain a higher signal-to-noise ratio (SNR), shorten the data acquisition time, improve spectra quality, and reduce metabolite overlapping. Doing so made the quantification of energy metabolism more accurate [35,36,37].
We hypothesize that 31P-MRS can provide information on bioenergetic changes in ACS. This study aimed to examine whether dynamic 31P-MRS can detect early skeletal muscle bioenergetic changes in ACS. We compared results from 31P-MRS with blood tests to offer essential information about muscle pathophysiology in the pre-ischemic, ischemic, and reperfusion phases.

2. Materials and Methods

2.1. Animals

Male normotensive Sprague-Dawley rats (n = 6; 9 to 12 weeks old; 276–499 g), obtained from Nihon SLC (Japan SLC, Inc., Shizuoka, Japan), were housed in individual cages in a controlled room (temperature: 24–25 °C; humidity: 50–60%) with a 12:12 hour light-dark cycle. The rats were allowed free access to food (CE-2, CLEA Japan, Inc., Tokyo, Japan) and water [38]. The sample size of this pilot study was determined by the research team’s shared experience, personal judgment of the principal investigators, and in light of previous animal studies [35,39,40,41,42].
The research protocol was approved by the Institutional Animal Care and Use Committee of the Jikei University School of Medicine (protocol number: 2019-043C1). All experimental procedures were conducted under the Fundamental Guidelines for Proper Conduct of Animal Experiments and Related Activities in Academic Research Institutions, issued by the Japanese Ministry of Education, Culture, Sports, Science and Technology [38]. Such conduct includes upholding ethical values of non-maleficence, among others.

2.2. Creation of the Fastened Zip-Tie Rat Model

A vascular surgeon performed the fastened zip-tie rat model of ACS. Anesthesia was induced using 3% isoflurane kept within the laboratory “Small Animal Anesthesia System” (SBN-487, Shinano, Tokyo, Japan), and titrated to maintain an acceptable standard during the experiment. This isoflurane concentration is commonly used for magnetic resonance (MR) procedures as it does not impact the results obtained [43,44]. Respiratory functioning was monitored in real-time using an MR-compatible small animal monitoring and gating system (SA Instruments, Inc., Stony Brook, NY, USA). Once the anesthesia had taken effect, the rats were placed on a heating pad in a supine position. Then, two plastic zip ties (ELPA, Osaka, Japan; length: 150 mm, width: 3.6 mm) were loosely attached to the intended area to induce ischemia, and were sewn at three points (two points supine, one point on the lateral side) to the rat’s inguinal region while avoiding vascular damage (Figure 1). Then, pre-ischemic scanning was undertaken, followed by the placement of MR coils on the hindlimb’s lateral side and tightening of the zip ties to induce ischemia.
After preparation of the fastened zip-tie rat model of ACS, the rats were placed in a supine position and immobilized on the MR cradle with the hindlimb in full extension. The MR cradle was connected to a small animal ventilator (SA Instruments, Inc., Stony Brook, NY, USA). The rat’s respiration rate was continuously monitored (SA Instruments, Stony Brook, NY, USA) and controlled at 80–120/minute throughout the MR scanning. Body temperature was maintained at about 37 degrees Celsius by heating bath circulator equipment (CW-05G, Lab Companion, Daejeon, Korea) connected to the MR cradle. All equipment used is shown in Figure 2. After 120 min of ischemia, the zip ties were cut to resume perfusion.

2.3. Experimental Procedure

We acquired 31P-MRS spectra, hydrogen MRI images (1H-MRI), and blood samples from rats induced with ACS through the use of zip ties. Pre-ischemic and ischemic states were monitored continuously from time zero to 120 min. After releasing the zip ties, the reperfusion state was followed for 90 min [26]. 31P-MRS spectra and blood samples were acquired at rest, during muscle compression (120 min), and after inducing reperfusion (90 min) (Figure 3). During the MR procedure, the concentration of pH and CPK were analyzed by blood samples obtained from the tail artery. The rats were able to walk normally at 2 days follow-up.

2.4. Assessing 1H-MRI and 31P-MRS

Measurements were performed on an MR scanner, Biospec, 9.4 Tesla (Bruker Optik GmbH, Ettlingen, Germany) and controlled using the Paravision 6.2 software package (Bruker Biospin). The rat’s knee and leg were fully extended, with the knee centered over the surface coil, and Bruker dual resonance linearly polarized coils 1H/31P (1H: 400.525 MHz and 31P: 162.056 MHz) with 20 mm inner diameter, attached underneath the hind limb to perform shimming. The leg was secured to the 1H/31P dual coil covered with masking tape to avoid motion during the experiment.
Localizer 1H-images were acquired to detect the leg’s position within the sensitive area of the 1H/31P dual coil. Subsequently, wobble adjustment was performed that allowed for the radiofrequency (RF) coil’s (measuring its absorption spectra) manual tuning/matching. We selected two coils (elements 1H and 31P, respectively) with an isotropic voxel of 48 × 48 × 48 mm3 in the surface coil’s sensitive field. The wobble curve was tuned and matched until the dip reached the center, and its minimum was close to zero. After that, the external magnetic field (B0) map, used to measure a field map of the object used in the study to calculate shims, was set up. The shim was calculated based on a previously measured B0-field map to optimize the field homogeneity within the shim volume. As a result, a proton linewidth of 120–140 Hz was obtained. When the line width at half the height of the proton signal was about 0.5 ppm for one free induction decay (FID), the magnetic field homogeneity was accepted. Then, the spectrometer was turned to 31P nuclei. The entire procedure took about five minutes on average.
31P spectra were acquired, followed by T2-weighted images, leading to a total acquisition time of 10 min during the pre-ischemic phase. The 31P-MRS dynamic protocol consisted of 15 min for the pre-ischemic phase, 120 min for the ischemic phase, and 90 min for the recovery phase, respectively, to quantify phosphate metabolite changes. Each acquisition of 31P-MRS (using non-localized spectra with a single pulse technique) was acquired with the following parameters: flip angle = 90°; repetition time (TR) = 2000 ms; average = 192. Total acquisition time was 6 min 24 s. The parameters used for axial slice T2-weighted images (Figure 4) were as follows: “fast spin-echo sequence”; TR = 2000 ms; time to echo (TE) = 30.69 ms; refocusing angle = 143.7°; rare factor = 8; averages = 3, matrix = 256 × 256 pixels; field of view = 35 × 50 mm2; slice thickness = 1.00 mm, slices = 18; scanning time = 3 min 12 s). The experimental procedure workflow is illustrated in Figure 3.
The MRS data were first processed with TopSpin 4.0.7 software (Bruker Biospin Corp., Billerica MA). The resulting datasets were fitted in the time domain using the AMARES (advanced method for accurate, robust, and efficient spectral fitting) algorithm, implemented in jMRUI software. The NMRSCOPE tool (jMRUI software package) created a basic set of five metabolite spectra that included Pi, PCr, and ATP. PCr and Pi peaks were fitted to Lorentzian line shapes, whereas µ-ATP, α-ATP, and β-ATP signals were fitted to Gaussian line shapes [45]. PCr was used as an internal reference for calculating the absolute concentration of Pi and ATP [46,47]. The PCr/(Pi + PCr) ratio, a marker of the energy state level, was calculated from the Pi and PCr areas [27]. The intracellular pH was calculated from the chemical shift of Pi relative to PCr, utilizing the following equation:
pH = 6.75 + log (δ − 3.27/(5.69 − δ),
where δ is the chemical shift of the Pi peak in parts per million relative to PCr [21].
T2-weighted images were analyzed using ImageJ software (Rasband, W.S., ImageJ, U. S. National Institute of Health, Bethesda, MD, USA) [48]. The signal intensity was measured in two compartments corresponding to the tibialis anterior and the gastrocnemius muscles (locations indicated in Figure 4). The signal intensities of these two regions of interest (ROI) were calculated as the mean values of all pixels within the ROI. The tibia bone’s signal intensity was then used as the reference value to normalize the signal intensity. The signal intensity through each phase, from the pre-ischemic phase to the recovery phase, was quantified.

2.5. Examining Blood Samples

Blood samples were collected for ex vivo analysis. A 24-gauge catheter for invasive blood sampling collection was inserted into the ventral tail artery. After sampling arterial blood in the pre-ischemic state, heparinized physiological saline was flushed into the catheter. The catheter was kept in place until the end of the experiment. Each blood sample (0.25 mL) was obtained and placed into the i-STAT CG4 + cartridge (Abbott product, USA) and FUJI DRI-CHEM slides (Fujifilm Medical, Tokyo, Japan) of the blood test kit. Blood samples were obtained in the pre-ischemic and ischemic states (60 min and 120 min), and after pressure removal (5 min, 60 min, and 90 min). It was assessed at each time point for measurement of the inflammatory biomarker CPK.
Blood samples were analyzed using an automatic biochemical analyzer (FUJI DRI-CHEM 3500v, Fujifilm Medical, Tokyo, Japan) and handheld blood analyzer i-STAT 1 (Abbott product, Princeton, NJ, USA). Results were obtained after 2 min. The analysis included pH and CPK [13,49]. Because the blood analyzer cannot display values over 2000 U/L, we decided to declare results that exceeded the upper boundary as 2000 U/L.

2.6. Statistical Analysis

The results are presented as the mean ± SD. A repeated-measures nonparametric Friedman test was used to compare 31P-MRS and CPK between time points. Potential relationships between the relative signal intensity of the T2-weighted images and CPK were assessed using nonparametric Spearman rank-order correlation. Nonparametric tests were done in adherence with conventional statistical guidelines, as the sample size was small [50]. Statistical significance was p < 0.05. Statistical analyses were performed using GraphPad Prism (version 8.0.2, GraphPad Software, Inc., SanDiego, CA, USA). Significant differences are indicated by p values in the figures.

3. Results

1P-MRS: Upon inducing ACS, 31P-MRS detected changes in the muscles at all time points, but assessing derived parameters such as spectra helped identify muscle changes, as shown in Figure 5. The metabolite concentration of PCr, Pi, and ATP was documented as baseline values. Typical T2-weighted fast spin-echo images are shown in Figure 6.
After muscle compression, the PCr/(Pi + PCr) ratio displayed a steep fall of 0.68 from the pre-ischemic value, and continued to decline for up to 120 min of ischemia (Table 1). The Friedman test revealed a significant difference in the PCr/(Pi + PCr) ratio between the pre-ischemic state, 60 min of ischemia, and 120 min of the ischemic state (p < 0.05, Figure 6). Additionally, there was a significant change of intracellular pH after 120 min of ischemia (p < 0.05, Figure 7, Table 2). At 30 min of the ischemic state, a phosphate monoester (PME) peak was detected, which was not seen in the pre-ischemic phase, in the region of about 4.7–5.0 ppm to the left of the Pi peak (Figure 5). The signal intensity of the tibialis anterior (TA) and gastrocnemius (GA) muscles gradually increased in the T2-weighted images.
Once the zip ties were released, the 31P-MRS spectra displayed instantaneous gradual recovery to the pre-ischemic values. Nevertheless, the PCr/(Pi + PCr) ratio did not ultimately return to normal values, with a difference of 0.19 at 90 min of the reperfusion state (Table 1). The intracellular pH also increased during the reperfusion time, but did not recover to its baseline values (Table 2). The PME peak gradually decreased and disappeared during the reperfusion state (Figure 5).
After release, the muscles’ signal intensities became inhomogeneous, wherein they were remarkably higher than those of other areas (Figure 6). At 90 min of the reperfusion state, the high signal intensity of both the TA and GA muscles was preserved. The signal intensity of the two regions was obtained as relative values to the mean baseline signal (Table 3).
Blood samples: No significant changes were seen in the CPK concentration during the ischemic state when compared to the pre-ischemic level (p > 0.05, Figure 7); only slight changes were observed (86 ± 29.47). CPK gradually increased throughout the experiment period. At 90 min of reperfusion, the CPK increased more rapidly (1566.17 ± 493.30 U/L).
The arterial blood pH level also revealed a minuscule change from pre-ischemia (7.47 ± 0.03) to 60 min of ischemia (7.42 ± 0.03). However, at 120 min of ischemia, a significant change was documented. At 90 min of reperfusion, it had not fully recovered to its pre-ischemic value (Figure 8, Table 2).
There was a significant correlation between the relative signal intensity of the T2-weighted image and CPK concentration from blood examination (R2 = 0.1996, p < 0.05), revealing the presence of edema at the site of the ACS (Figure 9).
There was a significant correlation of the relative signal intensity of T2-weighted images with the CPK concentration, based on blood examination. The gradual increase in the T2 signal intensity and CPK level demonstrated the edema phenomenon.

4. Discussion

The most important finding of this study is that 31P-MRS can detect the change of muscle bioenergetics that occurs during the early ischemic state in rats. This could potentially be a reliable non-invasive method for the early detection of ACS in humans; more research is warranted. 31P-MRS provided a reliable, sensitive measure of the muscle metabolites changes that occur during ACS. These data are consistent with previous data from the arterial occlusion model, wherein 31P-MRS was found to provide early detection of muscle bioenergetic changes [40]. 31P-MRS spectra displayed real-time responsiveness with an immediate detectable change at a constant level when plastic zip ties were fastened, suggesting a loss of perfusion to the tissues. These data revealed that the ratio of PCr/(Pi + PCr) was firmly lower than the baseline value during the ischemic state. In contrast to this, the CPK concentration only showed a slight change in the ischemic state. Thus, it could be suggested that 31P-MRS can detect bioenergetic changes more rapidly and sensitively than CPK. However, CPK can still be used as a useful biomarker to indicate the extent of muscle damage in the sub-acute phase [51]. Moreover, CPK has long been used as a primary biomarker in recognizing trauma for patients with ACS [13]. It is essential to differentiate between invasive measures, such as blood CPK, and non-invasive measures, such as 31P-MRS.
During the ischemic and recovery phase, we consistently found that the PME was peaking. This is an additional sign that can potentially help in detecting early muscle damage in ACS [52]. While it is possible to perform 31P-MRS at a more clinically common field strength of 3 Tesla, differentiation of peaks in the spectra will be more difficult and less efficient [34]. Nowadays, a magnetic field MRI higher than 3 Tesla with 31P-MRS is used to detect the early stage of disease [36,53]. Thus, 31P-MRS has been applied more often in clinical practice to diagnose muscle diseases. The results of this study show there is merit in using 31P-MRS for peripheral vascular disease detection as well, specifically ACS. The 31P-MRS method exhibited potential for use in diverse settings.
Edema of the hindlimb’s compartment, depending on the location in the muscles, was determined by 1H-MR images. During the reperfusion phase, the elevated relative signal intensity of T2-weighted images showed that the water content increased in the extracellular space, similar to other studies [54]. Additionally, there is a correlation between the relative signal intensity of the T2-weighted images (TA and GA muscle regions) and CPK. After the release of muscle compression, it is understood that apparent edema around the skeletal muscle occurred due to the increased vascular permeability in the skeletal muscle induced by oxygen-derived free radicals. This result demonstrated that the muscle damage was consistent for edema symptoms, and thereby suggests that alterations in skeletal muscle high-energy phosphate metabolism occur early in the pathophysiology of ACS. Thus, 31P-MRS can potentially be a useful non-invasive method for the early diagnosis of ACS, thereby increasing the probability of limb salvage in these patients.
In our study, there was an evident difference between the control pH of 31P-MRS and the blood test during the ischemic state. The pH decreased more extensively in ischemic tissue than in the rest of the body. Anaerobic glycolysis lowered the pH in the ischemic area. However, as homeostasis tightly controls the systematic pH value, the value was almost unchanged (normal mammalian blood pH = 7.40 ± 0.02). Hence, this observation supports a previous study which asserted a difference between the arterial blood pH and the superficial pH value [55].
However, the present study has several limitations. First, as we only utilized six rats, the sample size was evidently small, which greatly affected the generalizability of the findings of this study due to a lack of variability. Nonetheless, this pilot study is useful to provide the groundwork for future studies [56]. Second, the surface coil’s sensitivity area was limited. Thus, standardization of images was not possible, rendering the images incomparable. Regardless, it proved the presence of edema in the ACS model [40]. Third, similar to most cases of the reperfusion state, the blood analyzer equipment could not display the specific value of the CPK concentration as it exceeded the upper limit of measurement (2000 U/L). However, it was considered that detailed numerical measurement was unnecessary because it was sufficiently high when compared to the pre-ischemic level. Lastly, after the experiment, we did not conduct a follow-up on the rats’ health status by MRS. We only observed the rats’ behaviors. In the next phase of this study, we recommend conducting a follow-up on the health of the animals post-experiment.
There is merit in comparing the 31P-MRS and blood samples of patients with ACS to further enhance the clinical utility of this technique. There is also tremendous research in the field of regenerative medicine, with possible application in emergency medicine. It has been reported that the clinical efficacy of mesenchymal stem cell therapy for ischemic diseases [57]. Therefore, mesenchymal stem cell therapy has the potential for ACS. By advancing this research, we hope to improve the survival of patients rescued from disasters, and to prevent the deterioration of quality of life due to unnecessary amputation of the lower limbs.

5. Conclusions

Our study showed the possibility of using 31P-MRS as a non-invasive, reliable, and sensitive assessment of changes in muscle metabolites. Acquiring clinical data via 31P-MRS with MRI ultra-field 9.4 Tesla may have the benefit of increased SNR and spectra quality. This research demonstrated that dynamic 31P-MRS measurements may be faster and more accurate than blood sampling tests. Dynamic 31P-MRS could be useful for real-time detection of early ischemic muscular damage in ACS.

Author Contributions

H.O., N.-M.V.V. wrote the main manuscript; H.O. designed the experiments; N.-M.V.V., K.T., and J.H. performed the MRI scanning and data analysis; H.J.O. and T.S., helped conduct the literature review and manuscript amendments. All authors reviewed the manuscript. All authors have read and agreed to the published version of the manuscript.

Funding

This work was supported by the MEXT KAKENHI grant number 18K16404 (to Hiroki Ohta).

Institutional Review Board Statement

The study was conducted according to the guidelines of Academic Research Institutions, and approved by the Institutional Animal Care and Use Committee of The Jikei University School of Medicine (protocol code 2019-043C1 and date of approval: 2 November 2019).

Data Availability Statement

Data were not collected from a public database. All relevant data are available upon request from the corresponding author.

Ethics Approval

This study was approved by the Institutional Animal Care and Use Committee of The Jikei University School of Medicine (Protocol number: 2019-043C1). All experimental procedures were conducted under the Fundamental Guidelines for Proper Conduct of Animal Experiments and Related Activities in Academic Research Institutions issued by the Japanese Ministry of Education, Culture, Sports, Science and Technology.

Acknowledgments

The authors would like to thank the staff Yasuo Kimura, Hazuki Sato, Tamae Ouchi (Laboratory Animal Facilities, The Jikei University School of Medicine), and Asakura Tadashi (Radioisotope Research Facilities) for their active involvement in taking care of the rats and equipment preparation during this study.

Conflicts of Interest

The authors declare that they have no competing interests. However, this study was undertaken as part of N.-M.V.V.’s master’s dissertation.

Abbreviations

ACS: acute compartment syndrome; B0: external magnetic field; SE: spin echo; SI: signal intensity; TR: time repetition; TE: echo time; MRI: magnetic resonance imaging; 31P-MRS: 31phosphorus magnetic resonance spectroscopy; TA: tibialis anterior; GA: gastrocnemius; PCr: phosphocreatine; Pi: inorganic phosphate; ATP: adenosine triphosphate; SNR: signal to noise ratio; CK: creatine kinase; CPK: creatine phosphokinase; PME: phospho-monoester.

References

  1. Köstler, W.; Strohm, P.C.; Südkamp, N.P. Acute compartment syndrome of the limb. Injury 2004, 35, 1221–1227. [Google Scholar] [CrossRef]
  2. Cone, J.; Inaba, K. Lower extremity compartment syndrome. Trauma Surg. Acute Care Open 2017, 2, e000094. [Google Scholar] [CrossRef] [Green Version]
  3. MacKenzie, J.S.; Banskota, B.; Sirisreetreerux, N.; Shafiq, B.; Hasenboehler, E.A. A review of the epidemiology and treatment of orthopaedic injuries after earthquakes in developing countries. World J. Emerg. Surg. WJES 2017, 12, 9. [Google Scholar] [CrossRef] [Green Version]
  4. Pechar, J.; Lyons, M.M. Acute Compartment Syndrome of the Lower Leg: A Review. J. Nurse Pract. 2016, 12, 265–270. [Google Scholar] [CrossRef] [PubMed] [Green Version]
  5. Galyfos, G.; Gkovas, C.; Kerasidis, S.; Stamatatos, I.; Stefanidis, I.; Giannakakis, S.; Geropapas, G.; Kastrisios, G.; Papacharalampous, G.; Maltezos, C. Acute Compartment Syndrome of the Lower Extremity: Update on Proper Evaluation and Management. J. Vasc. Endovasc. Surg. 2016, 1. [Google Scholar] [CrossRef]
  6. Long, B.; Koyfman, A.; Gottlieb, M. Evaluation and Management of Acute Compartment Syndrome in the Emergency Department. J. Emerg. Med. 2019, 56, 386–397. [Google Scholar] [CrossRef]
  7. Shadgan, B.; Menon, M.; O’Brien, P.J.; Reid, W.D. Diagnostic techniques in acute compartment syndrome of the leg. J. Orthop. Trauma 2008, 22, 581–587. [Google Scholar] [CrossRef] [PubMed] [Green Version]
  8. Guo, J.; Yin, Y.; Jin, L.; Zhang, R.; Hou, Z.; Zhang, Y. Acute compartment syndrome: Cause, diagnosis, and new viewpoint. Medicine 2019, 98, e16260. [Google Scholar] [CrossRef]
  9. Von Keudell, A.G.; Weaver, M.J.; Appleton, P.T.; Bae, D.S.; Dyer, G.S.M.; Heng, M.; Jupiter, J.B.; Vrahas, M.S. Diagnosis and treatment of acute extremity compartment syndrome. Lancet 2015, 386, 1299–1310. [Google Scholar] [CrossRef]
  10. Olinic, D.M.; Stanek, A.; Tătaru, D.A.; Homorodean, C.; Olinic, M. Acute Limb Ischemia: An Update on Diagnosis and Management. J. Clin. Med. 2019, 8, 1215. [Google Scholar] [CrossRef] [Green Version]
  11. Bott, A.R.; Roszpopa, J.; Johnston, P.; Grant, I. Simultaneous 4 Compartment Pressure Monitoring in Diagnosis of Chronic Exertional Compartment Syndrome of the Forearm. Tech. Hand Up. Extrem. Surg. 2020. [Google Scholar] [CrossRef] [PubMed]
  12. Singh, A.; Ali, S.; Mahdi, A.A.; Rn, S. Serum Creatine Kinase: A Predictive Biomarker for Diagnosis of Acute Compartment Syndrome in the Paediatric Population. J. Orthop. Bone Res. 2018, 1, 103. [Google Scholar]
  13. Valdez, C.; Schroeder, E.; Amdur, R.; Pascual, J.; Sarani, B. Serum creatine kinase levels are associated with extremity compartment syndrome. J. Trauma Acute Care Surg. 2013, 74, 441–445, discussion 445–447. [Google Scholar] [CrossRef] [PubMed]
  14. Brancaccio, P.; Lippi, G.; Maffulli, N. Biochemical markers of muscular damage. Clin. Chem. Lab. Med. 2010, 48, 757–767. [Google Scholar] [CrossRef]
  15. Vrouenraets, B.C.; Kroon, B.B.; Klaase, J.M.; Bonfrer, J.M.; Nieweg, O.E.; van Slooten, G.W.; van Dongen, J.A. Value of laboratory tests in monitoring acute regional toxicity after isolated limb perfusion. Ann. Surg. Oncol. 1997, 4, 88–94. [Google Scholar] [CrossRef]
  16. McMillan, T.E.; Gardner, W.T.; Schmidt, A.H.; Johnstone, A.J. Diagnosing acute compartment syndrome-where have we got to? Int. Orthop. 2019, 43, 2429–2435. [Google Scholar] [CrossRef] [Green Version]
  17. Mabvuure, N.T.; Malahias, M.; Hindocha, S.; Khan, W.; Juma, A. Acute compartment syndrome of the limbs: Current concepts and management. Open Orthop. J. 2012, 6, 535–543. [Google Scholar] [CrossRef] [Green Version]
  18. Shah, P.K.; Ye, F.; Liu, M.; Jayaraman, A.; Baligand, C.; Walter, G.; Vandenborne, K. In vivo (31)P NMR spectroscopy assessment of skeletal muscle bioenergetics after spinal cord contusion in rats. Eur. J. Appl. Physiol. 2014, 114, 847–858. [Google Scholar] [CrossRef] [PubMed]
  19. Miki, N.; Ikata, T.; Takai, H.; Takata, S.; Koga, K.; Sogabe, T. Effects of denervation on energy metabolism of rat hindlimb muscles: Application of 31P-MRS and 19F-MRS. J. Orthop. Sci. 1999, 4, 370–375. [Google Scholar] [CrossRef]
  20. Baligand, C.; Todd, A.G.; Lee-McMullen, B.; Vohra, R.S.; Byrne, B.J.; Falk, D.J.; Walter, G.A. (13)C/(31)P MRS Metabolic Biomarkers of Disease Progression and Response to AAV Delivery of hGAA in a Mouse Model of Pompe Disease. Mol. Ther. Methods Clin. Dev. 2017, 7, 42–49. [Google Scholar] [CrossRef] [Green Version]
  21. Greiner, A.; Esterhammer, R.; Messner, H.; Biebl, M.; Mühlthaler, H.; Fraedrich, G.; Jaschke, W.R.; Schocke, M.F. High-energy phosphate metabolism during incremental calf exercise in patients with unilaterally symptomatic peripheral arterial disease measured by phosphor 31 magnetic resonance spectroscopy. J. Vasc. Surg. 2006, 43, 978–986. [Google Scholar] [CrossRef] [Green Version]
  22. Kemp, G.J. Quantifying Skeletal Muscle Mitochondrial Function In Vivo by 31P Magnetic Resonance Spectroscopy. In Mitochondrial Dysfunction Caused by Drugs and Environmental Toxicants; John Wiley & Sons, Inc.: Hoboken, NJ, USA, 2018; pp. 443–456. [Google Scholar] [CrossRef]
  23. Mehta, P.; Morrow, M.; Russell, J.; Madhuripan, N.; Habeeb, M. Magnetic Resonance Imaging of Musculoskeletal Emergencies. Semin. Ultrasound CT MRI 2017, 38, 439–452. [Google Scholar] [CrossRef]
  24. Miller, R.G.; Boska, M.D.; Moussavi, R.S.; Carson, P.J.; Weiner, M.W. 31P nuclear magnetic resonance studies of high energy phosphates and pH in human muscle fatigue. Comparison of aerobic and anaerobic exercise. J. Clin. Investig. 1988, 81, 1190–1196. [Google Scholar] [CrossRef] [PubMed] [Green Version]
  25. Schmid, A.I.; Schewzow, K.; Fiedler, G.B.; Goluch, S.; Laistler, E.; Wolzt, M.; Moser, E.; Meyerspeer, M. Exercising calf muscle T(2) * changes correlate with pH, PCr recovery and maximum oxidative phosphorylation. NMR Biomed. 2014, 27, 553–560. [Google Scholar] [CrossRef] [PubMed]
  26. Soussi, B.; Idström, J.-P.; Bylund-Fellenius, A.-C.; Scherstén, T. Dynamics of skeletal muscle energetics during ischemia and reperfusion assessed by in vivo 31P NMR. NMR Biomed. 1990, 3, 71–77. [Google Scholar] [CrossRef] [PubMed]
  27. Yoshida, N.; Ikata, T.; Sairyo, K.; Matsuura, T.; Sasa, T.; Koga, K.; Fukunaga, M. Evaluation of disuse atrophy of rat skeletal muscle based on muscle energy metabolism assessed by 31P-MRS. J. Physiol. Anthropol. Appl. Hum. Sci. 2001, 20, 247–252. [Google Scholar] [CrossRef] [PubMed]
  28. Fiedler, G.B.; Meyerspeer, M.; Schmid, A.I.; Goluch, S.; Schewzow, K.; Laistler, E.; Mirzahosseini, A.; Niess, F.; Unger, E.; Wolzt, M.; et al. Localized semi-LASER dynamic (31)P magnetic resonance spectroscopy of the soleus during and following exercise at 7 T. Magma 2015, 28, 493–501. [Google Scholar] [CrossRef] [PubMed] [Green Version]
  29. Klepochova, R.; Valkovic, L.; Hochwartner, T.; Triska, C.; Bachl, N.; Tschan, H.; Trattnig, S.; Krebs, M.; Krssak, M. Differences in Muscle Metabolism Between Triathletes and Normally Active Volunteers Investigated Using Multinuclear Magnetic Resonance Spectroscopy at 7T. Front. Physiol. 2018, 9, 300. [Google Scholar] [CrossRef] [PubMed] [Green Version]
  30. Purvis, L.A.B.; Valkovič, L.; Robson, M.D.; Rodgers, C.T. Feasibility of absolute quantification for (31) P MRS at 7 T. Magn. Reson. Med. 2019, 82, 49–61. [Google Scholar] [CrossRef] [Green Version]
  31. Van der Kolk, A.G.; Hendrikse, J.; Zwanenburg, J.J.M.; Visser, F.; Luijten, P.R. Clinical applications of 7T MRI in the brain. Eur. J. Radiol. 2013, 82, 708–718. [Google Scholar] [CrossRef] [Green Version]
  32. Isaacs, B.R.; Mulder, M.J.; Groot, J.M.; van Berendonk, N.; Lute, N.; Bazin, P.-L.; Forstmann, B.U.; Alkemade, A. 3 versus 7 Tesla magnetic resonance imaging for parcellations of subcortical brain structures in clinical settings. PLoS ONE 2020, 15, e0236208. [Google Scholar] [CrossRef] [PubMed]
  33. Valkovič, L.; Chmelík, M.; Meyerspeer, M.; Gagoski, B.; Rodgers, C.T.; Krššák, M.; Andronesi, O.C.; Trattnig, S.; Bogner, W. Dynamic (31)P-MRSI using spiral spectroscopic imaging can map mitochondrial capacity in muscles of the human calf during plantar flexion exercise at 7 T. NMR Biomed. 2016, 29, 1825–1834. [Google Scholar] [CrossRef] [PubMed]
  34. Parasoglou, P.; Xia, D.; Chang, G.; Regatte, R.R. Dynamic three-dimensional imaging of phosphocreatine recovery kinetics in the human lower leg muscles at 3T and 7T: A preliminary study. NMR Biomed. 2013, 26, 348–356. [Google Scholar] [CrossRef] [PubMed] [Green Version]
  35. Bakermans, A.J.; Abdurrachim, D.; van Nierop, B.J.; Koeman, A.; van der Kroon, I.; Baartscheer, A.; Schumacher, C.A.; Strijkers, G.J.; Houten, S.M.; Zuurbier, C.J.; et al. In vivo mouse myocardial (31)P MRS using three-dimensional image-selected in vivo spectroscopy (3D ISIS): Technical considerations and biochemical validations. NMR Biomed. 2015, 28, 1218–1227. [Google Scholar] [CrossRef]
  36. Qiao, H.; Zhang, X.; Zhu, X.H.; Du, F.; Chen, W. In vivo 31P MRS of human brain at high/ultrahigh fields: A quantitative comparison of NMR detection sensitivity and spectral resolution between 4 T and 7 T. Magn. Reson. Imaging 2006, 24, 1281–1286. [Google Scholar] [CrossRef] [Green Version]
  37. Lu, M.; Chen, W.; Zhu, X.-H. Field dependence study of in vivo brain (31)P MRS up to 16.4 T. NMR Biomed. 2014, 27, 1135–1141. [Google Scholar] [CrossRef] [Green Version]
  38. Ohta, H.; Ohki, T.; Kanaoka, Y.; Koizumi, M.; Okano, H.J. Pitfalls of invasive blood pressure monitoring using the caudal ventral artery in rats. Sci. Rep. 2017, 7, 41907. [Google Scholar] [CrossRef] [PubMed] [Green Version]
  39. Toyoshima, Y.; Webb, J.; Gregory, A.; Fatemi, M.; Alizad, A.; Zhao, C. Ultrasound shear wave elastography for measuring intracompartmental pressure of compartment syndrome using a turkey hind limb model. J. Biomech. 2020, 98, 109427. [Google Scholar] [CrossRef] [PubMed]
  40. Morikawa, S.; Kido, C.; Inubushi, T. Observation of rat hind limb skeletal muscle during arterial occlusion and reperfusion by 31P MRS and 1H MRI. Magn. Reson. Imaging 1991, 9, 269–274. [Google Scholar] [CrossRef]
  41. Irvine Office of Research (University of California). Determination and Justification of Animal Numbers. Available online: https://research.uci.edu/compliance/animalcare-use/protocol-writing-tips-and-guidance/justify-numbers.html (accessed on 15 March 2021).
  42. Sorzano, C.; Tabas-Madrid, D.; Núñez, F.; Fernández-Criado, C.; Naranjo, A. Sample Size for Pilot Studies and Precision Driven Experiments. arXiv 2017, arXiv:1707.00222. [Google Scholar]
  43. Torvinen, S.; Silvennoinen, M.; Piitulainen, H.; Närväinen, J.; Tuunanen, P.; Gröhn, O.; Koch, L.G.; Britton, S.L.; Kainulainen, H. Rats bred for low aerobic capacity become promptly fatigued and have slow metabolic recovery after stimulated, maximal muscle contractions. PLoS ONE 2012, 7, e48345. [Google Scholar] [CrossRef] [PubMed]
  44. Van den Broek, N.M.; Ciapaite, J.; Nicolay, K.; Prompers, J.J. Comparison of in vivo postexercise phosphocreatine recovery and resting ATP synthesis flux for the assessment of skeletal muscle mitochondrial function. Am. J. Physiol. Cell Physiol. 2010, 299, C1136–C1143. [Google Scholar] [CrossRef] [Green Version]
  45. Jablonski, M.; Starcukova, J.; Starcuk, Z., Jr. Processing tracking in jMRUI software for magnetic resonance spectra quantitation reproducibility assurance. BMC Bioinform. 2017, 18, 56. [Google Scholar] [CrossRef] [PubMed] [Green Version]
  46. Buchli, R.; Meier, D.; Martin, E.; Boesiger, P. Assessment of absolute metabolite concentrations in human tissue by 31P MRS in vivo. Part II: Muscle, liver, kidney. Magn. Reson. Med. 1994, 32, 453–458. [Google Scholar] [CrossRef] [PubMed]
  47. Kemp, G.J.; Meyerspeer, M.; Moser, E. Absolute quantification of phosphorus metabolite concentrations in human muscle in vivo by 31P MRS: A quantitative review. NMR Biomed. 2007, 20, 555–565. [Google Scholar] [CrossRef] [PubMed]
  48. Hata, J. 3. Introduction to MRI Image Analysis Using ImageJ. Nihon Hoshasen Gijutsu Gakkai Zasshi 2019, 75, 89–94. [Google Scholar] [CrossRef]
  49. Baird, M.F.; Graham, S.M.; Baker, J.S.; Bickerstaff, G.F. Creatine-kinase- and exercise-related muscle damage implications for muscle performance and recovery. J. Nutr. Metab. 2012, 2012, 960363. [Google Scholar] [CrossRef] [Green Version]
  50. Altman, D.G.; Gore, S.M.; Gardner, M.J.; Pocock, S.J. Statistical guidelines for contributors to medical journals. Br. Med. J. (Clin. Res. Ed.) 1983, 286, 1489–1493. [Google Scholar] [CrossRef] [Green Version]
  51. Budsberg, S.C.; Shuler, M.S.; Hansen, M.; Uhl, E.; Freedman, B.A. Comparison of NIRS, serum biomarkers, and muscle damage in a porcine balloon compression model of acute compartment syndrome. J. Trauma Acute Care Surg. 2016, 81, 876–881. [Google Scholar] [CrossRef]
  52. Tzika, A.A.; Vignerson, D.; Hricak, H.; Kogan, B.A.; Moseley, M.E.; James, T.L. Role of P-31 MR Spectroscopy in Assessing Testicular Torsion: Rat Model; Radiological Society of North America Inc: Oak Brook, IL, USA, 1988. [Google Scholar]
  53. Cui, W.; Jang, A.; Zhang, P.; Thompson, B.; Townsend, D.; Metzger, J.M.; Zhang, J. Early Detection of Myocardial Bioenergetic Deficits: A 9.4 Tesla Complete Non Invasive 31P MR Spectroscopy Study in Mice with Muscular Dystrophy. PLoS ONE 2015, 10, e0135000. [Google Scholar] [CrossRef]
  54. Ackermann, P.W.; Labruto, F.; Weiss, R.J.; Jansson, K.-Å. Increasing thigh pain: Acute compartment syndrome! BMJ Case Rep. 2010, 2010, bcr1220092513. [Google Scholar] [CrossRef] [PubMed] [Green Version]
  55. Paillard, M. Direct intracellular pH measurement in rat and crab muscle. J. Physiol. 1972, 223, 297–319. [Google Scholar] [CrossRef]
  56. Hassan, Z.A.; Schattner, P.; Mazza, D. Doing A Pilot Study: Why Is It Essential? Malays. Fam. Physician 2006, 1, 70–73. [Google Scholar] [PubMed]
  57. Ohta, H.; Liu, X.; Maeda, M. Autologous adipose mesenchymal stem cell administration in arteriosclerosis and potential for anti-aging application: A retrospective cohort study. Stem Cell Res. Ther. 2020, 11, 538. [Google Scholar] [CrossRef] [PubMed]
Figure 1. Fastened zip-tie rat model of acute compartment syndrome. Creation of an ACS model of the entire right lower limb by wrapping a zip tie around the rat’s right inguinal region. (A) The site of the zip tie. (B) The arterial line for blood sample collection. An arterial line was placed in the caudal ventral artery and set up so that blood could be sampled at any time.
Diagnostics 11 00586 g001
Figure 2. The experiment’s equipment. The prepared rat was placed in a left lateral position (A) on a dedicated MR cradle and connected to an anesthesia system (B), where the inhalation concentration could be adjusted accordingly. An ultra-high field 9.4 Tesla magnetic resonance imaging (MRI) machine (C) and a surface coil capable of observing the biochemical kinetics of 1H and 31P (D) were fixed to the right lower leg region. The red circle (20 mm inner diameter) is the region of interest.
Diagnostics 11 00586 g002
Figure 3. The experimental protocol. White arrows indicate the timings of data collection for phosphorus magnetic resonance spectroscopy (31P-MRS) and T2-weighted images. Red arrows designate the time of arterial blood sampling for creatine phosphokinase and pH concentration. 31P-MRS spectra were acquired at rest, during muscle compression (for 120 min) and reperfusion (for 90 min). During the magnetic resonance (MR) procedure, the concentration of pH and creatine phosphokinase (CPK) were analyzed from blood samples obtained from the tail artery.
Diagnostics 11 00586 g003
Figure 4. T2-weighted image scanning plan for the detection of the compartment region in the rats. The sagittal and coronal planes are the localizer views. A: Shows the knee joint. The red box indicates the range of the scanner’s field of view. The axial slice was localized from the sagittal and coronal planes. B: The locations correspond to the gastrocnemius muscle (GA), which is located at the posterior side of the leg. C: Tibialis anterior muscle (TA), which is located on the anterior side of the leg. The yellow mark indicates the border of the muscles.
Diagnostics 11 00586 g004
Figure 5. The dynamic graph of the 31P-MRS spectrum. (A) Time series of the dynamic 31P-MRS spectrum in the pre-ischemic, ischemic, and reperfusion states. (B) The change of the 31P-MRS wave during the experiment. In the ischemic state, a phosphate monoester (PME) peak appeared at 30 min and gradually increased until 120 min of the ischemic state. At the beginning of the reperfusion state, the PME peak started to decrease, and completely disappeared at 185 min of the reperfusion state.
Diagnostics 11 00586 g005
Figure 6. The change of relative signal intensity of T2-weighted images during ischemic and reperfusion states. (A) T2-weighted images during the experiment. Images at (1) pre-ischemia, (2) 60 min of ischemia, (3) 120 min of ischemia, and (4) 5 min, (5) 60 min, and (6) 90 min of reperfusion. Hyperintensity was seen at the beginning of the reperfusion phase. (B) The mean signal intensity in T2-weighted images. The mean signal intensities were calculated at two regions during the experiment (GA and TA muscles). The increasing relative signal intensity of T2-weighted images showed that the water content increased in the extracellular space. It demonstrated that the edema phenomenon gradually appeared in the reperfusion phase.
Diagnostics 11 00586 g006
Figure 7. Dynamics in the ratio of PCr/(Pi + PCr) and concentration of CPK during the ischemic and reperfusion states. (A,B) Changing of the PCr/(Pi + PCr) ratio and CPK of rat skeletal muscles during 2 h of the ischemic and 1.5 h of the post-ischemic states. (C,D) Comparison of the quantitative PCr/(Pi + PCr) ratio and CPK at 0, 60, 120, 125, 185, and 215 min before, during, and after ischemia. ns (not significant); ** (0.001 < p < 0.005) and **** (p < 0.0001), based on the Friedman test.
Diagnostics 11 00586 g007
Figure 8. Dynamics in the concentration of intracellular pH and systemic pH during the ischemic and reperfusion states. (A,B) The change of the intracellular pH and arterial blood pH value during the experiment. (C,D) Comparison of the quantitative intracellular pH and arterial pH in pre-ischemia, ischemia, and reperfusion. ns (not significant); * (0.01 < p < 0.05), ** (0.001 < p < 0.005) and *** (p < 0.001), based on the Friedman test.
Diagnostics 11 00586 g008
Figure 9. The correlation between the relative signal intensity of T2-weighted images and the CPK concentration. * (0.01 < p < 0.05).
Diagnostics 11 00586 g009
Table 1. PCr/(Pi + PCr) ratio and creatine phosphokinase (CPK) level at different time points.
Pre-IschemicIschemicReperfusion
Minute06012056090
PCr/(Pi + PCr)
Case 10.850.150.020.290.460.46
Case 20.910.230.030.280.480.41
Case 30.890.240.050.590.800.84
Case 40.660.070.050.370.850.87
Case 50.900.200.030.300.810.80
Case 60.930.190.030.460.670.66
0.86 ± 0.100.18 ± 0.060.04 ± 0.010.38 ± 0.120.68 ± 0.170.67 ± 0.20
(0.85–0.91 *)(0.15–0.23 *)(0.03–0.05 *)(0.29–0.46 *)(0.48–0.81 *)(0.46–0.84 *)
p = 0.003 **p < 0.0001 **p = 0.067p > 0.999p > 0.999
CPK level
Case 17114733481922222222
Case 26110224520513092222
Case 36530031338112891337
Case 49141991216749919
Case 58726111953913492222
Case 6141220883196381141
89 ± 29.46241.50 ± 113.28198.33 ± 112.88413.16 ± 233.511259.33 ± 562.951677.16 ± 611.31
(65–87 *)(147–220 *)(91–313 *)(319–539 *)(749–1349 *)(919–2222 *)
p = 0.948 **p > 0.999 **p = 0.126 **p = 0.001 **p < 0.0001 **
Mean ± SD (n = 6). The unit of PCr/(Pi + PCr) and creatine phosphokinase level are ratio and U/L, respectively. * Interquartile range p value in relation to the pre-ischemic state. ** shows significant difference.
Table 2. Intracellular pH (31P-MRS) and pH (arterial blood) at different time points.
Pre-IschemicIschemicReperfusion
Minute06012056090
pH (31P-MRS)
Case 17.116.856.476.396.546.53
Case 27.086.846.416.356.446.57
Case 37.106.856.556.547.027.06
Case 47.086.526.206.236.096.13
Case 57.086.836.466.375.845.84
Case 67.106.886.496.497.057.07
7.09 ± 0.016.80 ± 0.146.430 ± 0.136.40 ± 0.106.50 ± 0.496.53 ± 0.49
(7.08–7.10 *)(6.83–6.85 *)(6.41–6.49 *)(6.35–6.49 *)(6.09–7.02 *)(6.13–7.06 *)
p = 0.614 **p = 0.004 **p = 0.0008 **p = 0.021 **p = 0.083 **
pH (arterial blood)
Case 17.507.387.357.357.367.36
Case 27.457.447.407.387.397.39
Case 37.477.427.397.387.417.39
Case 47.507.437.457.457.487.46
Case 57.437.387.357.367.387.38
Case 67.467.367.387.377.367.36
7.47 ± 0.037.41 ± 0.037.39 ± 0.047.39 ± 0.047.40 ± 0.047.39 ± 0.034
(7.45–7.50 *)(7.38–7.43 *)(7.35–7.40 *)(7.36–7.38 *)(7.47–7.41 *)(7.36–7.39 *)
p = 0.103 **p = 0.021 **p = 0.0008 **p = 0.043 **p = 0.103 **
Mean ± SD (n = 6). * Interquartile range p value in relation to the pre-ischemic state. ** shows significant difference.
Table 3. The signal intensity values of the anterior tibialis muscle (TA) and gastrocnemius muscle (GA).
Pre-IschemicIschemicReperfusion
Minute06012056090
TA
Case 114.5876.9988.92119.68148.83127.75
Case 213.8875.0384.2171.1874.2268.17
Case 310.5872.2077.7382.7376.5780.06
Case 411.6183.0488.80108.35108.2992.60
Case 518.0876.8770.70103.8266.7879.96
Case 612.3684.5296.2986.58109.18103.53
13.52 ± 2.67
(11.61–14.58 *)
78.11 ± 4.75
(75.03–83.04 *)
84.44 ± 9.09
(77.73–88.92 *)
95.39 ± 18.18
(82.73–108.35 *)
97.31 ± 31.02
(74.22–109.18 *)
92.01 ± 21.29
(79.96–103.53 *)
GA
Case 16.08130.85153.34238.48213.38151.92
Case 211.7877.8286.8188.1867.8764.29
Case 38.0587.2085.93103.56135.08141.16
Case 410.9970.5094.7597.95109.4392.68
Case 516.4378.5574.09103.5068.7478.24
Case 68.2274.1580.4177.50116.45102.29
10.26 ± 3.67
(8.05–11.78 *)
86.51 ± 22.42
(74.15–78.55 *)
95.89 ± 28.98
(85.93–94.75 *)
118.20 ± 59.78
(88.18–103.56 *)
118.49 ± 53.67
(67.87–116.45 *)
105.10 ± 34.76
(78.24–102.29 *)
Mean ± SD (n = 6). * Interquartile range p value in relation to the pre-ischemic state.
Publisher’s Note: MDPI stays neutral with regard to jurisdictional claims in published maps and institutional affiliations.

