
Establishment of a Potential Serum Biomarker Panel for the Diagnosis and Prognosis of Cholangiocarcinoma Using Decision Tree Algorithms

 ,
,
Abstract
:1. Introduction
2. Materials and Methods
2.1. Patients and Serum Samples
2.2. The Detection of Candidate Proteins in Sera by Sandwich ELISA
2.3. The Detection of CA19-9 in Sera by Automated ELECSYS COBAS
2.4. Decision Tree Construction for CCA Biomarkers Panel
- Start with the root node (t = 1).
- Search for a split s* among the set if all possible candidate ’s’ the give the purest decrease in impurity.
- Split node t = 1 into two nodes (t = 2 and t = 3) using the split s*.
- Repeat the split search process, by following the steps 1–3, for the obtained nodes (t = 2 and t = 3) until the tree grows fully or the stopping rules are met.
2.5. Statistical Analysis
3. Results
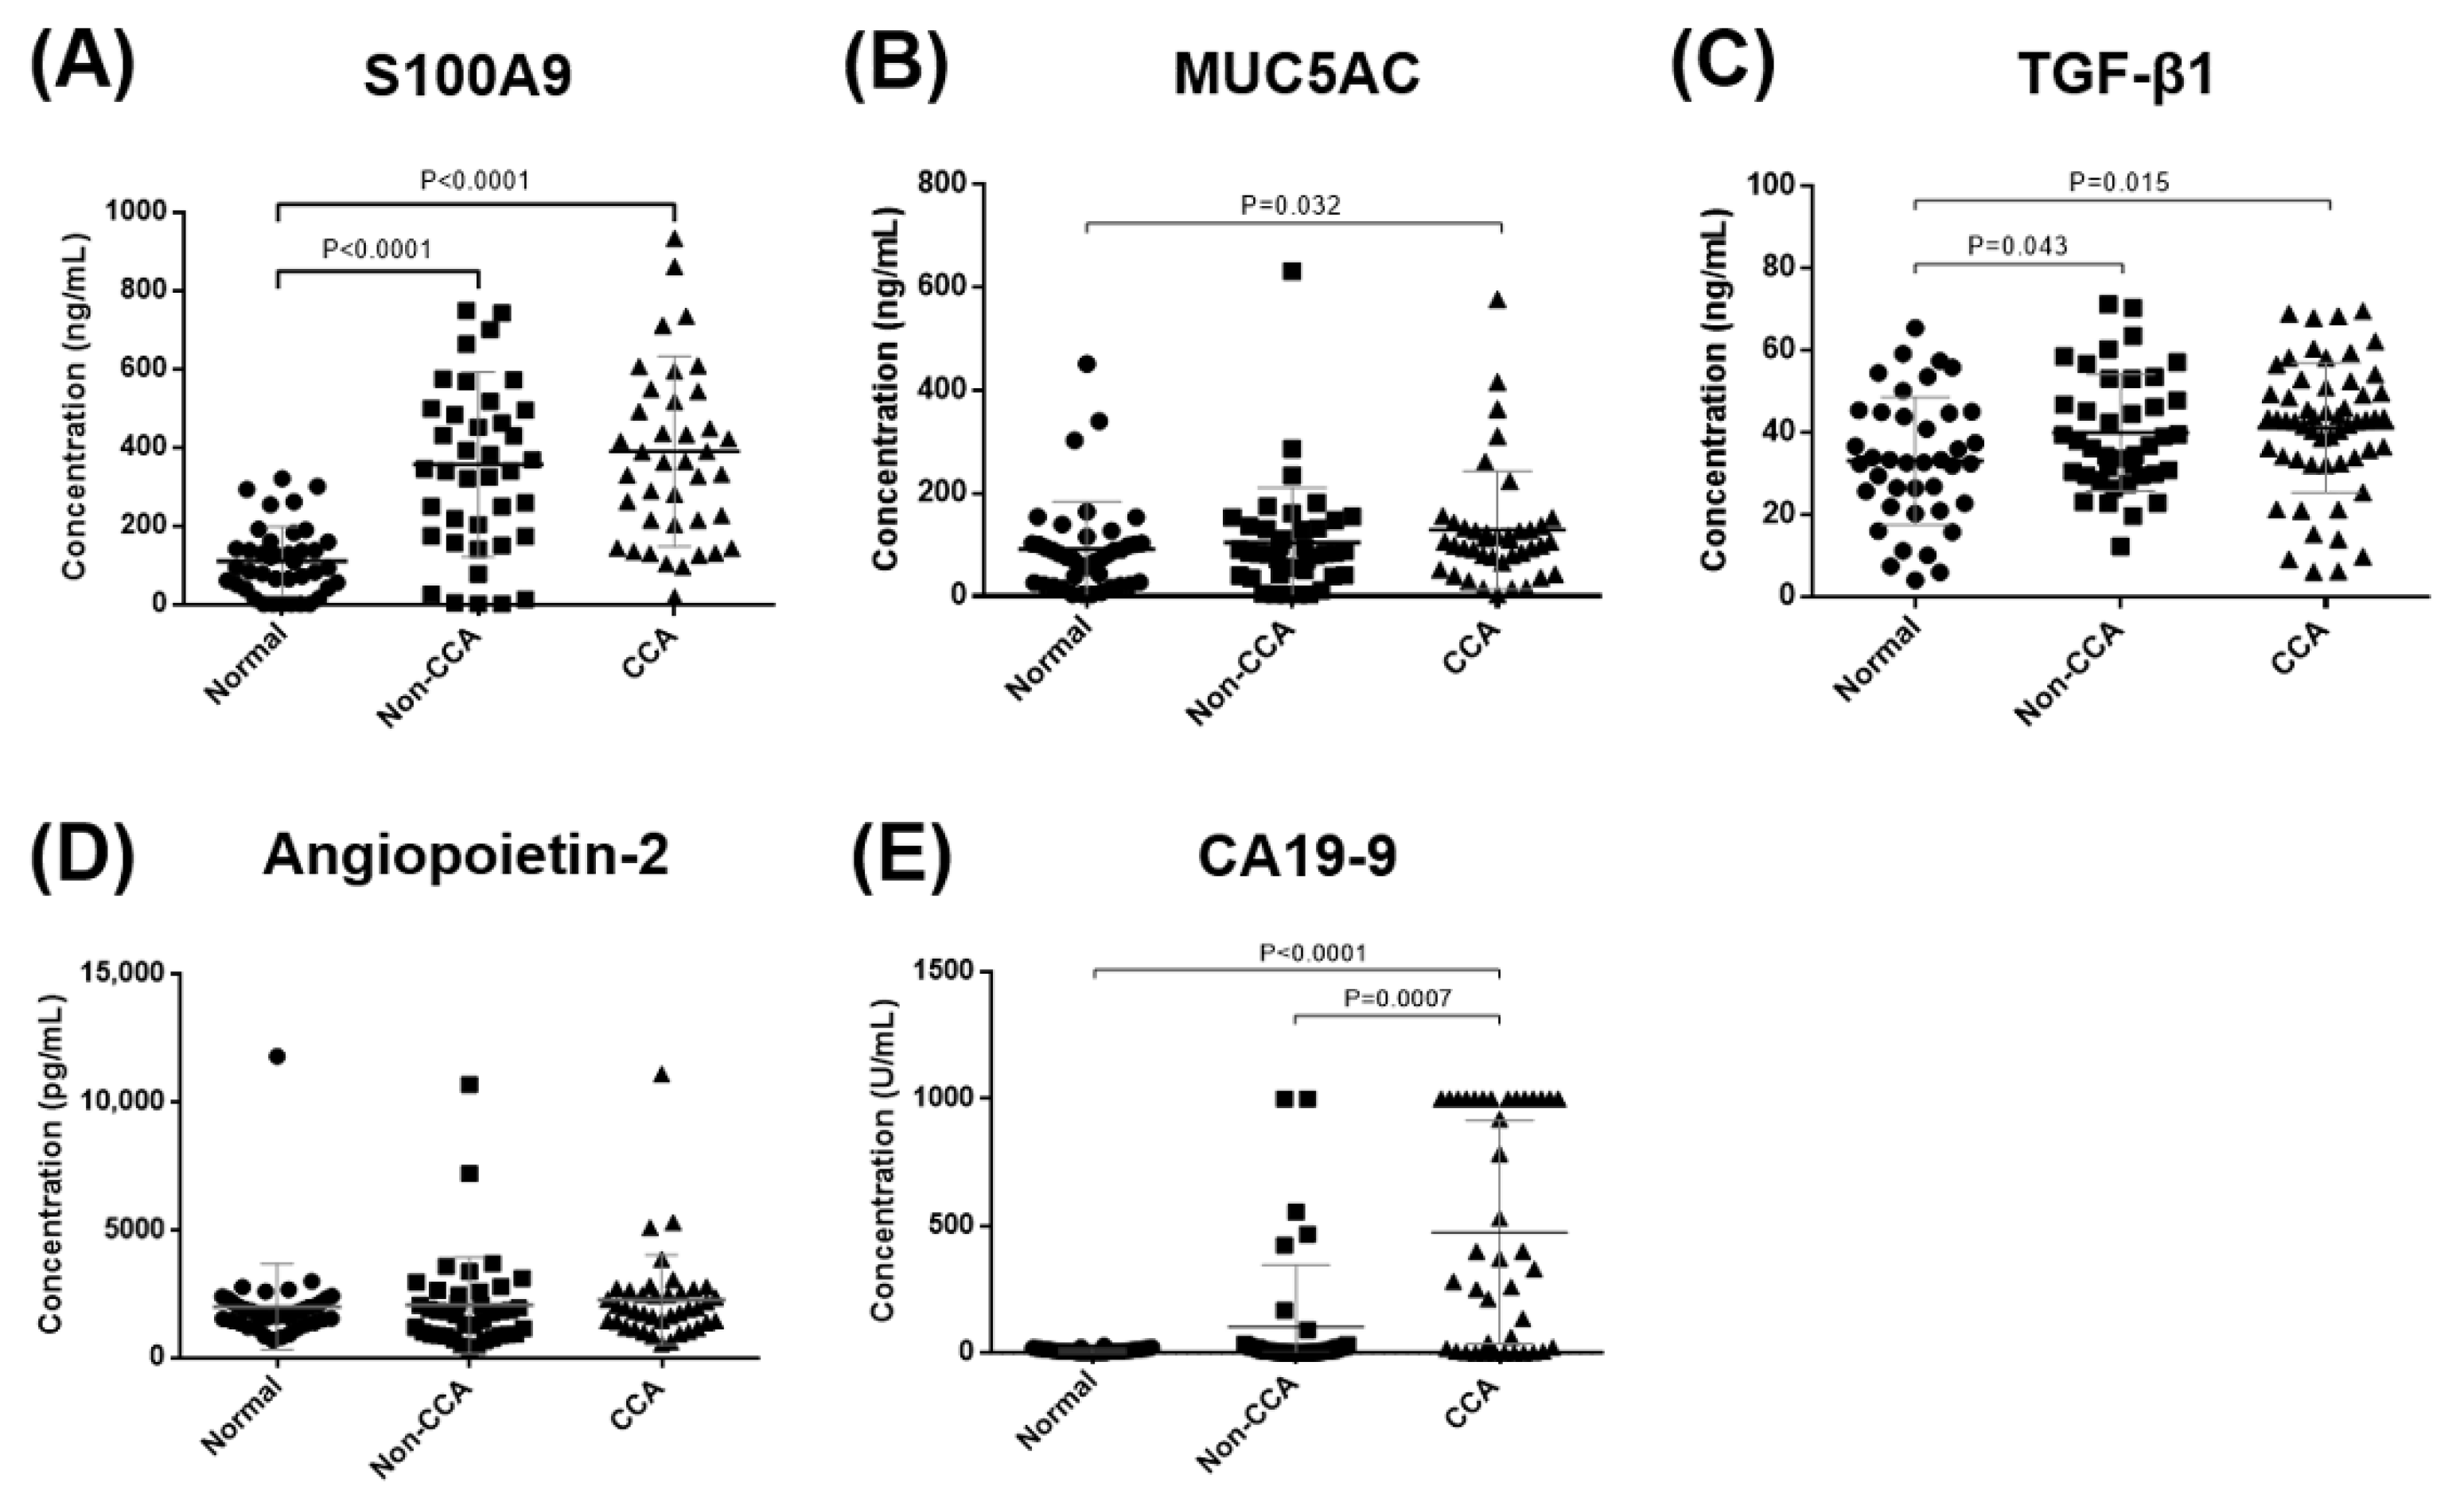
3.1. The Validation of Candidate Biomarkers in Sera of CCA Patients
3.2. The Correlation between Serum Candidate Biomarkers Level with Clinicopathological Data of CCA Patients
3.3. The Overall Survival Analysis of Candidate Biomarkers in Sera of CCA Patients
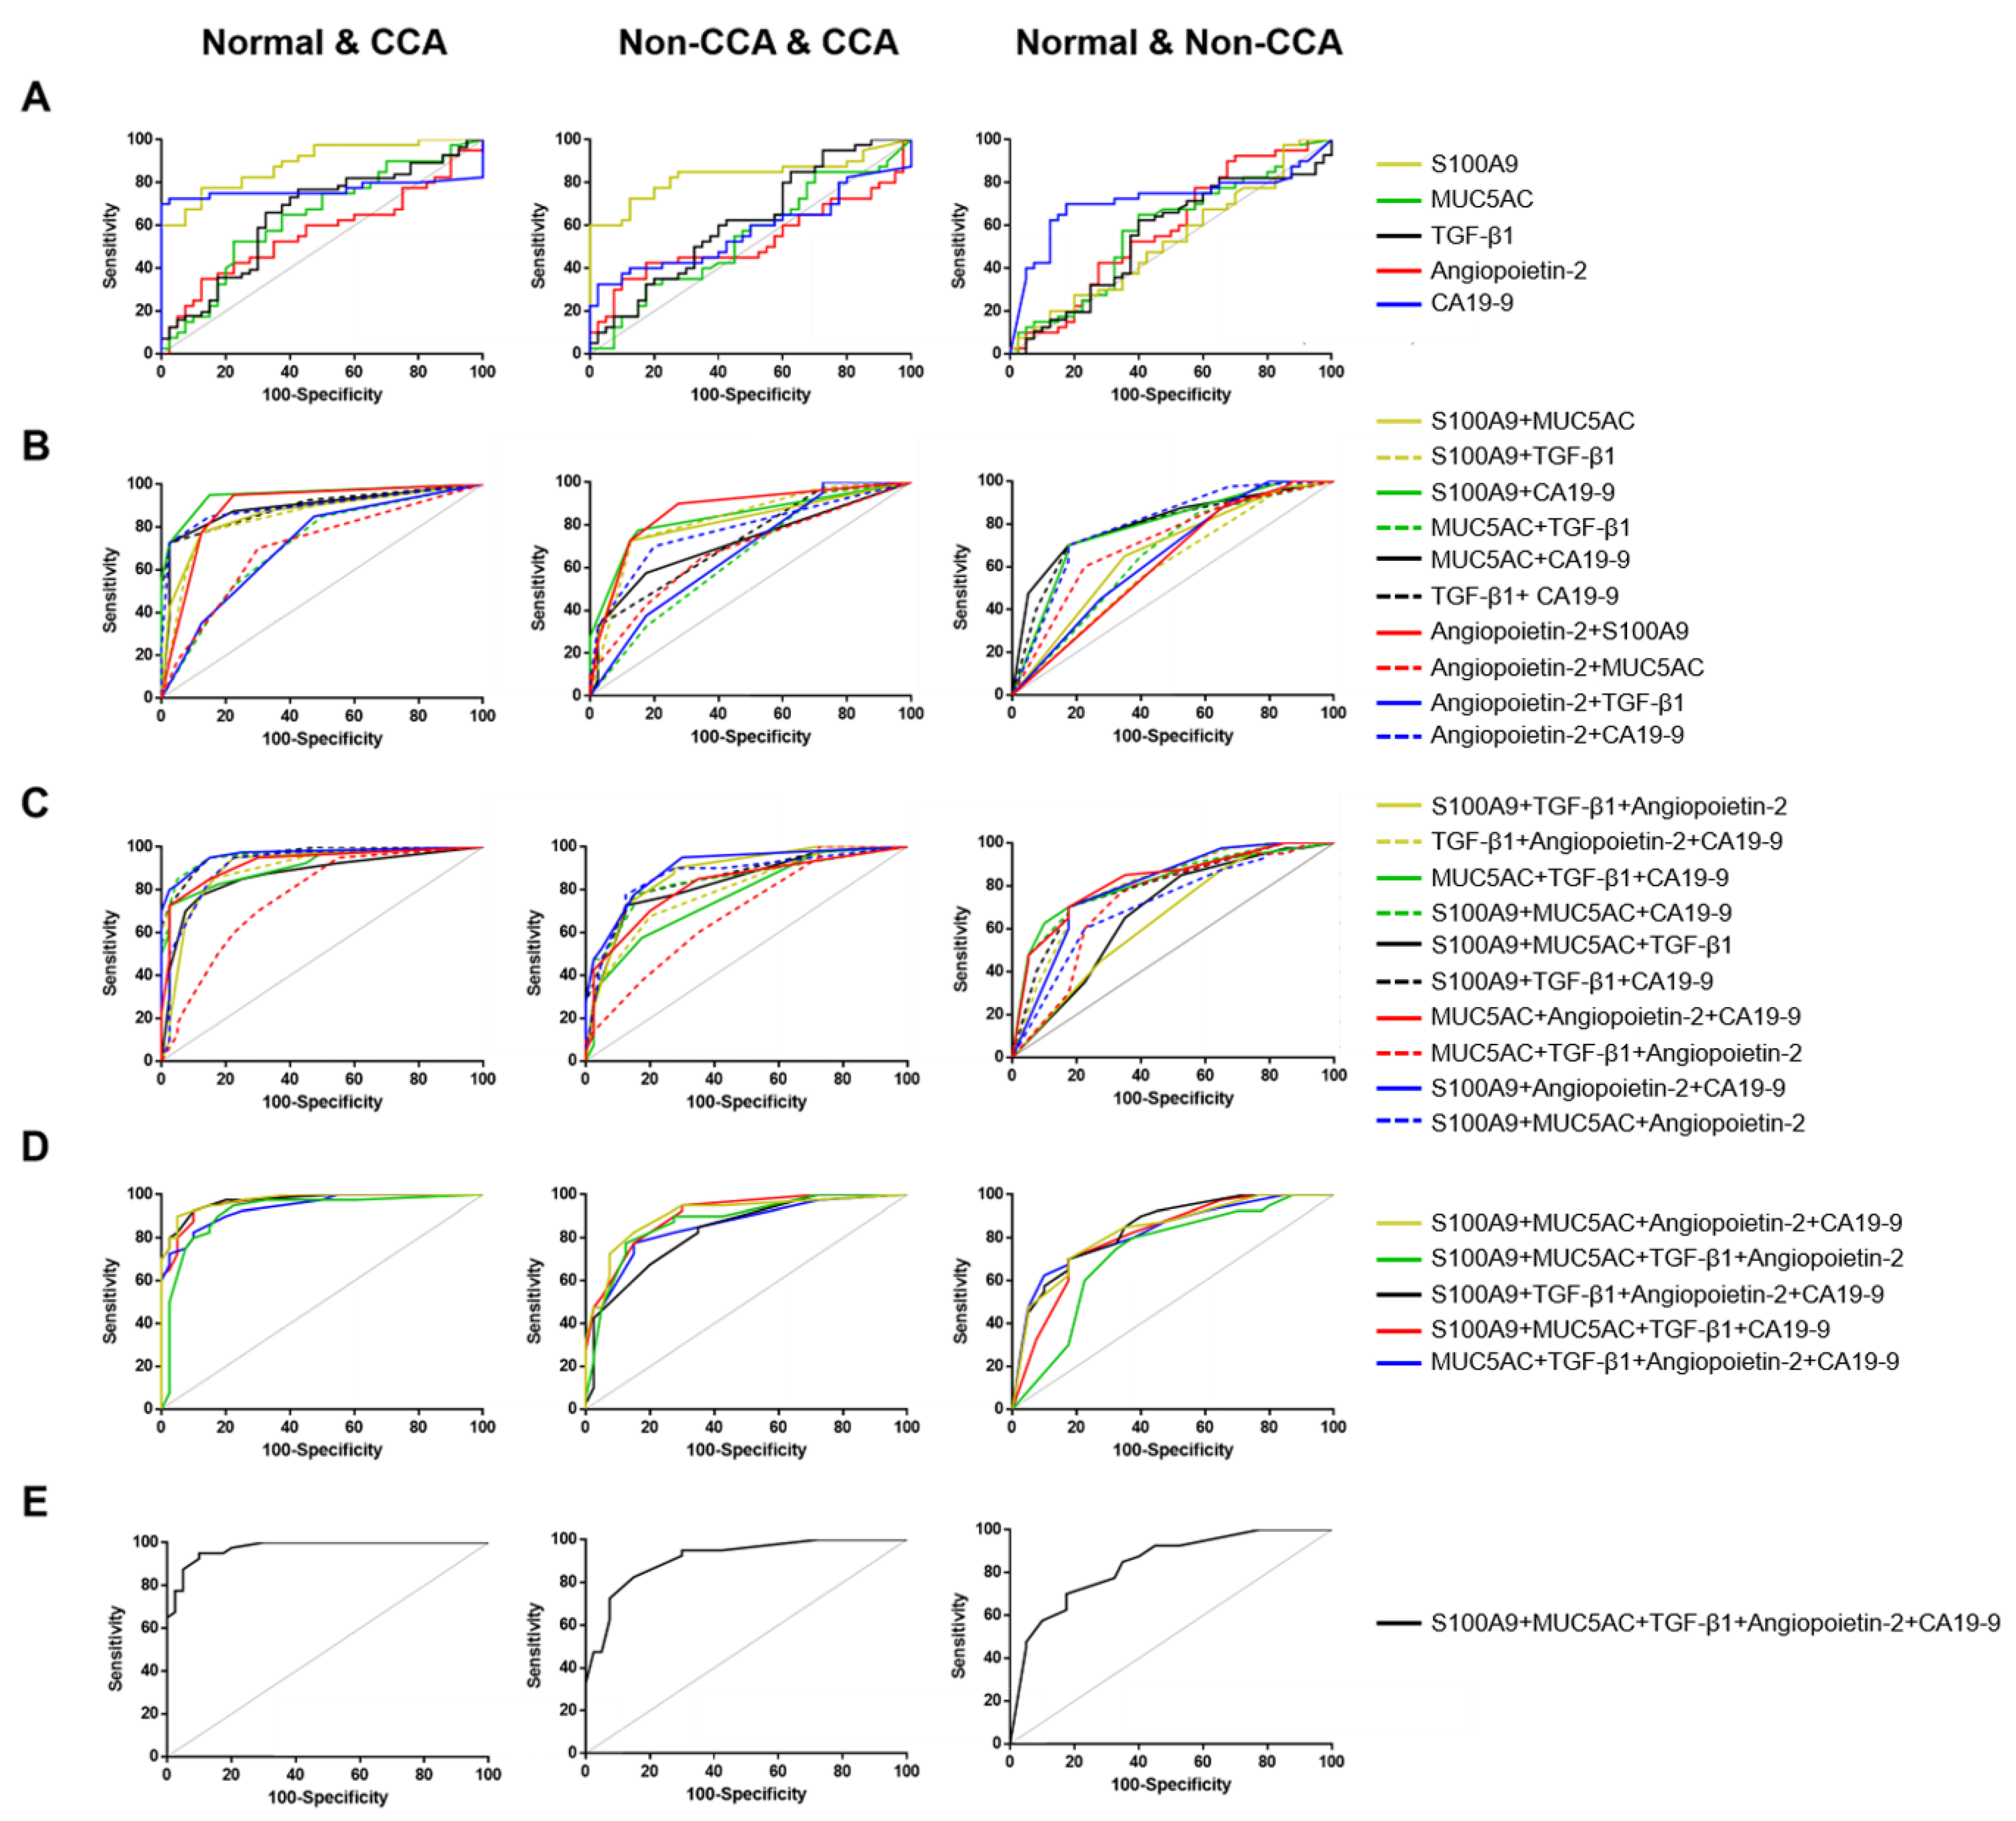
3.4. The Combination of Candidate Biomarkers to Establish the Biomarkers Panel for CCA Diagnosis by Logistic Regression Models
3.5. The Predictive Value of Candidate Biomarkers for Diagnosis CCA
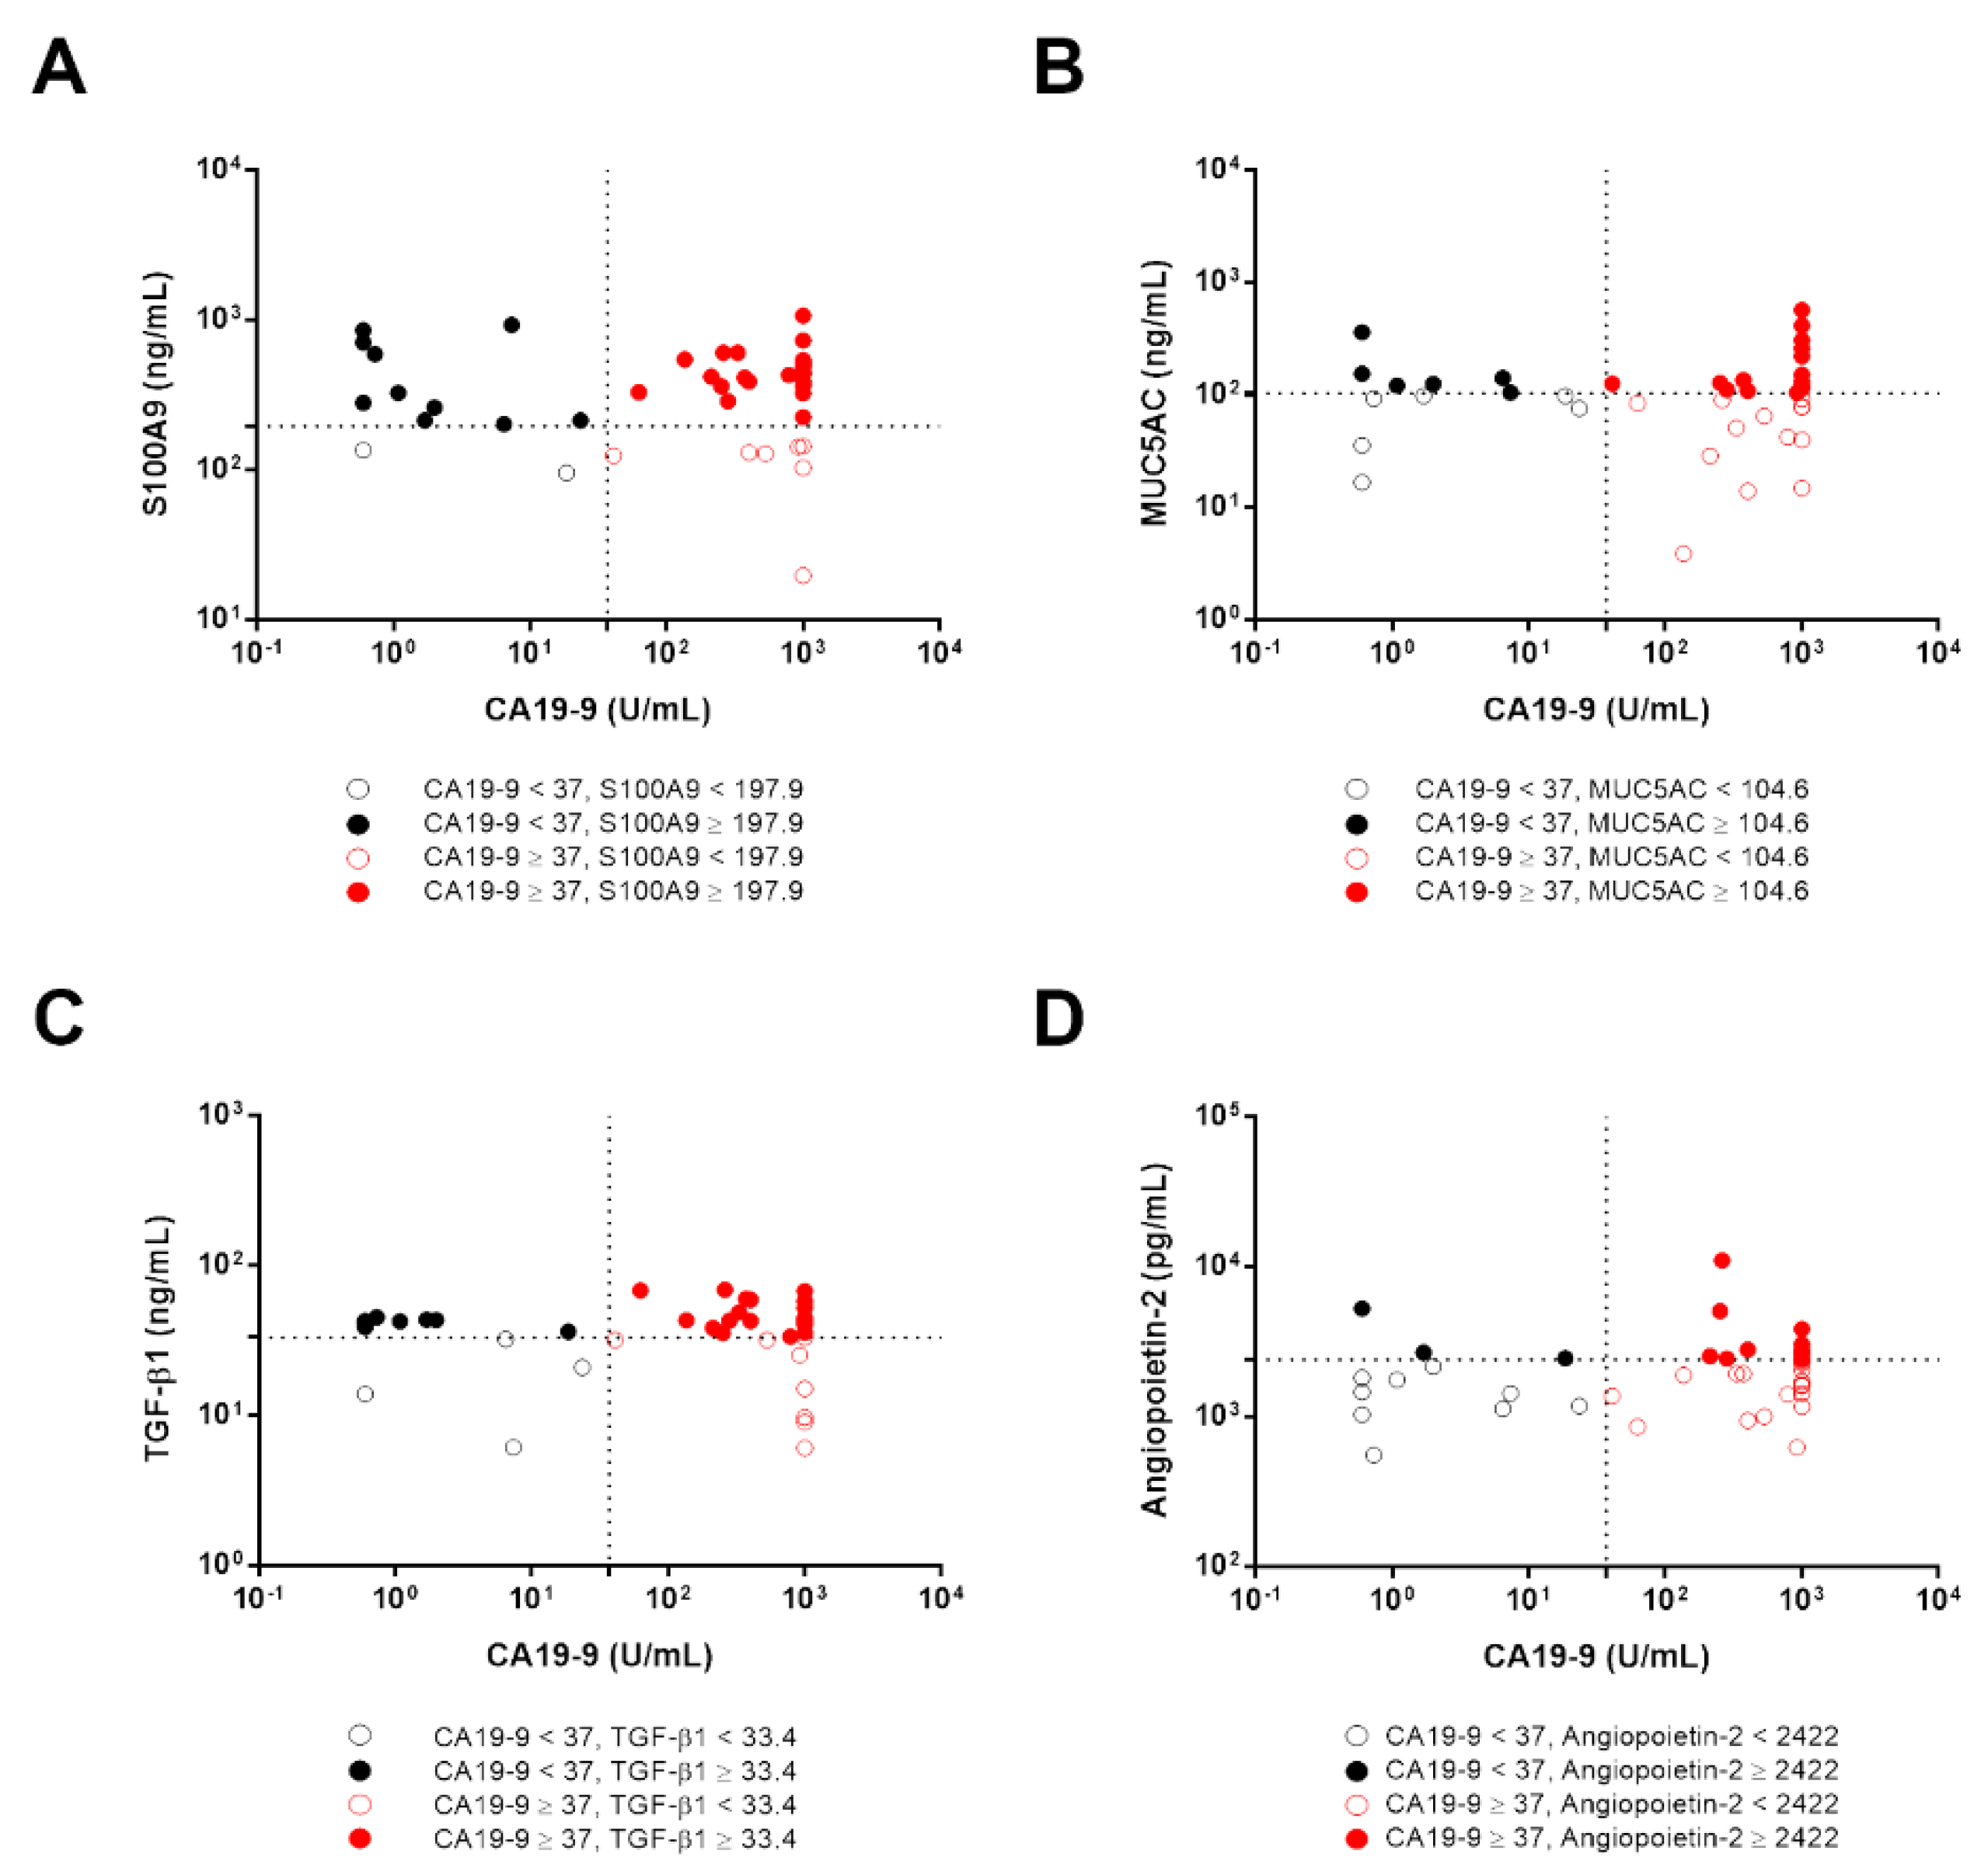
3.6. The Diagnostic Accuracy of Candidate Biomarkers in CCA Patients with Low CA19-9 Levels
3.7. The Analysis of Candidate Biomarkers as Potential Prognostic Biomarkers in CCA Patients
3.8. Decision Tree Construction and Their Diagnostic Performance for CCA Biomarkers Panel
4. Discussion
5. Conclusions
Supplementary Materials
Author Contributions
Funding
Institutional Review Board Statement
Informed Consent Statement
Data Availability Statement
Acknowledgments
Conflicts of Interest
Abbreviations
| ACC | accuracy |
| ALP | alkaline phosphatase |
| AUC | area under the ROC curve |
| BBD | benign biliary diseases |
| CA19-9 | carbohydrate antigen 19-9 |
| CART | Classification and Regression Tree |
| CCA | cholangiocarcinoma |
| CI | confidence interval |
| DT | decision tree |
| ECLIA | electrochemiluminescence immunoassay |
| ELISA | enzyme-linked immunosorbent assay |
| GI | gastrointestinal cancers |
| HCC | hepatocellular carcinoma |
| LR | likelihood ratio |
| MUC5AC | mucin 5AC |
| NPV | negative predictive value |
| OD | optical density |
| OR | odd ratios |
| PPV | positive predictive value |
| ROC | receiver operating characteristic curve |
| S100A9 | S100 calcium binding protein A9 |
| SN | sensitivity |
| SP | specificity |
| TGF-β1 | transforming growth factor β1 |
| TMB | tetramethylbenzidine |
| YI | Youden index |
References
- Sripa, B.; Kaewkes, S.; Sithithaworn, P.; Mairiang, E.; Laha, T.; Smout, M.; Pairojkul, C.; Bhudhisawasdi, V.; Tesana, S.; Thinkamrop, B.; et al. Liver fluke induces cholangiocarcinoma. PLoS Med. 2007, 4, e201. [Google Scholar] [CrossRef] [PubMed]
- Banales, J.M.; Marin, J.J.; Lamarca, A.; Rodrigues, P.M.; Khan, S.A.; Roberts, L.R.; Cardinale, V.; Carpino, G.; Andersen, J.B.; Braconi, C. Cholangiocarcinoma 2020: The next horizon in mechanisms and management. Nat. Rev. Gastroenterol. Hepatol. 2020, 17, 577–588. [Google Scholar] [CrossRef]
- DeOliveira, M.L.; Cunningham, S.C.; Cameron, J.L.; Kamangar, F.; Winter, J.M.; Lillemoe, K.D.; Choti, M.A.; Yeo, C.J.; Schulick, R.D. Cholangiocarcinoma: Thirty-one-year experience with 564 patients at a single institution. Ann. Surg. 2007, 245, 755. [Google Scholar] [CrossRef]
- Munoz-Garrido, P.; Rodrigues, P.M. The jigsaw of dual hepatocellular–intrahepatic cholangiocarcinoma tumours. Nat. Rev. Gastroenterol. Hepatol. 2019, 16, 653–655. [Google Scholar] [CrossRef]
- Bjornsson, E.; Kilander, A.; Olsson, R. CA 19-9 and CEA are unreliable markers for cholangiocarcinoma in patients with primary sclerosing cholangitis. Liver 1999, 19, 501–508. [Google Scholar] [CrossRef] [PubMed]
- Bonney, G.K.; Craven, R.A.; Prasad, R.; Melcher, A.F.; Selby, P.J.; Banks, R.E. Circulating markers of biliary malignancy: Opportunities in proteomics? Lancet Oncol. 2008, 9, 149–158. [Google Scholar] [CrossRef]
- Cuenco, J.; Wehnert, N.; Blyuss, O.; Kazarian, A.; Whitwell, H.J.; Menon, U.; Dawnay, A.; Manns, M.P.; Pereira, S.P.; Timms, J.F. Identification of a serum biomarker panel for the differential diagnosis of cholangiocarcinoma and primary sclerosing cholangitis. Oncotarget 2018, 9, 17430. [Google Scholar] [CrossRef]
- Takenami, T.; Maeda, S.; Karasawa, H.; Suzuki, T.; Furukawa, T.; Morikawa, T.; Takadate, T.; Hayashi, H.; Nakagawa, K.; Motoi, F. Novel biomarkers distinguishing pancreatic head Cancer from distal cholangiocarcinoma based on proteomic analysis. BMC Cancer 2019, 19, 318. [Google Scholar] [CrossRef]
- Macias, R.I.; Banales, J.M.; Sangro, B.; Muntané, J.; Avila, M.A.; Lozano, E.; Perugorria, M.J.; Padillo, F.J.; Bujanda, L.; Marin, J.J. The search for novel diagnostic and prognostic biomarkers in cholangiocarcinoma. Biochim. Biophys. Acta (BBA) Mol. Basis Dis. 2018, 1864, 1468–1477. [Google Scholar] [CrossRef]
- Wongkham, S.; Silsirivanit, A. State of serum markers for detection of cholangiocarcinoma. Asian Pac. J. Cancer Prev. 2012, 13, 17–27. [Google Scholar]
- Tshering, G.; Dorji, P.W.; Chaijaroenkul, W.; Na-Bangchang, K. Biomarkers for the diagnosis of cholangiocarcinoma: A systematic review. Am. J. Trop. Med. Hyg. 2018, 98, 1788–1797. [Google Scholar] [CrossRef]
- Bohm, D.; Keller, K.; Wehrwein, N.; Lebrecht, A.; Schmidt, M.; Kolbl, H.; Grus, F.H. Serum proteome profiling of primary breast cancer indicates a specific biomarker profile. Oncol. Rep. 2011, 26, 1051–1056. [Google Scholar] [CrossRef] [PubMed]
- Clarke, C.H.; Yip, C.; Badgwell, D.; Fung, E.T.; Coombes, K.R.; Zhang, Z.; Lu, K.H.; Bast, R.C., Jr. Proteomic biomarkers apolipoprotein A1, truncated transthyretin and connective tissue activating protein III enhance the sensitivity of CA125 for detecting early stage epithelial ovarian cancer. Gynecol. Oncol. 2011, 122, 548–553. [Google Scholar] [CrossRef]
- Ocak, S.; Chaurand, P.; Massion, P.P. Mass spectrometry-based proteomic profiling of lung cancer. Proc. Am. Thorac. Soc. 2009, 6, 159–170. [Google Scholar] [CrossRef]
- Duangkumpha, K.; Stoll, T.; Phetcharaburanin, J.; Yongvanit, P.; Thanan, R.; Techasen, A.; Namwat, N.; Khuntikeo, N.; Chamadol, N.; Roytrakul, S.; et al. Discovery and Qualification of Serum Protein Biomarker Candidates for Cholangiocarcinoma Diagnosis. J. Proteome Res. 2019, 18, 3305–3316. [Google Scholar] [CrossRef]
- Wongkham, S.; Sheehan, J.K.; Boonla, C.; Patrakitkomjorn, S.; Howard, M.; Kirkham, S.; Sripa, B.; Wongkham, C.; Bhudhisawasdi, V. Serum MUC5AC mucin as a potential marker for cholangiocarcinoma. Cancer Lett. 2003, 195, 93–99. [Google Scholar] [CrossRef]
- Boonla, C.; Wongkham, S.; Sheehan, J.K.; Wongkham, C.; Bhudhisawasdi, V.; Tepsiri, N.; Pairojkul, C. Prognostic value of serum MUC5AC mucin in patients with cholangiocarcinoma. Cancer 2003, 98, 1438–1443. [Google Scholar] [CrossRef]
- Silsirivanit, A.; Araki, N.; Wongkham, C.; Pairojkul, C.; Narimatsu, Y.; Kuwahara, K.; Narimatsu, H.; Wongkham, S.; Sakaguchi, N. A novel serum carbohydrate marker on mucin 5AC: Values for diagnostic and prognostic indicators for cholangiocarcinoma. Cancer 2011, 117, 3393–3403. [Google Scholar] [CrossRef]
- Kimawaha, P.; Jusakul, A.; Junsawang, P.; Loilome, W.; Khuntikeo, N.; Techasen, A. Circulating TGF-β1 as the potential epithelial mesenchymal transition-biomarker for diagnosis of cholangiocarcinoma. J. Gastrointest. Oncol. 2020, 11, 304. [Google Scholar] [CrossRef]
- Voigtländer, T.; David, S.; Thamm, K.; Schlué, J.; Metzger, J.; Manns, M.P.; Lankisch, T.O. Angiopoietin-2 and biliary diseases: Elevated serum, but not bile levels are associated with cholangiocarcinoma. PLoS ONE 2014, 9, e97046. [Google Scholar]
- Yu, Y.; Chen, S.; Wang, L.-S.; Chen, W.-L.; Guo, W.-J.; Yan, H.; Zhang, W.-H.; Peng, C.-H.; Zhang, S.-D.; Li, H.-W. Prediction of pancreatic cancer by serum biomarkers using surface-enhanced laser desorption/ionization-based decision tree classification. Oncology 2005, 68, 79–86. [Google Scholar] [CrossRef]
- Su, Y.; Shen, J.; Qian, H.; Ma, H.; Ji, J.; Ma, H.; Ma, L.; Zhang, W.; Meng, L.; Li, Z. Diagnosis of gastric cancer using decision tree classification of mass spectral data. Cancer Sci. 2007, 98, 37–43. [Google Scholar] [CrossRef]
- Vlahou, A.; Schorge, J.O.; Gregory, B.W.; Coleman, R.L. Diagnosis of ovarian cancer using decision tree classification of mass spectral data. J. Biomed. Biotechnol. 2003, 2003, 308–319. [Google Scholar] [CrossRef]
- Cruz, J.A.; Wishart, D.S. Applications of machine learning in cancer prediction and prognosis. Cancer Informatics 2006, 2, 59–77. [Google Scholar] [CrossRef]
- Domthong, U.; Junsawang, P.; Wongsrichanalai, V.; Kittiworawittkul, P.; Domthong, P. The Classification of Severity Level in Exertional Heatstroke Patients by Applying a Decision Tree Technique. Thail. Stat. 2017, 15, 43–53. [Google Scholar]
- Breiman, L.; Friedman, J.; Olshen, R.; Stone, C. Classification and Regression Trees; Wadsworth and Brooks/Cole: Monterey, CA, USA, 1984. [Google Scholar]
- Pedregosa, F.; Varoquaux, G.; Gramfort, A.; Michel, V.; Thirion, B.; Grisel, O.; Blondel, M.; Prettenhofer, P.; Weiss, R.; Dubourg, V. Scikit-learn: Machine learning in Python. J. Mach. Learn. Res. 2011, 12, 2825–2830. [Google Scholar]
- Maestranzi, S.; Przemioslo, R.; Mitchell, H.; Sherwood, R. The effect of benign and malignant liver disease on the tumour markers CA19-9 and CEA. Ann. Clin. Biochem. 1998, 35, 99–103. [Google Scholar] [CrossRef]
- Tao, L.-Y.; Cai, L.; He, X.-D.; Liu, W.; Qu, Q. Comparison of serum tumor markers for intrahepatic cholangiocarcinoma and hepatocellular carcinoma. Am. Surg. 2010, 76, 1210–1213. [Google Scholar] [CrossRef]
- Gebhardt, C.; Németh, J.; Angel, P.; Hess, J. S100A8 and S100A9 in inflammation and cancer. Biochem. Pharmacol. 2006, 72, 1622–1631. [Google Scholar] [CrossRef]
- Zhou, M.; Li, M.; Liang, X.; Zhang, Y.; Huang, H.; Feng, Y.; Wang, G.; Liu, T.; Chen, Z.; Pei, H. The significance of serum S100A9 and TNC levels as biomarkers in colorectal cancer. J. Cancer 2019, 10, 5315. [Google Scholar] [CrossRef]
- Moravkova, P.; Kohoutova, D.; Vavrova, J.; Bures, J. Serum S100A6, S100A8, S100A9 and S100A11 proteins in colorectal neoplasia: Results of a single centre prospective study. Scand. J. Clin. Lab. Investig. 2020, 80, 173–178. [Google Scholar] [CrossRef] [PubMed]
- Reinhard, L.; Rupp, C.; Riedel, H.-D.; Ruppert, T.; Giese, T.; Flechtenmacher, C.; Weiss, K.H.; Kloeters-Plachky, P.; Stremmel, W.; Schirmacher, P. S100A9 is a biliary protein marker of disease activity in primary sclerosing cholangitis. PLoS ONE 2012, 7, e29821. [Google Scholar] [CrossRef]
- Ruzzenente, A.; Iacono, C.; Conci, S.; Bertuzzo, F.; Salvagno, G.; Ruzzenente, O.; Campagnaro, T.; Valdegamberi, A.; Pachera, S.; Bagante, F. A novel serum marker for biliary tract cancer: Diagnostic and prognostic values of quantitative evaluation of serum mucin 5AC (MUC5AC). Surgery 2014, 155, 633–639. [Google Scholar] [CrossRef]
- Matull, W.; Andreola, F.; Loh, A.; Adiguzel, Z.; Deheragoda, M.; Qureshi, U.; Batra, S.K.; Swallow, D.; Pereira, S. MUC4 and MUC5AC are highly specific tumour-associated mucins in biliary tract cancer. Br. J. Cancer 2008, 98, 1675–1681. [Google Scholar] [CrossRef]
- Luka, J.; Arlen, P.M.; Bristol, A. Development of a serum biomarker assay that differentiates tumor-associated MUC5AC (NPC-1C ANTIGEN) from normal MUC5AC. J. Biomed. Biotechnol. 2010, 2011, 934757. [Google Scholar] [CrossRef]
- Arbelaiz, A.; Azkargorta, M.; Krawczyk, M.; Santos-Laso, A.; Lapitz, A.; Perugorria, M.J.; Erice, O.; Gonzalez, E.; Jimenez-Agüero, R.; Lacasta, A. Serum extracellular vesicles contain protein biomarkers for primary sclerosing cholangitis and cholangiocarcinoma. Hepatology 2017, 66, 1125–1143. [Google Scholar] [CrossRef]
- Saito, H.; Tsujitani, S.; Oka, S.; Kondo, A.; Ikeguchi, M.; Maeta, M.; Kaibara, N. An elevated serum level of transforming growth factor-beta 1 (TGF-beta 1) significantly correlated with lymph node metastasis and poor prognosis in patients with gastric carcinoma. Anticancer Res. 2000, 20, 4489–4493. [Google Scholar]
- Xiong, B.; Yuan, H.-Y.; Hu, M.-B.; Zhang, F.; Wei, Z.-Z.; Gong, L.-L.; Yang, G.-L. Transforming growth factor-β1 in invasion and metastasis in colorectal cancer. World J. Gastroenterol. 2002, 8, 674. [Google Scholar] [CrossRef]
- Kakehi, Y.; Oka, H.; Mitsumori, K.; Itoh, N.; Ogawa, O.; Yoshida, O. Elevation of serum transforming growth factor-β1 level in patients with metastatic prostate cancer. Urol. Oncol. Semin. Orig. Investig. 1996, 2, 131–135. [Google Scholar] [CrossRef]
- Araki, K.; Shimura, T.; Suzuki, H.; Tsutsumi, S.; Wada, W.; Yajima, T.; Kobayahi, T.; Kubo, N.; Kuwano, H. E/N-cadherin switch mediates cancer progression via TGF-β-induced epithelial-to-mesenchymal transition in extrahepatic cholangiocarcinoma. Br. J. Cancer 2011, 105, 1885–1893. [Google Scholar] [CrossRef] [PubMed]
- Duangkumpha, K.; Techasen, A.; Loilome, W.; Namwat, N.; Thanan, R.; Khuntikeo, N.; Yongvanit, P. BMP-7 blocks the effects of TGF-β-induced EMT in cholangiocarcinoma. Tumor Biol. 2014, 35, 9667–9676. [Google Scholar] [CrossRef]
- Sfiligoi, C.; De Luca, A.; Cascone, I.; Sorbello, V.; Fuso, L.; Ponzone, R.; Biglia, N.; Audero, E.; Arisio, R.; Bussolino, F. Angiopoietin-2 expression in breast cancer correlates with lymph node invasion and short survival. Int. J. Cancer 2003, 103, 466–474. [Google Scholar] [CrossRef]
- Park, J.H.; Park, K.J.; Kim, Y.S.; Sheen, S.S.; Lee, K.S.; Lee, H.N.; Oh, Y.J.; Hwang, S.C. Serum angiopoietin-2 as a clinical marker for lung cancer. Chest 2007, 132, 200–206. [Google Scholar] [CrossRef] [PubMed]
- Wada, H.; Nagano, H.; Yamamoto, H.; Yang, Y.; Kondo, M.; Ota, H.; Nakamura, M.; Yoshioka, S.; Kato, H.; Damdinsuren, B. Expression pattern of angiogenic factors and prognosis after hepatic resection in hepatocellular carcinoma: Importance of angiopoietin-2 and hypoxia-induced factor-1a. Liver Int. 2006, 26, 414–423. [Google Scholar] [CrossRef]
- Imanishi, Y.; Hu, B.; Jarzynka, M.J.; Guo, P.; Elishaev, E.; Bar-Joseph, I.; Cheng, S.-Y. Angiopoietin-2 stimulates breast cancer metastasis through the α5β1 integrin-mediated pathway. Cancer Res. 2007, 67, 4254–4263. [Google Scholar] [CrossRef]
- Pardali, E.; ten Dijke, P. Transforming growth factor-beta signaling and tumor angiogenesis. Front. Biosci. 2009, 14, 4848. [Google Scholar] [CrossRef]
- Mandriota, S.J.; Pepper, M.S. Regulation of angiopoietin-2 mRNA levels in bovine microvascular endothelial cells by cytokines and hypoxia. Circ. Res. 1998, 83, 852–859. [Google Scholar] [CrossRef] [PubMed]
- Pattanapairoj, S.; Silsirivanit, A.; Muisuk, K.; Seubwai, W.; Cha’on, U.; Vaeteewoottacharn, K.; Sawanyawisuth, K.; Chetchotsak, D.; Wongkham, S. Improve discrimination power of serum markers for diagnosis of cholangiocarcinoma using data mining-based approach. Clin. Biochem. 2015, 48, 668–673. [Google Scholar] [CrossRef]
- Negrini, D.; Zecchin, P.; Ruzzenente, A.; Bagante, F.; De Nitto, S.; Gelati, M.; Salvagno, G.L.; Danese, E.; Lippi, G. Machine Learning Model Comparison in the Screening of Cholangiocarcinoma Using Plasma Bile Acids Profiles. Diagnostics 2020, 10, 551. [Google Scholar] [CrossRef] [PubMed]
- Jamnongkan, W.; Lebrilla, C.B.; Barboza, M.; Techasen, A.; Loilome, W.; Sithithaworn, P.; Khuntikeo, N.; Pairojkul, C.; Chamadol, N.; Thanan, R.; et al. Discovery of Serotransferrin Glycoforms: Novel Markers for Diagnosis of Liver Periductal Fibrosis and Prediction of Cholangiocarcinoma. Biomolecules 2019, 9, 518. [Google Scholar] [CrossRef]


| Variables | Normal | Non-CCA | CCA | |||
|---|---|---|---|---|---|---|
| HCC | CA Gallbladder | CA Pancreas | Liver Metastasis | |||
| Total (n) | 40 | 23 | 7 | 5 | 5 | 40 |
| Male: Female | 7:33 | 19:4 | 1:6 | 3:2 | 3:2 | 27:13 |
| Age (years) | 60 (42–84) | 54 (28–76) | 61 (32–76) | 56 (47–73) | 61 (45–78) | 62 (39–82) |
| Subtype | ||||||
| iCCA | - | - | - | - | - | 27 |
| pCCA | - | - | - | - | - | 12 |
| dCCA | - | - | - | - | - | 1 |
| CA19-9 (U/mL) | 8.2 | 12.6 | 4 | 9.2 | 7.4 | 351.2 |
| (2–29) | (0.6–1000) | (0.6–168) | (0.6–555) | (0.6–1000) | (0.6–1000) | |
| CA19-9 > 37 U/mL (%) | 0/40 | 1/23 | 2/7 | 2/5 | 2/5 | 28/40 |
| (0%) | (4%) | (29%) | (40%) | (40%) | (70%) | |
| Variables | S100A9 (ng/mL) | MUC5AC (ng/mL) | Angiopoietin-2 (pg/mL) | TGF-β1 (ng/mL) | CA19-9 (U/mL) | ||||||||||
|---|---|---|---|---|---|---|---|---|---|---|---|---|---|---|---|
| OR a | Mean ± S.D. (n) | p Value | ORa | Mean ± S.D. (n) | p Value | OR a | Mean ± S.D. (n) | p Value | OR a | Mean ± S.D. (n) | p Value | OR a | Mean ± S.D. (n) | p Value | |
| Age (Year) | |||||||||||||||
| <61 | - | 381.95 ± 231 (n = 18) | 0.807 | - | 144.62 ± 108 (n = 18) | 0.17 | - | 2211.14 ± 1320 (n = 18) | 0.634 | - | 41.62 ± 16 (n = 27) | 0.836 | - | 501.67 ± 458 (n = 18) | 0.946 |
| ≥61 | 1.042 | 397.19 ± 257 (n = 22) | 0.441 | 116.12 ± 121 (n = 22) | 1.667 | 2323.84 ± 2086 (n = 22) | 0.974 | 40.74 ± 16 (n = 29) | 0.571 | 455.28 ± 433 (n = 22) | |||||
| Gender | |||||||||||||||
| Female | - | 315.75 ± 178 (n = 13) | 0.22 | - | 97.16 ± 56 (n = 13) | 0.479 | - | 2042.81 ± 679 (n = 13) | 0.87 | - | 41.64 ± 15 (n = 18) | 0.88 | - | 357.23 ± 393 (n = 13) | 0.549 |
| Male | 1.486 | 426.24 ± 264 (n = 27) | 1.256 | 144.25 ± 133 (n = 27) | 0.686 | 2384.02 ± 2099 (n = 27) | 0.618 | 40.94 ± 32 (n = 38) | 3.59 | 533.41 ± 456 (n = 27) | |||||
| Histological types | |||||||||||||||
| Non-Papillary | - | 396.62 ± 261 (n = 26) | 1 | - | 128.11 ± 119 (n = 26) | 0.681 | - | 2457.98 ± 2084 (n = 26) | 0.66 | - | 39.08 ± 15 (n = 33) | 0.24 | - | 472.40 ± 435 (n = 26) | 0.967 |
| Papillary | 2.133 | 378.66 ± 213 (n = 14) | 1 | 130.50 ± 111 (n = 14) | 0.758 | 1929.81 ± 878 (n = 14) | 1.146 | 44.16 ± 16 (n = 23) | 1.023 | 483.13 ± 463 (n = 14) | |||||
| Recurrence | |||||||||||||||
| No | - | 382.94 ± 248 (n = 23) | 0.795 | - | 140.03 ± 133 (n = 23) | 0.662 | - | 2294.07 ± 1187 (n = 23) | 0.194 | - | 39.54 ± 13 (n = 34) | 0.342 | - | 494.04 ± 446 (n = 23) | 0.935 |
| Yes | 1.75 | 400.33 ± 243 (n = 17) | 0.952 | 113.94 ± 86 (n = 17) | 0.709 | 2244.78 ± 2374 (n = 17) | 1.382 | 43.68 ± 19 (n = 22) | 0.91 | 451.99 ± 443 (n = 17) | |||||
| TNM stages | |||||||||||||||
| I, II | - | 311.73 ± 173 (n = 9) | 0.377 | - | 104.59 ± 33 (n = 9) | 0.771 | - | 1453.78 ± 820 (n = 9) | 0.020 * | - | 32.65 ± 9 (n = 11) | 0.045 * | - | 507.11 ± 434 (n = 9) | 0.924 |
| III, IV | 1.029 | 413.15 ± 258 (n = 31) | 1.667 | 136.02 ± 129 (n = 31) | 4.846 ** | 2510.10 ± 1897 (n = 31) | 5.333 ** | 43.25 ± 16 (n = 45) | 0.505 | 467.17 ± 447 (n = 31) | |||||
| Metastasis | |||||||||||||||
| No | - | 361.12 ± 251 (n = 17) | 0.436 | - | 96.25 ± 34 (n = 17) | 0.404 | - | 2262.01 ± 2389 (n = 17) | 0.268 | - | 35.30 ± 15 (n = 22) | 0.024 * | - | 462.92 ± 451 (n = 17) | 0.892 |
| Yes | 1.31 | 411.93 ± 240 (n = 23) | 1.857 | 153.11 ± 145 (n = 23) | 1.857 | 2281.34 ± 1164 (n = 23) | 3.467 ** | 44.96 ± 15 (n = 34) | 0.723 | 485.93 ± 440 (n = 23) | |||||
| Lymph node metastasis | |||||||||||||||
| No | - | 388.94 ± 271 (n = 18) | 0.765 | - | 99.57 ± 36 (n = 18) | 0.644 | - | 2218.06 ± 2325 (n = 18) | 0.201 | - | 36.79 ± 15 (n = 25) | 0.062 | - | 437.24 ± 451 (n = 18) | 0.545 |
| Yes | 1.042 | 391.47 ± 224 (n = 22) | 1.5 | 152.98 ± 149 (n = 22) | 2.27 | 2318.18 ± 1178 (n = 22) | 3.111 ** | 44.69 ± 16 (n = 31) | 0.865 | 507.99 ± 438 (n = 22) | |||||
| Distant metastasis | |||||||||||||||
| No | - | 387.51 ± 239 (n = 34) | 0.88 | - | 124.49 ± 117 (n = 34) | 0.225 | - | 2236.04 ± 1816 (n = 34) | 0.544 | - | 40.85 ± 17 (n = 47) | 0.739 | - | 509.19 ± 444 (n = 34) | 0.197 |
| Yes | 1.267 | 406.31 ± 290 (n = 6) | 1.2 | 154.20 ± 108 (n = 6) | 2.25 | 2483.27 ± 1550 (n = 6) | 2.827 | 42.79 ± 9 (n = 9) | 0.225 | 288.93 ± 392 (n = 6) | |||||
| Group Comparisons | Biomarkers | Cut-Off | AUC (95% CI) | YI | SN | SP | LR | p Value |
|---|---|---|---|---|---|---|---|---|
| Normal vs. CCA | S100A9 (ng/mL) | >197.9 | 0.888 (0.818–0.958) | 0.7 | 77.5 | 87.5 | 6.2 | <0.0001 |
| MUC5AC (ng/mL) | >104.6 | 0.639 (0.517–0.762) | 0.3 | 52.5 | 77.5 | 2.3 | 0.032 | |
| TGF-β1 (ng/mL) | >33.42 | 0.649 (0.535–0.762) | 0.3 | 76.8 | 57.5 | 1.8 | 0.013 | |
| Angiopoietin-2 (pg/mL) | >2422 | 0.567 (0.439–0.695) | 0.2 | 35 | 87.5 | 2.8 | 0.303 | |
| CA19-9 (U/mL) | >23.34 | 0.768 (0.644–0.893) | 0.7 | 72.5 | 97.5 | 29 | <0.0001 | |
| Normal vs. Non-CCA | S100A9 (ng/mL) | >197.9 | 0.832 (0.735–0.928) | 0.6 | 72.5 | 87.5 | 5.8 | <0.0001 |
| MUC5AC (ng/mL) | >128 | 0.545 (0.417–0.672) | 0.2 | 32.5 | 82.5 | 1.9 | 0.492 | |
| TGF-β1 (ng/mL) | >22.81 | 0.618 (0.495–0.741) | 0.2 | 95 | 27.5 | 1.3 | 0.068 | |
| Angiopoietin-2 (pg/mL) | <1312 | 0.530 (0.398–0.662) | 0.3 | 42.5 | 82.5 | 2.4 | 0.644 | |
| CA19-9 (U/mL) | >23.50 | 0.573 (0.442–0.703) | 0.3 | 32.5 | 97.5 | 13 | 0.264 | |
| Non-CCA vs. CCA | S100A9 (ng/mL) | >87.11 | 0.525 (0.398–0.653) | 0.1 | 97.5 | 15 | 1.1 | 0.697 |
| MUC5AC (ng/mL) | >90.51 | 0.581 (0.454–0.708) | 0.3 | 65 | 60 | 1.6 | 0.213 | |
| TGF-β1 (ng/mL) | >39.98 | 0.551 (0.432–0.671) | 0.2 | 62.5 | 60 | 1.6 | 0.391 | |
| Angiopoietin-2 (pg/mL) | >1008 | 0.581 (0.455–0.708) | 0.2 | 90 | 32.5 | 1.3 | 0.211 | |
| CA19-9 (U/mL) | >37.39 | 0.716 (0.595–0.837) | 0.5 | 70 | 82.5 | 4 | 0.0009 |
| Comparative Diagnosis | Biomarkers | Crude | p Value | Adjusted | p Value |
|---|---|---|---|---|---|
| OR (95% CI) | OR * (95% CI) | ||||
| Normal vs. CCA | S100A9 < 197.9 vs. ≥ 197.9 ng/mL | 24.11 (7.30–79.68) | <0.0001 | 22.50 (5.77–87.82) | <0.0001 |
| MUC5AC < 104.6 vs. ≥ 104.6 ng/mL | 3.81 (1.45–10.02) | 0.007 | 3.78 (1.23–11.57) | 0.02 | |
| TGF-β1 < 33.42 vs. ≥ 33.42 ng/mL | 3.16 (1.25–7.93) | 0.015 | 2.84 (0.97–8.28) | 0.055 | |
| Angiopoietin-2 < 2422 vs. ≥ 2422 pg/mL | 3.77 (1.21–11.79) | 0.023 | 5.17 (1.35–19.78) | 0.016 | |
| CA19-9 < 23.34 vs. ≥ 23.34 U/mL | 102.82 (12.56–841.96) | <0.0001 | 129.44 (12.90–1295.60) | <0.0001 | |
| Normal vs. Non-CCA | S100A9 < 197.9 vs. ≥ 197.9 ng/mL | 18.46 (5.75–59.23) | <0.0001 | 30.95 (6.79–141.05) | <0.0001 |
| MUC5AC < 128 vs. ≥ 128 ng/mL | 2.27 (0.79–6.49) | 0.126 | 2.08 (0.63–6.88) | 0.23 | |
| TGF-β1 < 22.81 vs. ≥ 22.81 ng/mL | 7.21 (1.48–35.06) | 0.014 | 4.98 (0.91–27.31) | 0.064 | |
| Angiopoietin-2 > 1312 vs. ≤ 1312 pg/mL | 3.48 (1.25–9.75) | 0.017 | 1.30 (0.36–4.72) | 0.694 | |
| CA19-9 < 23.50 vs. ≥ 23.50 U/mL | 18.78 (2.32–152.16) | 0.006 | 40.13 (4.17–385.64) | 0.001 | |
| Non-CCA vs. CCA | S100A9 < 87.11 vs. ≥ 87.11 ng/mL | 6.88 (0.79–60.06) | 0.081 | 8.04 (0.87–74.47) | 0.066 |
| MUC5AC < 90.51 vs. ≥ 90.51 ng/mL | 2.79 (1.13–6.90) | 0.027 | 3.26 (1.25–8.52) | 0.016 | |
| TGF-β1 < 39.98 vs. ≥ 39.98 ng/mL | 1.83 (0.75–4.45) | 1.81 | 0.143 (0.79–5.07) | 2.004 | |
| Angiopoietin-2 < 1008 vs. ≥ 1008 pg/mL | 4.33 (1.27–14.78) | 0.019 | 4.78 (1.35–16.96) | 0.015 | |
| CA19-9 < 37.39 vs. ≥ 37.39 U/mL | 11 (3.81–31.73) | <0.0001 | 12.7 (4.00–40.31) | <0.0001 |
| Parameter | DT I (Normal vs. CCA) | DT II (Normal vs. Non-CCA) | DT III (Non-CCA vs. CCA) |
|---|---|---|---|
| max_depth | 9 | 9 | 3 |
| max_feature | 4 | 1 | 2 |
| min_samples_leaf | 3 | 3 | 3 |
| min_samples_split | 10 | 14 | 10 |
| criterion | ‘gini’ | ‘gini’ | ‘gini’ |
| Comparative Diagnosis | Single Biomarkers and DTs | Classification Performance | |||||
|---|---|---|---|---|---|---|---|
| SN | SP | YI | PPV | NPV | ACC | ||
| Normal vs. CCA | S100A9 | 86 | 80 | 0.7 | 86 | 80 | 83 |
| MUC5AC | 43 | 90 | 0.3 | 86 | 53 | 63 | |
| TGF-β1 | 71 | 60 | 0.3 | 71 | 60 | 67 | |
| Angiopoietin-2 | 14 | 100 | 0.1 | 100 | 45 | 50 | |
| CA19-9 | 71 | 100 | 0.7 | 100 | 71 | 83 | |
| DT I: CA19-9 and S100A9 | 93 | 80 | 0.7 | 87 | 89 | 88 | |
| Normal vs. Non-CCA | S100A9 | 67 | 83 | 0.5 | 80 | 71 | 75 |
| MUC5AC | 33 | 67 | 0 | 50 | 50 | 50 | |
| TGF-β1 | 100 | 17 | 0.2 | 55 | 100 | 58 | |
| Angiopoietin-2 | 50 | 83 | 0.3 | 75 | 63 | 67 | |
| CA19-9 | 33 | 92 | 0.3 | 80 | 58 | 63 | |
| DT II: angiopoietin-2, TGF-β1, and S100A9 | 92 | 67 | 0.6 | 73 | 89 | 79 | |
| Non-CCA vs. CCA | S100A9 | 100 | 23 | 0.2 | 52 | 100 | 58 |
| MUC5AC | 91 | 54 | 0.5 | 63 | 88 | 71 | |
| TGF-β1 | 36 | 54 | 0 | 40 | 50 | 46 | |
| Angiopoietin-2 | 82 | 62 | 0.4 | 64 | 80 | 71 | |
| CA19-9 | 73 | 100 | 0.7 | 100 | 81 | 88 | |
| DT III: TGF-β1, CA19-9, angiopoietin-2, and MUC5AC | 82 | 92 | 0.7 | 90 | 86 | 88 | |
Publisher’s Note: MDPI stays neutral with regard to jurisdictional claims in published maps and institutional affiliations. |
© 2021 by the authors. Licensee MDPI, Basel, Switzerland. This article is an open access article distributed under the terms and conditions of the Creative Commons Attribution (CC BY) license (http://creativecommons.org/licenses/by/4.0/).
Share and Cite
Kimawaha, P.; Jusakul, A.; Junsawang, P.; Thanan, R.; Titapun, A.; Khuntikeo, N.; Techasen, A. Establishment of a Potential Serum Biomarker Panel for the Diagnosis and Prognosis of Cholangiocarcinoma Using Decision Tree Algorithms. Diagnostics 2021, 11, 589. https://doi.org/10.3390/diagnostics11040589
Kimawaha P, Jusakul A, Junsawang P, Thanan R, Titapun A, Khuntikeo N, Techasen A. Establishment of a Potential Serum Biomarker Panel for the Diagnosis and Prognosis of Cholangiocarcinoma Using Decision Tree Algorithms. Diagnostics. 2021; 11(4):589. https://doi.org/10.3390/diagnostics11040589
Chicago/Turabian StyleKimawaha, Phongsaran, Apinya Jusakul, Prem Junsawang, Raynoo Thanan, Attapol Titapun, Narong Khuntikeo, and Anchalee Techasen. 2021. "Establishment of a Potential Serum Biomarker Panel for the Diagnosis and Prognosis of Cholangiocarcinoma Using Decision Tree Algorithms" Diagnostics 11, no. 4: 589. https://doi.org/10.3390/diagnostics11040589