Review

Field Performances of Rapid Diagnostic Tests Detecting Human Plasmodium Species: A Systematic Review and Meta-Analysis in India, 1990–2020

by
Loick Pradel Kojom Foko
1,2,
Veena Pande
2 and
Vineeta Singh
1,*
1
Cell Biology Laboratory and Malaria Parasite Bank, ICMR-National Institute of Malaria Research, Sector 8, Dwarka, New Delhi 110077, India
2
Department of Biotechnology, Kumaun University, Bhimtal, Uttarakhand 263001, India
*
Author to whom correspondence should be addressed.
Diagnostics 2021, 11(4), 590; https://doi.org/10.3390/diagnostics11040590
Submission received: 3 March 2021 / Revised: 19 March 2021 / Accepted: 21 March 2021 / Published: 25 March 2021
(This article belongs to the Section Diagnostic Microbiology and Infectious Disease)

Abstract

:
Rapid diagnostic tests (RDTs) have become a mainstay of malaria diagnosis in endemic countries since their implementation in the 1990s. We conducted a 30-year systematic review and meta-analysis on malaria RDTs performance in India. Outcomes of interest were sensitivity (Se), specificity (Sp), positive/negative likelihood ratio (PLR/NLR), and diagnostic odd ratio (DOR). Among the 75 studies included, most of the studies were cross-sectional (65.3%), hospital-based (77.3%), and targeted febrile patients (90.6%). Nearly half of RDTs were designed for detecting Plasmodium falciparum only (47.5%) while the rest were for P. falciparum and P. vivax (11.9%), and P. falciparum/Pan-Plasmodium except for P. knowlesi (32.3%). When compared to light microscopy (gold standard), pooled estimates of performances were: Se = 97.0%, Sp = 96.0%, PLR = 22.4, NLR = 0.02 and DOR = 1080. In comparison to polymerase chain reaction, the RDTs showed Se = 89.0% and Sp = 99.0%. Performance outcomes (Se and Sp) were similar for RDT targeting P. falciparum only, but decreased for mixed and non-falciparum infections. Performances of malaria RDTs are still high India. However, there is a need for developing RDTs with regard to targeting minor malarial species, individuals carrying only mature gametocytes, and pfhrp2-deleted parasites.

Graphical Abstract

1. Introduction

Plasmodium falciparum and Plasmodium vivax are the main species contributing to the malaria burden worldwide. These protozoan parasites are transmitted to humans through infecting bites of female Anopheles mosquitoes [1]. Malaria is an important public health concern, with ~229 million of cases and 409,000 deaths reported in 2019 globally. In the current context of malaria control and elimination, many countries are scaling up strategies to achieve elimination objectives stated by the World Health Organisation (WHO) [2]. However, these countries are facing enormous challenges, especially in the diagnosis area.
Rapid diagnostic tests (RDTs) are one of the mainstays for the detection of malaria parasites in endemic regions. RDTs rely on the immunochromatographic detection of the parasites through the targeting of either malarial antigens (Ag) or human antibodies to parasite Ag [3]. Actually, a large majority of RDTs are designed for the detection of three malarial antigens, viz., histidine rich protein 2 (HRP2), lactate dehydrogenase (LDH), and aldolase. The HRP2 protein is only yielded by P. falciparum, while LDH and aldolase are produced by all Plasmodium species [4].
Historically, the diagnosis of malaria was made using light microscopy (LM), which is still used in epidemiological surveys and clinical diagnosis [5]. Unfortunately, LM has serious limitations that hinder its utilization in endemic areas, especially those with limited resources. These methods (i) request good quality material and reagents for maintaining the quality which is challenging in field areas; (ii) are time-consuming; (iii) require highly skilled and experienced microscopists; (iv) require a continuous electricity supply; and (v) include parasite losses during the washing steps, thereby reducing the chances of detecting infections, particularly low density infections [6,7]. In the early 1990s, RDTs were developed to overcome the abovementioned LM-related drawbacks. The RDTs are easy to use, rapid (results obtained within 15–20 minutes), require few skills and no electricity [4].
India is the main malaria-burdened South East Asian (SEA) country, accounting for ~4% of disease cases and 2% of deaths in 2018 [8]. At the SEA level, India contributes to 80% morbidity and 60% mortality [8]. The country is also a big consumer of RDTs, which are an essential part of the national malaria control strategy. P. falciparum and P. vivax are the dominant species in India, with a prevalence ratio of 1:1 at the national level, but with substantial variation between regions [9,10].
In the present study, we used a systematic review and meta-analysis (SR-MA) to evaluate the field performances of malaria RDTs in India. This study is particularly important in a worrying context due to the worldwide emergence of parasites with deletions in the pfhrp2 gene that encodes the PfHRP2 protein [11,12]. As a consequence, PfHRP2-based RDTs can miss parasites lacking the pfhrp2 gene, thereby hindering the early diagnosis of malaria patients and increasing the risk of severe complications and deaths. To the best of the knowledge of the authors, this study is the first SR-MA addressing such a topic in the country.

2. Materials and Methods

The present study adhered to the Preferred Reporting Items for Systematic Reviews and Meta-Analyses (PRISMA) [13]. The PRISMA flow diagram and checklist were used to describe the study selection process and the characteristics of the SR-MA, respectively (Figure S1 and Table S2, Supplementary Materials).

2.1. Ethical Statement

The obtaining of an ethical clearance was not requested, as the data used in this study are retrieved from publicly available previous studies.

2.2. Electronic Databases

Between 17 August 2020 and 17 October 2020, four electronic databases (PubMed, Wiley Library, ResearchGate and ScienceDirect) and two search engines (Google and Google scholar) were used to search potentially relevant studies.

2.3. Search Strategy

Main keywords used for the search in each of the databases included: “India”, “rapid malaria antigen”, “antigen detection test”, “rapid diagnostic test”, immunochromatographic test”, “performance”, “accuracy”, “usefulness”, and the different Indian regions (Tamil Nadu, Chandigarh, Andaman and Nicobar, Assam, Andhra Pradesh, Bihar, Chhattisgarh, Daman and Diu, Delhi, Goa, Gujarat, Himachal Pradesh, Jammu and Kashmir, Jharkhand, Karnataka, Kerala, Kolkata, Lakshadweep, Maharashtra, Manipur, Nagaland, Mizoram, Madhya Pradesh, Meghalaya, Odisha, Puducherry, Rajasthan, Sikkim, Tripura, Uttarakhand, Uttar Pradesh, Punjab, Haryana and West Bengal). Boolean operators (AND, OR, XOR), truncation element (*), and filter options in the different electronic databases were used to fine-tune the search.

2.4. Objectives

The objectives of this SR-MA were: (1) to delineate a state-of-the-art of studies on malaria RDT performances in India, (2) to determine the field performances of RDTs as compared to standard methods based on MA of included studies, and (3) to discuss the main causes of poor performances of RDTs, identify limitations, and propose solutions.

2.5. Eligibility Criteria

The studies included in the review were required (i) to be conducted in India, (ii) to be focused on the evaluation of RDT performances in the detection of malaria parasites in human blood, (iii) to be peer-reviewed and published, (iv) to be written in the English language, (v) to be published between January 1990 and September 2020 (the first RDTs have been implemented in malaria endemic areas in the early 1990s) [14,15], (vi) to use LM or molecular methods as “gold standard” method, (vii) to provide all primary data to construct 2 × 2 table of results (true positive-TP, true negative- TN, false positive-FP and false negative-FN), and (viii) the sum of TP + FN, and TN + FP are both ≥ 30 (this sample size is commonly accepted as sufficient to make a statistical analysis) [16]. Conversely, reviews, conference papers, news, and experiments studies were excluded from the study. The exhaustive list of reasons for exclusion is further presented in Figure 1 and Table S3.

2.6. Screening Strategy

Titles and abstracts of each publication were independently analysed. At this step, a large number of studies were directly excluded from the search. Only full texts of studies with an explicit title and/or informative abstract were retrieved. In case of the inability to retrieve the full text, the corresponding author was directly contacted by email. Papers were purchased in case of a negative reply or no reply at all from the corresponding author. The list of references of eligible studies were scrutinised to increase the chances of getting more relevant studies.

2.7. Data of Interest

Information of interest retrieved from each study are shown in Table 1.

2.8. Methodological Quality Assessment of Studies

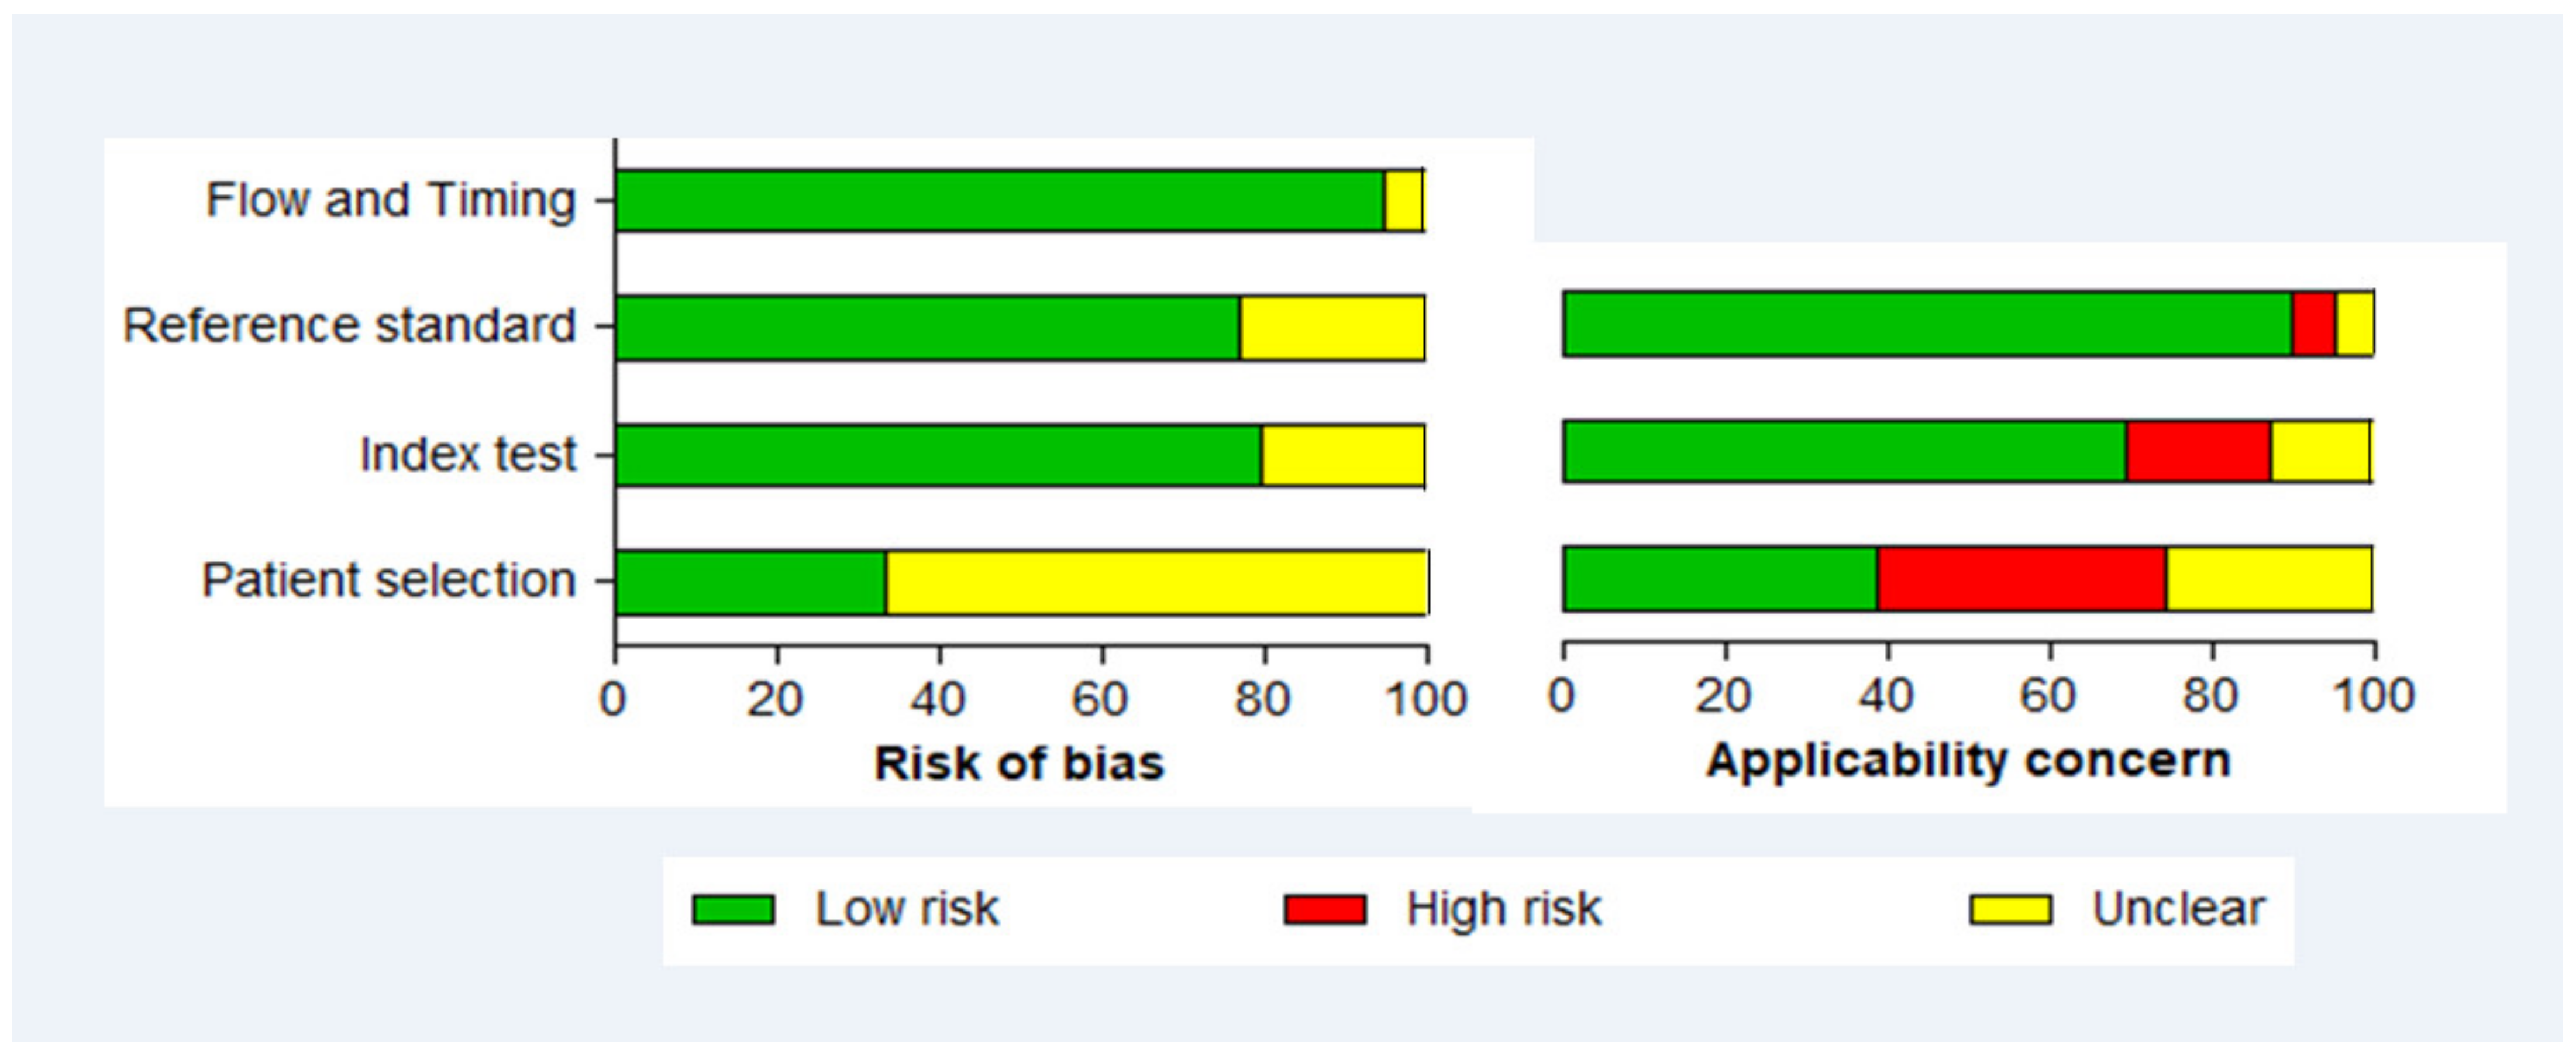
The quality of studies included in the SR was evaluated using The Joanna Briggs Institute Critical Appraisal tools for use in JBI Systematic Reviews Checklist for Diagnostic Test Accuracy Studies available at http://joannabriggs.org/assets/docs/critical-appraisal-tools/JBI_Critical_Appraisal-Checklist_for_Diagnostic_Test_Accuracy_Studies2017.pdf (Accessed on 15 November 2020) [17,18]. This tool is based on the recommendations of the quality assessment diagnostic accuracy studies-2 (QUADAS-2) group from the university of Bristol, UK. It consists of four domains: (1) individual selection, (2) index test, (3) reference test and (4) flow and timing [17]. These domains are used to evaluate the quality of each study based on two aspects, viz., the bias risk (domains 1–4) and applicability concern (domains 1–3) [17]. We have not computed an overall quality score for each study given the absence of consensus on its calculation and interpretation [19]. The quality assessment of the studies was independently performed by two reviewers and any disagreements were resolved through discussion and consensus.

2.9. Data Verification for Consistency

Data of interest for SR-MA were entered in an Excel spreadsheet (Microsoft Office 2016, USA). The external control of the Excel database was performed by two external reviewers. Again, this database was also checked for consistency by two additional persons. Discrepancies were solved through discussion between all authors.

2.10. Outcomes to Appraise Field Performances

Parameters of interest evaluated in the present SR-MA consisted in sensitivity (Se), specificity (Sp), negative and positive likelihood ratio (NLR and PLR) and the diagnostic odds ratio (DOR). These performance parameters are defined as follows:
Sensitivity is the probability of a person with the disease of interest having a positive test result [20]. In this review, it was the ability of the RDT to correctly identify malaria-infected individuals.
Specificity is the probability of a person without the disease of interest having a negative test result [20]. In this review, it meant the ability of the RDT to correctly identify malaria-uninfected individuals.
Positive (negative) likelihood ratio (P/NLR) indicates how much less likely it is to find a positive (negative) test result in individuals with malaria as compared with those without a malaria infection [21]. In this study, it was how much less likely it is to find a positive (negative) RDT result in malaria-infected individuals as compared with their uninfected counterparts. Likelihood ratio values range from 0 to infinity. If the PLR is greater than 1, the more likelihood of the test being positive. In contrast, if NLR is less than 1, there is less possibility of a negative result [21].
Diagnostic odds ratio (DOR) of a test is the ratio of the odds of positivity in individuals with the disease relative to the odds of positivity in the individuals without the disease. DOR values range from 0 to infinity. In practice, DOR values above 1 are indicative that the test is correctly discriminating. The larger the DOR value, the more accurate the test is [22].

2.11. Data Management

Software including the statistical package for social science v16 for Windows (SPSS, Inc., IL, Chicago, USA) and GraphPad Prism v5.03 (GraphPad, San Diego, USA) were used to perform descriptive statistics (percentage, confidence interval at 95% and mean) and were presented as tables or charts while JASP v0.12.1 (University of Amsterdam, Netherlands) and OpenMeta Analyst (http://www.cebm.brown.edu/openmeta/doc/openMA_help.html) (Accessed on 12 October 2020) were used to perform the MA of RDT performances [23,24].
A minimum of two studies was judged sufficient to perform an MA of the parameters of interest as recommended previously [25]. The Cochrane Q test and I2 statistics were used to appraise the level of heterogeneity between studies included in the MA. The type of model (random or fixed effects) was chosen based on the level heterogeneity. Random effect models were preferred when I2 was > 75% while fixed effect models were used when I2 < 25% [26,27]. Arcsine transformation was used to stabilise the variance between the included studies. The sources of heterogeneity between studies were searched using subgroup analysis while the leave-one-out method (sensitivity analysis) was used to evaluate the influence of each individual study on the pooled estimates of sensitivity, specificity, PLR, NLR, and DOR [28]. Variables tested for subgroup analysis included Indian area, type of RDT (Pan only, Pf and Pv, Pf only, and Pf/Pan), the malarial Ag (HRP2, LDH, aldolase), study population (children, adults, general population), and the staining solution used for LM (Giemsa, Leishman, and Jaswant Singh–Bhattacharji).
Forest plots were used to present the results of MA while funnel plots and Egger’s test were used to detect publication bias between studies [29]. Meta-regression analysis was used to identify factors influencing the performances of RDTs. A probability value of less than 0.05 was considered statistical significant.

3. Results

3.1. Selection Process Results

Titles and abstracts of studies retrieved from electronic databases were screened for eligibility and 4914 of them were excluded as per the exclusion criteria (Figure 1).
Full texts of 58 studies were retrieved and scrutinized. Eighteen supplementary studies were identified based on the analysis of reference list of these 58 studies; thus, 76 studies were evaluated for eligibility (Figure 1). Of the 76 articles, one study was excluded, as performances of RDTs were evaluated using a bayesian statistics-based mathematical model.
The list of studies excluded from the review, along with the reasons for exclusion, is presented in Table S3. Finally, 75 articles were included in the qualitative synthesis (SR), among them 40 were eligible for the quantitative synthesis (MA).

3.2. Geographical Distribution of the Included Studies

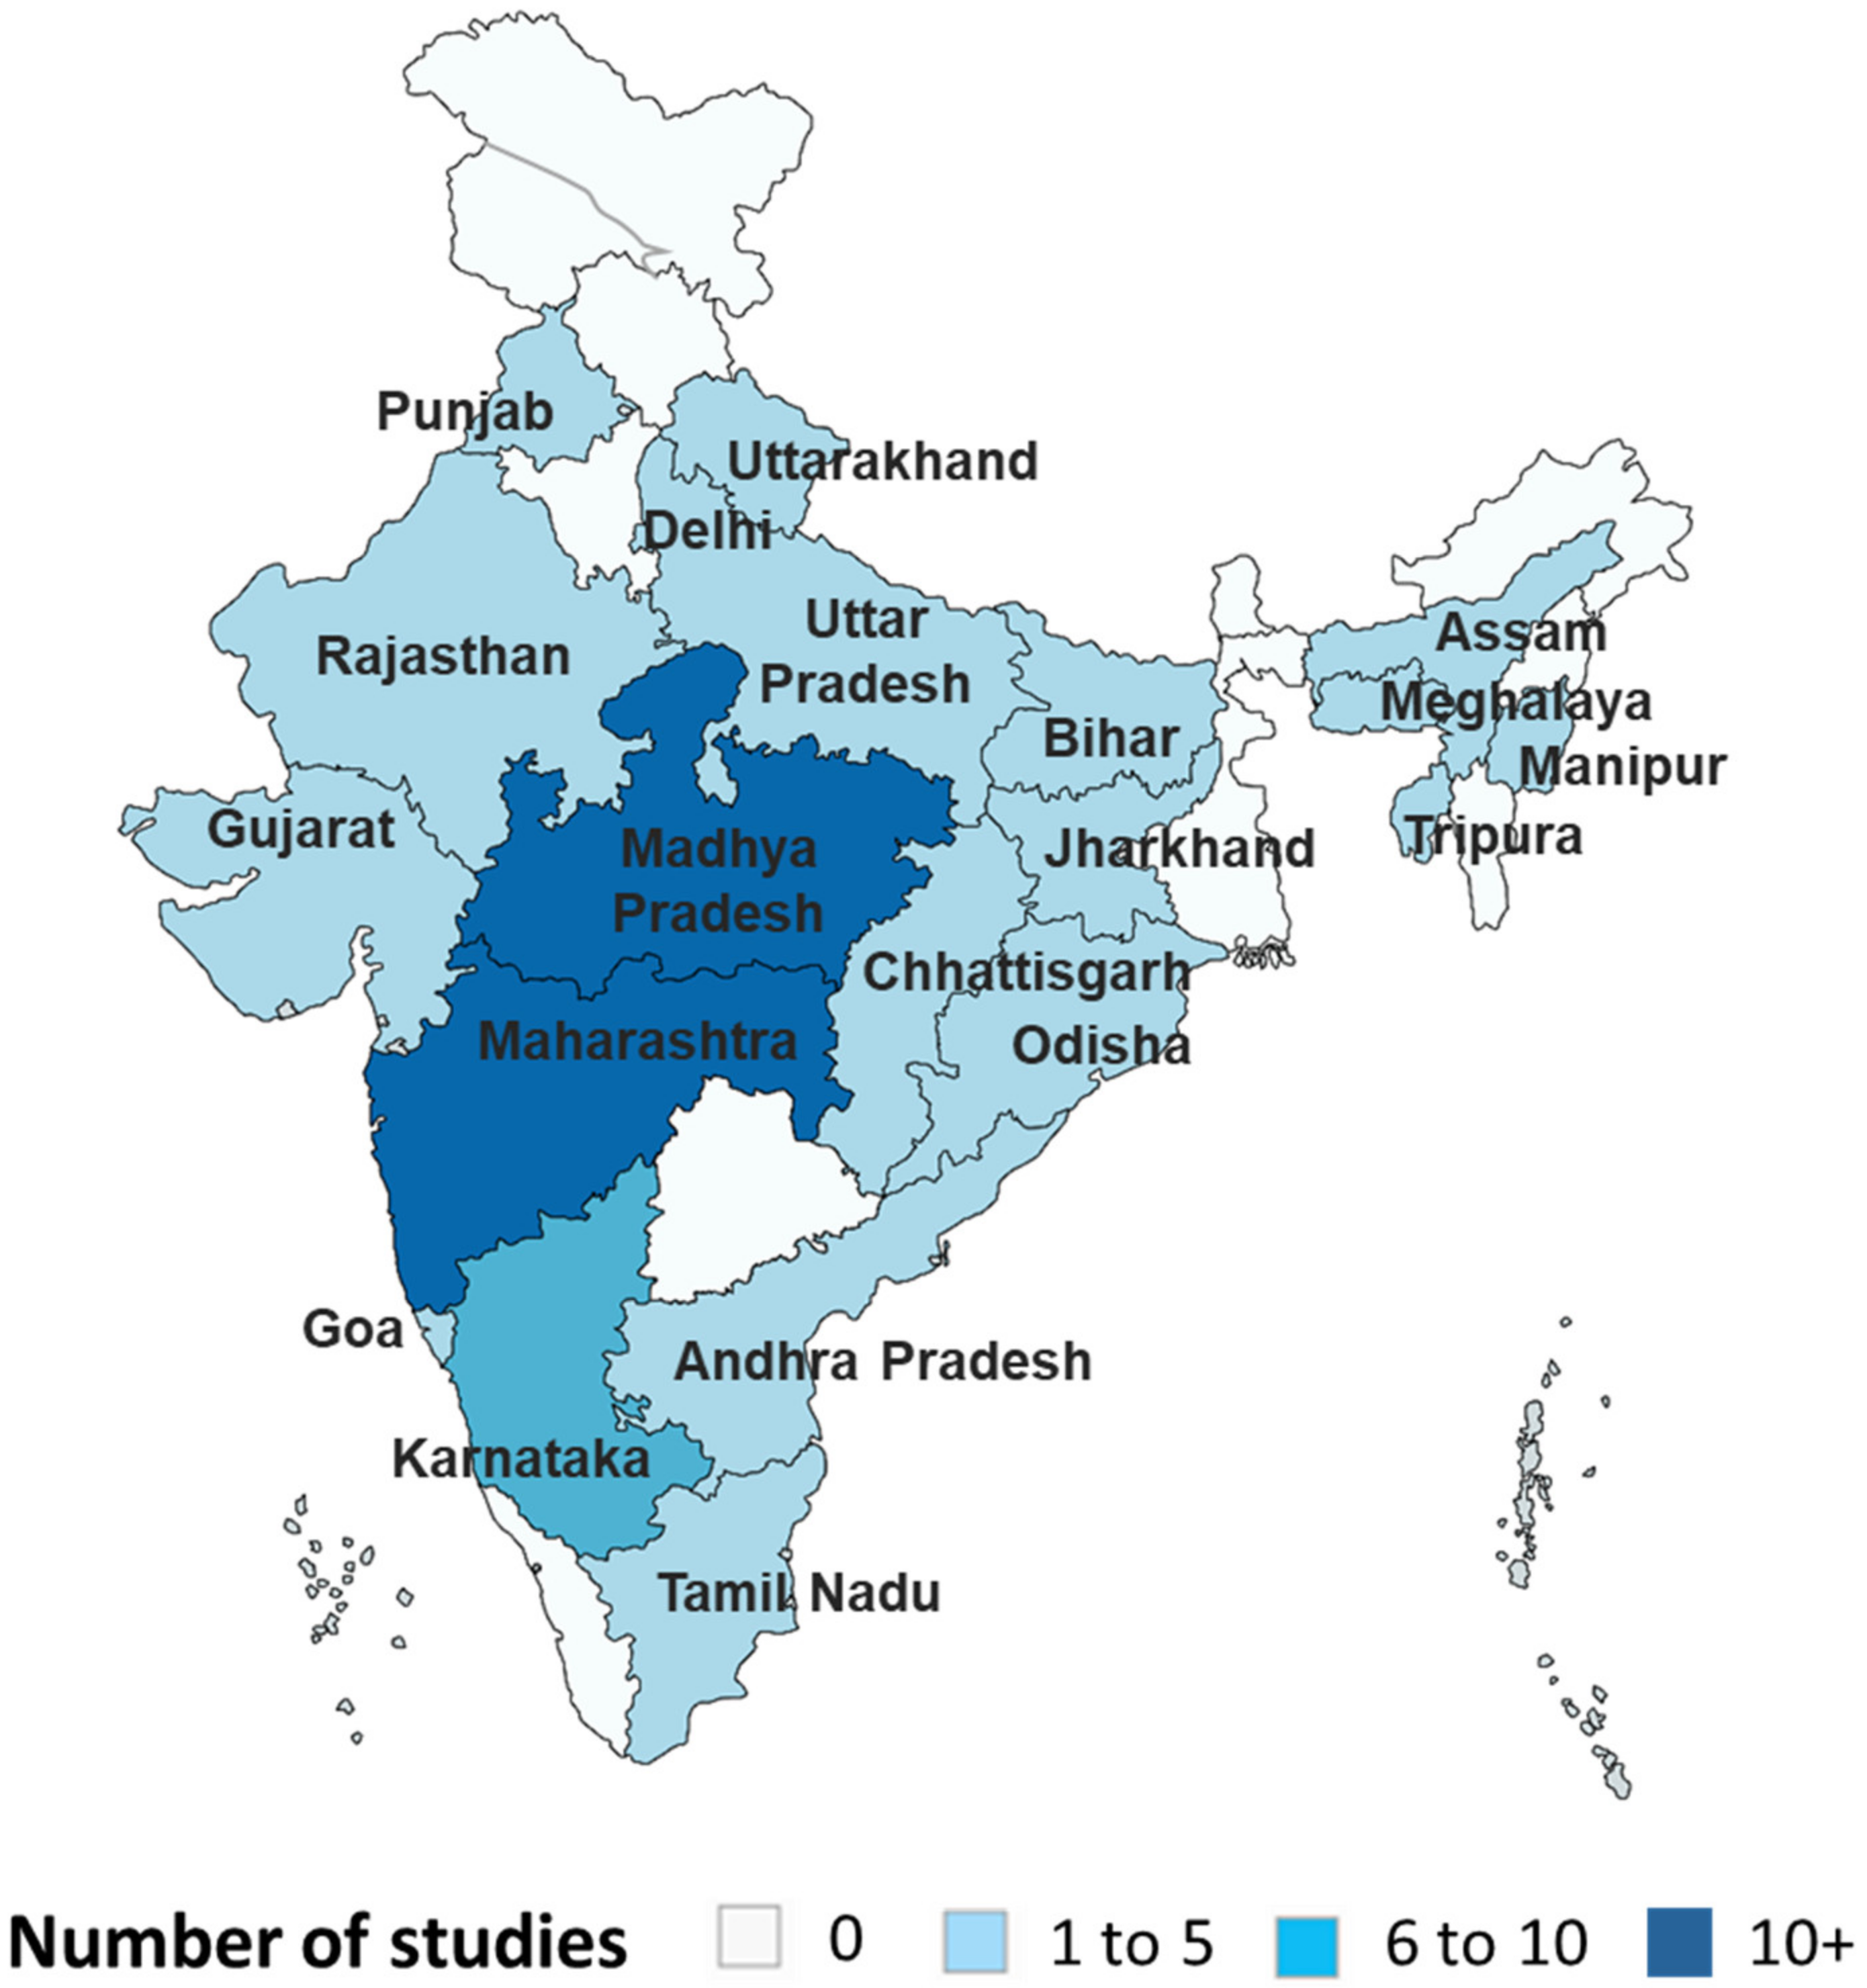
There was a large geographical distribution of the included studies with 21 states and union territories with at least one study conducted in the included region (Figure 2). There was a high disparity in the number of studies according to the area with most of studies from three states, viz., Madhya Pradesh (16 studies), Maharashtra (11 studies) and Karnataka (7 studies). Most of the studies were from one state while the remaining two studies included several states, one in three (Assam, Meghalaya, and Manipur) and the other in six states (Assam, Bihar, Chhattisgarh, Maharashtra, Andhra Pradesh, and Tamil Nadu) (Table S4).

3.3. Characteristics of the Included Studies

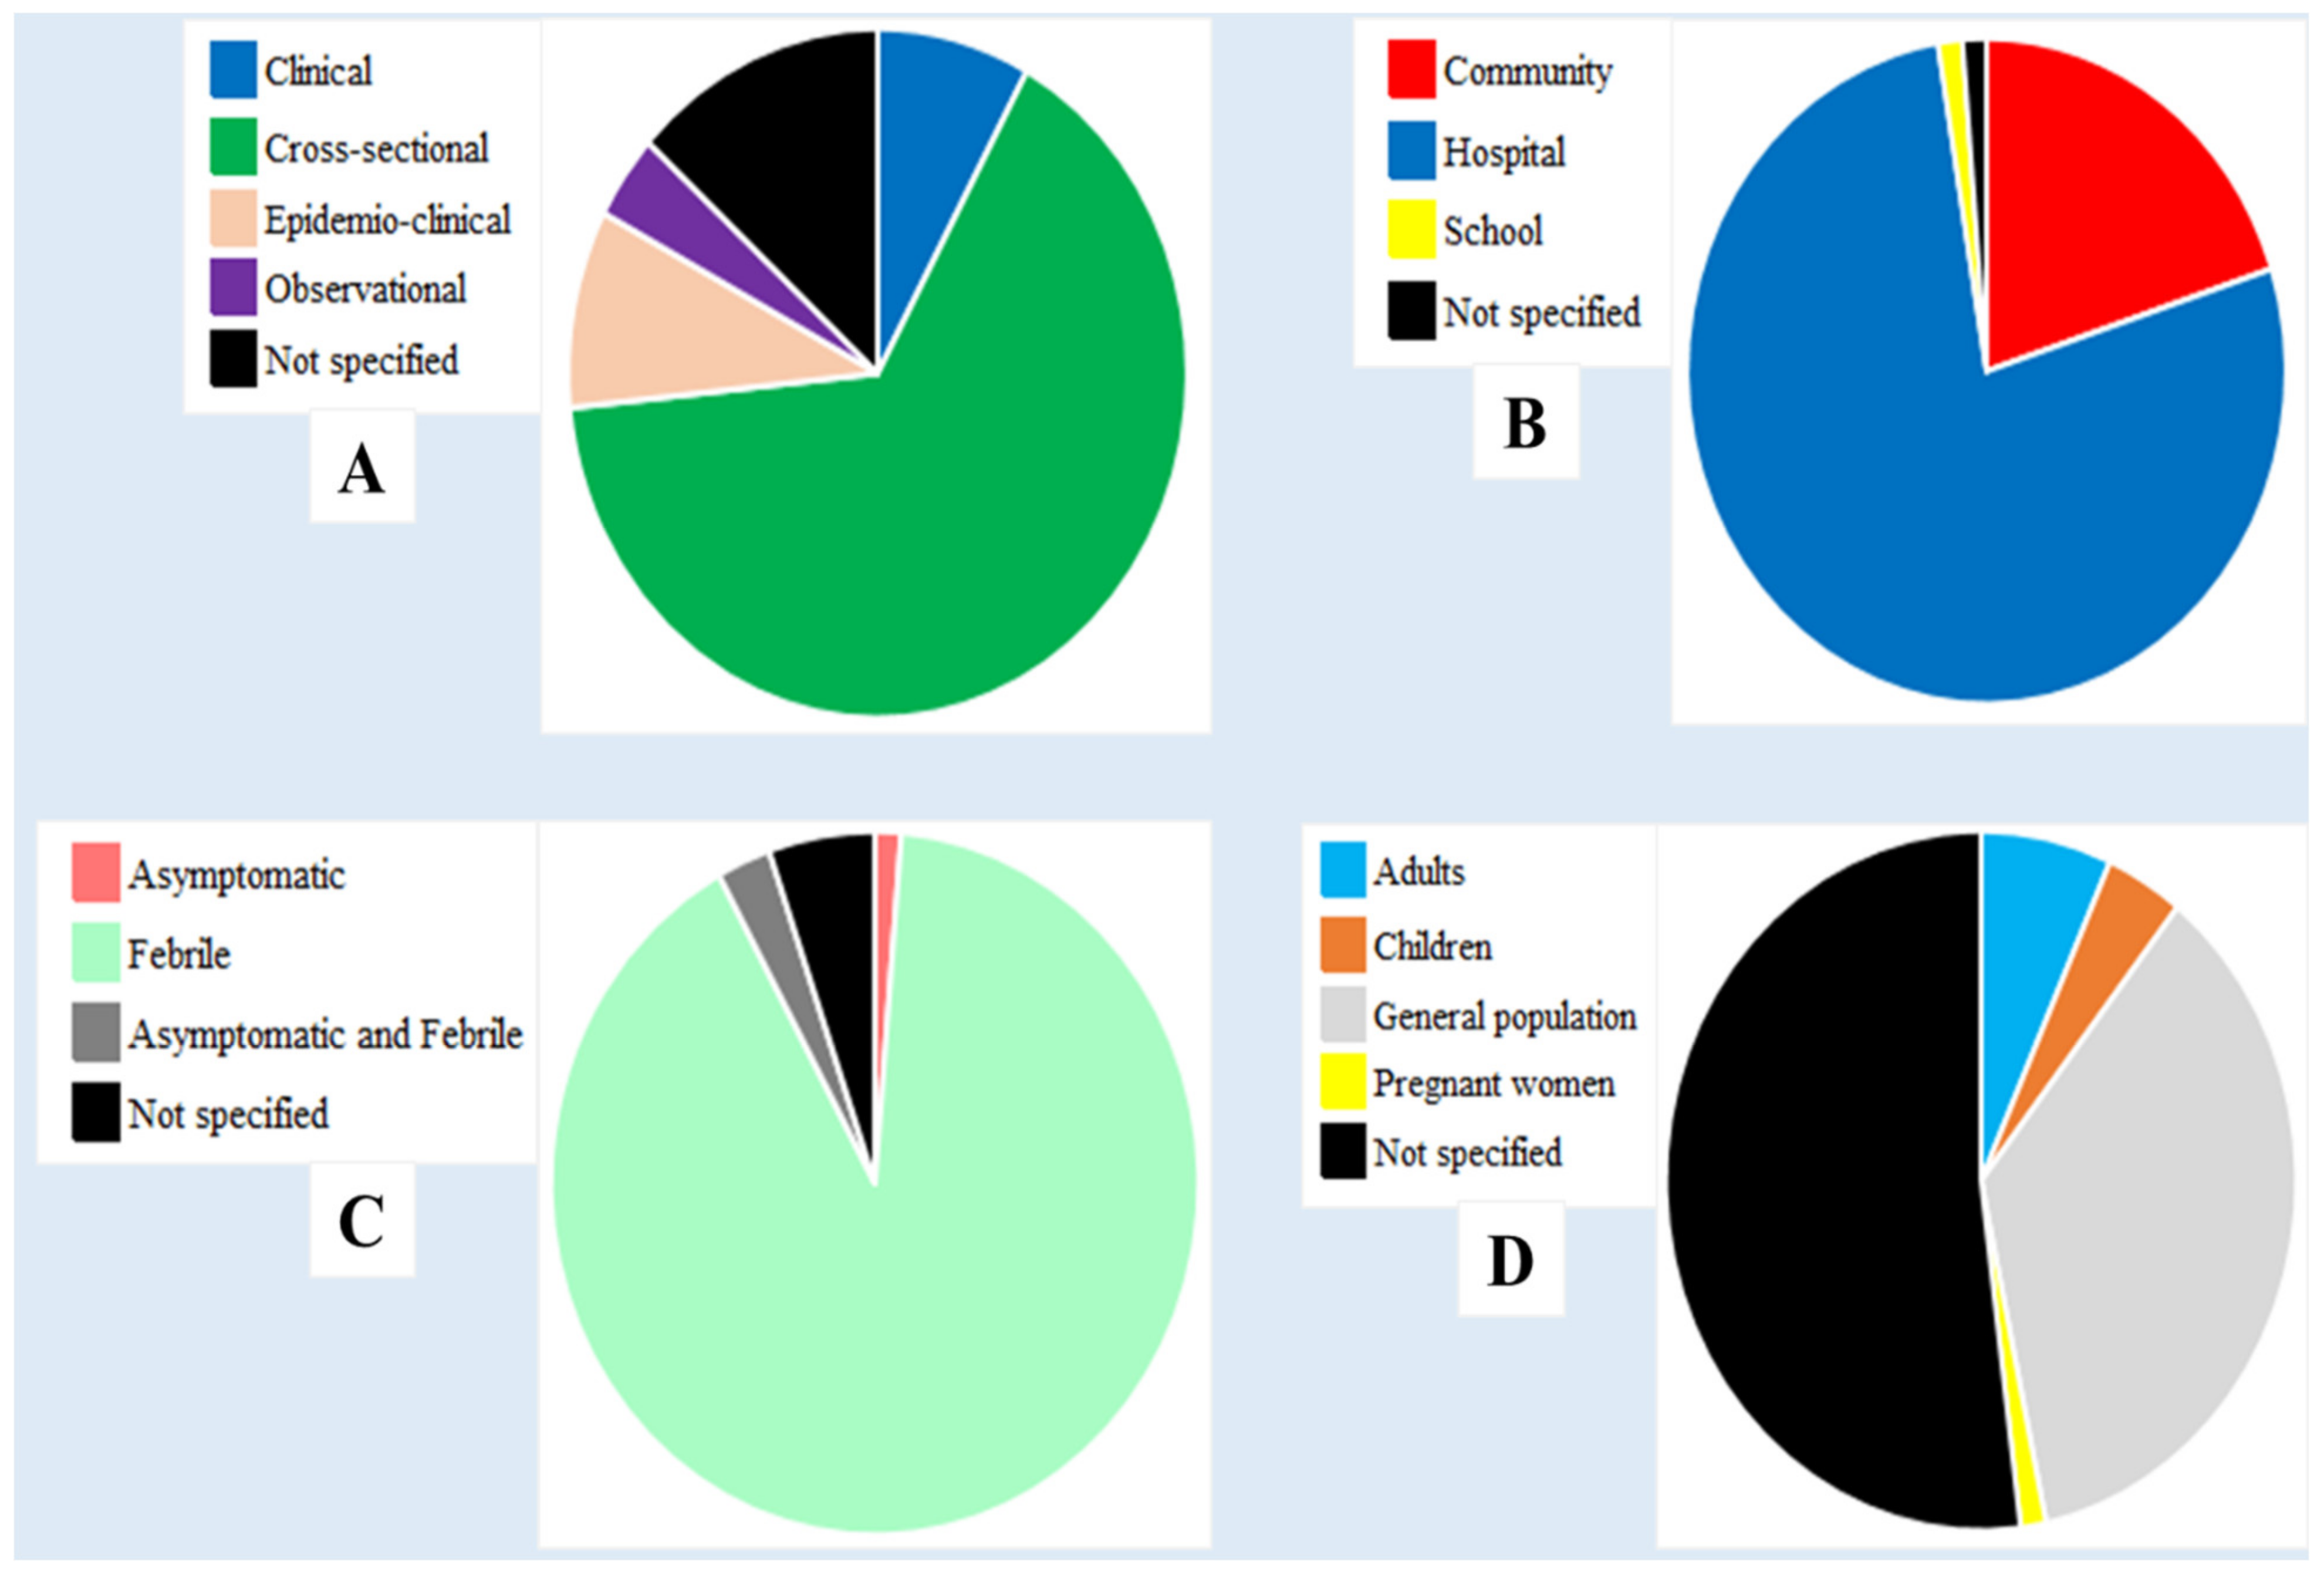
The majority of the studies were cross-sectional (65.3%, n = 49), hospital-based (77.3%, n = 58), and recruited febrile patients (90.6%, n = 68) (Figure 3A,B). One study evaluated the performances of RDTs in asymptomatic patients only. Another study evaluated RDT performances in a population comprised of febrile and asymptomatic patients (Figure 3C, Table S4). Nearly one-third (30.1%, n = 22) of studies focused on the RDT performances in the general population while pregnant women and children were targeted by one and two studies, respectively (Figure 3D). Three studies evaluated RDT performances in patients presenting with severe malaria-suggesting signs/complications (Table S4).

3.4. Gold Standard Used to Evaluate the Performances of RDTs

A large proportion of studies (98.7%, n = 74) have used LM as a gold standard to evaluate the performances of RDTs, while molecular methods were used in 8 studies (11.1%). Staining solutions used in LM included Giemsa (62.2%, n = 46), Leishman (17.6%, n = 13) and Jaswant Singh–Bhattacharji (2.7%, n = 2). One study combined Leishman and Jaswant Singh–Bhattacharji, and the staining solution was not specified in the remaining studies.

3.5. Characteristics of RDTs Evaluated

On analysis, a total of 26 different RDT brands were evaluated across the included studies. The main RDT brands included ParaCheck Pf® (12 studies), ParaSight F® (10 studies), ICT Malaria Pf (10 studies), and ParaHit®-f (9 studies) (Table 2).
The RDTs were designed as cassette, card or dipstick. Nearly half of RDTs were specific for detection of P. falciparum only (47.5%, n = 48) while others were designed for P. falciparum and P. vivax (11.9%, n = 12), and P. falciparum/Pan-Plasmodium except for P. knowlesi (Pf/Pan (22.8%, n = 23), P. falciparum/P. vivax-P. ovale-P. malariae (Pf/Pvom) (5.9%, n = 6), and Pan only (2.9%, n = 3). The countries of RDT manufacturers were India, USA, Switzerland, Australia, South Korea, and Japan.

3.6. Methodological Quality of Included Studies

A summary of the evaluation of the quality of the included studies is shown in Figure 4, and the details of this evaluation are presented in Table S5. Most of the studies showed a low risk of bias regarding index test, reference standard, and flow and timing domains. In contrast, a large proportion (66.7%) had an unclear risk of bias regarding the patient recruitment domain (Figure 4). There was a low level of concern on the applicability in relation to the “reference standard” domain, and the “index test” domain. However, the risk of concerns on the applicability regarding patient selection was high in 25.6% of the studies.

3.7. Detection of Plasmodium spp. Species

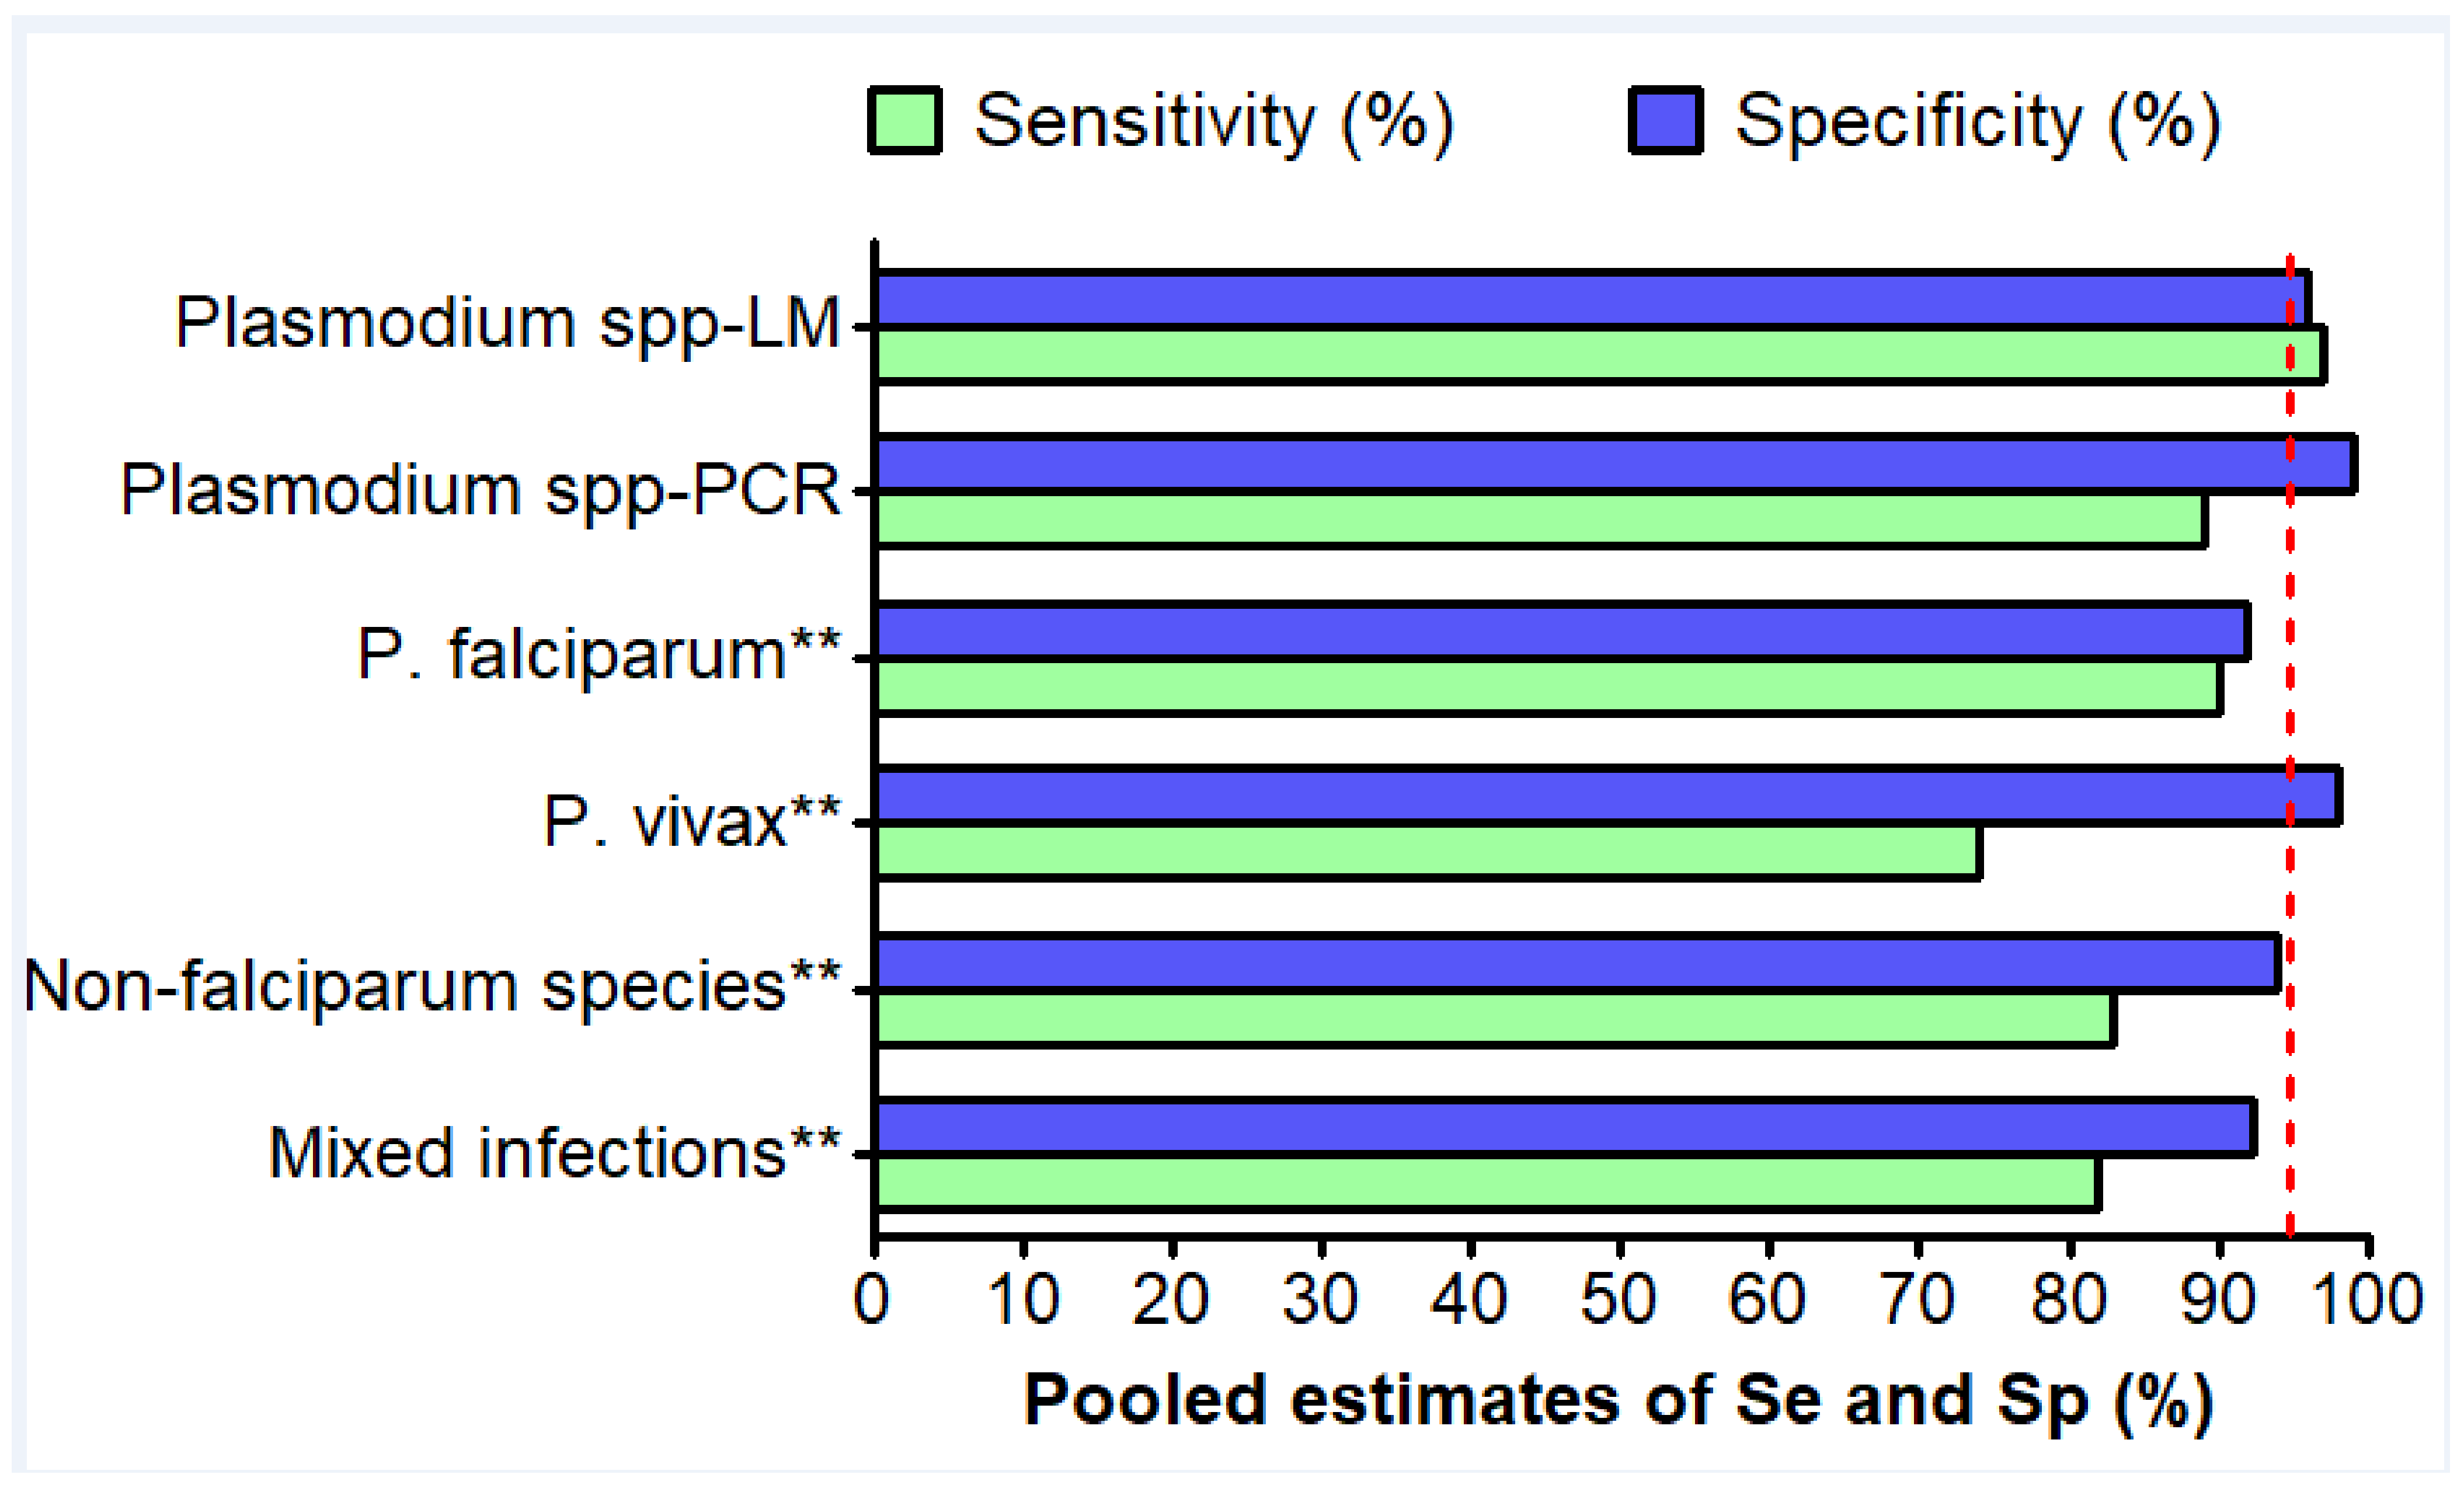
We selected studies that evaluated RDTs designed to detect at least two human Plasmodium species (i.e., HRP2 + Pan-LDH, PfLDH + Pan-LDH, HRP2 + PvLDH, and HRP2 + Panmalarial Antigen). A total of 12 studies with LM as gold standard, and 3 with molecular methods, were evaluated in this section of the review. When compared to LM, pooled estimates of performances of RDTs were: sensitivity = 97.0% (95% CI 95.0–98.0%), specificity = 96.0% (95% CI 93.0–97.0%), PLR = 22.4 (95% CI 13.6–36.9), NLR = 0.02 (95% CI 0.01–0.04), and DOR = 1080 (95% CI 413.7–2819.6). A high level of heterogeneity was found (I2 > 80%, p < 0.01).
Using PCR as the gold standard, the RDT performances were: Se = 89.0% (95% CI 23.0–100.0%) and Sp = 99.0% (95% CI 97.0–99.0%) (Figure S6). The pooled estimates of PLR, NLR and DOR were not available due to the small number of eligible studies (n = 3). In addition, I2 statistics varied between different modalities of variables included in the subgroup analysis, thereby outlining their influence on RDT performances in the detection of any plasmodial species (Table S7).
Sensitivity analysis showed no major influence of individual studies in the pooled estimates of RDTs’ performance parameters (Figure S8). Meta-regression analysis showed that DOR and sensitivity were significantly influenced by the geographical area (p < 0.0001 and p = 0.015), country of RDT manufacturer (p-= 0.046 and p-= 0.004), and LM-staining solution (p = 0.044 and p-= 0.015). Pooled specificity values were significantly influenced only by the area (p < 0.0001).

3.8. Detection of P. Falciparum

Twenty-two studies were eligible in this section. Performances of RDTs were good as pooled estimates of sensitivity and specificity were 90% (I2 = 92.3%; 95% CI 87.0–93.0%) and 92% (I2 = 92.3%; 95% CI 91.0–94.0%), respectively (Figure 5 and Figure S6).
Subgroup analysis showed the influence of some independent variables while sensitivity analysis revealed no major effect of each study on the pooled estimates of performance parameters (Table S7 and Figure S8). RDTs targeting primarily HRP2 plus another P. falciparum antigen were conservatively more sensitive than those targeting only HRP2 (i.e., based on the upper CI of sensitivity estimates, as presented in Figure S6). DOR, sensitivity and specificity were not significantly influenced by RDT manufacturer, LM-staining solution, and parasite antigen (Meta-regression, p > 0.05).
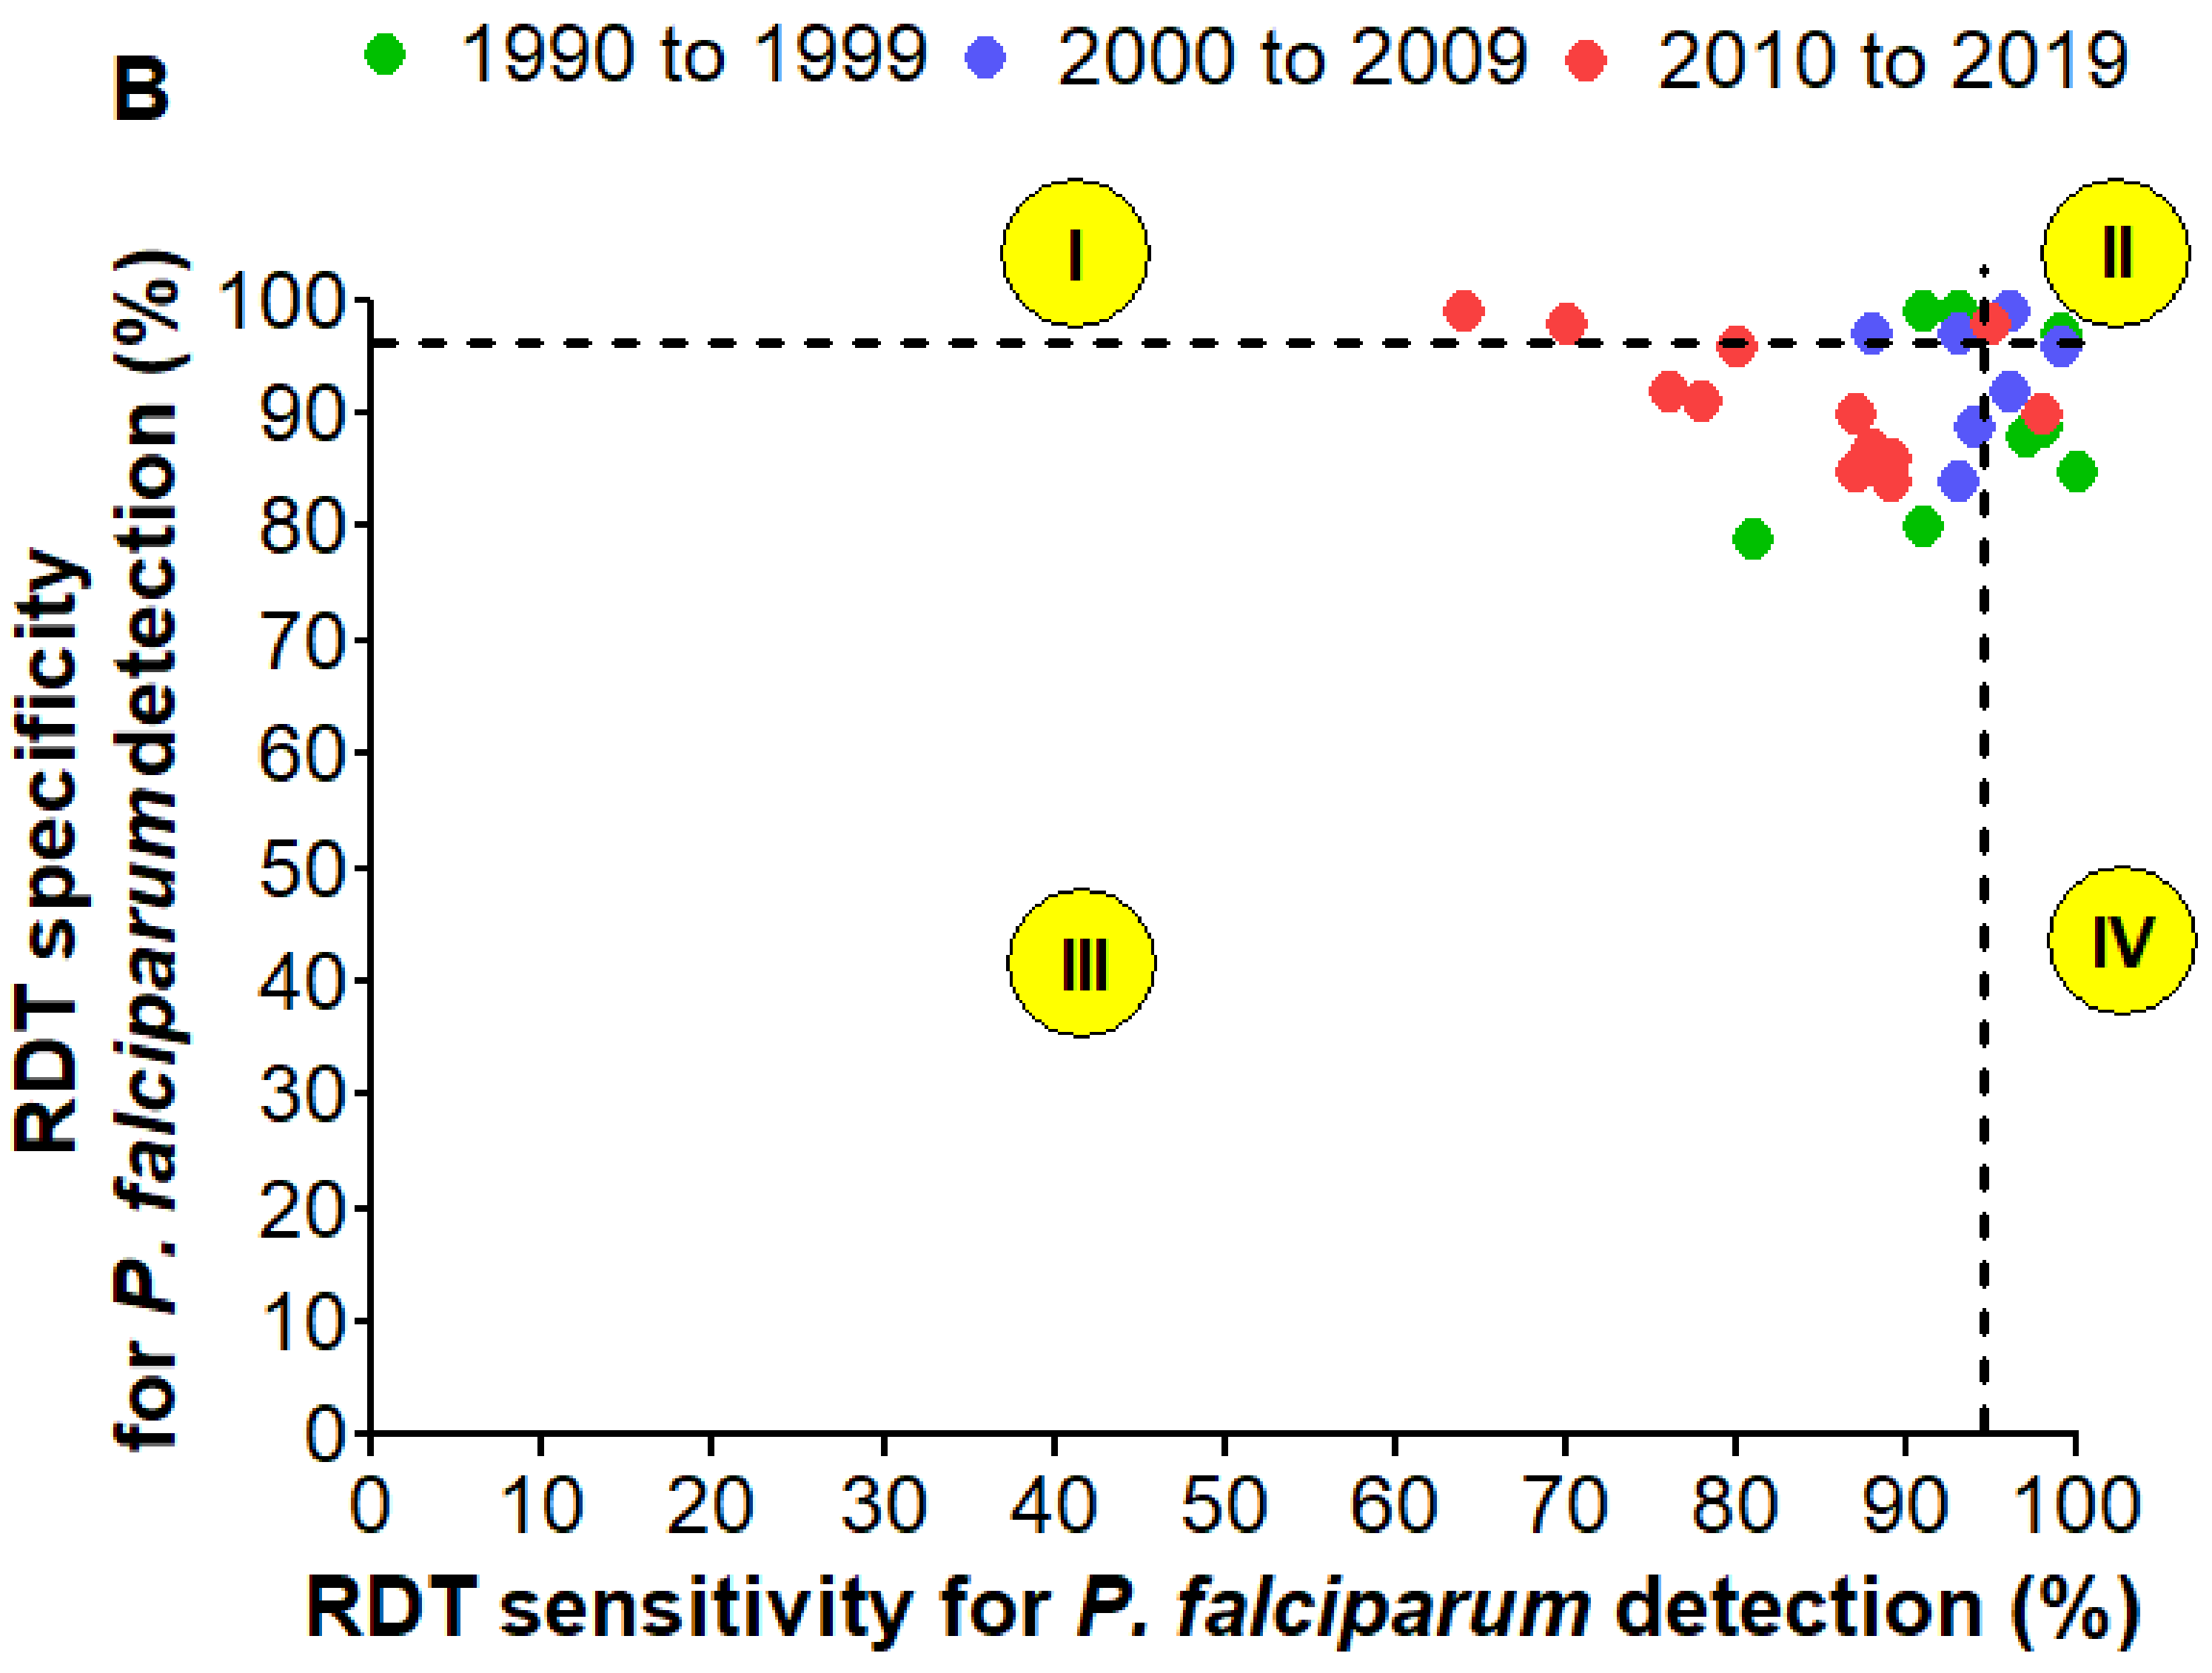
The analysis of PfHR2-based RDT performance with regard to years of data collection revealed a slight decrease of sensitivity for these 30 years, from 95% (95% CI 91–97%, I2 = 87.7%; p = 0.001) in 1990–1999 to 85% (95% CI 91–97%, I2 = 87.7%; p = 0.001) in 2010–2019 (Figure 6A). Sensitivity and Specificity were significantly impacted by the period of data collection (Meta-regression, p = 0.007 for sensitivity, p = 0.034 for specificity). RDTs had high sensitivity and specificity in only four studies (Figure 6B).

3.9. Detection of P. vivax

All the ten studies eligible for this section used LM as the gold standard. Hence, no performance analysis of RDTs against PCR was possible. The performances of RDTs in the detection of P. vivax were lower than those reported for the detection of P. falciparum, especially in terms of sensitivity and DOR. The results are as follows: sensitivity = 74.0% (95% CI 64.0–82.0%), specificity = 98.0% (95% CI 97.0–99.0%), PLR = 29.5 (95% CI 19.2–45.3), NLR = 0.21 (95% CI 0.11–0.37) and DOR = 147.5 (95% CI 75.3–288.7).
Meta-regression and subgroup analysis were performed as a high level of heterogeneity between studies was found (I2 ≥ 74 %, p < 0.01) (Figure 5 and Figure S6). DOR and sensitivity were significantly influenced by the Ag targeted in the RDT (Meta-regression, p < 0.0001 and p = 0.007).
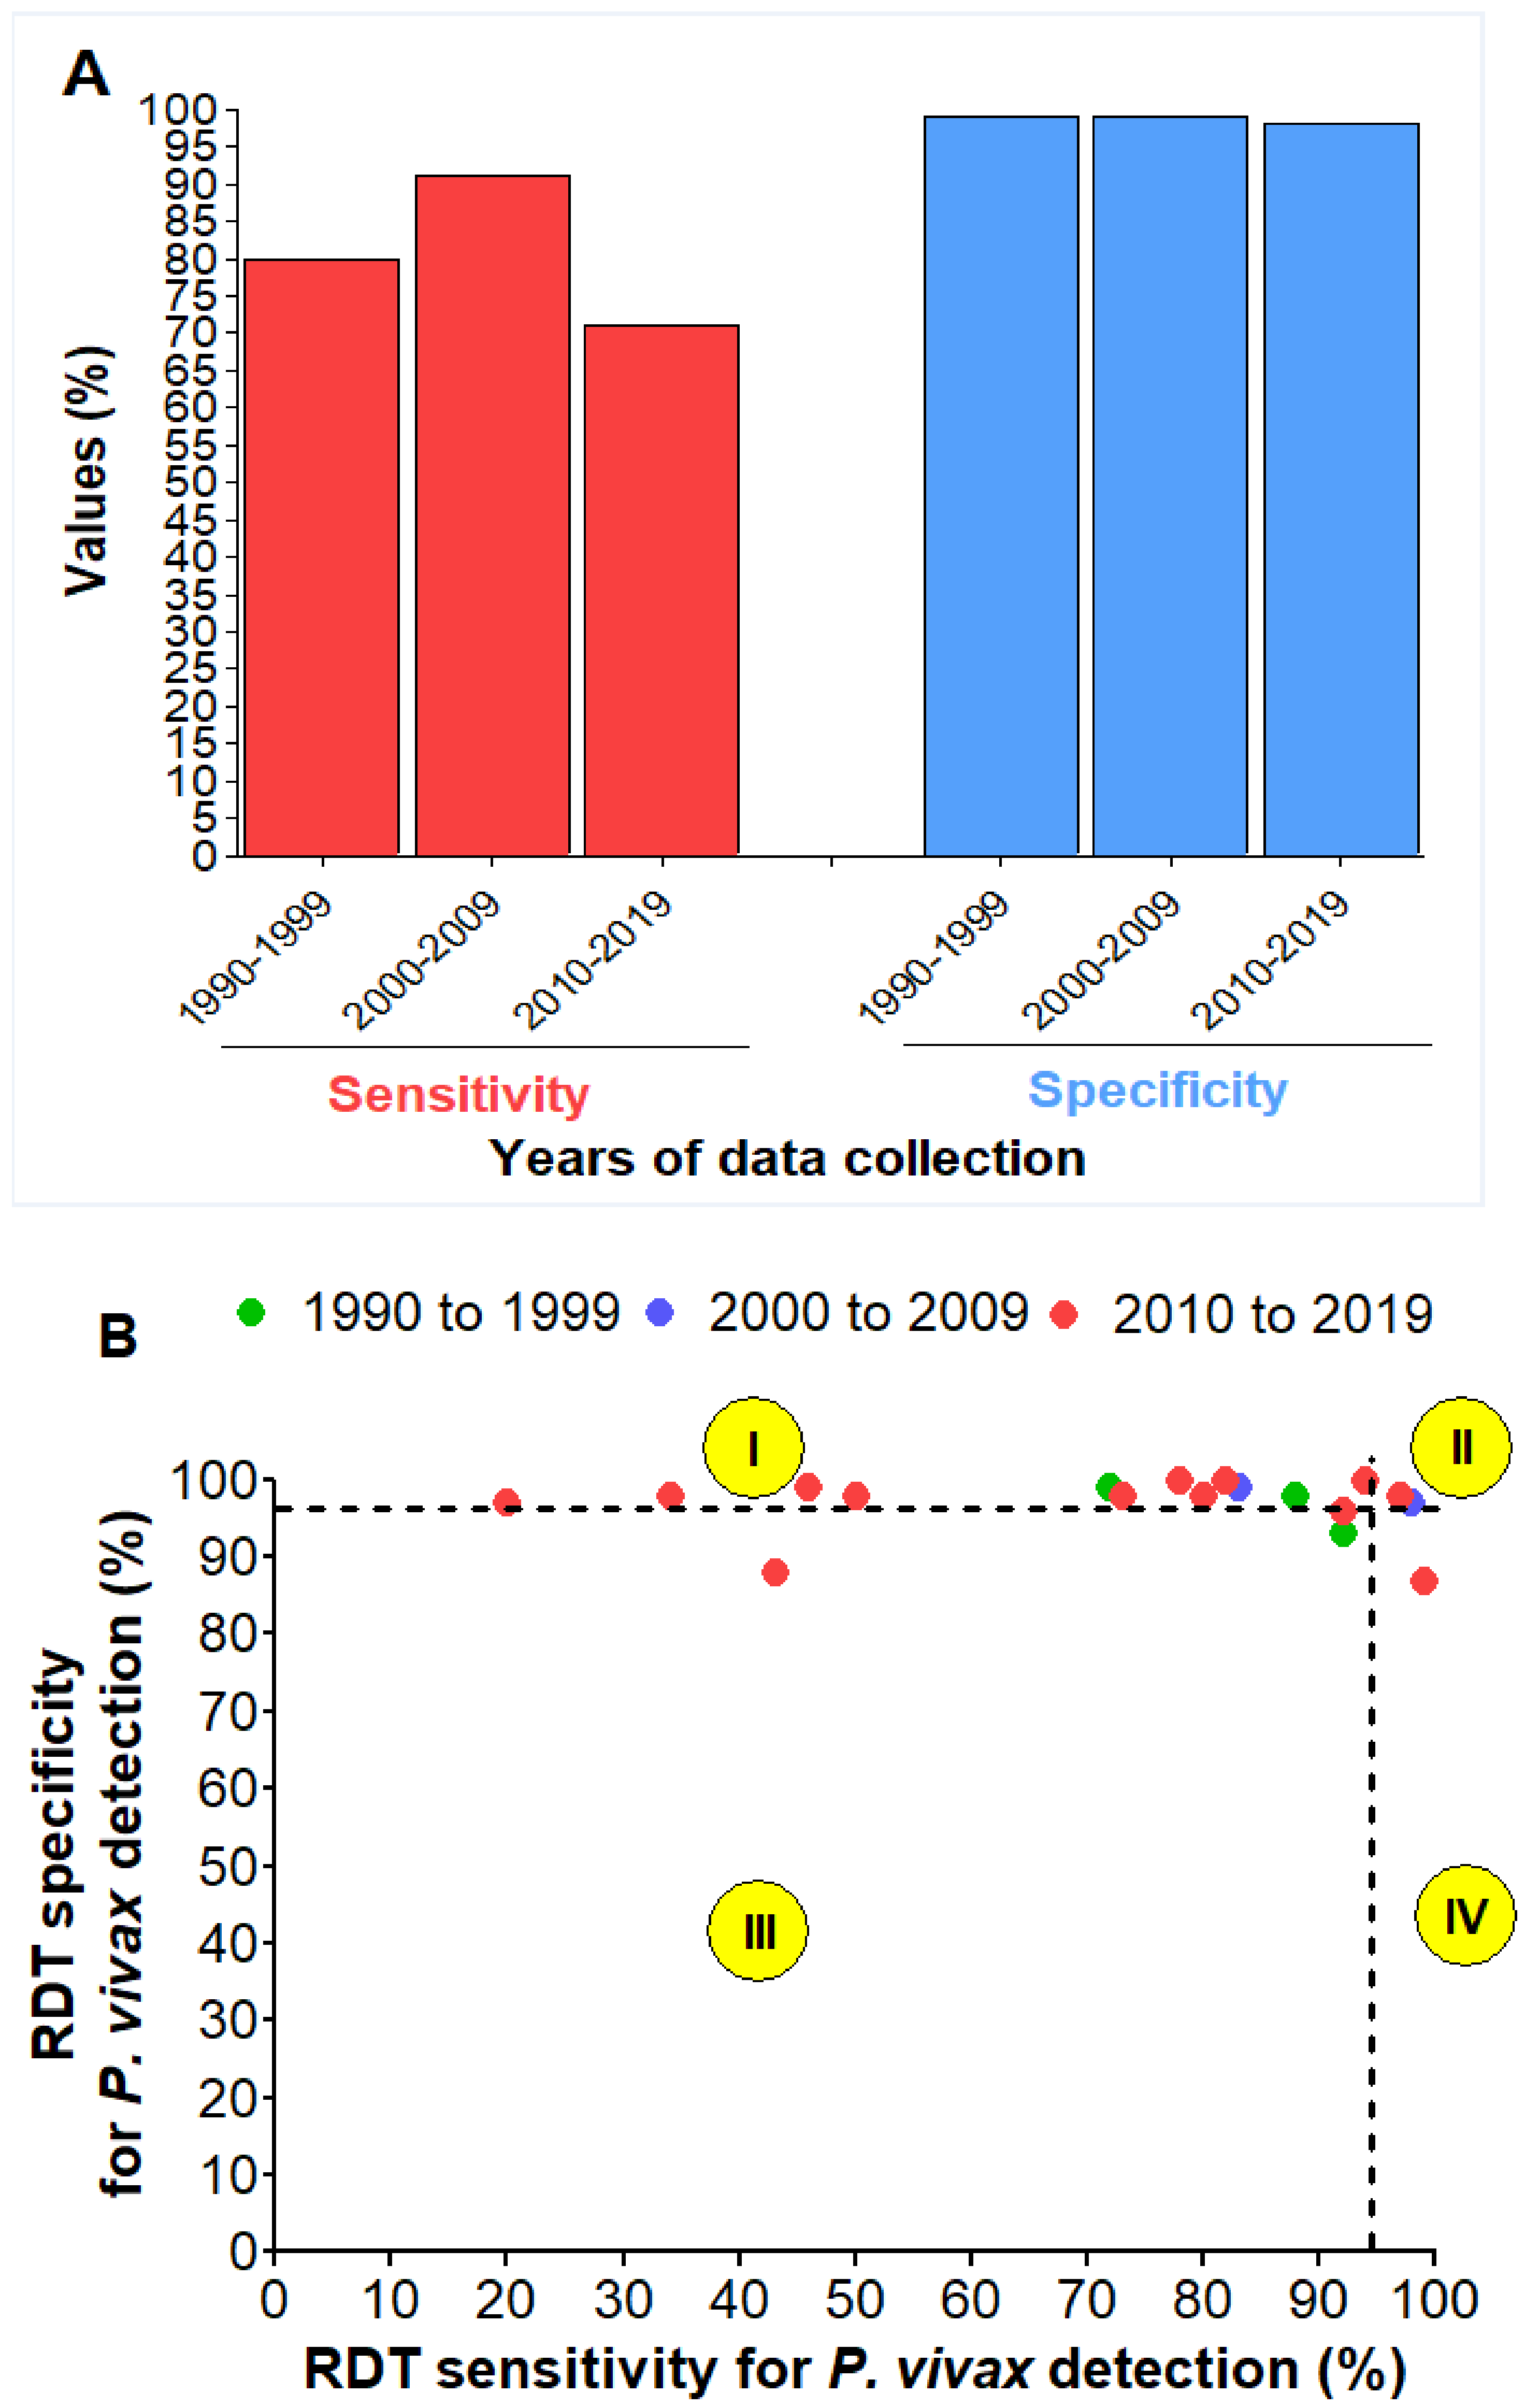
Similarly observed with PfHRP2-based RDTs, a decrease in sensitivity of P. vivax-based was observed over time (Figure 7A). Only two studies found good performances of RDTs against P. vivax (group II: High Se–High Sp) (Figure 7B).

3.10. Paired Comparison of Performances of RDT for P. falciparum and P. vivax

Only three studies compared the performances of the same RDTs between P. falciparum and P. vivax. Pooled estimates of sensitivity and specificity for the detection of P. falciparum were 95% (95% CI 84–98%) and 99% (95% CI 96–100%) respectively while these parameters were 95% (95% CI 77–99%) and 98% (95% CI 86–100%) for P. vivax. Based on the lower CI, minimum sensitivity and specificity values were 84% and 96% for P. falciparum, whereas they were 77% and 86% for P. vivax. Thus, the RDTs evaluated in these three studies were more accurate for detecting P. falciparum infections.

3.11. Detection of Non-Falciparum Species

Only one study addressed the performances of RDTs against non-falciparum species (Bharti et al. 2008 see Table S4). The authors reported sensitivity of 83% (95% CI 69–91%) and specificity of 94% (95% CI 90–96%), using LM as the gold standard (Figure 5). Another study compared the result of RDT vis-à-vis to P. malariae, the RDT gave positive result to only one of the 12 P. malariae samples identified by PCR (Haanshuus et al. 2016 see Table S4).

3.12. Detection of Mixed Infections

Two studies addressed the capacity of RDT to accurately detect mixed infections (Vyas et al. 2014, and Joseph and Uchila, 2018, see Table S4). The pooled estimates of sensitivity and specificity were 82% (95% CI 41.7–96.6%, I2 = 0%, p = 0.391) and 92.3% (95% CI 79.2–97.6%, I2 = 91.4%, p = 0.0001), respectively (Figure 5).

3.13. Gametocyte Carriage and RDT Positivity

Some studies addressed the reactivity of RDT against gametocytes. Six RDT brands (ICT Malaria Pf, ParaCheck Pf®, ParaSight F®, ParaHit®-f, DiaMed OptiMAL®, and Advantage mal Card) were analysed in this section.
We observed contradictory findings for PfHRP2-based RDTs only. Studies that tested ICT Malaria Pf kit found no link between RDT reactivity and presence/absence of gametocytes. In contrast, studies that evaluated ParaCheck Pf®, found that it was able to detect all individuals infected only with gametocytes. All the LDH-based RDTs were able to detect gametocyte infections (Table 3).

3.14. Intensity of RDT Test Line and Parasitemia

Results on the relation between level of parasitemia and intensity of RDT test line varied according to the RDT brand. No correlation was found with ICT Malaria Pf kit, while one study found a statistically significant positive correlation between parasitemia of either ring stage only or ring stage + gametocyte, with the test line intensity of the ParaCheck Pf® RDT (Table 3).

3.15. RDT Performances and Level of Parasitemia

In total, 18 studies assessed the performances of RDTs according to the level of parasitemia and all of them found increased RDTs’ performances at higher levels of plasmodial parasitemia (Table S4).

3.16. RDT Performances against P. falciparum Isolates with Pfhrp2 Deletions

No studies included evaluated the performances of RDT in the detection of P. falciparum samples with deletions in the pfhrp2 gene. We have exploited the results of round 8 of the latest WHO testing programme, as presented in Table 4 [30]. Results were available for seven of the total number of RDTs evaluated from the included studies (Table 2). None of these RDTs meet all WHO performance criteria in terms of PDS and positive rate. However, they were all efficient in terms of invalid rate (i.e., <5%) and FP rate (i.e., <10%), except for the “Parascreen Device Pan/Pf” RDT (FP rate = 50.6%) (Table 4).

4. Discussion

In this review, the performances of malaria RDTs were evaluated from studies carried out in India, since their implementation in malaria endemic countries in the 1990s.
The pooled estimates of sensitivity and specificity were below 100%, meaning that RDTs misclassified some individuals (i.e., FN and FP). FP is particularly seen in RDTs targeting PfHRP2 protein, as this protein is detectable in the bloodstream for many weeks following successful treatment of infections [4]. In addition, we found that the Se values of PfHRP2-based RDTs decreased over these three decades. Using a bespoke Bayesian survival model, Dalrymple et al. estimated that 50% and 5% of PfHRP2-based RDTs were still positive 15- and 36-days post-treatment, respectively [31]. Several causes can explain FN, viz., low parasitemia, poor handling of the RDTs, poor storage of the RDT, prozone effect (i.e., FN or false-low results in antibody-antigen reactions, due to an excess of either antibodies or antigens), and recently deletions in the pfhrp2 gene [11,32,33].
The RDTs’ performance parameters were evaluated using LM and PCR as the gold standard. These performance parameters were lower in studies having used PCR compared with studies having used LM. Molecular methods are more sensitive than LM [12], and thus some samples LM-negative and/or RDT-negative can be revealed as positive by using molecular methods. These types of infections are termed sub-microscopic infections [34]. The extent of these infections varies according to geographical areas and level of endemicity, and sub-microscopic infections were showed to play a great role in malaria transmission and morbidity [35,36].
Only one study evaluated the RDT performances against P. malariae, while none of the studies focused on the other non-falciparum/vivax species (i.e., P. ovale and P. knowlesi). P. knowlesi has been reported from four states till now in India though P. ovale is rare in the country [37]. Plasmodium malariae has been reported as the most frequent non-falciparum/vivax species across India, and are mainly seen as co-infection cases with P. falciparum [37,38,39,40]. Performances of RDTs against P. ovale and P. malariae has been shown to be suboptimal [41]. It is also worth addressing the detection of these species by developing specific RDTs, as some reports of complications due to these species have started to accrue in some areas [42,43,44].
Gametocytes are not responsible for the disease, but they are involved in malaria transmission. Thus, the detection of gametocyte carriers is crucial to efficiently reduce the transmission reservoir of Plasmodium parasites, and thus reduce the malaria burden. Contradictory findings were reported on the reactivity of RDTs to gametocytes, and these concerned PfHRP2-based RDTs only. PfHRP2 is produced at varying levels, depending on the development stage (highly produced by ring stage, moderately by trophozoites, lowly by immature gametocytes and not at all by mature gametocytes) [14,45]. Thus, PfHRP2-based RDTs can still give positive results against immature gametocytes and negative against mature gametocytes. All else being equal, it is likely that these discrepancies are due to differences in maturity of gametocytes in patients from these different studies. Besides, PfHRP2-based RDTs can give a positive result in infections with only mature gametocytes if HRP2 is still circulating at a blood-detectable level, but they will probably give negative results in cases of infection with only mature gametocytes and absence/non-detectable level of HRP2.
The WHO, for the first time, has recently evaluated the performances of some RDTs against pfhrp2-negative P. falciparum samples [30]. The results were available for seven of all RDTs identified in our review, and none of them met the WHO-defined performance criteria (Table 4). Actually, just two RDTs, viz., “CareStart Malaria PAN (pLDH) Ag” and “careUS Malaria PAN (pLDH) Ag”, satisfy the WHO performance criteria for detection of pfhrp2-deleted parasites [30]. The WHO recommends not to use exclusively HRP2-detecting RDTs in areas where FN result rates, due to pfhrp2 deletions, ≥5% [46]. There are rising reports on the presence of P. falciparum isolates with pfhrp2 deletions in India, which constitute an undetected reservoir for malaria transmission [47,48,49,50]. These studies were not designed for estimating of pfhrp2/3 deletions among symptomatic patients with RDT-negative results [46]. Thus, it is would be premature to think about changing HRP2-detecting RDTs in the country. However, it would also be interesting to conduct such types of studies to know whether HRP2-detecting RDTs are still needed in India. In parallel, it would be interesting to develop RDTs targeting other antigens such as glutamate dehydrogenase, recently proposed and shown as a good candidate [51].

5. Limitations of this Review

The present review has some limitations. First, a high level of heterogeneity was found between studies. Second, the existence of a selection bias is probable as only studies written in the English language were included in the analysis. Third, we tested some variables in subgroup analysis; however, confounding variables such as the level of endemicity (information that was given only in the 13 included studies) and the level of parasitemia were not investigated as an additional source of between-study heterogeneity. These variables were not specified in most of the studies included in the review.

6. Conclusions

In conclusion, RDTs are still performants for the detection of malaria parasites in India. However, they are subject to result variability due to many factors (e.g., geographical area, antigen targeted, presence of gametocytes). This study also outlines the need for development of RDTs for the detection of minor malaria species circulating in the country (i.e., P. ovale, P. malariae and P. knowlesi) to reach malaria elimination objectives. It is also crucial to target individuals carrying only mature gametocytes involved in malaria transmission. Finally, in a current context of deletions in the pfhrp2 gene hindering the accuracy of PfHRP2-based RDTs, it would be interesting to conduct studies to determine the prevalence of pfhrp2/3 deletions among patients with RDT-negative results. Finally, it is also important to identify new malarial antigens with a potential to be used as markers for malaria diagnosis in the future.

Supplementary Materials

The following are available online at https://www.mdpi.com/article/10.3390/diagnostics11040590/s1. Figure S1: PRISMA flow diagram, Table S2: PRISMA checklist, Table S3: List of studies excluded in the review with reasons for exclusion, Table S4: List of studies included in the review, Table S5: Results on quality assessment of the included studies, Figure S6: Forest and funnel plots of pooled values of diagnostic performance parameters across all included studies, Table S7: Results of subgroup analysis on performances of RDTs in the detection of at least P. falciparum and/or P. vivax, P. falciparum only, and P. vivax, Figure S8: Results of sensitivity analysis on performances of RDTs in the detection of at least P. falciparum and/or P. vivax, P. falciparum only, and P. vivax.

Author Contributions

Conceptualization, L.P.K.F. and V.S.; methodology, L.P.K.F. and V.S.; software, L.P.K.F.; validation, all authors; formal analysis, L.P.K.F. and V.S.; data curation, L.P.K.F. and V.S.; Writing—Original draft preparation, L.P.K.F.; Writing—Review and editing, all authors; visualization, L.P.K.F. and V.S.; supervision, V.P. and V.S.; All authors have read and agreed to the published version of the manuscript.

Funding

The author(s) received no financial support for the research, authorship, and/or publication of this article.

Institutional Review Board Statement

Ethical review and approval were waived for this study, due to we performed meta-analysis through published open data.

Informed Consent Statement

Not applicable.

Data Availability Statement

The data presented in this study are available on request from the corresponding author.

Acknowledgments

The support of The World Academy of Sciences (TWAS), Trieste, Italy and the Department of Biotechnology (DBT), India, is acknowledged in this study through a Postgraduate Fellowship Programme granted to the first author.

Conflicts of Interest

The authors declare no conflict of interest.

Abbreviations

95% CIConfidence interval at 95%
DORDiagnostic odd ratio
FPFalse positive
FNFalse negative
JBIJoanna Briggs Institute
LDHLactate dehydrogenase
LMLight microscopy
NLRNegative likelihood ratio
PDSPanel detection score
PfHRP2P. falciparum histidine rich protein 2
PLRPositive likelihood ratio
PRISMAPreferred Reporting Items for Systematic Reviews and Meta-analyses
RDTsRapid diagnostic tests
SeSensitivity
SEASouth East Asia
sSAsub-Saharan Africa
SR-MASystematic review and meta-analysis
SpSpecificity
TPTrue positive
TNTrue negative
WHOWorld Health Organization

References

  1. White, N.J.; Pukrittayakamee, S.; Tinh Hien, T.; Abul Faiz, M.; Mokuolu, O.A.; Dondorp, A.M. Malaria. Lancet 2014, 391, 1608–1621. [Google Scholar] [CrossRef]
  2. WHO. World Malaria Report; WHO: Geneva, Switzerland, 2020; Volume WHO/H™/GM, ISBN 978 92 4 1564403. [Google Scholar]
  3. The Global Fund. List of Rapid Diagnostic Test. (RDT) Kits for Malaria Classified According to the Global Fund Quality Assurance Policy; The Global Fund: Geneva, Switzerland, 2015. [Google Scholar]
  4. Moody, A. Rapid Diagnostic Tests for Malaria Parasites. Clin. Microbiol. Rev. 2002, 15, 66–78. [Google Scholar] [CrossRef]
  5. Cheesbrough, M. District Laboratory Practice in Tropical Countries, Part 2, 2nd ed.; Cambridge University Press: Cambridge, UK, 2010. [Google Scholar]
  6. Kamgain, L.; Assam-Assam, J.-P.; Kojom Foko, L.P.; Fouamno, H. Prevalence of Malaria Infection and Reliability of ACCUCARE One Step Malaria Test® for Diagnosing Malaria in People Living with Human Immunodeficiency Virus Infection in Cameroon. Int. J. Trop. Dis. Health 2017, 21, 30277. [Google Scholar] [CrossRef]
  7. Visser, T.; Daily, J.; Hotte, N.; Dolkart, C.; Cunningham, J.; Yadav, P. Rapid Diagnostic Tests for Malaria. Bull. World Health Organ. 2015, 93, 862–866. [Google Scholar] [CrossRef] [PubMed]
  8. WHO. World Malaria Report 2019; WHO: Geneva, Switzerland, 2019. [Google Scholar]
  9. Anvikar, A.R.; Shah, N.; Dhariwal, A.C.; Sonal, G.S.; Pradhan, M.M.; Ghosh, S.K.; Valecha, N. Epidemiology of Plasmodium vivax Malaria in India. Am. J. Trop. Med. Hyg. 2016, 95 (Suppl. S6), 108–120. [Google Scholar] [CrossRef] [PubMed]
  10. Siwal, N.; Singh, U.S.; Dash, M.; Kar, S.; Rani, S.; Rawal, C.; Singh, R.; Anvikar, A.R.; Pande, V.; Das, A. Malaria Diagnosis by PCR Revealed Differential Distribution of Mono and Mixed Species Infections by Plasmodium falciparum and P. vivax in India. PLoS ONE 2018, 13, e0193046. [Google Scholar] [CrossRef] [PubMed]
  11. Kojom, L.P.; Singh, V. Prevalence of Plasmodium falciparum Field Isolates with Deletions in Histidine-rich Protein 2 and 3 Genes in Context with Sub-Saharan Africa and India: A Systematic Review and Meta-analysis. Malar. J. 2020, 19, 46. [Google Scholar] [CrossRef]
  12. Kattenberg, J.H.; Ochodo, E.A.; Boer, K.R.; Schallig, H.D.; Mens, P.F.; Leeflang, M.M. Systematic Review and Meta-Analysis: Rapid Diagnostic Tests versus Placental Histology, Microscopy and PCR for Malaria in Pregnant Women. Malar. J. 2011, 10, 321. [Google Scholar] [CrossRef]
  13. Moher, D.; Liberati, A.; Tetzlaff, J.; Altman, D.G.; Altman, D.; Antes, G.; Atkins, D.; Barbour, V.; Barrowman, N.; Berlin, J.A.; et al. Preferred Reporting Items for Systematic Reviews and Meta-Analyses: The PRISMA Statement. PLoS Med. 2009, 6, e1000097. [Google Scholar] [CrossRef] [PubMed]
  14. Beadle, C.; Long, G.W.; McElroy, P.D.; Hoffman, S.L.; Long, G.W.; Weiss, W.R.; Maret, S.M.; Oloo, A.J. Diagnosis of Malaria by Detection of Plasmodium falciparum HRP-2 Antigen with a Rapid Dipstick Antigen-Capture Assay. Lancet 1994, 343, 564–568. [Google Scholar] [CrossRef]
  15. Shiff, C.J.; Premji, Z.; Minjas, J.N. The Rapid Manual Parasight®-f Test. a New Diagnostic Tool for Plasmodium falciparum Infection. Trans. R. Soc Trop. Med. Hyg. 1993, 87, 646–648. [Google Scholar] [CrossRef]
  16. Kar, S.S.; Ramalingam, A. Is 30 the Magic Number? Issues in Sample Size. Natl. J. Community Med. 2013, 4, 175–179. [Google Scholar]
  17. Whiting, P.F.; Rutjes, A.W.; Westwood, M.E.; Mallett, S.; Deeks, J.J.; Reitsma, J.B.; Leeflang, M.M.; Sterne, J.A.; Bossuyt, P.M. Group, and the Q.-2. QUADAS-2: A Revised Tool for the Quality Assessment of Diagnostic Accuracy Studies. Ann. Intern. Med. 2011, 155, 530–538. [Google Scholar] [CrossRef]
  18. Campbell, J.M.; Klugar, M.; Ding, S.; Carmody, D.P.; Hakonsen, S.J.; Jadotte, Y.T.; White, S.; Munn, Z. Diagnostic Test Accuracy: Methods for Systematic Review and Meta-Analysis. Int. J. Evid. Based Healthc. 2015, 13, 154–162. [Google Scholar] [CrossRef]
  19. Leeflang, M.M.G. Systematic Reviews and Meta-Analyses of Diagnostic Test Accuracy. Clin. Microbiol. Infect. 2014, 20, 105–113. [Google Scholar] [CrossRef]
  20. Parikh, R.; Mathai, A.; Parikh, S.; Sekhar, G.C.; Thomas, R. Understanding and Using Sensitivity, Specificity and Predictive Values. Indian J. Ophthalmol. 2008, 56, 45–50. [Google Scholar] [CrossRef] [PubMed]
  21. Marx, A.; Pewsner, D.; Egger, M.; Nüesch, R.; Bucher, H.C.; Genton, B. Review Meta-Analysis: Accuracy of Rapid Tests for Malaria in Travelers. Ann. Intern. Med. 2005, 142, 836–846. [Google Scholar] [CrossRef] [PubMed]
  22. Glas, A.S.; Lijmer, J.G.; Prins, M.H.; Bonsel, G.J.; Bossuyt, P.M.M. The Diagnostic Odds Ratio: A Single Indicator of Test Performance. J. Clin. Epidemiol. 2003, 56, 1129–1135. [Google Scholar] [CrossRef]
  23. Meta-Analyst, O.; Meta-Analyst, O. Open Meta-Analyst—The Tool | Evidence Synthesis in Health. 2018. Available online: http://www.cebm.brown.edu/openmeta/doc/openMA_help.html (accessed on 12 October 2020).
  24. Wallace, B.C.; Schmid, C.H.; Lau, J.; Trikalinos, T.A. Meta-Analyst: Software for Meta-Analysis of Binary, Continuous and Diagnostic Data. BMC Med. Res. Methodol. 2009, 9, 80. [Google Scholar] [CrossRef]
  25. Valentine, J.C.; Pigott, T.D.; Rothstein, H.R. How Many Studies Do You Need? A Primer on Statistical Power for Meta-Analysis. J. Educ. Behav. Stat. 2010, 35, 215–247. [Google Scholar] [CrossRef]
  26. Reid, K. Interpreting and Understanding Meta-Analysis Graphs: A Practical Guide. Aust. Fam. Phys. 2006, 35, 635–638. [Google Scholar]
  27. Sedgwick, P. Meta-Analyses: Heterogeneity and Subgroup Analysis. BMJ 2013, 346, f4040. [Google Scholar] [CrossRef]
  28. Willis, B.H.; Riley, R.D. Measuring the Statistical Validity of Summary Meta-Analysis and Meta-Regression Results for Use in Clinical Practice. Stat. Med. 2017, 36, 3283–3301. [Google Scholar] [CrossRef]
  29. Egger, M.; Smith, G.D.; Schneider, M.; Minder, C. Bias in Meta-Analysis Detected by a Simple, Graphical Test. BMJ 1997, 315, 629–634. [Google Scholar] [CrossRef]
  30. WHO. Malaria Rapid Diagnostic Test. Performance: Results of WHO Product Testing of Malaria RDTs: Round 8 (2016–2018); World Health Organisation: Geneva, Switzerland, 2018. [Google Scholar] [CrossRef]
  31. Dalrymple, U.; Arambepola, R.; Gething, P.W.; Cameron, E. How Long Do Rapid Diagnostic Tests Remain Positive after Anti-Malarial Treatment? Malar. J. 2018, 17, 228. [Google Scholar] [CrossRef] [PubMed]
  32. Gillet, P.; Scheirlinck, A.; Stokx, J.; De Weggheleire, A.; Chaúque, H.S.; Canhanga, O.D.; Tadeu, B.T.; Mosse, C.D.; Tiago, A.; Mabunda, S.; et al. Prozone in Malaria Rapid Diagnostics Tests: How Many Cases Are Missed? Malar. J. 2011, 10, 166. [Google Scholar] [CrossRef] [PubMed]
  33. Baker, J.; Mccarthy, J.; Gatton, M.; Kyle, D.E.; Belizario, V.; Luchavez, J.; Bell, D.; Cheng, Q. Genetic Diversity of Plasmodium falciparum Histidine-Rich Protein 2 (PfHRP2) and Its Effect on the Performance of PfHRP2-Based Rapid Diagnostic Tests. J. Infect. Dis 2005, 192, 870–877. [Google Scholar] [CrossRef] [PubMed]
  34. Lin, J.T.; Saunders, D.L.; Meshnick, S.R. The Role of Submicroscopic Malaria in Malaria Transmission: What Is the Evidence? Trends Parasitol. 2014, 30, 183–190. [Google Scholar] [CrossRef]
  35. Pava, Z.; Burdam, F.H.; Handayuni, I.; Trianty, L.; Utami, R.A.S.; Tirta, Y.K.; Kenangalem, E.; Lampah, D.; Kusuma, A.; Wirjanata, G.; et al. Submicroscopic and Asymptomatic Plasmodium Parasitaemia Associated with Significant Risk of Anaemia in Papua, Indonesia. PLoS ONE 2016, 11, e0165340. [Google Scholar] [CrossRef]
  36. Rovira-Vallbona, E.; Contreras-Mancilla, J.J.; Ramirez, R.; Guzmán-Guzmán, M.; Carrasco-Escobar, G.; Llanos-Cuentas, A.; Vinetz, J.M.; Gamboa, D.; Rosanas-Urgell, A. Predominance of Asymptomatic and Sub-Microscopic Infections Characterizes the Plasmodium Gametocyte Reservoir in the Peruvian Amazon. PLoS Negl. Trop. Dis. 2017, 11, e0005674. [Google Scholar] [CrossRef]
  37. Chaturvedi, R.; Deora, N.; Bhandari, D.; Parvez, S.; Sinha, A.; Sharma, A. Trends of Neglected Plasmodium Species Infection in Humans over the Past Century in India. One Health 2021, 11, 100190. [Google Scholar] [CrossRef]
  38. Haanshuus, C.G.; Chandy, S.; Manoharan, A.; Vivek, R. A High Malaria Prevalence Identified by PCR among Patients with Acute Undifferentiated Fever in India. PLoS ONE 2016, 11, e0158816. [Google Scholar] [CrossRef]
  39. Bharti, P.K.; Chand, S.K.; Singh, M.P.; Mishra, S.; Shukla, M.M.; Singh, R. Emergence of a New Focus of Plasmodium malariae in Forest Villages of District Balaghat, Central India: Implications for the Diagnosis of Malaria and Its Control. Trop. Med. Int. Health 2013, 18, 12–17. [Google Scholar] [CrossRef]
  40. Das, A.; Anvikar, A.R.; Cator, L.J.; Dhiman, R.C.; Eapen, A.; Mishra, N.; Nagpal, B.N. Malaria in India: The Center for the Study of Complex Malaria in India. Acta Trop. 2013, 121, 267–273. [Google Scholar] [CrossRef] [PubMed]
  41. Yerlikaya, S.; Campillo, A.; Gonzalez, I.J. A Systematic Review: Performance of Rapid Diagnostic Tests for the Detection of Plasmodium knowlesi, Plasmodium malariae, and Plasmodium ovale Monoinfections in Human Blood. J. Infect. Dis. 2018, 218, 265–276. [Google Scholar] [CrossRef] [PubMed]
  42. Kotepui, M.; Kotepui, K.U.; Milanez, G.D.; Masangkay, F.R. Severity and Mortality of Severe Plasmodium ovale Infection: A Systematic Review and Meta-Analysis. PLoS ONE 2020, 15, e0235014. [Google Scholar] [CrossRef] [PubMed]
  43. Boo, Y.L.; Lim, H.T.; Chin, P.W.; Lim, S.Y.; Hoo, F.K. A Case of Severe Plasmodium knowlesi in a Splenectomized Patient. Parasitol. Int. 2016, 65, 55–57. [Google Scholar] [CrossRef] [PubMed]
  44. Langford, S.; Douglas, N.M.; Lampah, D.A.; Simpson, J.A.; Kenangalem, E.; Sugiarto, P.; Anstey, N.M. Plasmodium malariae Infection Associated with a High Burden of Anemia: A Hospital-Based Surveillance Study. PLoS Negl. Trop. Dis. 2015, 9, e0004195. [Google Scholar] [CrossRef]
  45. Poti, K.E.; Sullivan, D.J.; Dondorp, A.M.; Woodrow, C.J. HRP2: Transforming Malaria Diagnosis, but with Caveats. Trends Parasitol. 2020, 36, 112–126. [Google Scholar] [CrossRef]
  46. WHO. Protocol for Estimating the Prevalence of Pfhrp2/Pfhrp3 Gene Deletions among Symptomatic Falciparum Patients with False-Negative RDT Results; WHO: Geneva, Switzerland, 2017. [Google Scholar]
  47. Kumar, N.; Pande, V.; Bhatt, R.M.; Shah, N.K.; Mishra, N.; Srivastava, B.; Valecha, N.; Anvikar, A.R. Genetic Deletion of HRP2 and HRP3 in Indian Plasmodium falciparum Population and False Negative Malaria Rapid Diagnostic Test. Acta Trop. 2013, 125, 119–121. [Google Scholar] [CrossRef]
  48. Bharti, P.K.; Chandel, H.S.; Ahmad, A.; Krishna, S.; Udhayakumar, V.; Singh, N. Prevalence of Pfhrp2 and/or Pfhrp3 Gene Deletion in Plasmodium falciparum Population in Eight Highly Endemic States in India. PLoS ONE 2016, 11, e0157949. [Google Scholar] [CrossRef] [PubMed]
  49. Pati, P.; Dhangadamajhi, G.; Bal, M.; Ranjit, M. High Proportions of Pfhrp2 Gene Deletion and Performance of HRP2-Based Rapid Diagnostic Test in Plasmodium falciparum Field Isolates of Odisha. Malar. J. 2018, 17, 394. [Google Scholar] [CrossRef] [PubMed]
  50. Singh, V.; Kojom, L.P. Deletions in the Plasmodium falciparum Histidine-Rich Protein 2 Gene: An Emerging Threat to the Elimination of Malaria in India. J. Vector Borne Dis. 2019, 56, 85–86. [Google Scholar] [CrossRef] [PubMed]
  51. Kori, L.D.; Valecha, N.; Anvikar, A.R. Glutamate Dehydrogenase: A Novel Candidate to Diagnose Plasmodium falciparum through Rapid Diagnostic Test in Blood Specimen from Fever Patients. Sci. Rep. 2020, 10, 6307. [Google Scholar] [CrossRef] [PubMed]
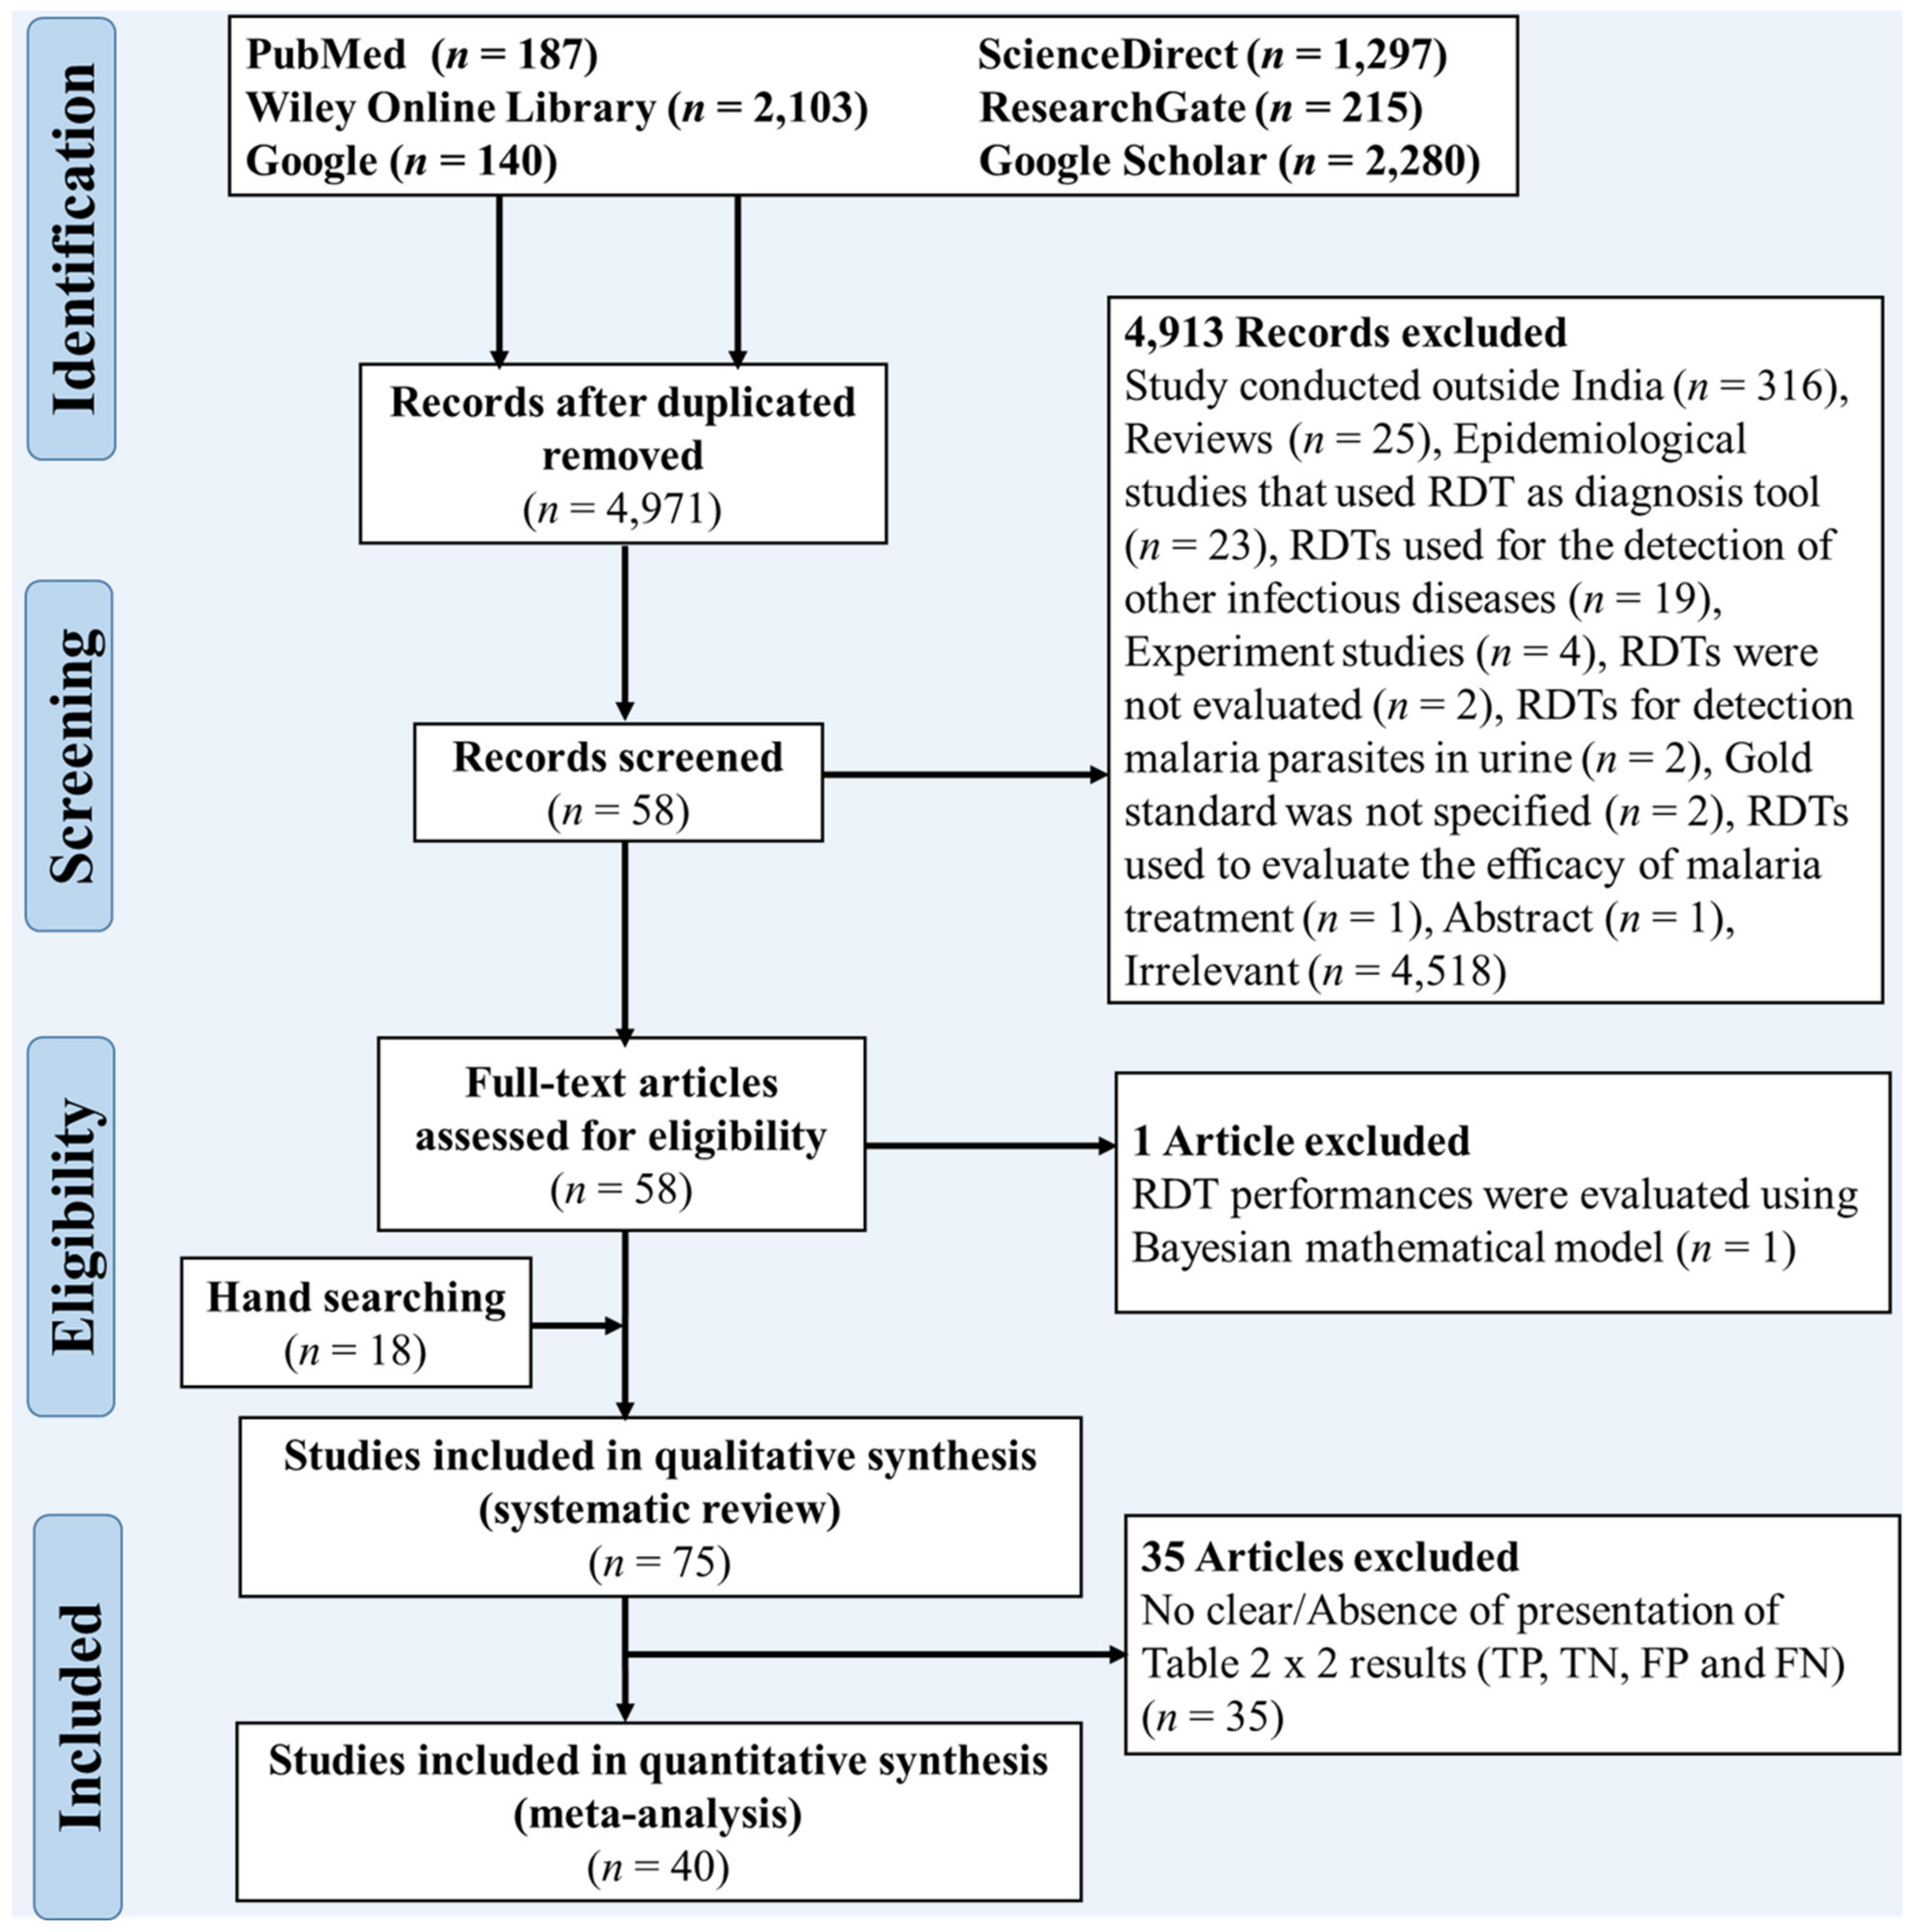
Figure 1. PRISMA flow diagram of the selection process of the included studies.
Diagnostics 11 00590 g001
Figure 2. Geographical distribution of studies included in the review. The map depicted here is taken from the official website of Ministry of External Affairs, India (https://mea.gov.in/india-at-glance.htm accessed 27 October 2020).
Diagnostics 11 00590 g002
Figure 3. Details of the studies included in relation to design (A), site (B), clinical status (C), and study population (D).
Diagnostics 11 00590 g003
Figure 4. Methodological quality assessment of 40 studies included in the meta-analysis. Reviewers’ assessment of four domains (patient selection, index test, reference standard, and flow and timing) of the QUADAS-2 tool is presented in stack bars as the proportion of studies with low/high/unclear risk of bias and with low/high/unclear concerns regarding applicability [17].
Diagnostics 11 00590 g004
Figure 5. Pooled estimates of sensitivity and specificity of the RDTs against Plasmodium spp., P. falciparum, P. vivax, non-falciparum, and mixed infections. LM: light microscopy, PCR: polymerase chain reaction, Se: sensitivity, Sp: specificity. **LM was used as gold standard. The red line indicates the 95% threshold.
Diagnostics 11 00590 g005
Figure 6. Sensitivity (Se) and specificity (Sp) of the PfHRP2-based RDTs for (A) the years 1990–2019, and (B) the individual studies (6A): The values presented are pooled estimates, (6B): A 95% threshold for Se and Sp was used to classify RDTs into four groups (I: Low Se—High Sp, II: High Se—High Sp, III: Low Se—Low Sp, and IV: High Se—Low Sp). Studies for which TP + FN < 30 and/or TN + FP < 30 were excluded.
Diagnostics 11 00590 g006aDiagnostics 11 00590 g006b
Figure 7. Sensitivity (Se) and specificity (Sp) of the P. vivax-based RDTs for (A) the years 1990–2019, and (B) the individual studies (7A): The values presented are pooled estimates, (7B): A 95% threshold for Se and Sp was used to classify RDTs into four groups (I: Low Se—High Sp, II: High Se—High Sp, III: Low Se—Low Sp, and IV: High Se—Low Sp). Studies for which TP + FN < 30 and/or TN + FP < 30 were excluded.
Diagnostics 11 00590 g007
Table 1. Data of interest retrieved from each included study.
Types of InformationNature of the Information Retrieved
Information on the PublicationName of the first author or of the two authors
Year of publication
Information on study design, population, areaStudy design
Indian areas and Level of endemicity of area
Year of data collection
Population (adult, children and pregnant women)
Clinical status of patients (febrile, asymptomatic)
Type of malaria
DiagnosticDiagnostic methods used (LM, RDT, molecular methods)
Staining molecule used in LM (Giemsa, Leishman, Jaswant Singh–Bhattacharji)
Type, antigen, brand and manufacturer’s country of the RDTs
Number of RDTs evaluated
Performance parametersTotal number of individuals tested with different methods
Total number of patients positive with gold standard and RDT
Total number of P. vivax infections
Number of mixed infections
Number of false negative (FN), false positive (FP), true negative (TN) and true positive (TP) for diagnosis of P. falciparum, P. vivax and non-falciparum species.
Table 2. Details of RDTs from the included studies based on rounds 5–8 of RDT testing programme [30].
BrandnManufacturer Antigen TargetedCategorisation as per WHOPDS (%) at 200 Parasites/µL
(Rounds 5–8)
for Pfa and Pvb
FP and Invalid Result RatesWHO
Performance Criteria
ParaCheck Pf®12Orchid, Biomedical Systems, Goa, IndiaHRP2Pf only94.0a and NAbNA and 0%Diagnostics 11 00590 i001
ParaSight F®10Becton Dickonson, Cockeys ville, MD, USAHRP2Pf only---
ICT Malaria Pf10ICT Diagnostics, Brooksvale, NSW, USAHRP2Pf only---
ParaHIT®-f9ARKRAY Healthcare Pvt. Ltd., Surat, IndiaHRP2Pf only77.0a and NAbNADiagnostics 11 00590 i001
DiaMed OptiMAL IT®6DiaMed AG, Cressier, SwitzerlandPfLDH + Pan-LDHPf/Pan---
ICT Malaria Pf/Pv4ICT Diagnostics, Brooksvale, NSW, USAPanmalarial Ag + HRP2Pf and Pv94.0a and NAbNADiagnostics 11 00590 i001
ParaHIT® Total4ARKRAY Healthcare Pvt. Ltd., Mumbai, IndiaAldolase + Pan-LDH + HRP2Pf/Pan---
SD Bioline Pf/Pan®4SD Standard Diagnostics, Inc., South KoreaPfLDH + Pan-LDHPf/Pan94.0a and 91.4b-Diagnostics 11 00590 i001
Determine Malaria Pf3Abbot Laboratories, Tokyo, JapanHRP2Pf only---
Parascreen Device Pan/Pf®3Zephyr Biomedical, Verna, Goa, IndiaPan-LDH + HRP2Pf/Pan91.0a and 91.4b0% and 0%Diagnostics 11 00590 i001
FalciVax (Pf/Pv)3Zephyr Biomedical, Verna, Goa, IndiaPvLDH + HRP2Pf and Pv/Pvom95.0a and 100b0.5% and 0%Diagnostics 11 00590 i001
First Response Combo Malaria Ag®3Premier medical corporation Ltd., IndiaPan-LDH + HRP2Pf/Pan91.0-95.0a and NAb0% and 0%Diagnostics 11 00590 i001
SD Bioline Pf/Pv®3SD Standard Diagnostics, Inc., South KoreaPfLDH + PvLDHPf and Pv99.0a and 97.1b0% and 0%Diagnostics 11 00590 i001
Advantage Mal Card2J. Mitra & Co. Pvt. Ltd., Rajasthan, IndiaPfLDH + Pan-LDHPf/Pan30.0a and 94.3b0.4% and 0%Diagnostics 11 00590 i002
Alere Trueline Malaria Ag Pf/Pan1Alere Medical Pvt. Ltd., IndiaPan-LDH + HRP2Pf/Pan85.0a and 91.4b0% and 0%Diagnostics 11 00590 i001
DiaMed OptiMAL®2Flow Inc., Portland, OR, USAPan-LDHPan only---
SD Bioline Pf®2SD Standard Diagnostics, Inc., South KoreaHRP2Pf only94.0a and NAbNA and 0%Diagnostics 11 00590 i001
Malaria Pf (HRPII)/PV (PLDH) Antigen Detection Test Device1GENOMIX Molecular Diagnostics Pvt. Ltd., Hyderabad, Andhra Pradesh, IndiaPvLDH + HRP2Pf and Pv/Pvom85.0a and 74.3bNADiagnostics 11 00590 i002
Malarigen Pf/Pv test1Aspen Laboratories, IndiaAldolase + Pan-LDHNA---
Malarigen Pf/Pv test1Aspen Laboratories, IndiaPan-LDH + HRP2NA---
Malarigen Pan test1Aspen Laboratories, IndiaPan-LDHNA---
Malascan Device Pf/Pan®1TulipScan Diagnostics, IndiaAldolase + HRP2Pf/Pan---
NecVIPARUM One step Pf/Pv1Nectar Life Science Ltd., Chandigarh, IndiaPvLDH + HRP2Pf and Pv/Pvom88.0a and 91.4b0% and 4.5%Diagnostics 11 00590 i001
New Pf-1 mini1Monozyme India Ltd., Secundradad, IndiaHRP2Pf only---
DiaMed OptiMAL® 481DiaMed AG, Cressier, SwitzerlandPan-LDHPan only---
Standard Q Pf/Pv1SD Biosensor healthcare Pvt. Ltd., IndiaPvLDH + HRP2Pf and Pv/Pvom85.0a and 100b0% and 0.5 %Diagnostics 11 00590 i001
Not specified11 ------
Total101§
PDS: Panel detection score; Pf = P. falciparum, Pv = P. vivax, Pvom = P. vivax, P. ovale and P. malariae. FP: False positive; HRP2 = Histidine rich protein 2, LDH = Lactate dehydrogenase, NA = Not applicable; WHO = World Health Organisation. RDTs meeting the following WHO performance criteria are recommended for procurement: PDS ≥ 75% for the detection of P. falciparum and P. vivax at 200 parasites/µL in all malaria settings, FP rate < 10% and invalid rate < 5% [30]. aPDS (%) at 200 parasites/µL for P. falciparum; bPDS (%) at 200 parasites/µL for P. vivax; The green check means that the RDT meets, where applicable, the WHO performance criteria; The red cross mark means that the RDT does not meet at least one of the WHO performance criteria(-): the PDS results are missing due to many reasons (results have been removed from the summary WHO result listings, manufacturer did not submit its product for evaluation, RDT is no longer manufactured).§: The total is more than the total number of the included studies (n = 75) as some studies evaluated more than one RDT.
Table 3. Reactivity of RDT according to gametocyte carriage and level of parasitemia.
RDTAuthors’ FindingsReferences as Seen in Table S4
Gametocyte detection versus RDT positivityICT Malaria PfPresence or absence of gametocytes was not related to RDT positivityValecha et al._1998
ICT Malaria PfPresence or absence of gametocytes was not related to RDT positivity Ghosh et al._2000
ParaCheck Pf®No correlation between presence of falciparum gametocytes and RDT positivity Ghosh et al._2002
ParaCheck Pf®Three individuals infected only with falciparum gametocytes were all RDT positiveSingh et al._2002
ParaCheck Pf®Two individuals infected only with falciparum gametocytes were all RDT negative Arora et al._2003a
ParaSight F®RDT failed to detect one individual with falciparum gametocytes only Arora et al._2003b
DiaMed OptiMAL®Two individuals infected only with falciparum gametocytes were all positive with the RDTSingh et al._2003
ParaCheck Pf®P. falciparum gametocytes not detected or weakly detected by the RDT in all carriers Gokhale et al._2004
ParaHit®-f14 individuals infected with falciparum gametocytes were RDT positiveSingh et al._2005a
ParaCheck Pf®Three only falciparum gametocytes -infected individuals were all RDT positiveBhat Sandhya et al._2012
Advantage mal CardOn day 8, falciparum gametocytes were detected by the RDT in all 9 patientsKocharekar et al._2014
Parasitemia versus Intensity band of RDTICT Malaria PfNo correlation found Valecha et al._1998
ICT Malaria PfNo correlation found Ghosh et al._2000
ParaCheck Pf®Positive correlation for development stage (Ring only, and Ring + gametocyte)Ghosh et al._2002
Table 4. Performances of RDTs against pfhrp2-negative P. falciparum samples based on results of round 8 of the WHO testing programme [30].
WHO Performance Indicators&
RDTsAntigen TargetedPDS (%)Positivity Rate (%)FP Rate (%)Invalid Rate (%)Overall
Evaluation
SD Bioline Pf/PanPfLDH + Pan-LDH32.568.1NA0.0Diagnostics 11 00590 i002
ParaCheck® F PfHRP215.040.5NA0.0Diagnostics 11 00590 i002
Malarigen Pf/PvHRP2 + Pan-LDH32.543.10.00.0Diagnostics 11 00590 i002
FalciVax (Pf/Pv)HRP2 + Pv-LDH0.03.10.00.0Diagnostics 11 00590 i002
First Response® Combo Malaria AgHRP2 + Pan-LDH12.523.10.00.0Diagnostics 11 00590 i002
NecVIPARUM One step Pf/PvHRP2 + Pv-LDH32.545.90.60.6Diagnostics 11 00590 i002
Parascreen Device Pan/PfHRP2 + Pan-LDH0.00.650.60.0Diagnostics 11 00590 i002
HRP2: Histidine rich protein 2; LDH: Lactate dehydrogenase; PDS: Panel detection score; FP: False positive; NA: Not applicable; Pf: P. falciparum; Pv: P. vivax; WHO: World Health Organisation. &RDTs meeting the following WHO performance criteria are recommended for procurement: PDS ≥ 75% for the detection of P. falciparum and P. vivax at 200 parasites/µL in all malaria settings, Positive rate ≥ 75%, FP rate < 10% and invalid rate < 5% [30]. The red cross mark means that the RDT failed to meet all the WHO performance criteria altogether.
Publisher’s Note: MDPI stays neutral with regard to jurisdictional claims in published maps and institutional affiliations.