COVLIAS 1.0: Lung Segmentation in COVID-19 Computed Tomography Scans Using Hybrid Deep Learning Artificial Intelligence Models


 ,
, 
 ,
,  ,
,  ,
,  ,
,  , , , ,
Abstract
:1. Introduction
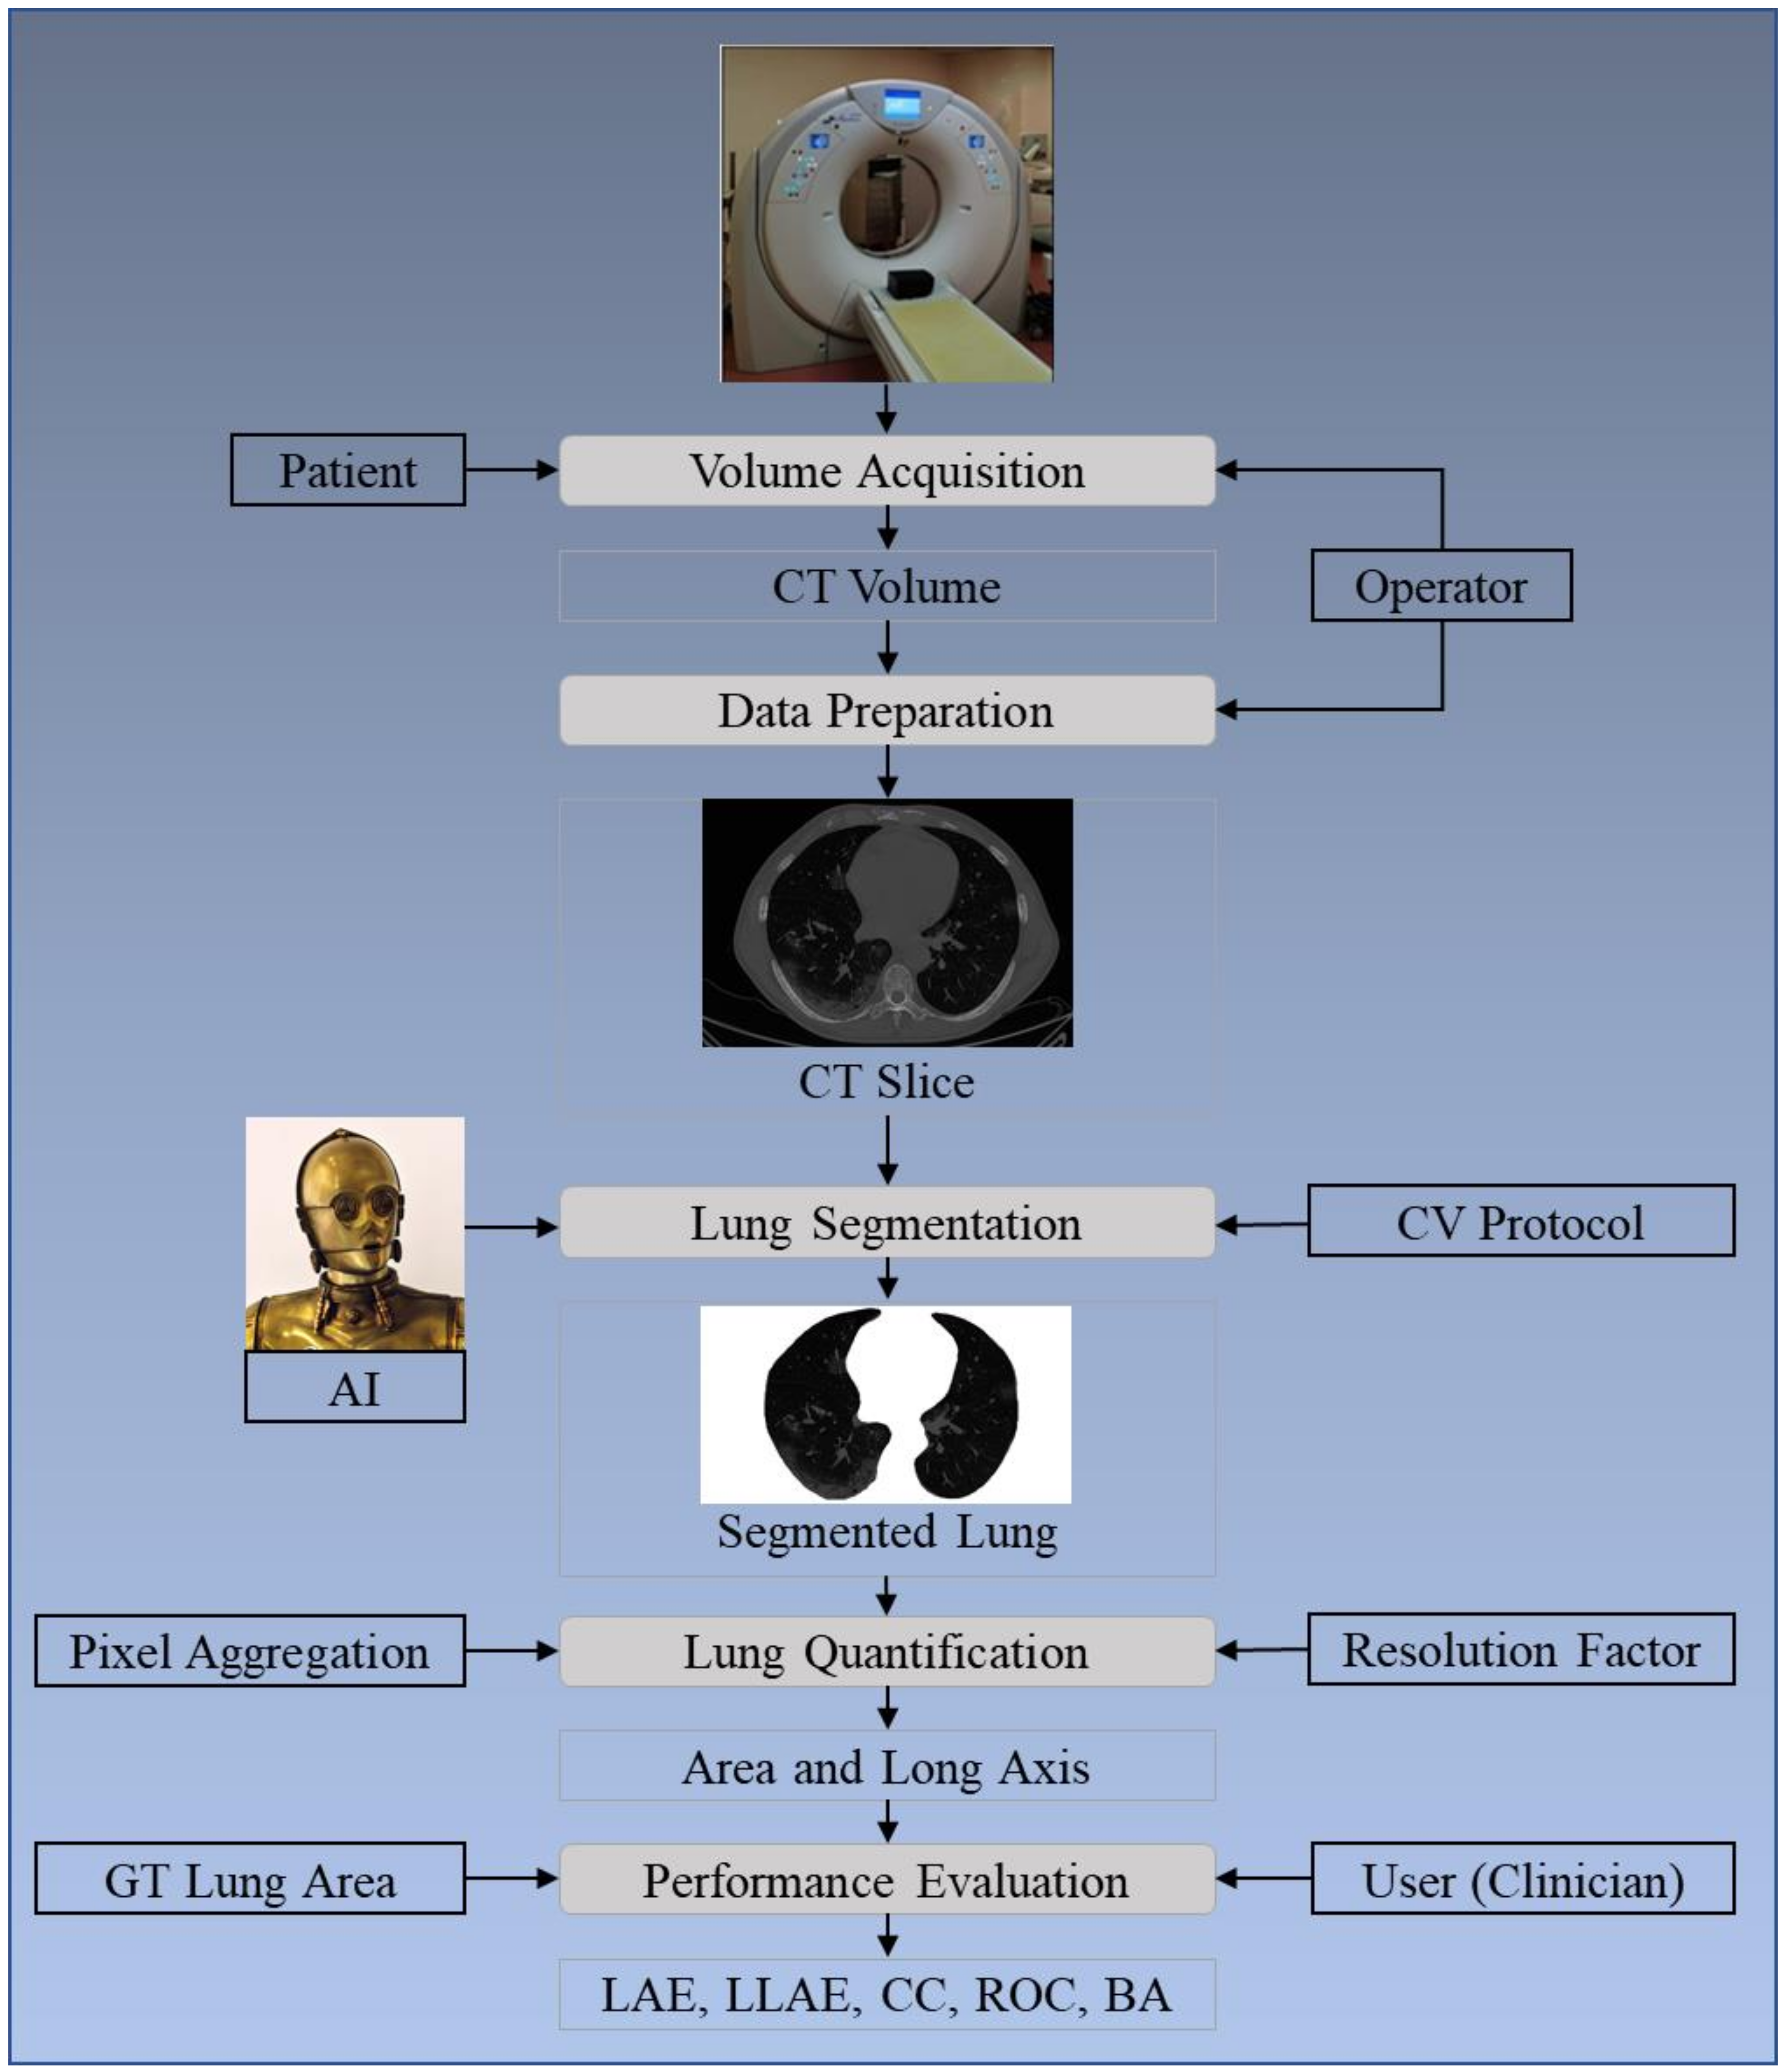
2. Methodology
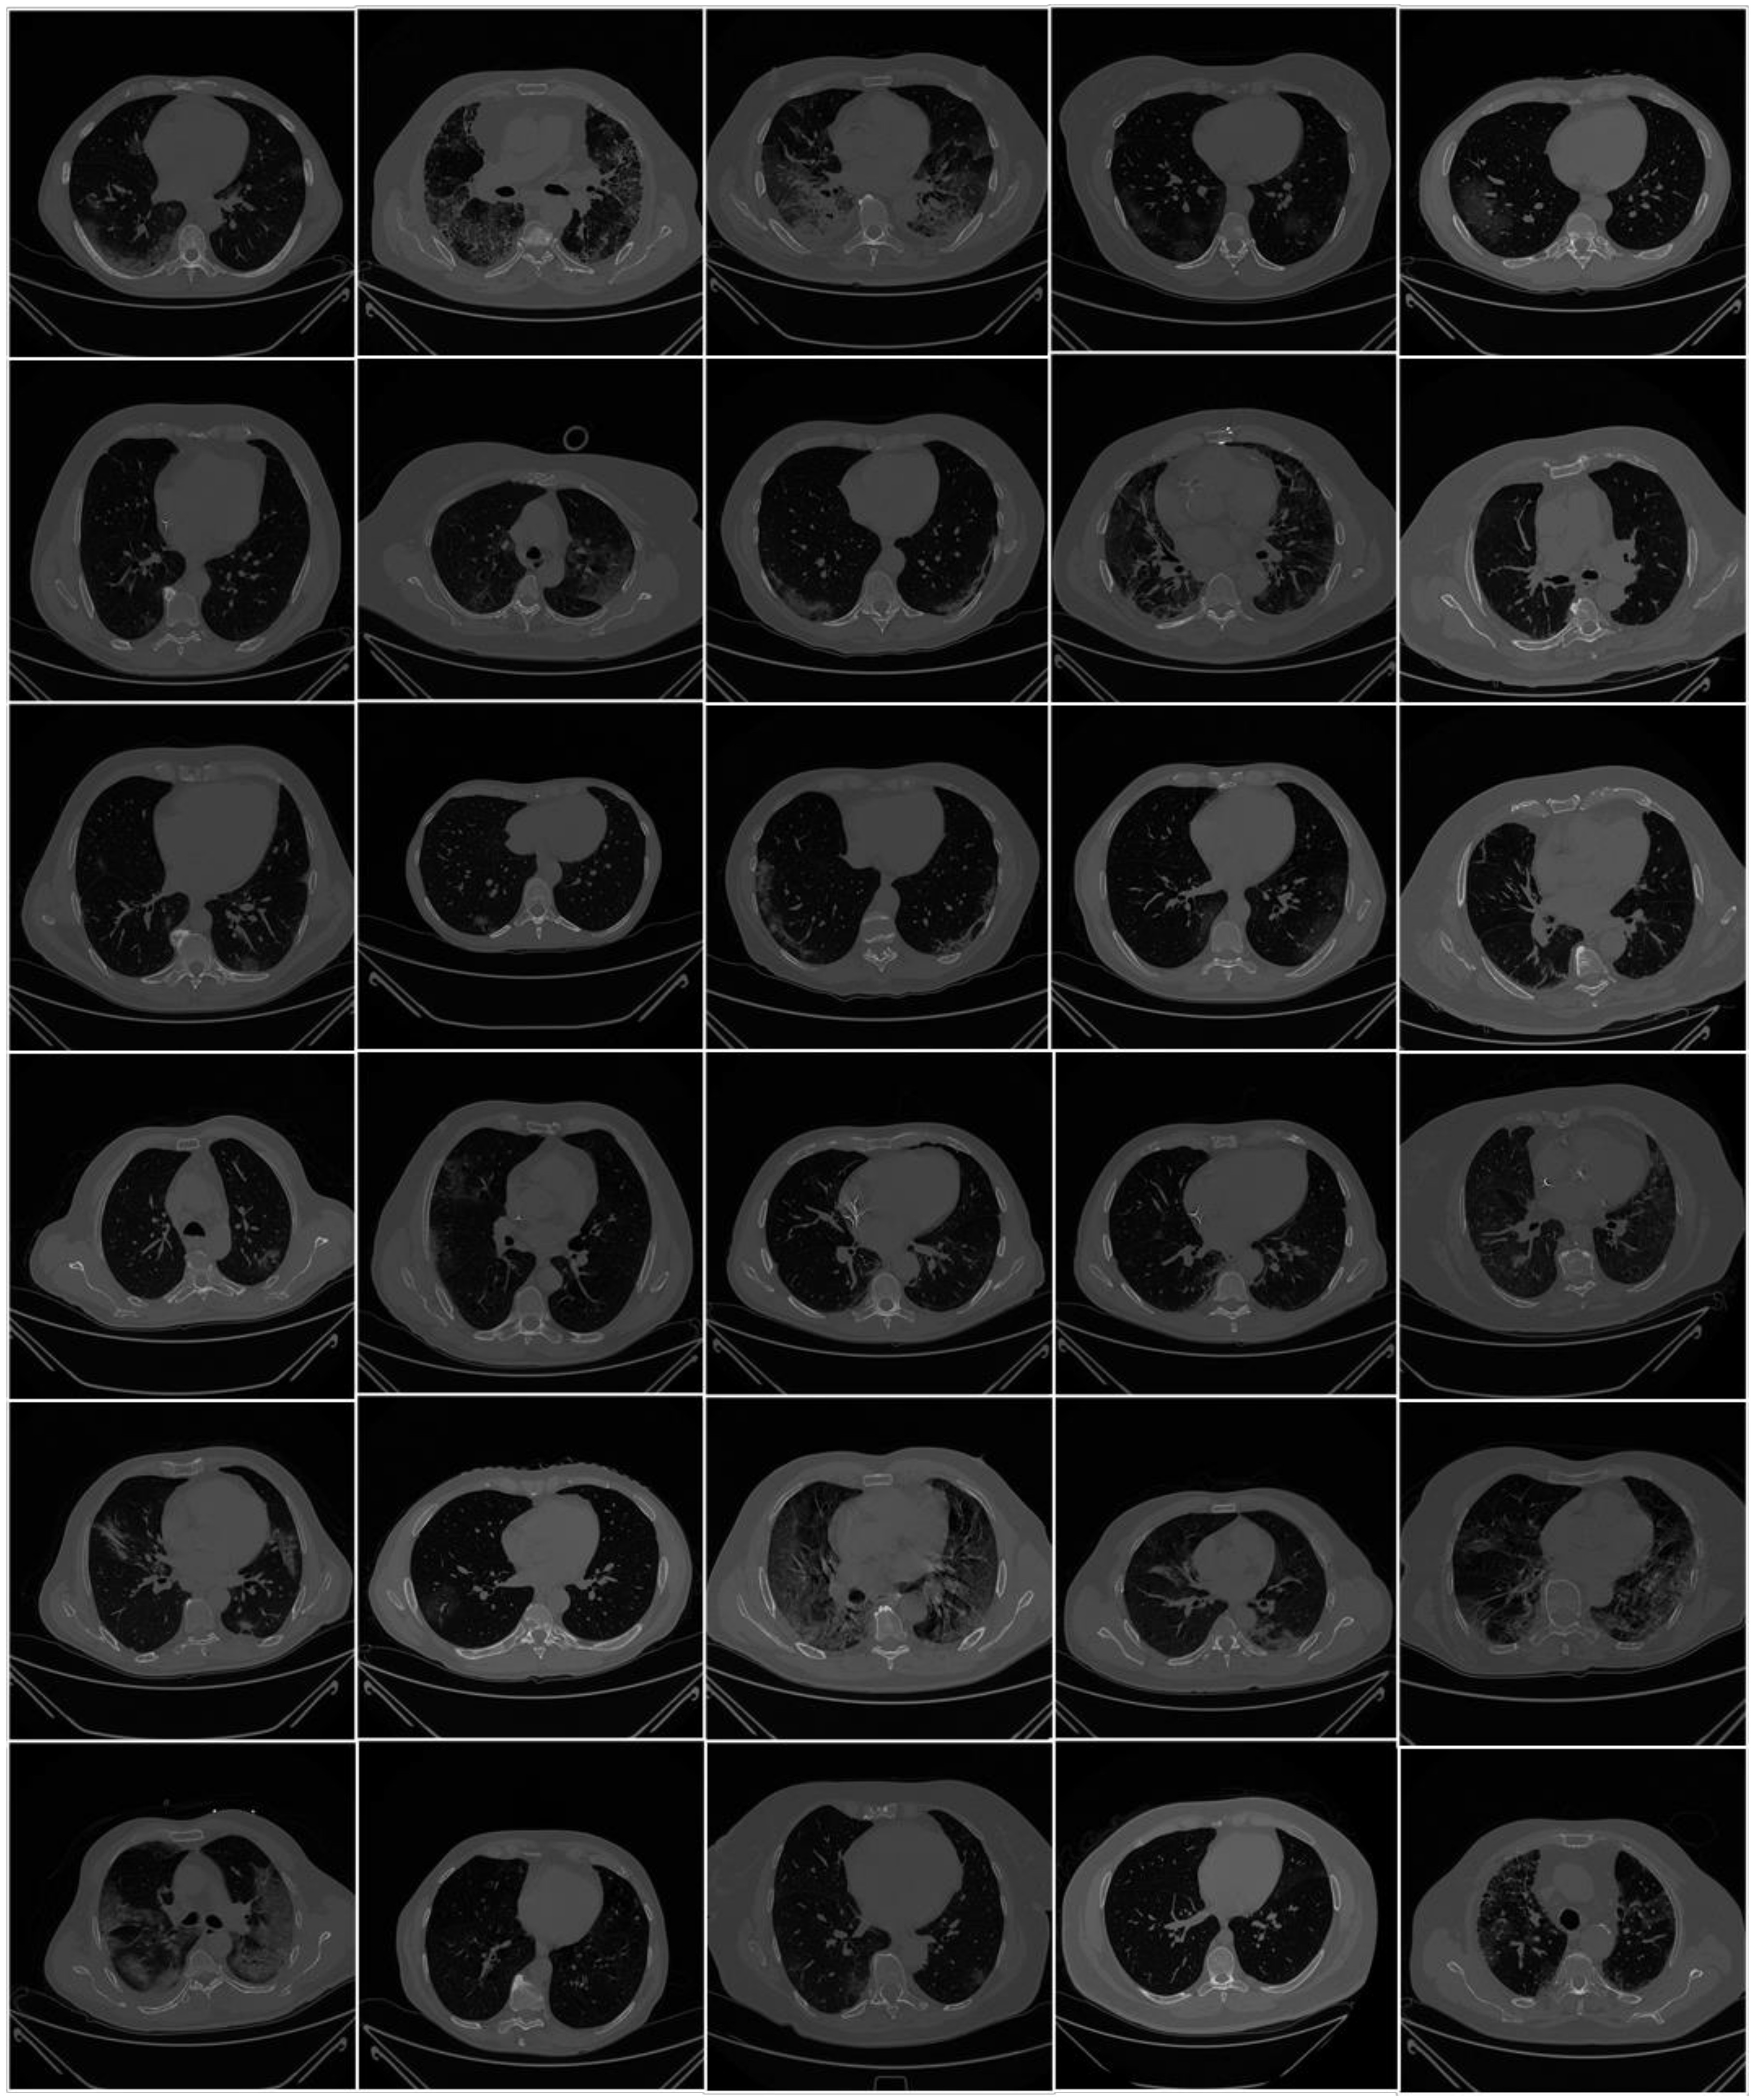
2.1. Patient Demographics, Image Acquisition, and Data Preparation
2.1.1. Demographics
2.1.2. Image Acquisition
2.1.3. Data Preparation
2.2. Architecture
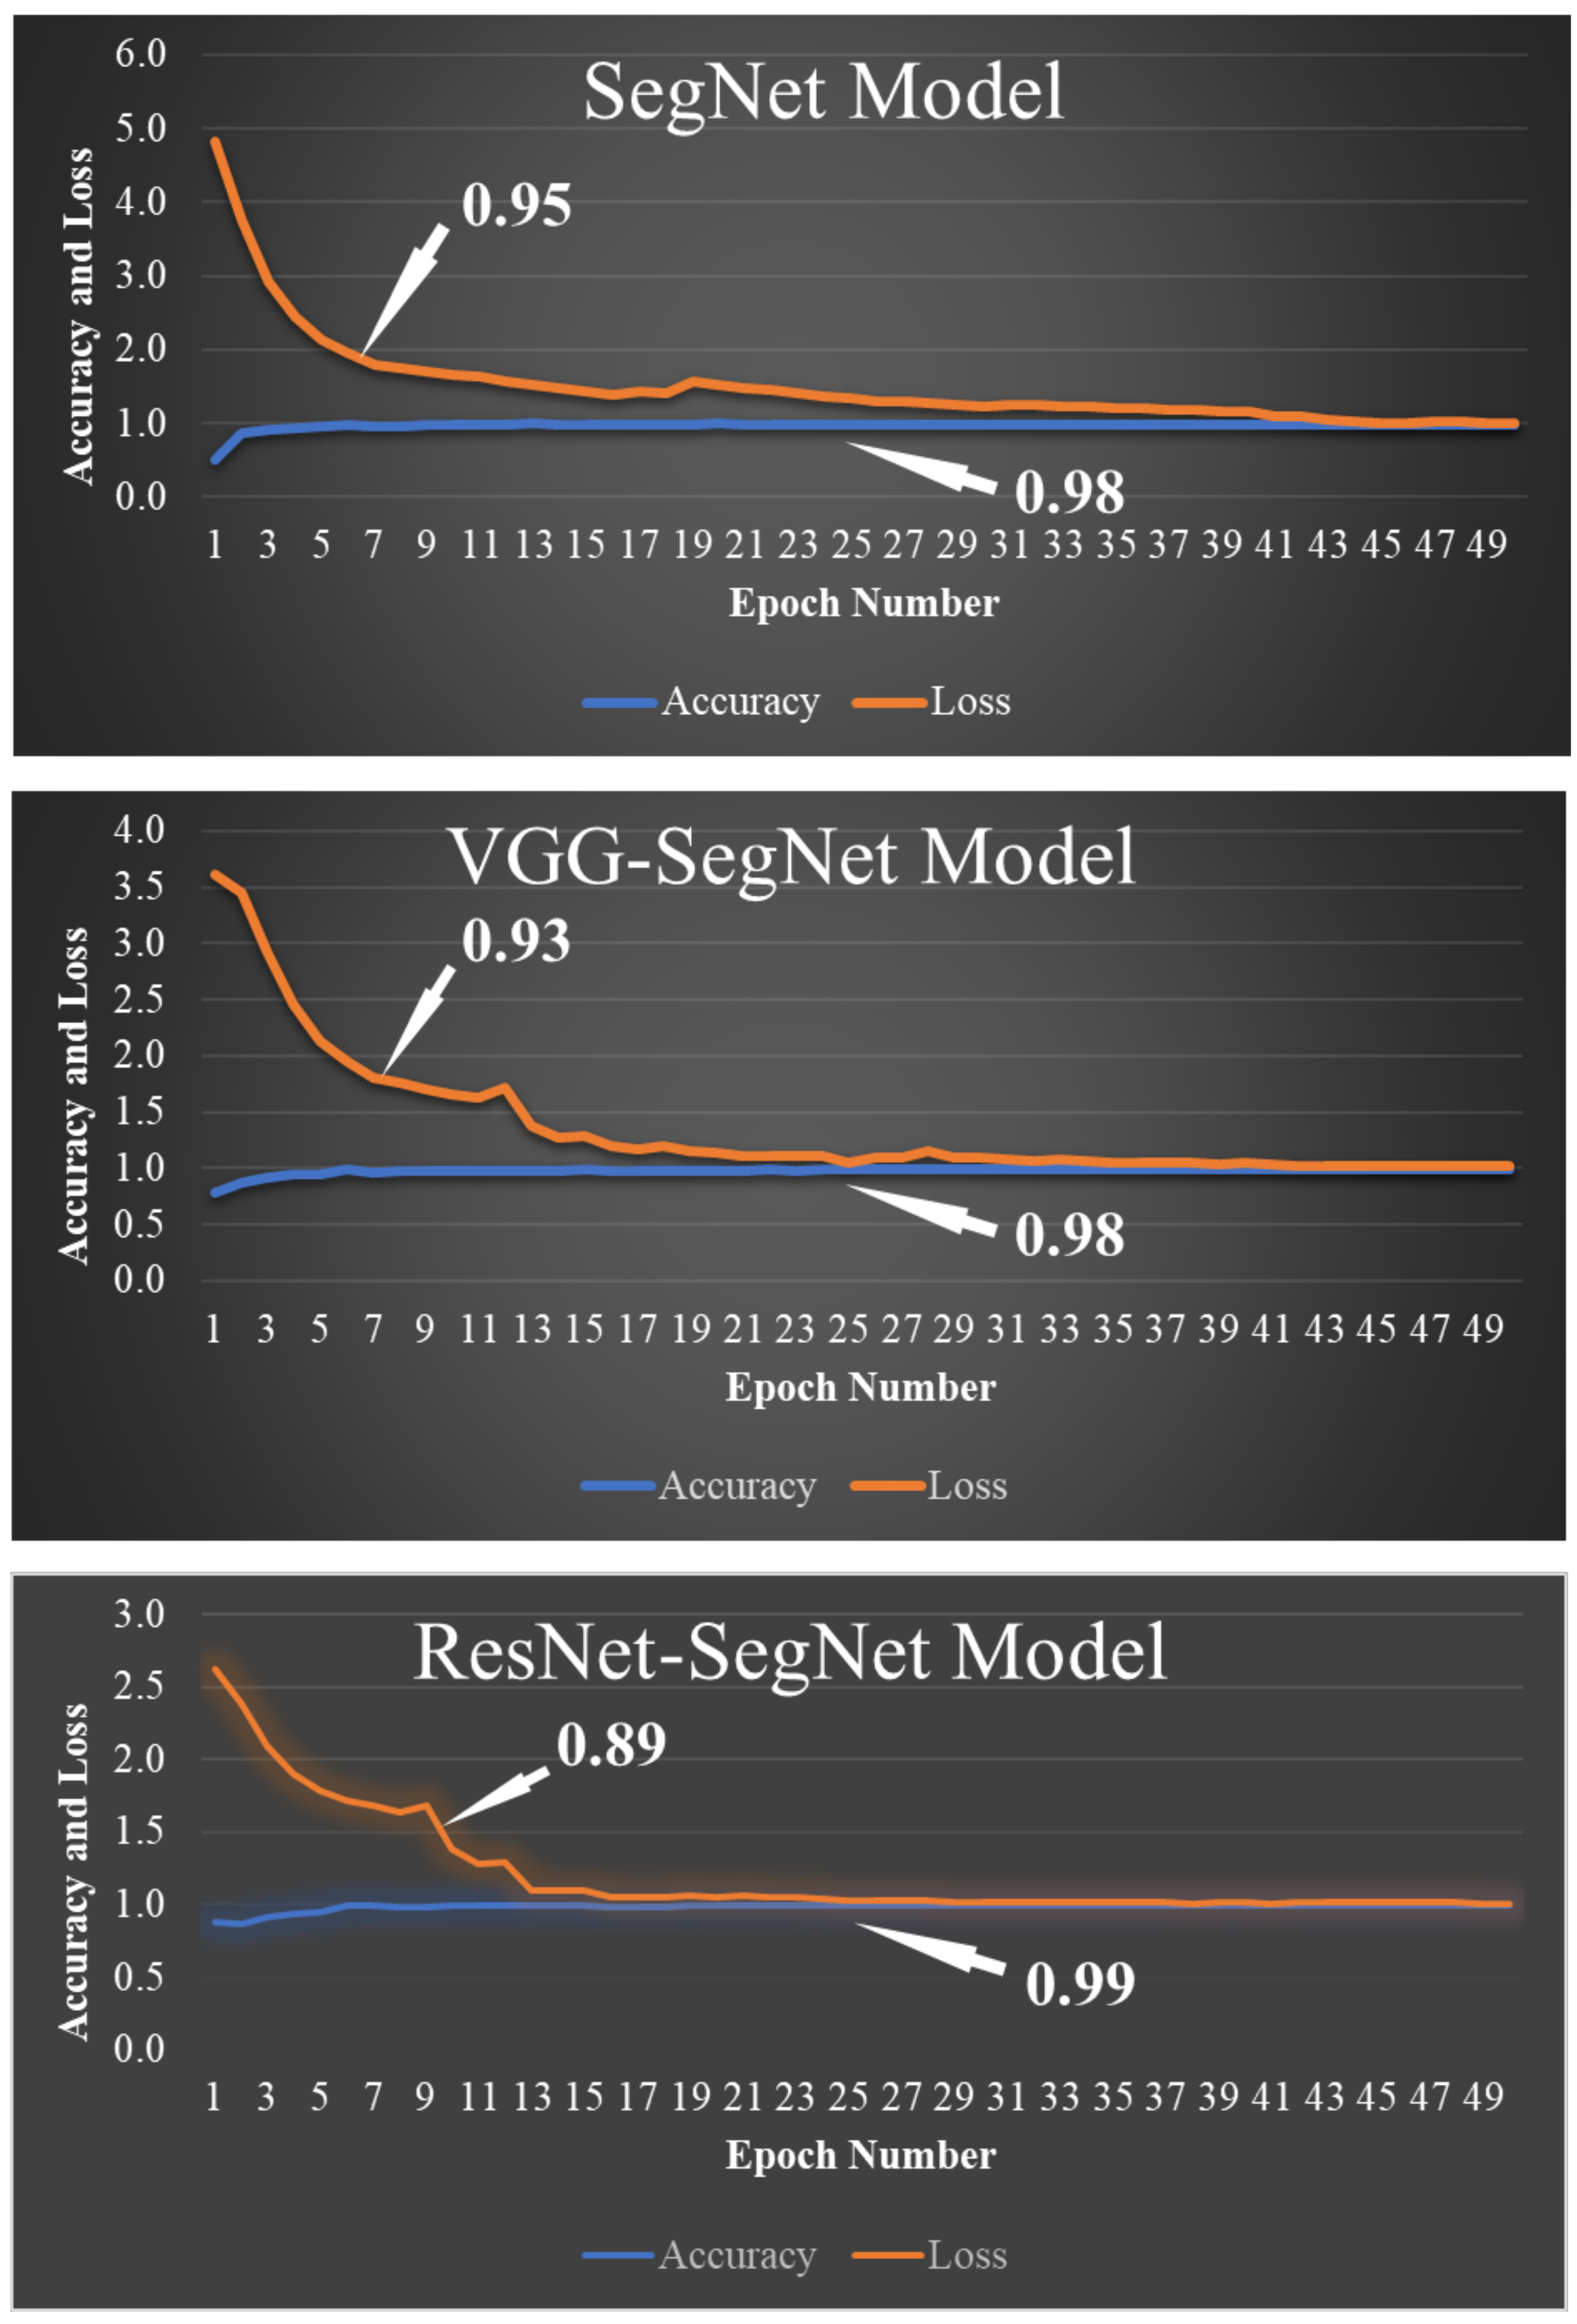
2.2.1. SegNet
2.2.2. VGG-SegNet
2.2.3. ResNet-SegNet
2.2.4. NIH Segmentation Model
2.2.5. Loss Functions for SDL and HDL Models
2.3. Sample Size Calculation
3. Experimental Protocol
3.1. Cross-Validation
3.2. Lung Quantification
3.3. Accuracy Computation
4. Results and Performance Evaluation
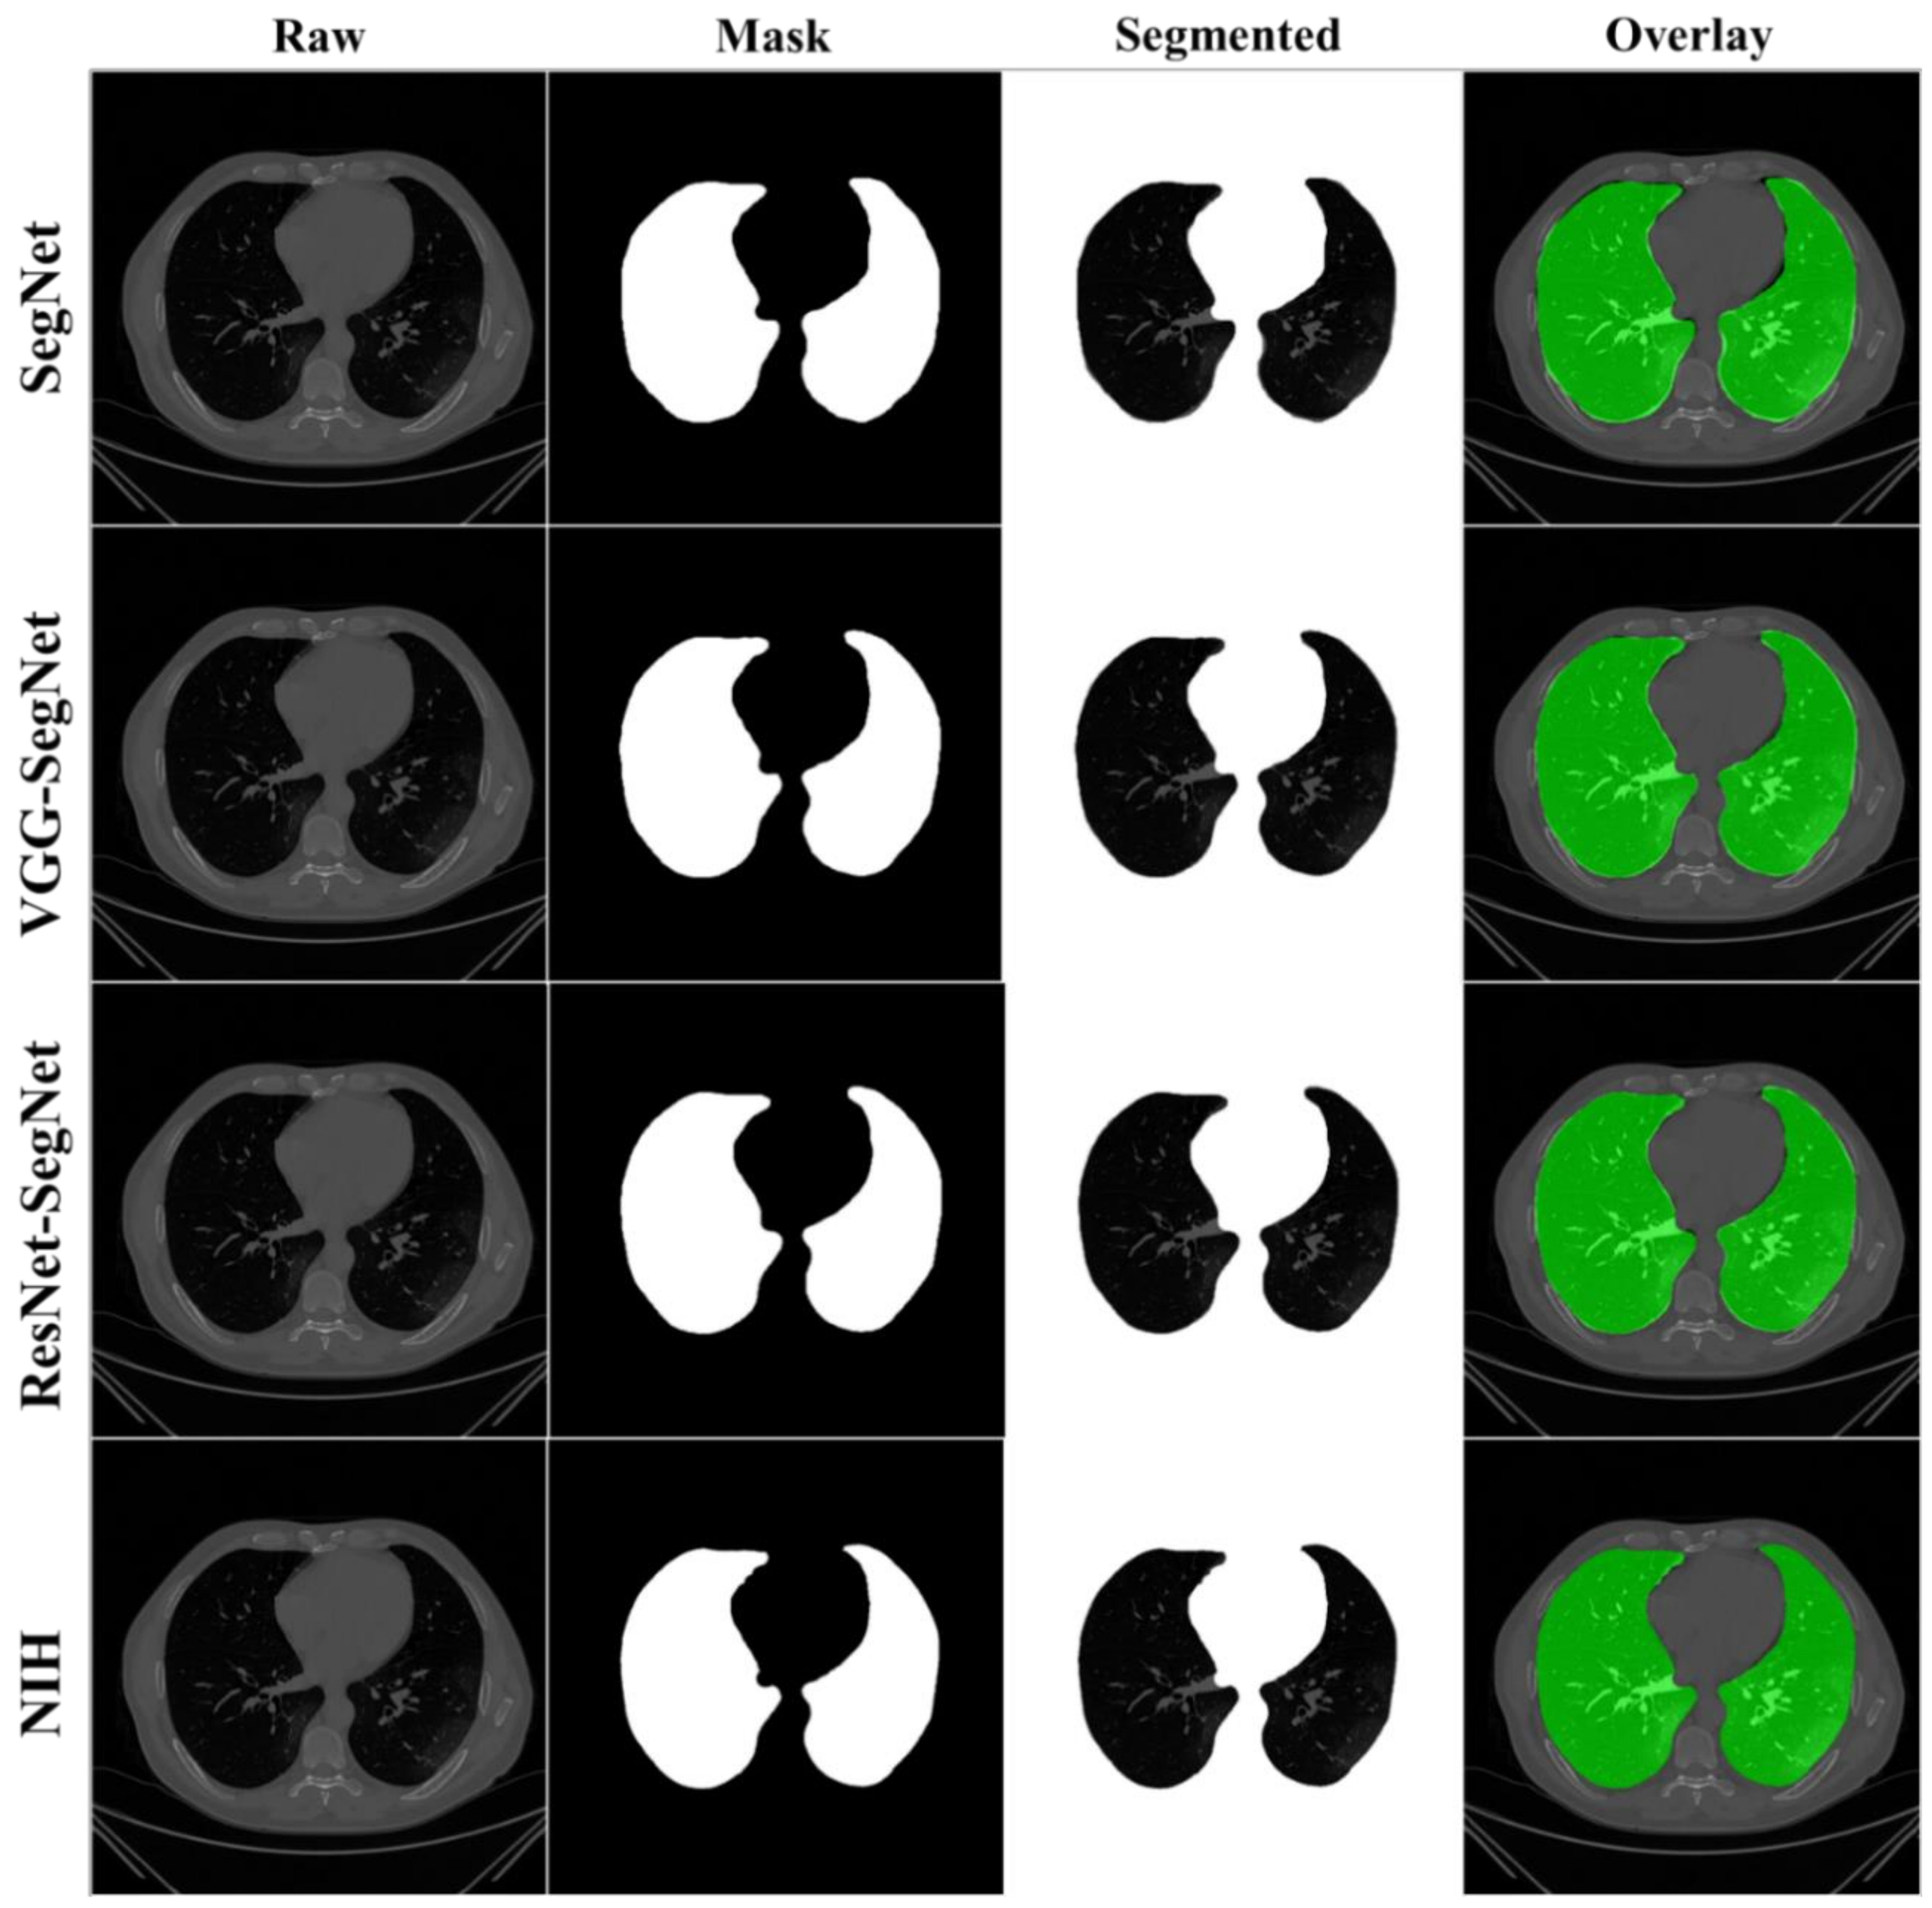
4.1. Results
4.2. Performance Evaluation
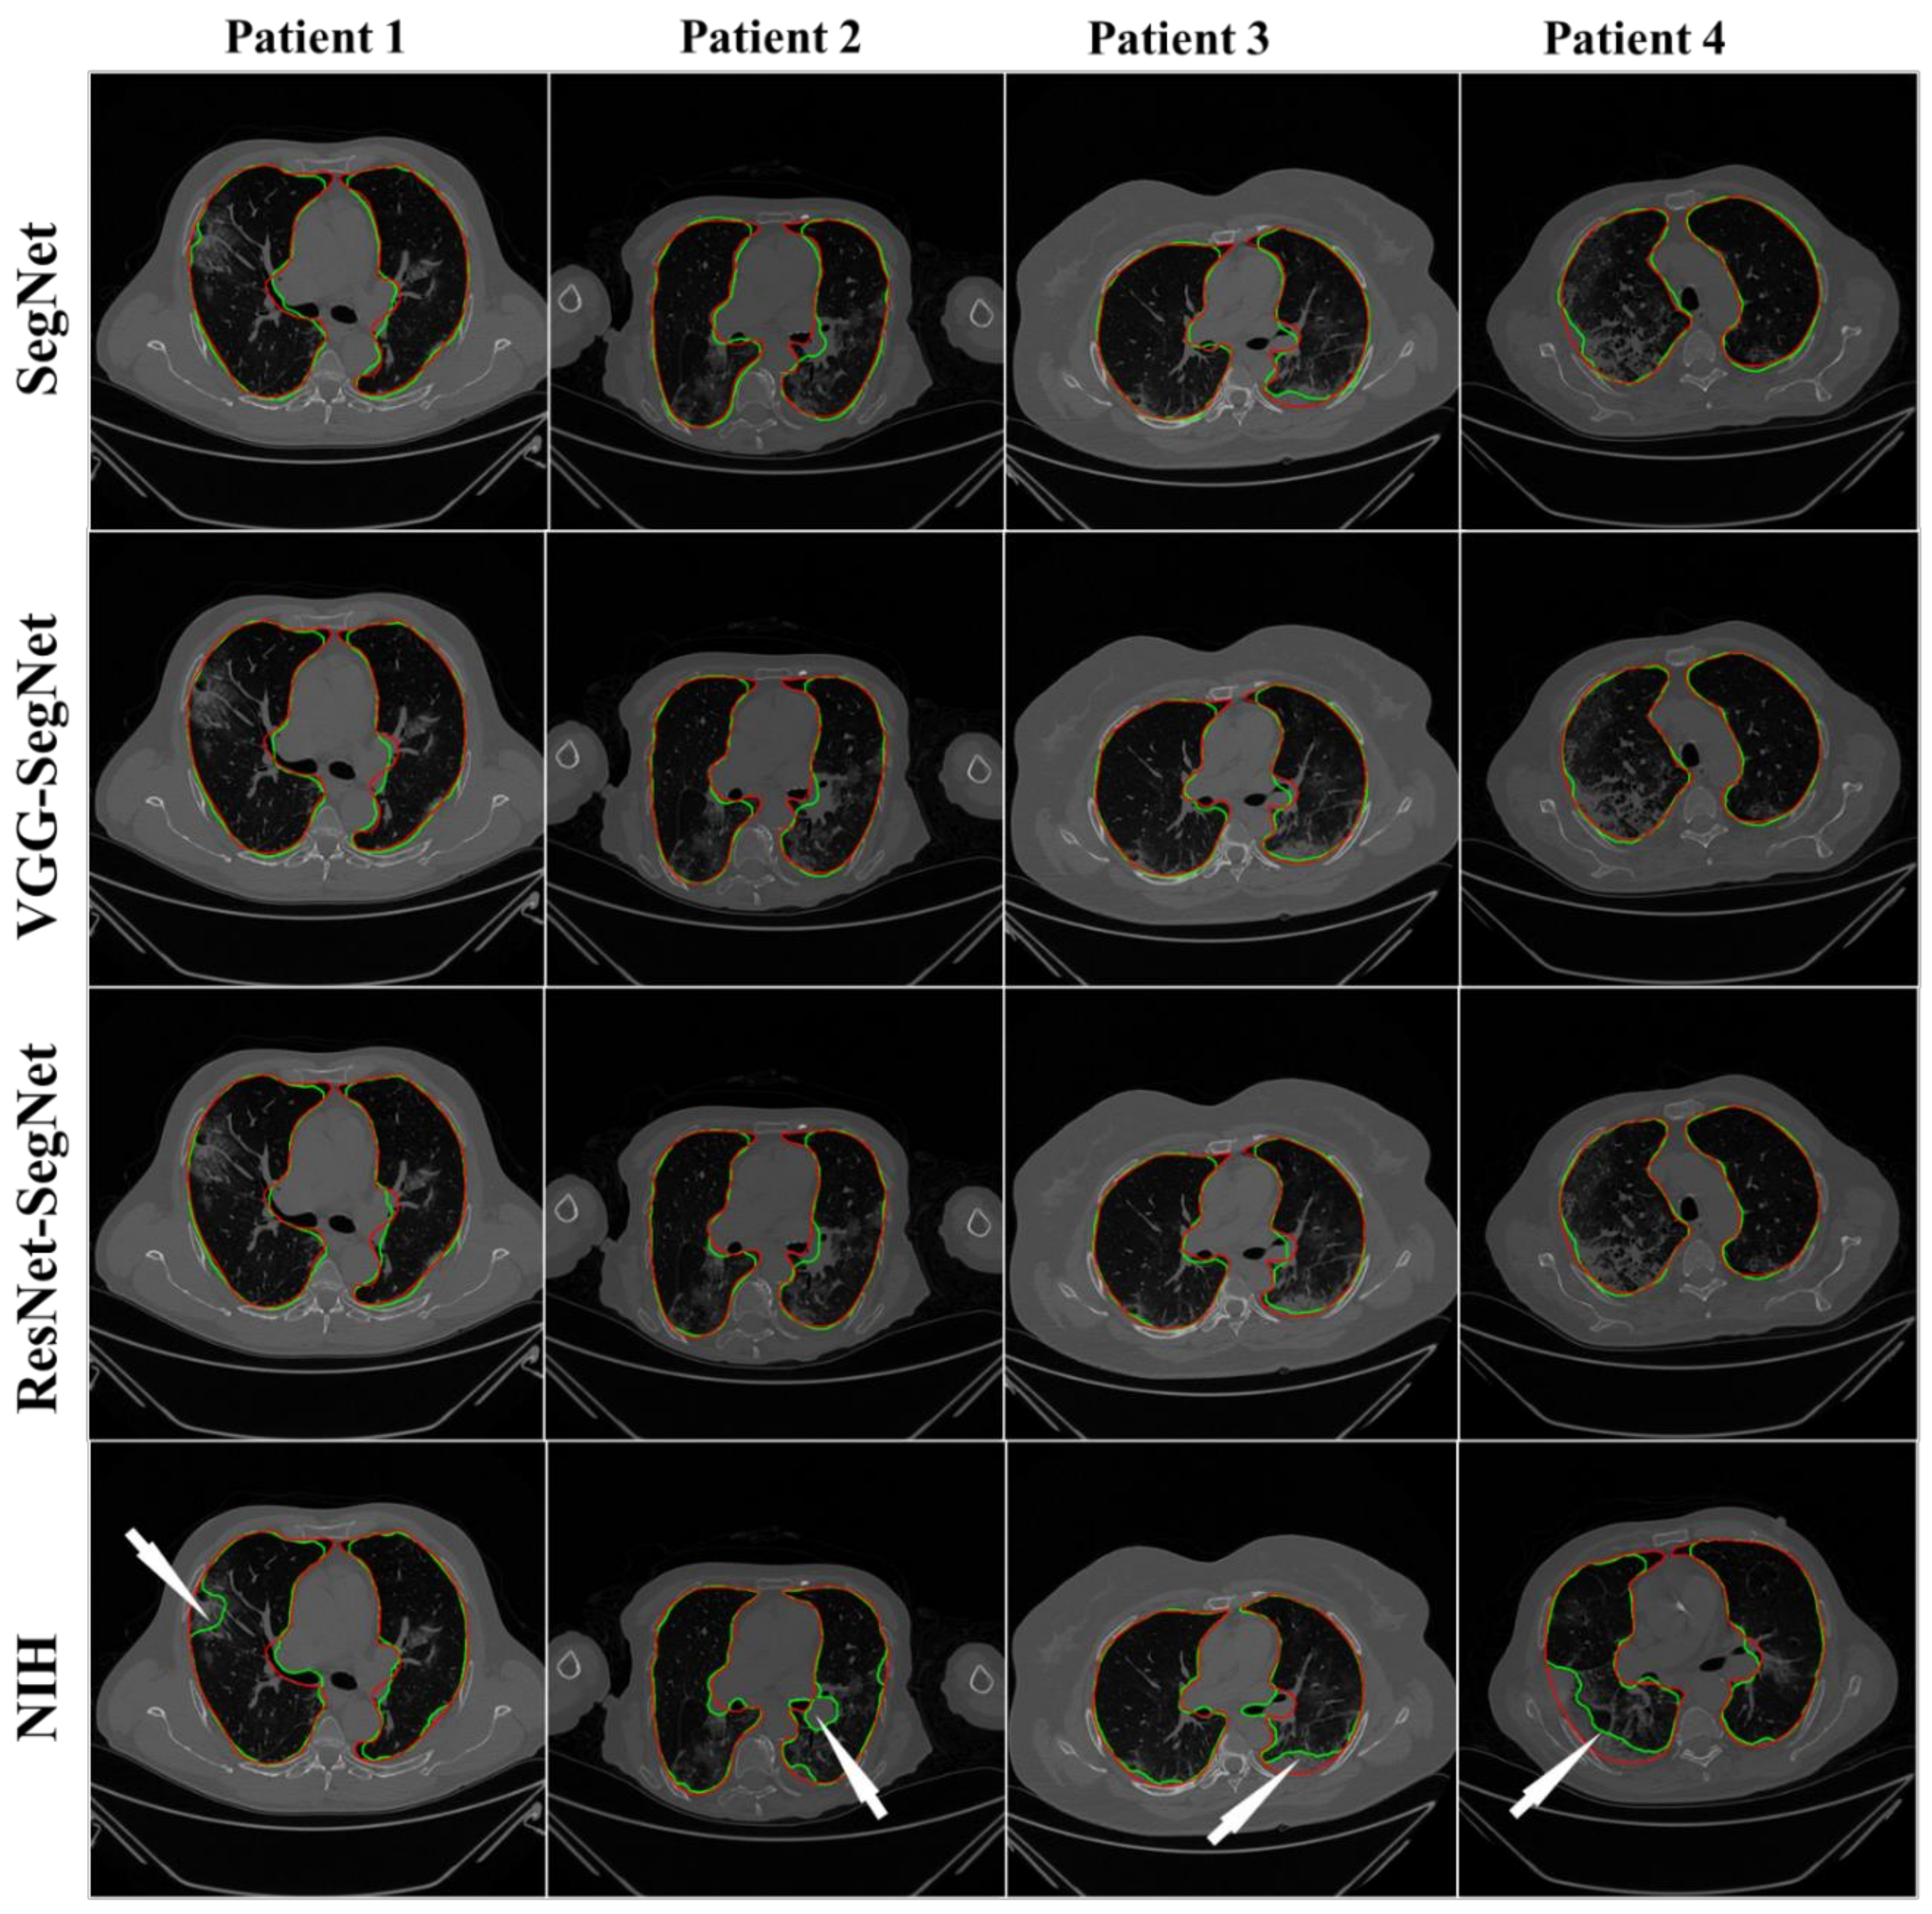
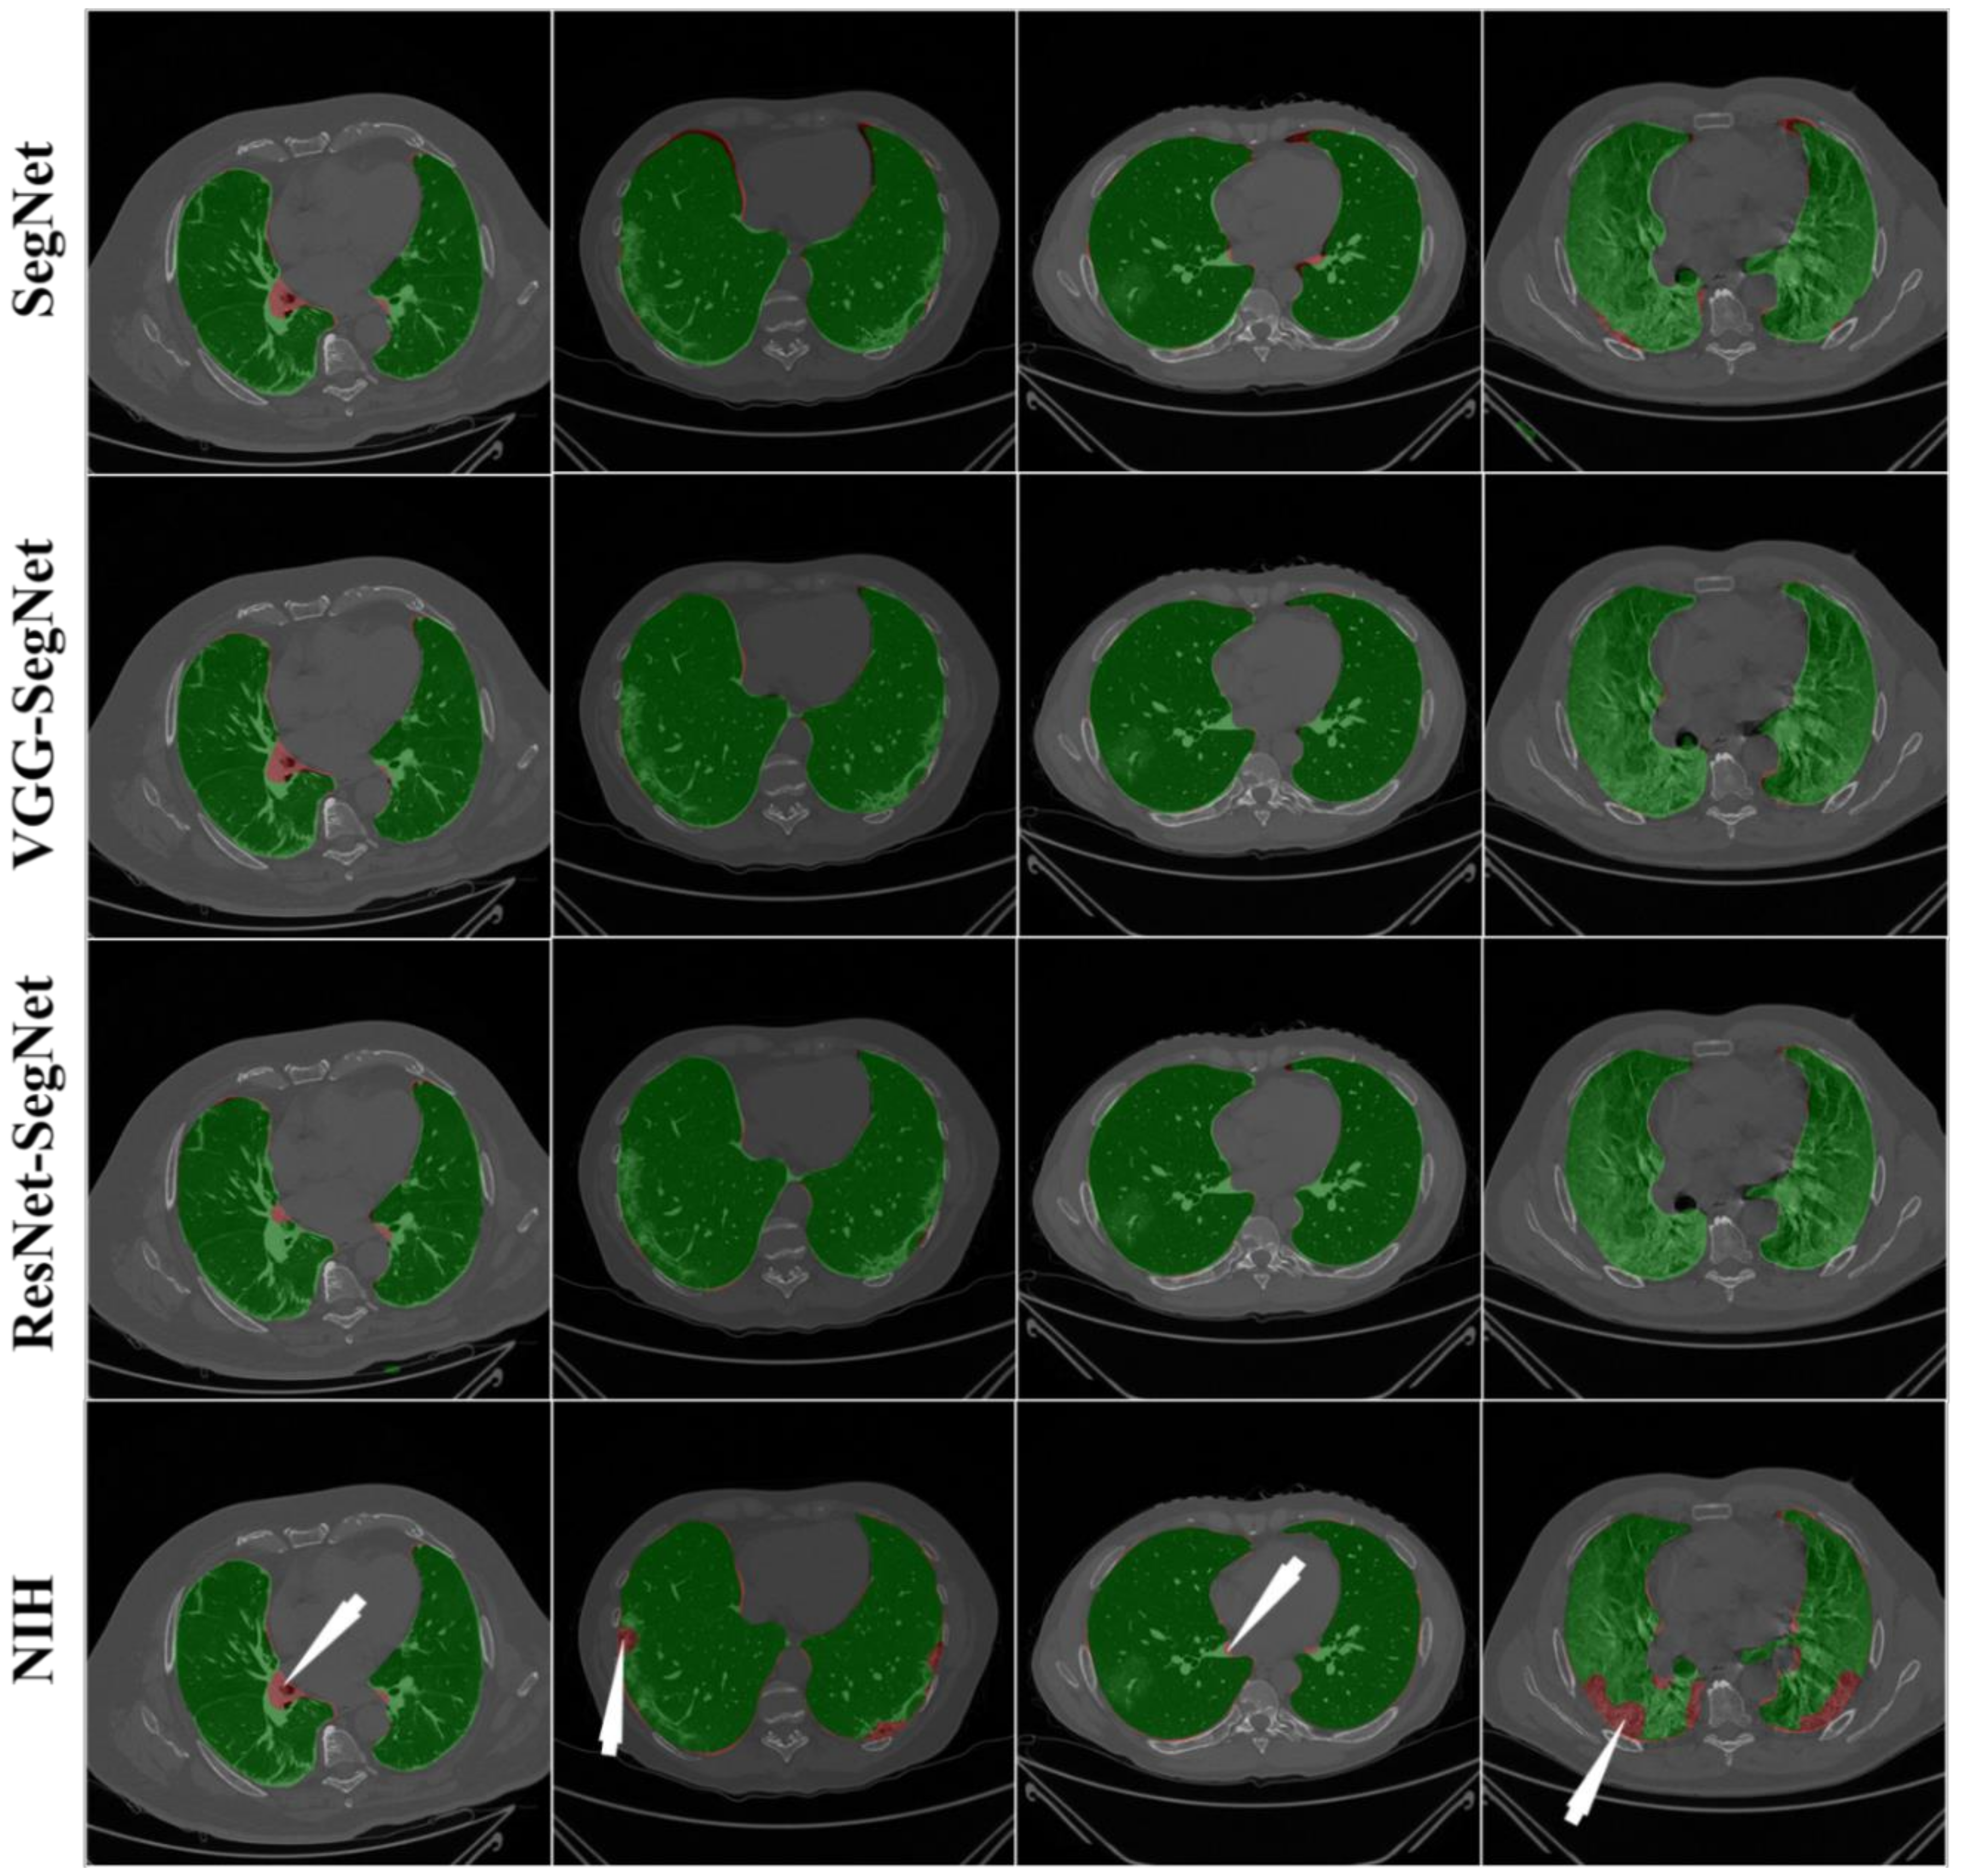
4.2.1. Visualization of Lung Boundary and Regional Lung Error
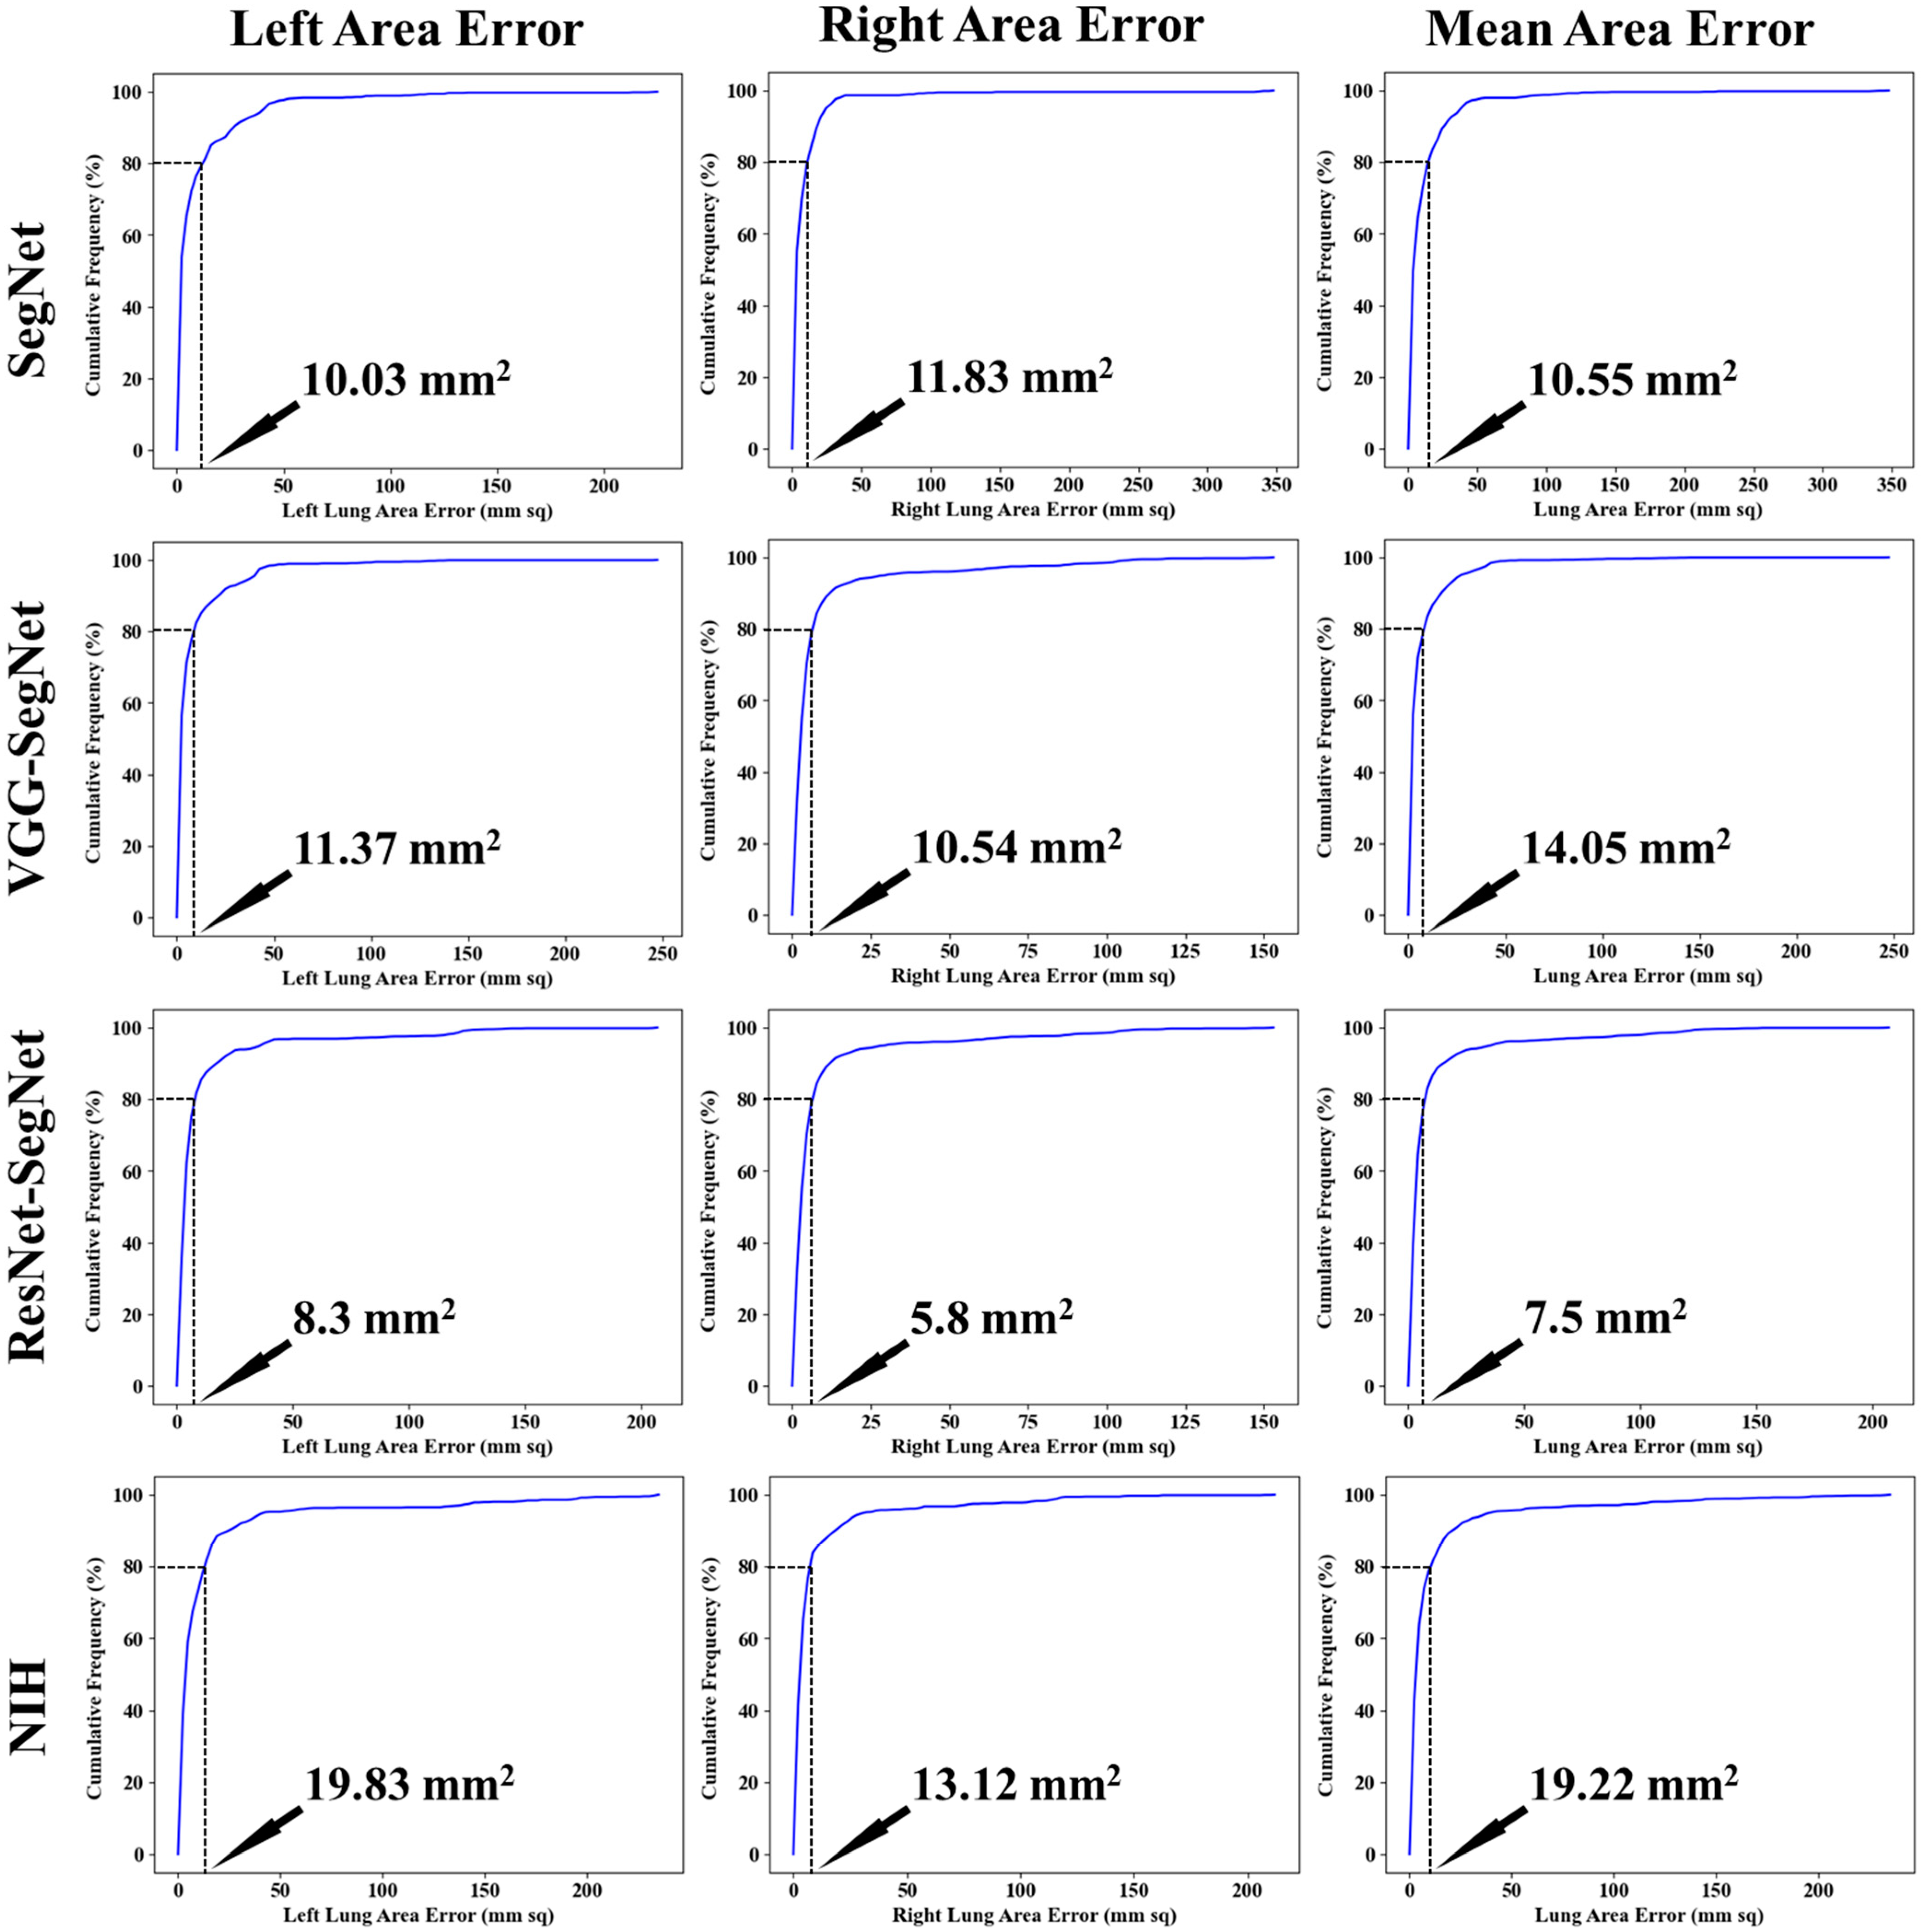
4.2.2. Performance Metrics for the Lung Area Error
Cumulative Plot for Lung Area Error
Lung Area Error
Correlation Plots for Lung Area
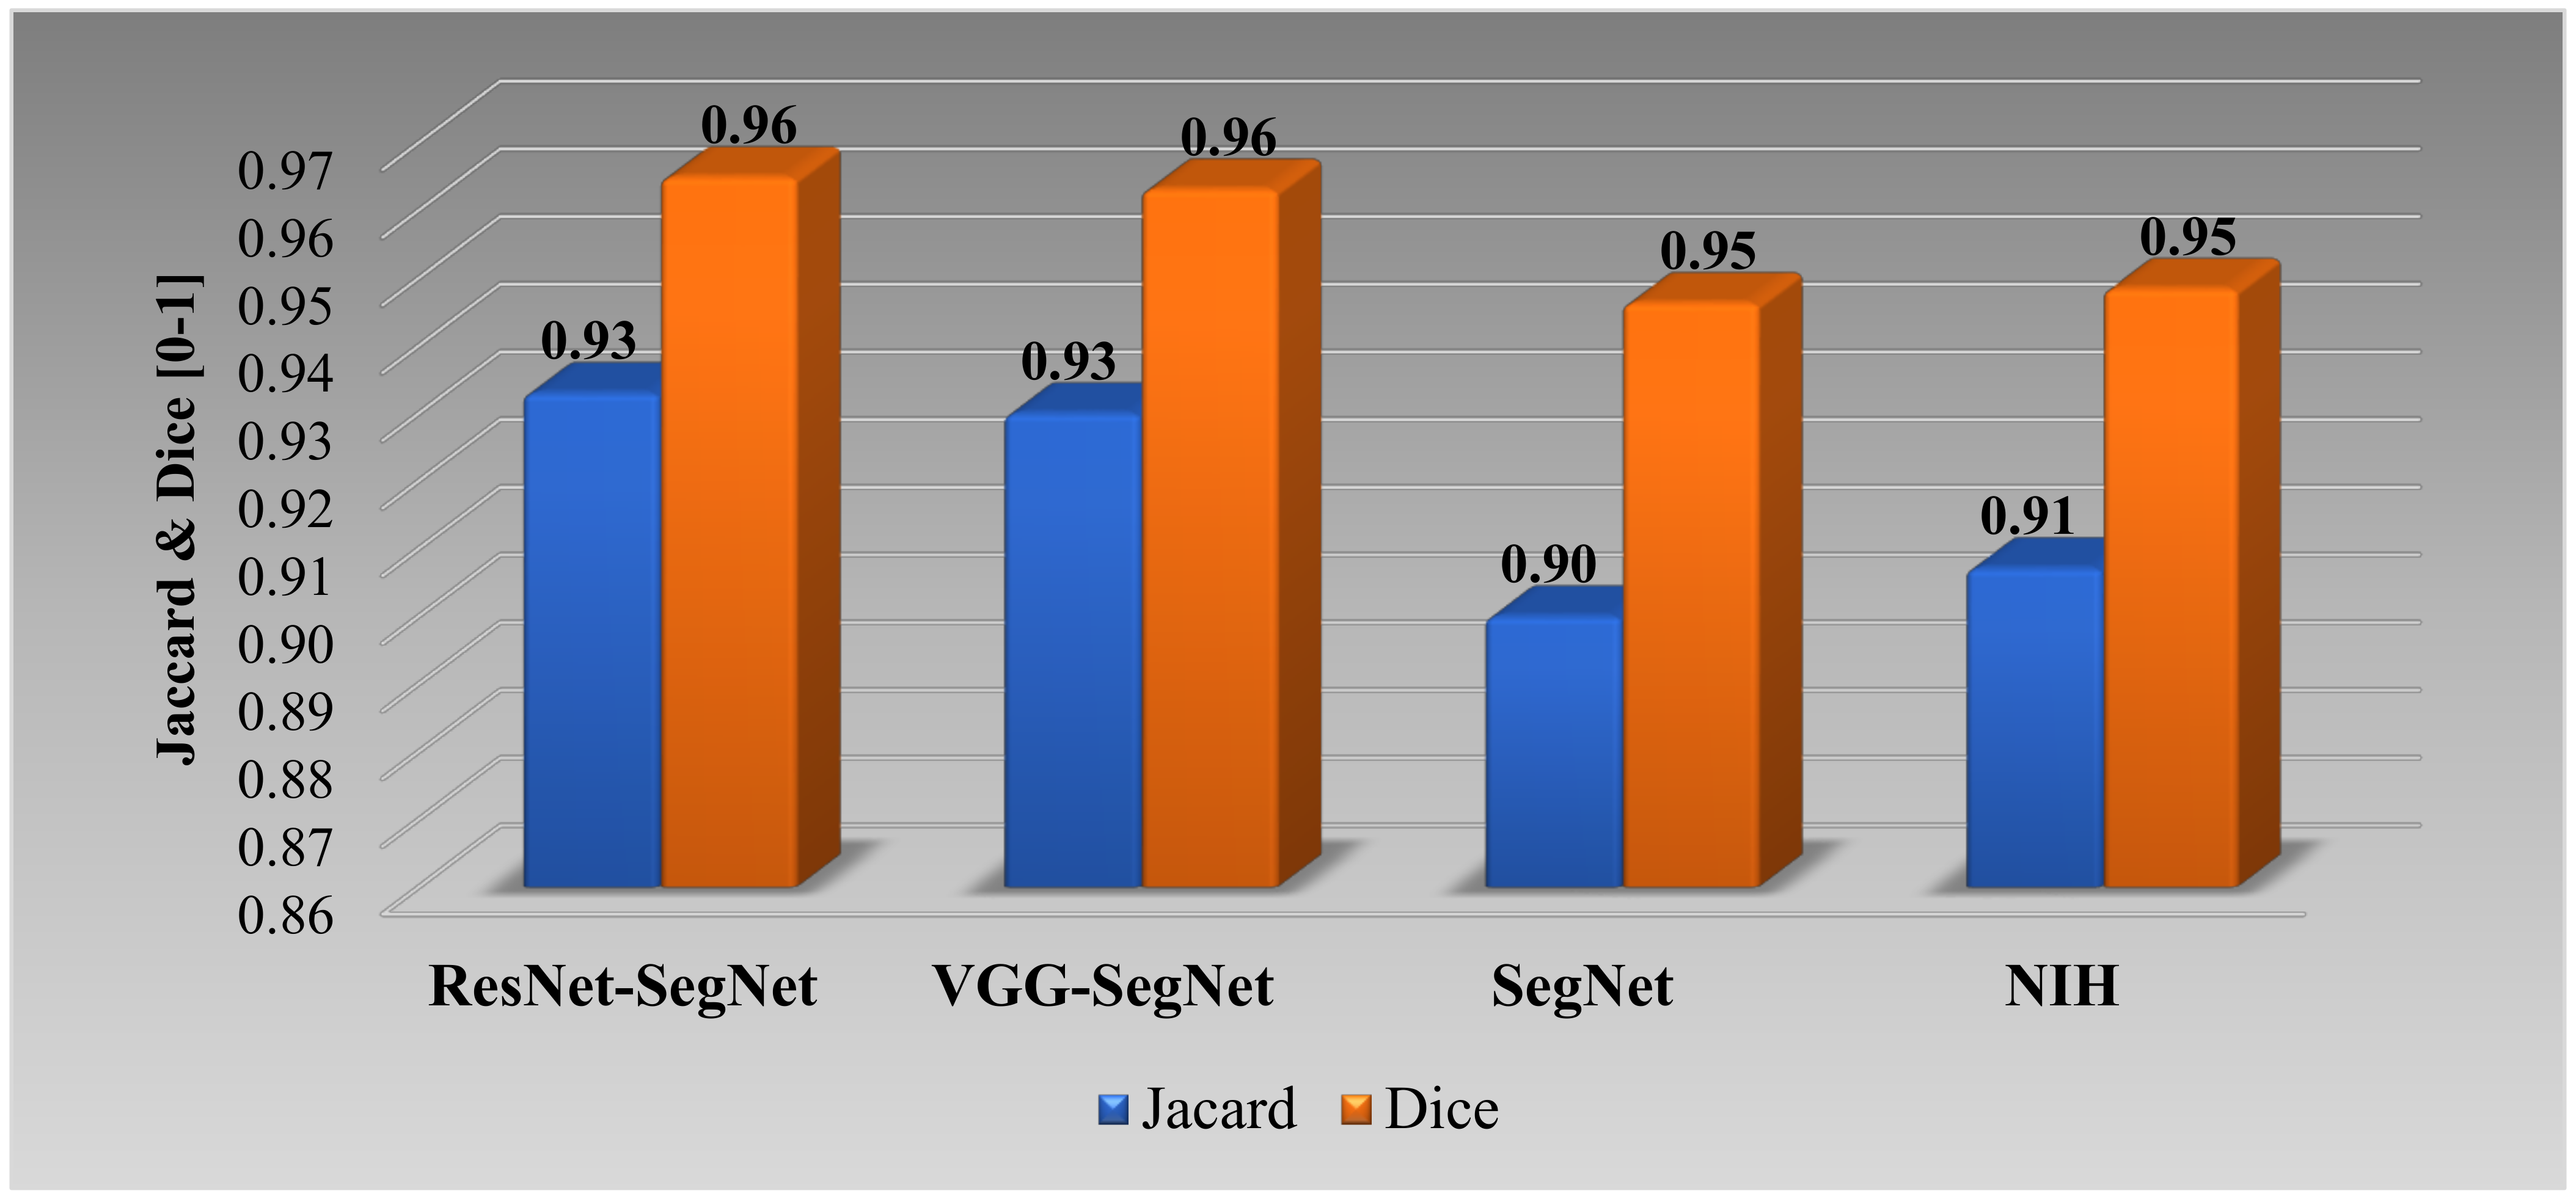
Jaccard Index and Dice Similarity for Lung Area
Bland–Altman Plot for Lung Area
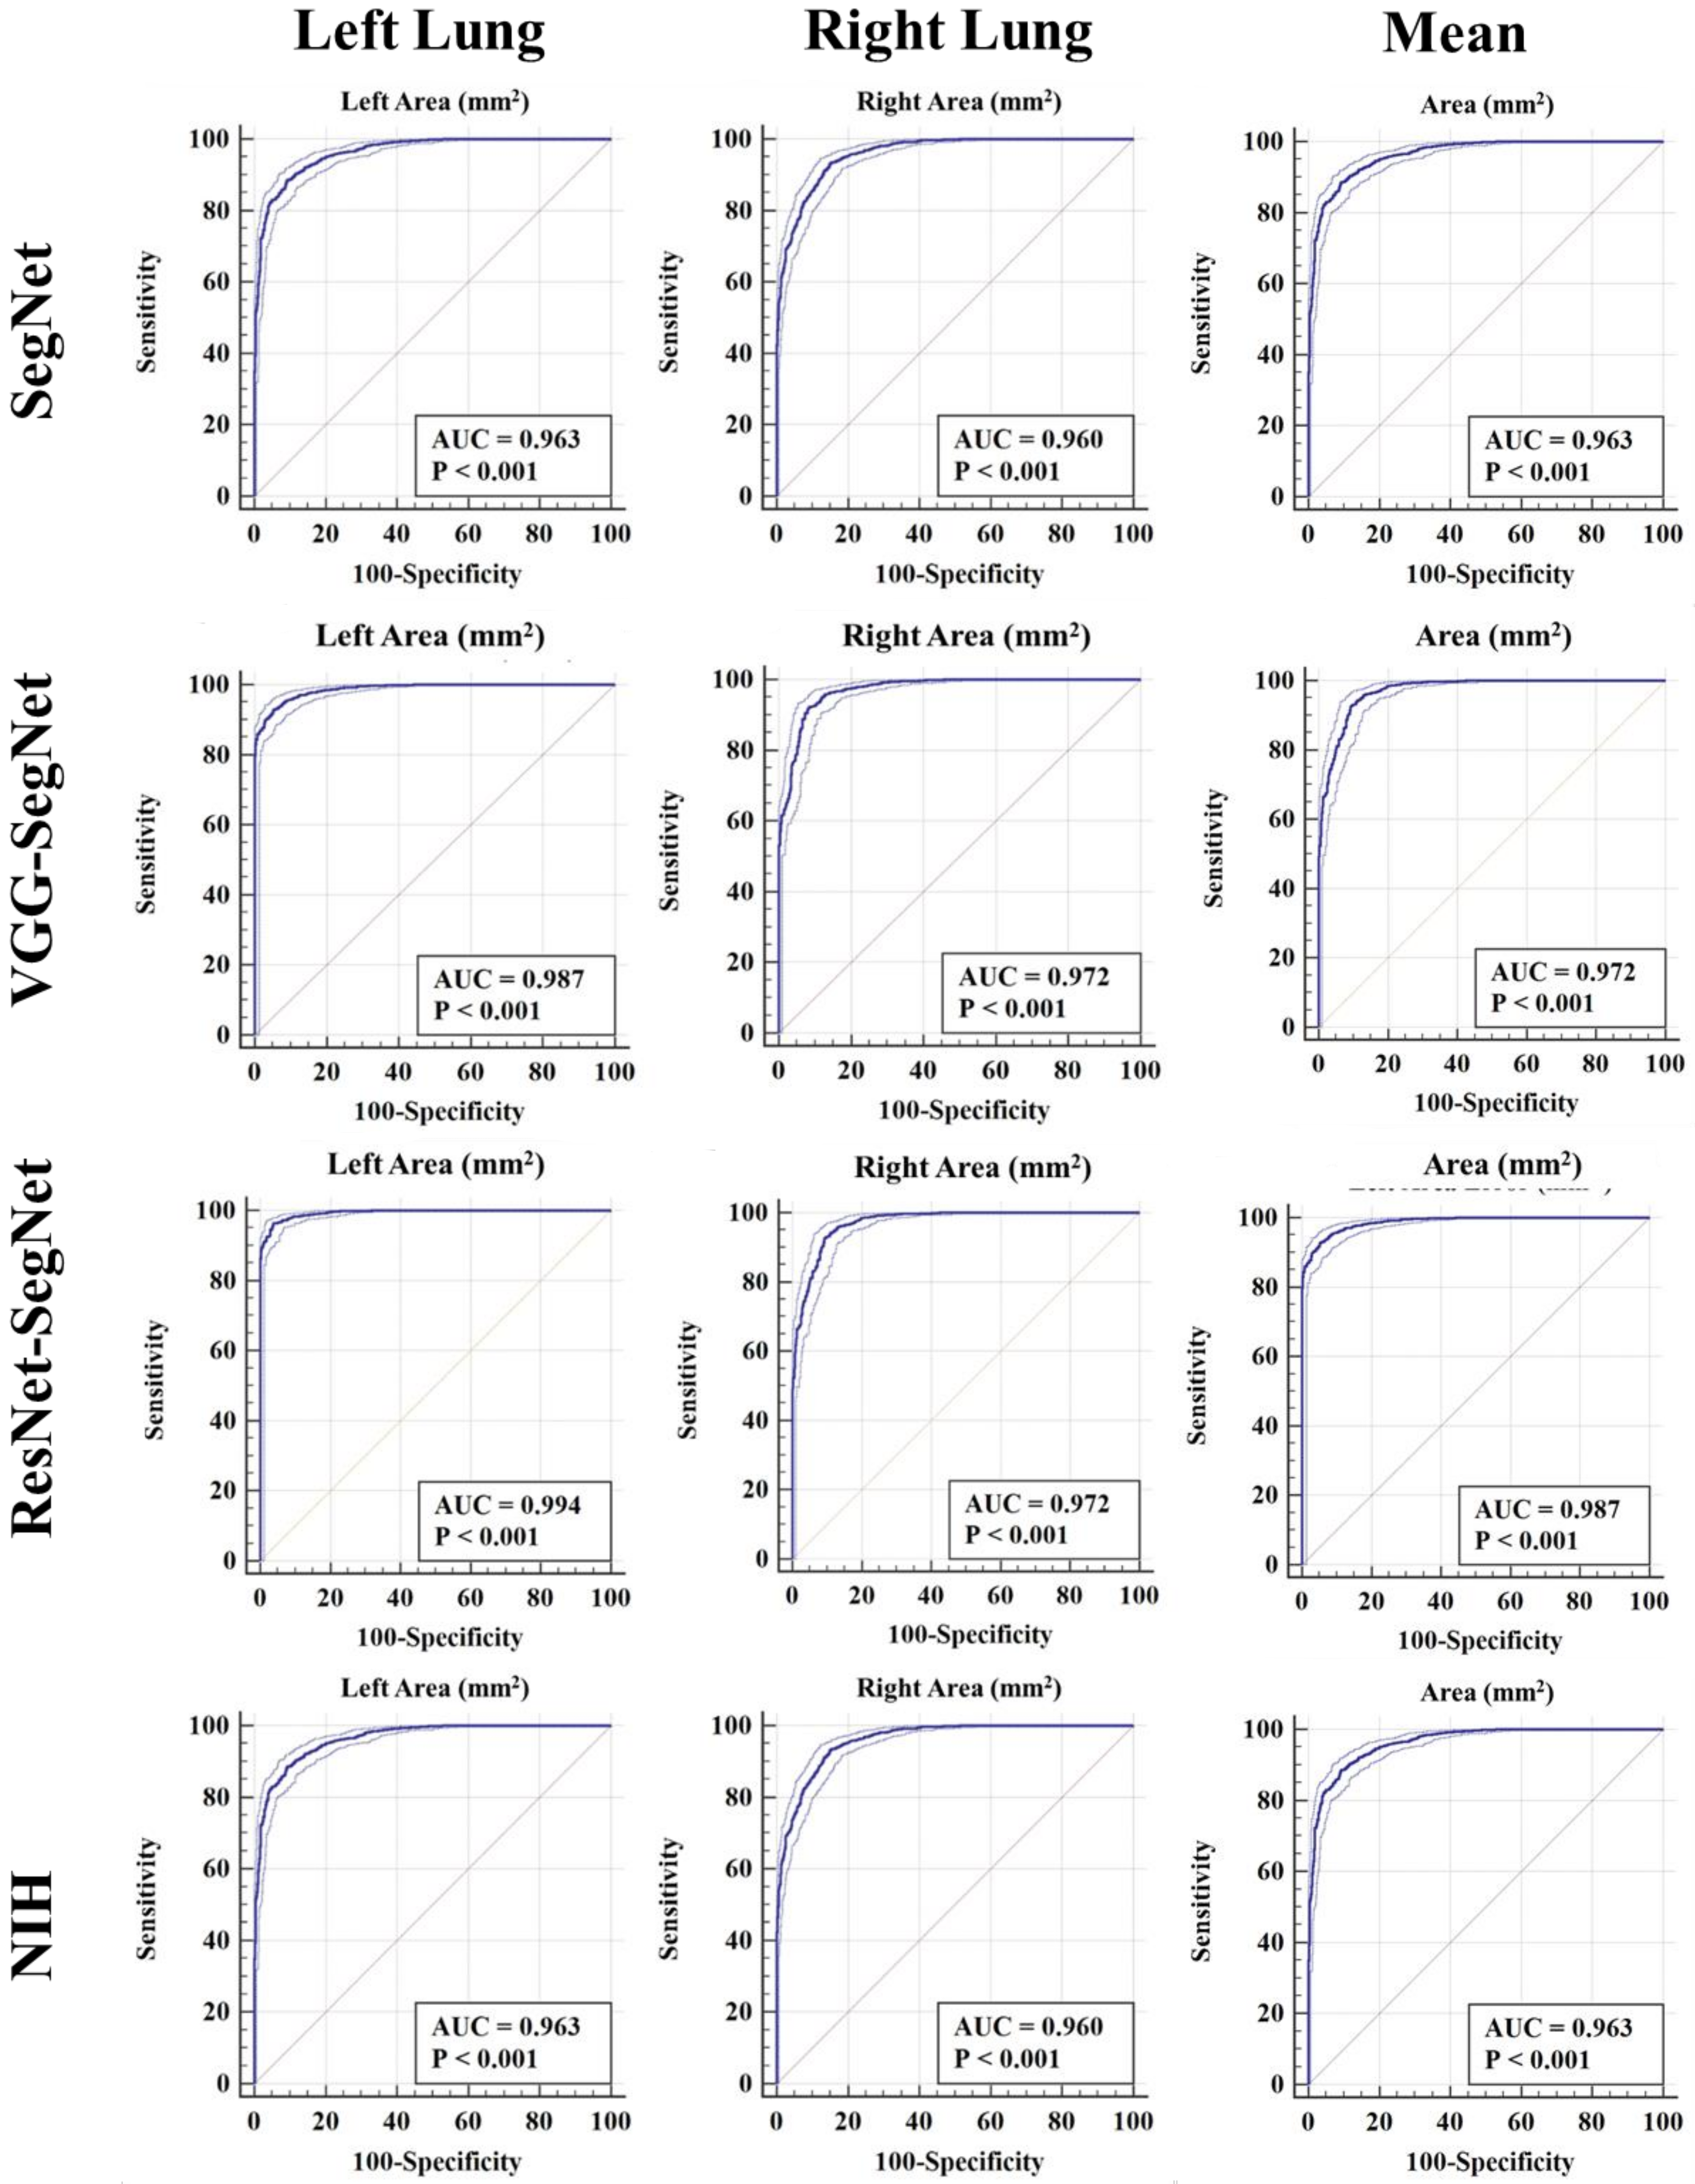
ROC Plots for Lung Area
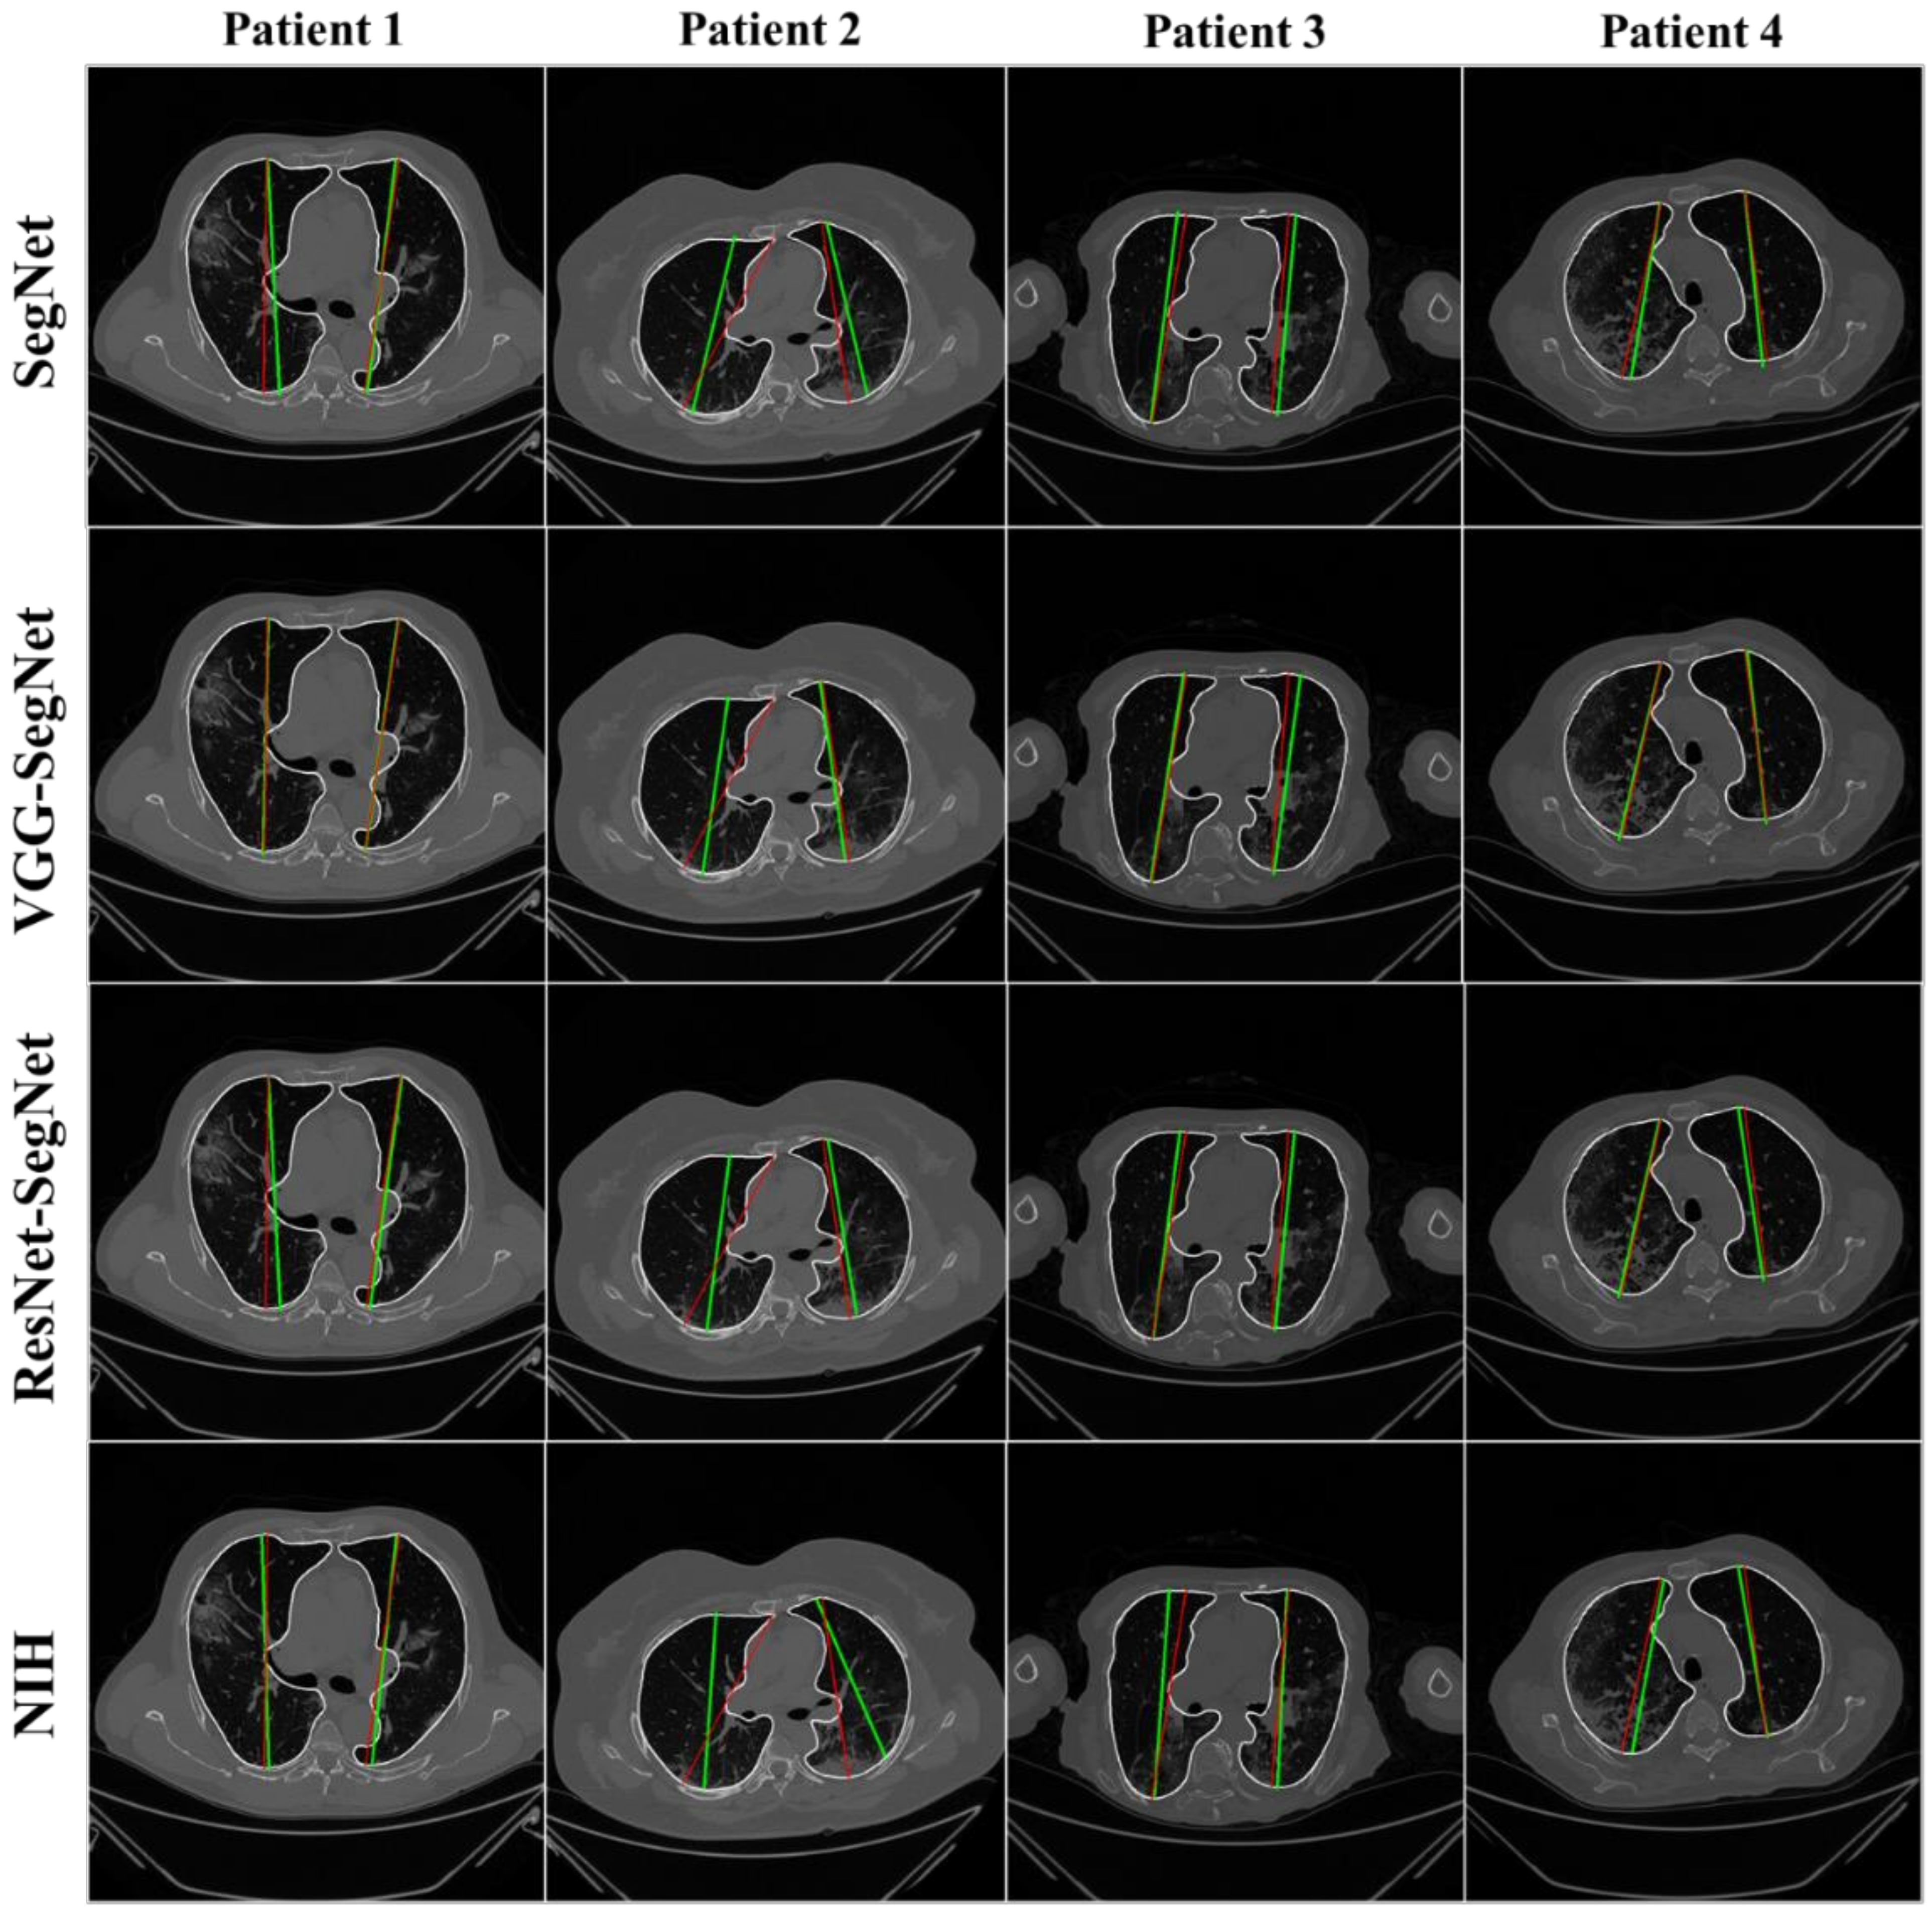
4.2.3. Performance Evaluation Using Lung Long Axis Error
Cumulative Frequency Plot for Lung Long Axis Error
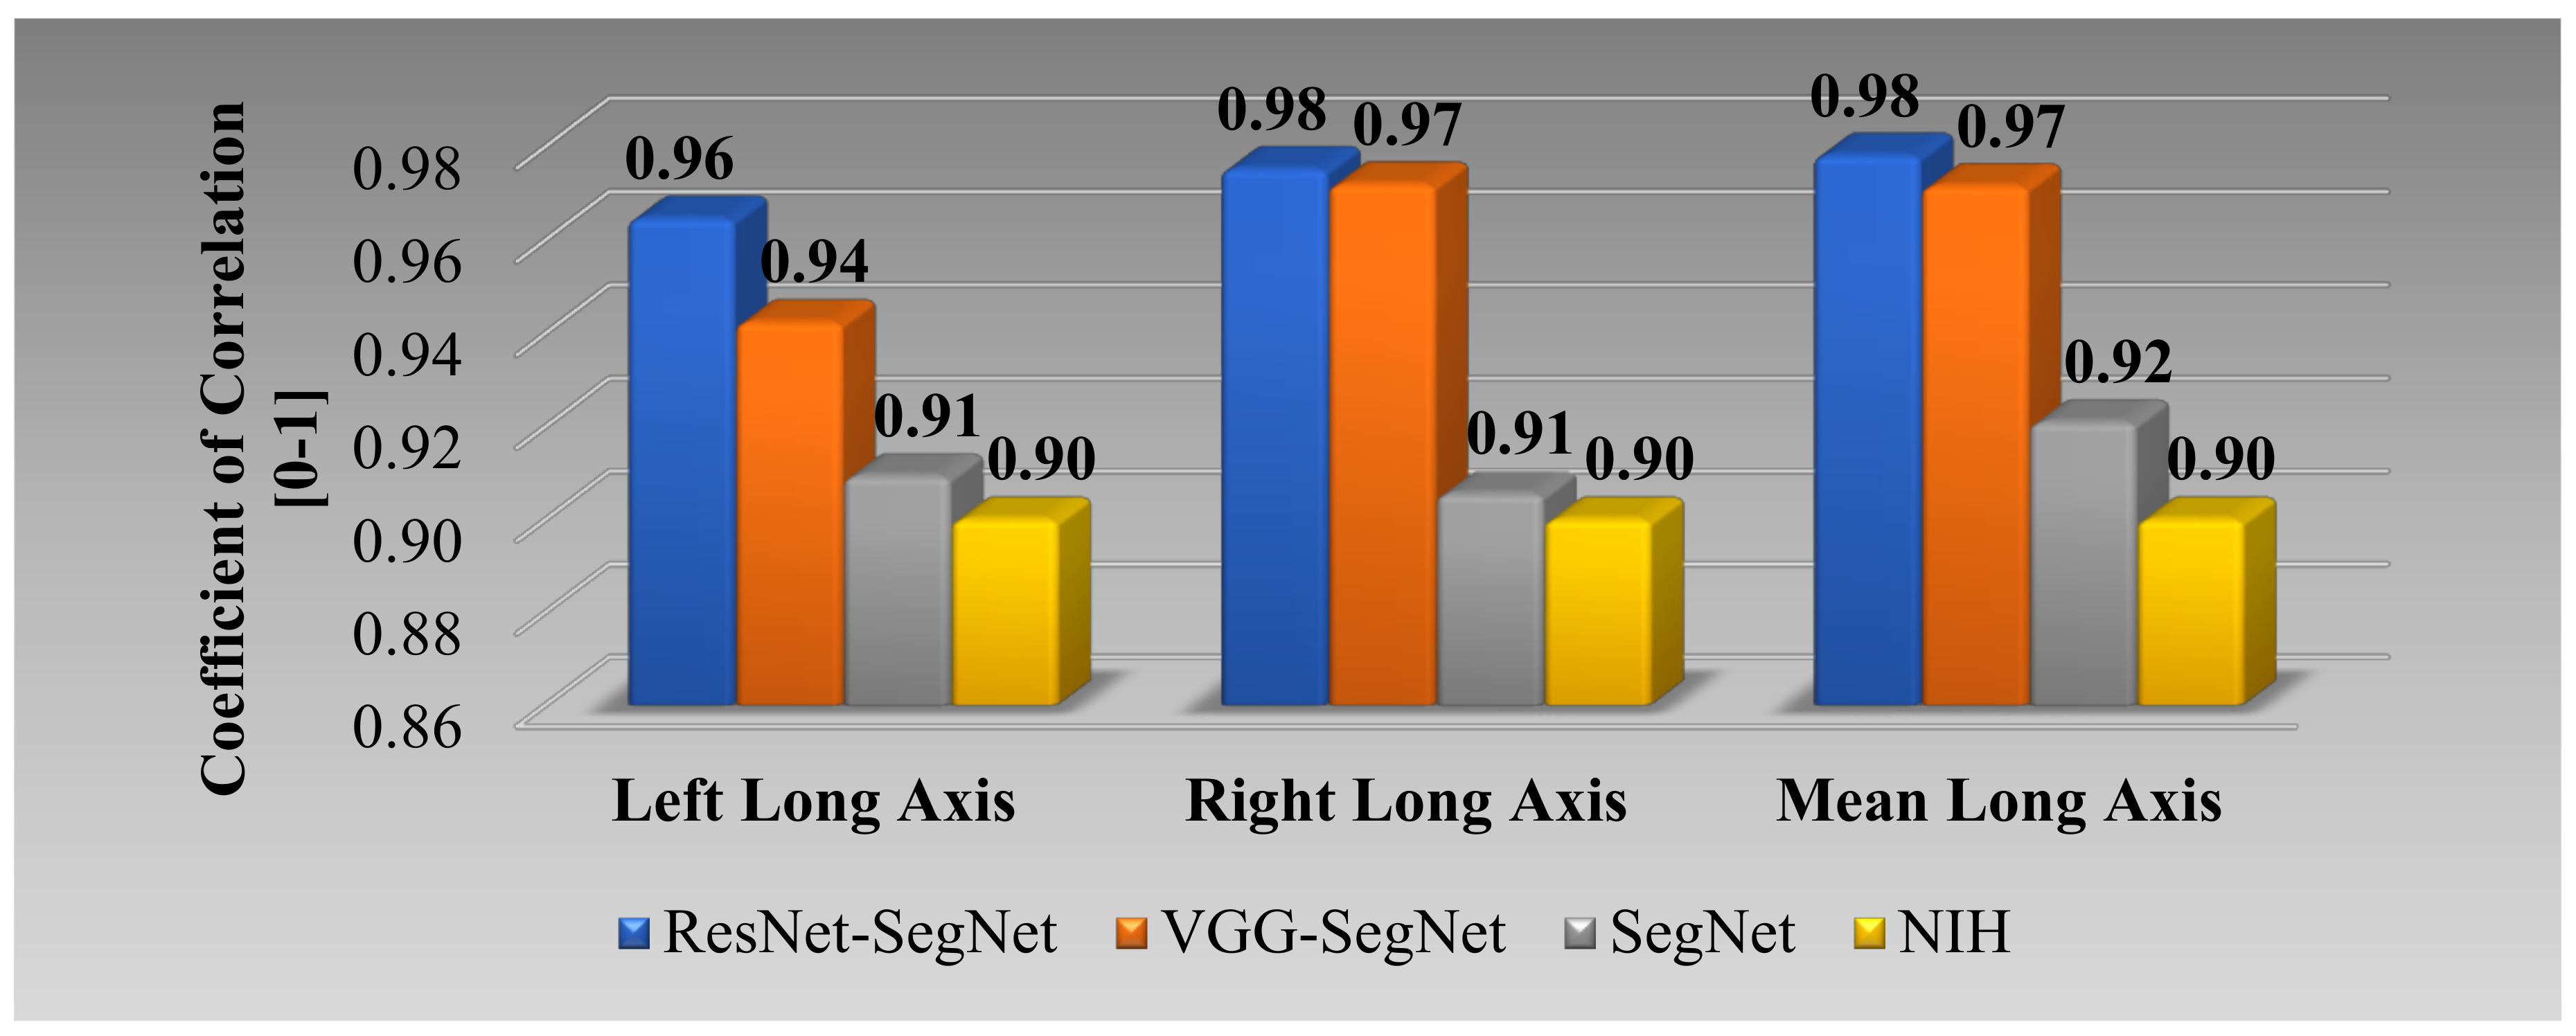
Correlation Plot for Lung Long Axis Error
Bland–Altman Plots for Lung Long Axis Error
The Figure of Merit Using Lung Area
5. Discussion
5.1. Benchmarking
5.2. A Special Note on the HDL Model
5.3. A Note on Comparison between the Proposed AI and NIH Conventional Models
5.4. Strength, Weakness, and Extension
6. Conclusions
Author Contributions
Funding
Institutional Review Board Statement
Informed Consent Statement
Data Availability Statement
Conflicts of Interest
Acronym Table
| SN | Symbol | Description of the Symbols |
| 1 | ACC | Accuracy |
| 2 | AE | Area Error |
| 3 | AI | Artificial Intelligence |
| 4 | ARDS | Acute Respiratory Distress Syndrome |
| 5 | AUC | Area Under the Curve |
| 6 | BA | Bland–Altman |
| 7 | BE | Boundary Error |
| 8 | CC | Correlation coefficient |
| 9 | CE | Cross Entropy |
| 10 | COVID | Coronavirus disease |
| 11 | COVLIAS | COVID Lung Image Analysis System |
| 12 | CT | Computed Tomography |
| 13 | DL | Deep Learning |
| 14 | DS | Dice Similarity |
| 15 | FoM | Figure of merit |
| 16 | GT | Ground Truth |
| 17 | HDL | Hybrid Deep Learning |
| 18 | IS | Image Size |
| 19 | JI | Jaccard Index |
| 20 | LAE | Lung Area Error |
| 21 | LLAE | Lung Long Axis Error |
| 22 | NIH | National Institute of Health |
| 23 | PC | Pixel Counting |
| 24 | RF | Resolution Factor |
| 25 | ROC | Receiver operating characteristic |
| 26 | SDL | Solo Deep Learning |
| 27 | VGG | Visual Geometric Group |
| 28 | VS | Variability studies |
| 29 | WHO | World Health Organization |
Symbol Table
| SN | Symbol | Description of the Symbols |
| 1 | Cross Entropy-loss | |
| 2 | Dice Similarity Coefficient-loss | |
| 3 | m | Model number used for segmentation in the total number of models M |
| 4 | n | Image scan number a total number of image N. |
| 5 | Mean estimated lung area for all images using AI model ‘m’ | |
| 6 | Estimated Lung Area using AI model ‘m’ and image ‘n’ | |
| 7 | GT lung area for image ‘n’ | |
| 8 | Mean ground truth area for all images N in the database | |
| 9 | Figure-of-Merit for segmentation model ‘m’ | |
| 10 | JI | Mean Jaccard Index for a specific segmentation model |
| 11 | DSC | Dice Similarity Coefficient for a specific segmentation model |
| 12 | Sample size required computed using power analysis | |
| 13 | MoE | Margin-of-Error |
| 14 | TP, TN | True Positive and True Negative |
| 15 | FP, FN | False Positive and False Negative |
| 16 | yi | GT label |
| 17 | ai | SoftMax classifier probability |
| 18 | Yp | Ground truth image |
| 19 | Estimated image | |
| 20 | P | Total number of pixels in an image in x,y-direction |
| 21 | z | Z-score from standard z-table |
| 22 | K5-r46 | Cross-validation protocol with 40% training and 60% testing |
| Deep Learning Segmentation Architectures | ||
| 23 | SegNet | SDL model for lung segmentation with reduced learning parameters |
| 24 | VGG-SegNet | HDL model designed by fusion of VGG-19 and SegNet architecture |
| 25 | ResNet-SegNet | HDL model designed by fusion of ResNet-50 and SegNet architecture |
| Conventional Model | ||
| 26 | NIH | National Institute of Health segmentation model |
References
- WHO Coronavirus (COVID-19) Dashboard. Available online: https://covid19.who.int/ (accessed on 28 July 2021).
- Saba, L.; Gerosa, C.; Fanni, D.; Marongiu, F.; La Nasa, G.; Caocci, G.; Barcellona, D.; Balestrieri, A.; Coghe, F.; Orru, G.; et al. Molecular pathways triggered by COVID-19 in different organs: ACE2 receptor-expressing cells under attack? A review. Eur. Rev. Med. Pharmacol. Sci. 2020, 24, 12609–12622. [Google Scholar] [CrossRef]
- Cau, R.; Bassareo, P.P.; Mannelli, L.; Suri, J.S.; Saba, L. Imaging in COVID-19-related myocardial injury. Int. J. Cardiovasc. Imaging 2021, 37, 1349–1360. [Google Scholar] [CrossRef] [PubMed]
- Viswanathan, V.; Puvvula, A.; Jamthikar, A.D.; Saba, L.; Johri, A.M.; Kotsis, V.; Khanna, N.N.; Dhanjil, S.K.; Majhail, M.; Misra, D.P. Bidirectional link between diabetes mellitus and coronavirus disease 2019 leading to cardiovascular disease: A narrative review. World J. Diabetes 2021, 12, 215. [Google Scholar] [CrossRef] [PubMed]
- Cau, R.; Pacielli, A.; Fatemeh, H.; Vaudano, P.; Arru, C.; Crivelli, P.; Stranieri, G.; Suri, J.S.; Mannelli, L.; Conti, M.; et al. Complications in COVID-19 patients: Characteristics of pulmonary embolism. Clin. Imaging 2021, 77, 244–249. [Google Scholar] [CrossRef] [PubMed]
- Suri, J.S.; Agarwal, S.; Gupta, S.K.; Puvvula, A.; Biswas, M.; Saba, L.; Bit, A.; Tandel, G.S.; Agarwal, M.; Patrick, A. A narrative review on characterization of acute respiratory distress syndrome in COVID-19-infected lungs using artificial intelligence. Comput. Biol. Med. 2021, 130, 104210. [Google Scholar] [CrossRef]
- Cau, R.; Falaschi, Z.; Paschè, A.; Danna, P.; Arioli, R.; Arru, C.D.; Zagaria, D.; Tricca, S.; Suri, J.S.; Karla, M.K. Computed tomography findings of COVID-19 pneumonia in Intensive Care Unit-patients. J. Public Health Res. 2021, 2019. [Google Scholar] [CrossRef]
- El-Baz, A.; Suri, J. Lung Imaging and CADx; CRC Press: Boca Raton, FL, USA, 2019. [Google Scholar]
- El-Baz, A.; Suri, J.S. Lung Imaging and Computer Aided Diagnosis; CRC Press: Boca Raton, FL, USA, 2011. [Google Scholar]
- Saba, L.; Suri, J.S. Multi-Detector CT Imaging: Principles, Head, Neck, and Vascular Systems; CRC Press: Boca Raton, FL, USA, 2013; Volume 1. [Google Scholar]
- Saba, L.; Agarwal, M.; Patrick, A.; Puvvula, A.; Gupta, S.K.; Carriero, A.; Laird, J.R.; Kitas, G.D.; Johri, A.M.; Balestrieri, A.; et al. Six artificial intelligence paradigms for tissue characterisation and classification of non-COVID-19 pneumonia against COVID-19 pneumonia in computed tomography lungs. Int. J. Comput. Assist. Radiol. Surg. 2021, 16, 423–434. [Google Scholar] [CrossRef]
- Saba, L.; Biswas, M.; Suri, H.S.; Viskovic, K.; Laird, J.R.; Cuadrado-Godia, E.; Nicolaides, A.; Khanna, N.; Viswanathan, V.; Suri, J.S.J.C.d.; et al. Ultrasound-based carotid stenosis measurement and risk stratification in diabetic cohort: A deep learning paradigm. Cardiovasc. Diagn. Ther. 2019, 9, 439. [Google Scholar] [CrossRef]
- Biswas, M.; Kuppili, V.; Saba, L.; Edla, D.R.; Suri, H.S.; Cuadrado-Godia, E.; Laird, J.R.; Marinhoe, R.T.; Sanches, J.M.; Nicolaides, A.; et al. State-of-the-art review on deep learning in medical imaging. Front. Biosci. 2019, 24, 392–426. [Google Scholar]
- Saba, L.; Biswas, M.; Kuppili, V.; Cuadrado Godia, E.; Suri, H.S.; Edla, D.R.; Omerzu, T.; Laird, J.R.; Khanna, N.N.; Mavrogeni, S.; et al. The present and future of deep learning in radiology. Eur. J. Radiol. 2019, 114, 14–24. [Google Scholar] [CrossRef]
- El-Baz, A.; Suri, J. Machine Learning in Medicine; CRC Press: Boca Raton, FL, USA, 2021. [Google Scholar]
- Suri, J.S.; Rangayyan, R.M. Recent Advances in Breast Imaging, Mammography, and Computer-Aided Diagnosis of Breast Cancer; SPIE Press: Bellingham, WA, USA, 2006. [Google Scholar]
- Biswas, M.; Kuppili, V.; Edla, D.R.; Suri, H.S.; Saba, L.; Marinhoe, R.T.; Sanches, J.M.; Suri, J.S. Symtosis: A liver ultrasound tissue characterization and risk stratification in optimized deep learning paradigm. Comput. Methods Programs Biomed. 2018, 155, 165–177. [Google Scholar] [CrossRef] [PubMed]
- Acharya, U.R.; Sree, S.V.; Ribeiro, R.; Krishnamurthi, G.; Marinho, R.T.; Sanches, J.; Suri, J.S. Data mining framework for fatty liver disease classification in ultrasound: A hybrid feature extraction paradigm. Med. Phys. 2012, 39, 4255–4264. [Google Scholar] [CrossRef] [Green Version]
- Acharya, U.R.; Sree, S.V.; Krishnan, M.M.R.; Molinari, F.; Garberoglio, R.; Suri, J.S. Non-invasive automated 3D thyroid lesion classification in ultrasound: A class of ThyroScan™ systems. Ultrasonics 2012, 52, 508–520. [Google Scholar] [CrossRef]
- Acharya, U.R.; Swapna, G.; Sree, S.V.; Molinari, F.; Gupta, S.; Bardales, R.H.; Witkowska, A.; Suri, J.S. A review on ultrasound-based thyroid cancer tissue characterization and automated classification. Technol. Cancer Res. Treat. 2014, 13, 289–301. [Google Scholar] [CrossRef] [PubMed] [Green Version]
- Molinari, F.; Mantovani, A.; Deandrea, M.; Limone, P.; Garberoglio, R.; Suri, J.S. Characterization of single thyroid nodules by contrast-enhanced 3-D ultrasound. Ultrasound Med. Biol. 2010, 36, 1616–1625. [Google Scholar] [CrossRef] [PubMed] [Green Version]
- Shrivastava, V.K.; Londhe, N.D.; Sonawane, R.S.; Suri, J.S. Computer-aided diagnosis of psoriasis skin images with HOS, texture and color features: A first comparative study of its kind. Comput. Methods Programs Biomed. 2016, 126, 98–109. [Google Scholar] [CrossRef] [PubMed]
- Shrivastava, V.K.; Londhe, N.D.; Sonawane, R.S.; Suri, J.S. Reliable and accurate psoriasis disease classification in dermatology images using comprehensive feature space in machine learning paradigm. Expert Syst. Appl. 2015, 42, 6184–6195. [Google Scholar] [CrossRef]
- Mookiah, M.R.K.; Acharya, U.R.; Martis, R.J.; Chua, C.K.; Lim, C.M.; Ng, E.; Laude, A. Evolutionary algorithm based classifier parameter tuning for automatic diabetic retinopathy grading: A hybrid feature extraction approach. Knowl. Based Syst. 2013, 39, 9–22. [Google Scholar] [CrossRef]
- Than, J.C.; Saba, L.; Noor, N.M.; Rijal, O.M.; Kassim, R.M.; Yunus, A.; Suri, H.S.; Porcu, M.; Suri, J.S. Lung disease stratification using amalgamation of Riesz and Gabor transforms in machine learning framework. Comput. Biol. Med. 2017, 89, 197–211. [Google Scholar] [CrossRef] [PubMed]
- Acharya, U.R.; Sree, S.V.; Krishnan, M.M.R.; Krishnananda, N.; Ranjan, S.; Umesh, P.; Suri, J.S. Automated classification of patients with coronary artery disease using grayscale features from left ventricle echocardiographic images. Comput. Methods Programs Biomed. 2013, 112, 624–632. [Google Scholar] [CrossRef]
- Araki, T.; Ikeda, N.; Shukla, D.; Jain, P.K.; Londhe, N.D.; Shrivastava, V.K.; Banchhor, S.K.; Saba, L.; Nicolaides, A.; Shafique, S. PCA-based polling strategy in machine learning framework for coronary artery disease risk assessment in intravascular ultrasound: A link between carotid and coronary grayscale plaque morphology. Comput. Methods Programs Biomed. 2016, 128, 137–158. [Google Scholar] [CrossRef]
- Acharya, R.U.; Faust, O.; Alvin, A.P.; Sree, S.V.; Molinari, F.; Saba, L.; Nicolaides, A.; Suri, J.S. Symptomatic vs. asymptomatic plaque classification in carotid ultrasound. J. Med. Syst. 2012, 36, 1861–1871. [Google Scholar] [CrossRef] [PubMed]
- Acharya, U.R.; Faust, O.; Sree, S.V.; Molinari, F.; Saba, L.; Nicolaides, A.; Suri, J.S. An accurate and generalized approach to plaque characterization in 346 carotid ultrasound scans. IEEE Trans. Instrum. Meas. 2011, 61, 1045–1053. [Google Scholar] [CrossRef]
- Suri, J.S. Imaging Based Symptomatic Classification and Cardiovascular Stroke Risk Score Estimation. Google Patent 13053971, 28 July 2011. [Google Scholar]
- Cuadrado-Godia, E.; Dwivedi, P.; Sharma, S.; Ois Santiago, A.; Roquer Gonzalez, J.; Balcells, M.; Laird, J.; Turk, M.; Suri, H.S.; Nicolaides, A.; et al. Cerebral Small Vessel Disease: A Review Focusing on Pathophysiology, Biomarkers, and Machine Learning Strategies. J. Stroke 2018, 20, 302–320. [Google Scholar] [CrossRef]
- Maniruzzaman, M.; Rahman, M.J.; Al-MehediHasan, M.; Suri, H.S.; Abedin, M.M.; El-Baz, A.; Suri, J.S. Accurate diabetes risk stratification using machine learning: Role of missing value and outliers. J. Med. Syst. 2018, 42, 1–17. [Google Scholar] [CrossRef] [PubMed] [Green Version]
- Martis, R.J.; Acharya, U.R.; Prasad, H.; Chua, C.K.; Lim, C.M.; Suri, J.S. Application of higher order statistics for atrial arrhythmia classification. Biomed. Signal Process. Control. 2013, 8, 888–900. [Google Scholar] [CrossRef]
- Suri, J.S.; Puvvula, A.; Biswas, M.; Majhail, M.; Saba, L.; Faa, G.; Singh, I.M.; Oberleitner, R.; Turk, M.; Chadha, P.S.; et al. COVID-19 pathways for brain and heart injury in comorbidity patients: A role of medical imaging and artificial intelligence-based COVID severity classification: A review. Comput. Biol. Med. 2020, 124, 103960. [Google Scholar] [CrossRef]
- Suri, J.S.; Puvvula, A.; Majhail, M.; Biswas, M.; Jamthikar, A.D.; Saba, L.; Faa, G.; Singh, I.M.; Oberleitner, R.; Turk, M. Integration of cardiovascular risk assessment with COVID-19 using artificial intelligence. Rev. Cardiovasc. Med. 2020, 21, 541–560. [Google Scholar] [PubMed]
- Agarwal, M.; Saba, L.; Gupta, S.K.; Carriero, A.; Falaschi, Z.; Paschè, A.; Danna, P.; El-Baz, A.; Naidu, S.; Suri, J.S. A novel block imaging technique using nine artificial intelligence models for COVID-19 disease classification, characterization and severity measurement in lung computed tomography scans on an Italian cohort. J. Med. Syst. 2021, 45, 1–30. [Google Scholar] [CrossRef]
- Mansoor, A.; Bagci, U.; Foster, B.; Xu, Z.; Douglas, D.; Solomon, J.M.; Udupa, J.K.; Mollura, D.J. CIDI-lung-seg: A single-click annotation tool for automatic delineation of lungs from CT scans. In Proceedings of the 2014 36th Annual International Conference of the IEEE Engineering in Medicine and Biology Society, Chicago, IL, USA, 26–30 August 2014; pp. 1087–1090. [Google Scholar]
- Saba, L.; Banchhor, S.K.; Araki, T.; Viskovic, K.; Londhe, N.D.; Laird, J.R.; Suri, H.S.; Suri, J.S. Intra- and inter-operator reproducibility of automated cloud-based carotid lumen diameter ultrasound measurement. Indian Heart J. 2018, 70, 649–664. [Google Scholar] [CrossRef]
- Saba, L.; Banchhor, S.K.; Suri, H.S.; Londhe, N.D.; Araki, T.; Ikeda, N.; Viskovic, K.; Shafique, S.; Laird, J.R.; Gupta, A.; et al. Accurate cloud-based smart IMT measurement, its validation and stroke risk stratification in carotid ultrasound: A web-based point-of-care tool for multicenter clinical trial. Comput. Biol. Med. 2016, 75, 217–234. [Google Scholar] [CrossRef] [PubMed]
- Saba, L.; Than, J.C.; Noor, N.M.; Rijal, O.M.; Kassim, R.M.; Yunus, A.; Ng, C.R.; Suri, J.S. Inter-observer Variability Analysis of Automatic Lung Delineation in Normal and Disease Patients. J. Med. Syst. 2016, 40, 142. [Google Scholar] [CrossRef]
- Badrinarayanan, V.; Kendall, A.; Cipolla, R. SegNet: A Deep Convolutional Encoder-Decoder Architecture for Image Segmentation. IEEE Trans. Pattern Anal. Mach. Intell. 2017, 39, 2481–2495. [Google Scholar] [CrossRef]
- Simonyan, K.; Zisserman, A. Very deep convolutional networks for large-scale image recognition. arXiv 2014, arXiv:1409.1556. [Google Scholar]
- He, K.; Zhang, X.; Ren, S.; Sun, J. Deep residual learning for image recognition. In Proceedings of the IEEE Conference on Computer Vision and Pattern Recognition (CVPR); IEEE: Las Vegas, NV, USA, 2016; pp. 770–778. [Google Scholar]
- Saba, L.; Banchhor, S.K.; Londhe, N.D.; Araki, T.; Laird, J.R.; Gupta, A.; Nicolaides, A.; Suri, J.S. Web-based accurate measurements of carotid lumen diameter and stenosis severity: An ultrasound-based clinical tool for stroke risk assessment during multicenter clinical trials. Comput. Biol. Med. 2017, 91, 306–317. [Google Scholar] [CrossRef]
- Molinari, F.; Zeng, G.; Suri, J.S. Intima-media thickness: Setting a standard for a completely automated method of ultrasound measurement. IEEE Trans. Ultrason. Ferroelectr. Freq. Control. 2010, 57, 1112–1124. [Google Scholar] [CrossRef]
- Suri, J.S.; Kathuria, C.; Molinari, F. Atherosclerosis Disease Management; Springer Science & Business Media: New York, NY, USA, 2010. [Google Scholar]
- Khanna, N.N.; Jamthikar, A.D.; Araki, T.; Gupta, D.; Piga, M.; Saba, L.; Carcassi, C.; Nicolaides, A.; Laird, J.R.; Suri, H.S.J.E. Nonlinear model for the carotid artery disease 10-year risk prediction by fusing conventional cardiovascular factors to carotid ultrasound image phenotypes: A Japanese diabetes cohort study. Echocardiography 2019, 36, 345–361. [Google Scholar] [CrossRef]
- Molinari, F.; Meiburger, K.M.; Saba, L.; Acharya, U.R.; Ledda, G.; Zeng, G.; Ho, S.Y.S.; Ahuja, A.T.; Ho, S.C.; Nicolaides, A.J.C.m.; et al. Ultrasound IMT measurement on a multi-ethnic and multi-institutional database: Our review and experience using four fully automated and one semi-automated methods. Comput. Methods Programs Biomed. 2012, 108, 946–960. [Google Scholar] [CrossRef] [PubMed] [Green Version]
- Qualtrics, X. Determining Sample Size: How to Ensure You Get the Correct Sample Size. 2019. Available online: https://www.qualtrics.com/au/experience-management/research/determine-sample-size/ (accessed on 28 July 2021).
- Singh, B.K.; Verma, K.; Thoke, A.; Suri, J.S.J.M. Risk stratification of 2D ultrasound-based breast lesions using hybrid feature selection in machine learning paradigm. Measurement 2017, 105, 146–157. [Google Scholar] [CrossRef]
- Riffenburgh, R.H.; Gillen, D.L. Contents. In Statistics in Medicine, 4th ed.; Academic Press: Cambridge, MA USA, 2020. [Google Scholar]
- Priya, C.; Sithi Shameem Fathima, S.M.H.; Kirubanandasarathy, N.; Valanarasid, A.; Safana Begam, M.H.; Aiswarya, N. Automatic Optimized Cnn Based Covid-19 Lung Infection Segmentation from Ct Image. Mater. Today Proc. 2021. [Google Scholar] [CrossRef]
- Saood, A.; Hatem, I. COVID-19 lung CT image segmentation using deep learning methods: U-Net versus SegNet. BMC Med. Imaging 2021, 21, 1–10. [Google Scholar] [CrossRef] [PubMed]
- Paluru, N.; Dayal, A.; Jenssen, H.B.; Sakinis, T.; Cenkeramaddi, L.R.; Prakash, J.; Yalavarthy, P.K. Anam-Net: Anamorphic Depth Embedding-Based Lightweight CNN for Segmentation of Anomalies in COVID-19 Chest CT Images. IEEE Trans. Neural Netw. Learn. Syst. 2021, 32, 932–946. [Google Scholar] [CrossRef]
- Cai, W.; Liu, T.; Xue, X.; Luo, G.; Wang, X.; Shen, Y.; Fang, Q.; Sheng, J.; Chen, F.; Liang, T. CT Quantification and Machine-learning Models for Assessment of Disease Severity and Prognosis of COVID-19 Patients. Acad. Radiol. 2020, 27, 1665–1678. [Google Scholar] [CrossRef] [PubMed]
- Chaddad, A.; Hassan, L.; Desrosiers, C. Deep CNN models for predicting COVID-19 in CT and X-ray images. J. Med. Imaging 2021, 8, 014502. [Google Scholar] [CrossRef]
- Gunraj, H.; Wang, L.; Wong, A. COVIDNet-CT: A Tailored Deep Convolutional Neural Network Design for Detection of COVID-19 Cases From Chest CT Images. Front. Med. 2020, 7, 608525. [Google Scholar] [CrossRef] [PubMed]
- Iyer, T.J.; Joseph Raj, A.N.; Ghildiyal, S.; Nersisson, R. Performance analysis of lightweight CNN models to segment infectious lung tissues of COVID-19 cases from tomographic images. PeerJ Comput. Sci. 2021, 7, e368. [Google Scholar] [CrossRef]
- Ranjbarzadeh, R.; Jafarzadeh Ghoushchi, S.; Bendechache, M.; Amirabadi, A.; Ab Rahman, M.N.; Baseri Saadi, S.; Aghamohammadi, A.; Kooshki Forooshani, M. Lung Infection Segmentation for COVID-19 Pneumonia Based on a Cascade Convolutional Network from CT Images. Biomed. Res. Int. 2021, 2021, 5544742. [Google Scholar] [CrossRef] [PubMed]
- Xiao, H.; Ran, Z.; Huang, J.; Ren, H.; Liu, C.; Zhang, B.; Dang, J. Research progress in lung parenchyma segmentation based on computed tomography. J. Biomed. Eng. 2021, 38, 379–386. [Google Scholar]
- El-Kenawy, E.-S.M.; Ibrahim, A.; Mirjalili, S.; Eid, M.M.; Hussein, S.E. Novel feature selection and voting classifier algorithms for COVID-19 classification in CT images. IEEE Access 2020, 8, 179317–179335. [Google Scholar] [CrossRef]
- Vijayalakshmi, A. Deep learning approach to detect malaria from microscopic images. Multimed. Tools Appl. 2020, 79, 15297–15317. [Google Scholar] [CrossRef]
- Saba, L.; Sanagala, S.S.; Gupta, S.K.; Koppula, V.K.; Laird, J.R.; Viswanathan, V.; Sanches, M.J.; Kitas, G.D.; Johri, A.M.; Sharma, N. A Multicenter Study on Carotid Ultrasound Plaque Tissue Characterization and Classification Using Six Deep Artificial Intelligence Models: A Stroke Application. IEEE Trans. Instrum. Meas. 2021, 70, 1–12. [Google Scholar] [CrossRef]
- Skandha, S.S.; Gupta, S.K.; Saba, L.; Koppula, V.K.; Johri, A.M.; Khanna, N.N.; Mavrogeni, S.; Laird, J.R.; Pareek, G.; Miner, M. 3-D optimized classification and characterization artificial intelligence paradigm for cardiovascular/stroke risk stratification using carotid ultrasound-based delineated plaque: Atheromatic™ 2.0. Comput. Biol. Med. 2020, 125, 103958. [Google Scholar] [CrossRef] [PubMed]
- Kuppili, V.; Biswas, M.; Sreekumar, A.; Suri, H.S.; Saba, L.; Edla, D.R.; Marinhoe, R.T.; Sanches, J.M.; Suri, J.S. Extreme learning machine framework for risk stratification of fatty liver disease using ultrasound tissue characterization. J. Med. Syst. 2017, 41, 1–20. [Google Scholar] [CrossRef] [PubMed]
- Jamthikar, A.; Gupta, D.; Khanna, N.N.; Saba, L.; Araki, T.; Viskovic, K.; Suri, H.S.; Gupta, A.; Mavrogeni, S.; Turk, M.J.C.d.; et al. A low-cost machine learning-based cardiovascular/stroke risk assessment system: Integration of conventional factors with image phenotypes. Cardiovasc. Diagn. Ther. 2019, 9, 420. [Google Scholar] [CrossRef] [Green Version]
- El-Baz, A.; Suri, J.S. Big Data in Multimodal Medical Imaging; Boca Raton: CRC Press: Boca Raton, FL, USA, 2019. [Google Scholar]
- Noor, N.M.; Than, J.C.; Rijal, O.M.; Kassim, R.M.; Yunus, A.; Zeki, A.A.; Anzidei, M.; Saba, L.; Suri, J.S. Automatic lung segmentation using control feedback system: Morphology and texture paradigm. J. Med. Syst. 2015, 39, 1–18. [Google Scholar] [CrossRef] [PubMed]
- Jamthikar, A.; Gupta, D.; Saba, L.; Khanna, N.N.; Araki, T.; Viskovic, K.; Mavrogeni, S.; Laird, J.R.; Pareek, G.; Miner, M.J.C.D.; et al. Cardiovascular/stroke risk predictive calculators: A comparison between statistical and machine learning models. Cardiovasc. Diagn. Ther. 2020, 10, 919. [Google Scholar] [CrossRef]


| Lung Area | Lung Long Axis | |||||
|---|---|---|---|---|---|---|
| Left | Right | Mean | Left | Right | Mean | |
| SegNet | 94.28 | 97.6 | 95.94 | 97.03 | 98.53 | 97.78 |
| VGG-SegNet | 99.09 | 99.56 | 99.32 | 99.7 | 99.61 | 99.65 |
| ResNet-SegNet | 99.03 | 99.98 | 99.55 | 99.72 | 99.62 | 99.67 |
| NIH | 94.98 | 98.69 | 96.83 | 97.76 | 96.09 | 96.92 |
| Lung Area Error | Lung Long Axis Error | |||||
|---|---|---|---|---|---|---|
| Left Lung | Right Lung | Mean | Left Lung | Right Lung | Mean | |
| ResNet-SegNet | 57% | 60% | 58% | 42% | 44% | 43% |
| VGG-SegNet | 51% | 52% | 52% | 31% | 37% | 34% |
| SegNet | 22% | 19% | 21% | 5% | 13% | 4% |
| Author (Year) | # of Patients | Demo. | # of Images | IS2 | # of Tracers | AI Model | SDL vs. HDL | Dim. | Training Speed | Heatmap | VS | AE | BE | DS | JI | AUC | ACC (%) |
|---|---|---|---|---|---|---|---|---|---|---|---|---|---|---|---|---|---|
| Priya et al. (2021) [56] | - | No | 78 | - | - | Squeeze Net | HDL | 2D | - | Yes | No | - | Yes | - | - | - | - |
| Saood et al. (2021) [57] | - | No | 100 | 2562 | - | UNet, SegNet | SDL | 2D | - | - | No | - | - | 0.73, 0.74 | - | 0.94, 0.95 | 91, 95 |
| Paluru et al. (2020) [58] | 69 | No | 4339 | 5122 | - | Anam-net | SDL | 2D | 27 min | - | Yes | - | - | 0.75 | - | 0.99 | 99.1 |
| Cai et al. (2020) [59] | 99 | Yes | 6301 | 2 | UNet | SDL | 2D | - | yes | No | - | - | 0.98 | 0.96 | - | - | |
| Suri et al. (2021) | 72 | Yes | 5000 | 7682 | 1 | NIH, SegNet, VGG-SegNet, ResNet-SegNet | SDL and HDL | 2D | 18 min | No | No | Yes | Yes | 0.96, 0.97, 0.97, 0.98 | 0.93, 0.94, 0.96, 0.97 | 0.96, 0.96, 0.97, 0.98 | NA, 98, 98, 99 |
Publisher’s Note: MDPI stays neutral with regard to jurisdictional claims in published maps and institutional affiliations. |
© 2021 by the authors. Licensee MDPI, Basel, Switzerland. This article is an open access article distributed under the terms and conditions of the Creative Commons Attribution (CC BY) license (https://creativecommons.org/licenses/by/4.0/).
Share and Cite
Suri, J.S.; Agarwal, S.; Pathak, R.; Ketireddy, V.; Columbu, M.; Saba, L.; Gupta, S.K.; Faa, G.; Singh, I.M.; Turk, M.; et al. COVLIAS 1.0: Lung Segmentation in COVID-19 Computed Tomography Scans Using Hybrid Deep Learning Artificial Intelligence Models. Diagnostics 2021, 11, 1405. https://doi.org/10.3390/diagnostics11081405
Suri JS, Agarwal S, Pathak R, Ketireddy V, Columbu M, Saba L, Gupta SK, Faa G, Singh IM, Turk M, et al. COVLIAS 1.0: Lung Segmentation in COVID-19 Computed Tomography Scans Using Hybrid Deep Learning Artificial Intelligence Models. Diagnostics. 2021; 11(8):1405. https://doi.org/10.3390/diagnostics11081405
Chicago/Turabian StyleSuri, Jasjit S., Sushant Agarwal, Rajesh Pathak, Vedmanvitha Ketireddy, Marta Columbu, Luca Saba, Suneet K. Gupta, Gavino Faa, Inder M. Singh, Monika Turk, and et al. 2021. "COVLIAS 1.0: Lung Segmentation in COVID-19 Computed Tomography Scans Using Hybrid Deep Learning Artificial Intelligence Models" Diagnostics 11, no. 8: 1405. https://doi.org/10.3390/diagnostics11081405
APA StyleSuri, J. S., Agarwal, S., Pathak, R., Ketireddy, V., Columbu, M., Saba, L., Gupta, S. K., Faa, G., Singh, I. M., Turk, M., Chadha, P. S., Johri, A. M., Khanna, N. N., Viskovic, K., Mavrogeni, S., Laird, J. R., Pareek, G., Miner, M., Sobel, D. W., ... Kalra, M. (2021). COVLIAS 1.0: Lung Segmentation in COVID-19 Computed Tomography Scans Using Hybrid Deep Learning Artificial Intelligence Models. Diagnostics, 11(8), 1405. https://doi.org/10.3390/diagnostics11081405