

The Diagnostic Accuracy of Pure-Tone Audiometry Screening Protocols for Vestibular Schwannoma in Patients with Asymmetrical Hearing Loss—A Systematic Review and Meta-Analysis
 ,
,
Abstract
:1. Introduction
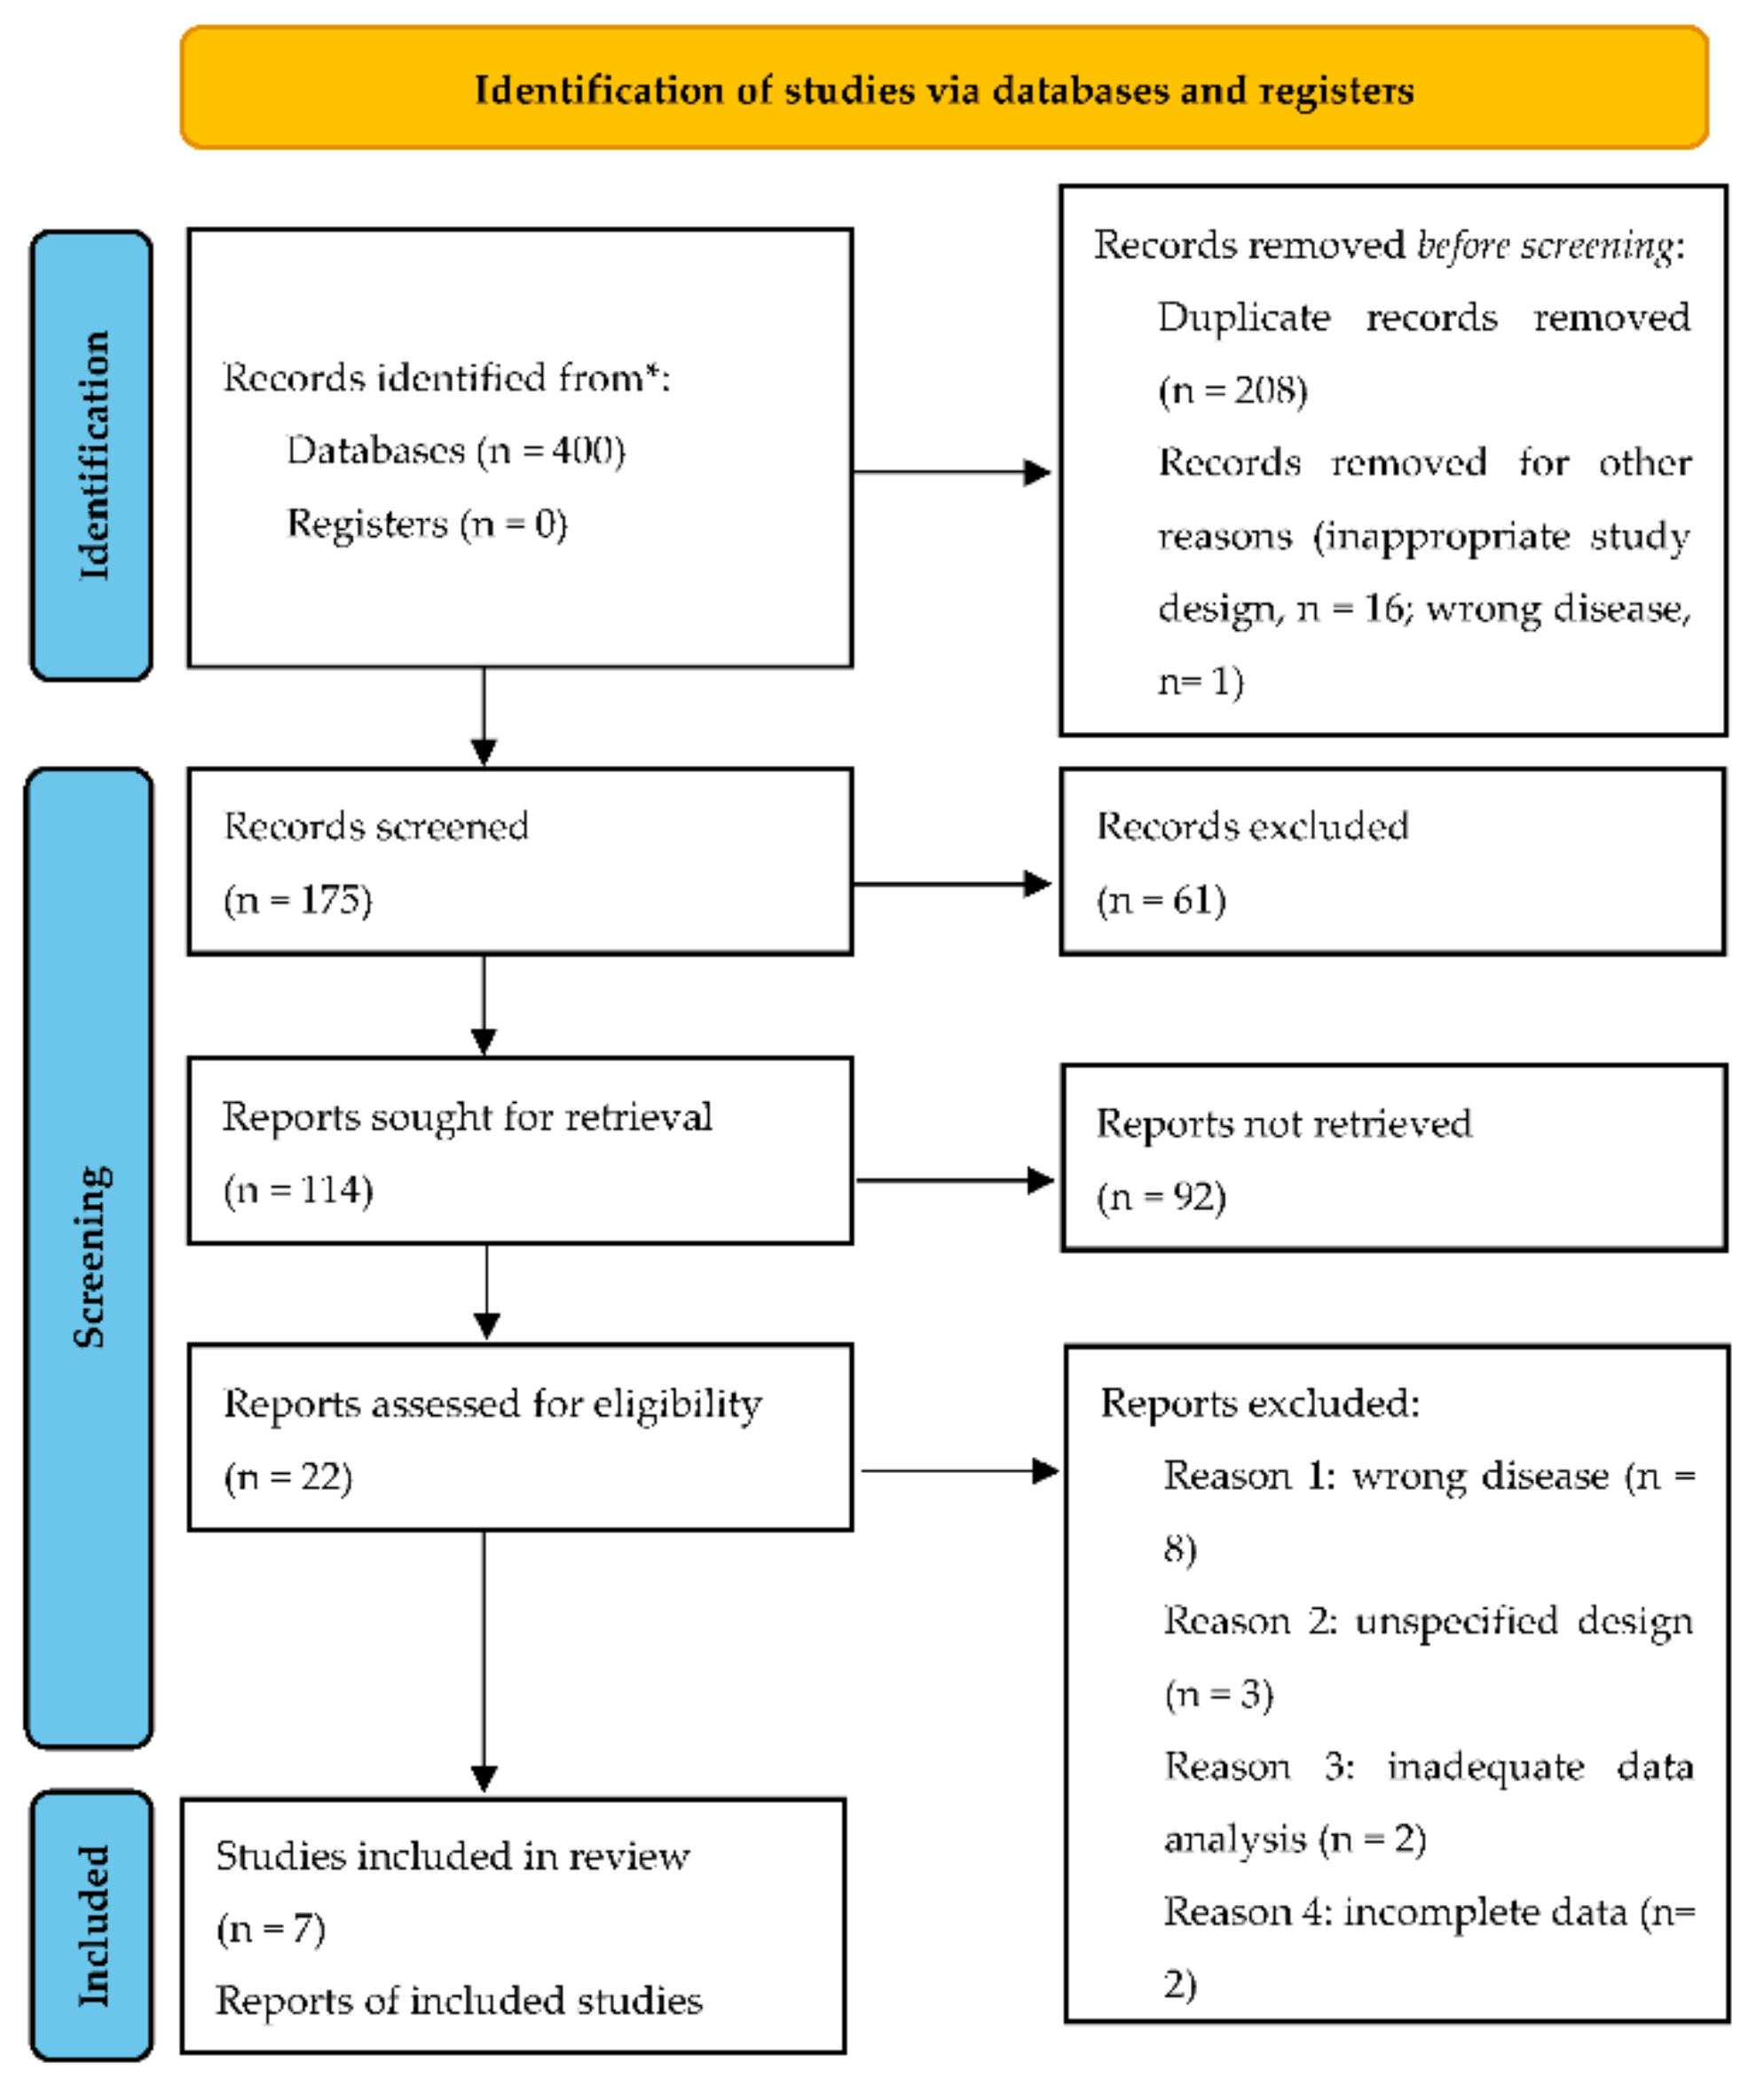
2. Materials and Methods
3. Results
4. Discussion
Supplementary Materials
Author Contributions
Funding
Institutional Review Board Statement
Informed Consent Statement
Data Availability Statement
Conflicts of Interest
References
- Tveiten, O.V.; Carlson, M.L.; Goplen, F.; Vassbotn, F.; Link, M.J.; Lund-Johansen, M. Long-term Auditory Symptoms in Patients with Sporadic Vestibular Schwannoma: An International Cross-Sectional Study. Neurosurgery 2015, 77, 218–227. [Google Scholar]
- Pinna, M.H.; Bento, R.F.; Neto, R.V. Vestibular schwannoma: 825 cases from a 25-year experience. Int. Arch. Otorhinolaryngol. 2012, 16, 466–475. [Google Scholar]
- Kotlarz, J.P.; Eby, T.L.; Borton, T.E. Analysis of the efficiency of retrocochlear screening. Laryngoscope 1992, 102, 1108–1112. [Google Scholar]
- Kellermeyer, B.; Haught, E.; Harper, T.; Wetmore, S. Case series of vestibular schwannoma patients with no asymmetry in hearing. Am. J. Otolaryngol. 2021, 42, 103034. [Google Scholar]
- Matsushima, K.; Kohno, M.; Ichimasu, N.; Nakajima, N.; Yoshino, M. Preoperative Facial Nerve Palsy in Patients with Vestibular Schwannoma: Clinical Features and Postoperative Functional Prognosis in a Case Series of 34 Among 1228 Consecutive Patients. Oper. Neurosurg. 2022, 22, 14–19. [Google Scholar]
- Paldor, I.; Chen, A.S.; Kaye, A.H. Growth rate of vestibular schwannoma. J. Clin. Neurosci. 2016, 32, 1–8. [Google Scholar]
- Withrow, D.R.; Devesa, S.S.; Deapen, D.; Petkov, V.; Van Dyke, A.L.; Adamo, M.; Armstrong, T.S.; Gilbert, M.R.; Linet, M.S. Nonmalignant meningioma and vestibular schwannoma incidence trends in the United States, 2004–2017. Cancer 2021, 127, 3579–3590. [Google Scholar]
- Gudmundsson, T.H.; Petersen, H. Acoustic neuroma in Iceland for 30 years (1979–2009). Laeknabladid 2013, 99, 289–292. [Google Scholar]
- Marinelli, J.P.; Beeler, C.J.; Carlson, M.L.; Caye-Thomasen, P.; Spear, S.A.; Erbele, I.D. Global Incidence of Sporadic Vestibular Schwannoma: A Systematic Review. Otolaryngol. Head Neck Surg. 2022, 167, 209–214. [Google Scholar]
- Stangerup, S.E.; Caye-Thomasen, P. Epidemiology and natural history of vestibular schwannomas. Otolaryngol. Clin. N. Am. 2012, 45, 257–268. [Google Scholar]
- Röösli, M.; Lagorio, S.; Schoemaker, M.J.; Schüz, J.; Feychting, M. Brain and salivary gland tumors and mobile phone use: Evaluating the evidence from various epidemiological study designs. Annu. Rev. Public Health 2019, 40, 221–238. [Google Scholar]
- Mornet, E.; Kania, R.; Sauvaget, E.; Herman, P.; Tran Ba Huy, P. Vestibular schwannoma and cell-phones. Results, limits and perspectives of clinical studies. Eur. Ann. Otorhinolaryngol. Head Neck Dis. 2013, 130, 275–282. [Google Scholar]
- Hardell, L.; Carlberg, M.; Söderqvist, F.; Mild, K.H.; Morgan, L.L. Long-term use of cellular phones and brain tumours: Increased risk associated with use for > or =10 years. Occup. Environ. Med. 2007, 64, 626–632. [Google Scholar]
- Warren, C.; James, L.A.; Ramsden, R.T.; Wallace, A.; Baser, M.E.; Varley, J.; Evans, D. Identification of recurrent regions of chromosome loss and gain in vestibular schwannomas using comparative genomic hybridisation. J. Med. Genet. 2003, 40, 802–806. [Google Scholar]
- Preston, D.L.; Ron, E.; Yonehara, S.; Kobuke, T.; Fujii, H.; Kishikawa, M.; Tokunaga, M.; Tokuoka, S.; Mabuchi, K. Tumors of the nervous system and pituitary gland associated with atomic bomb radiation exposure. J. Natl. Cancer Inst. 2002, 94, 1555–1563. [Google Scholar]
- Halliday, J.; Rutherford, S.A.; McCabe, M.G.; Evans, D.G. An update on the diagnosis and treatment of vestibular schwannoma. Expert Rev. Neurother. 2018, 18, 29–39. [Google Scholar]
- Fortnum, H.; O’Neill, C.; Taylor, R.; Lenthall, R.; Nikolopoulos, T.; Lightfoot, G.; O’Donoghue, G.; Mason, S.; Baguley, D.; Jones, H.; et al. The role of magnetic resonance imaging in the identification of suspected acoustic neuroma: A systematic review of clinical and cost effectiveness and natural history. Health Technol. Assess 2009, 13, 1–154. [Google Scholar]
- Cheng, T.C.; Wareing, M.J. Three-year ear, nose, and throat cross-sectional analysis of audiometric protocols for magnetic resonance imaging screening of acoustic tumors. Otolaryngol. Head Neck Surg. 2012, 146, 438–447. [Google Scholar]
- Whiting, P.F.; Rutjes, A.W.; Westwood, M.E.; Mallett, S.; Deeks, J.J.; Reitsma, J.B.; Leeflang, M.M.; Sterne, J.A.; Bossuyt, P.M.; QUADAS-2 Group. QUADAS-2: A revised tool for the quality assessment of diagnostic accuracy studies. Ann. Intern. Med. 2011, 155, 529–536. [Google Scholar]
- Obholzer, R.J.; Rea, P.A.; Harcourt, J.P. Magnetic resonance imaging screening for vestibular schwannoma: Analysis of published protocols. J. Laryngol. Otol. 2004, 118, 329–332. [Google Scholar]
- Gimsing, S. Vestibular schwannoma: When to look for it? J. Laryngol. Otol. 2010, 124, 258–264. [Google Scholar]
- Saliba, I.; Bergeron, M.; Martineau, G.; Chagnon, M. Rule 3,000: A more reliable precursor to perceive vestibular schwannoma on MRI in screened asymmetric sensorineural hearing loss. Eur. Arch. Otorhinolaryngol. 2011, 268, 207–212. [Google Scholar]
- Bhargava, E.K.; Coyle, P.; Wong, B.; Masood, A.; Qayyum, A. To Scan or Not to Scan-A Cross-Sectional Analysis of the Clinical Efficacy and Cost-Effectiveness of Audiometric Protocols for Magnetic Resonance Imaging Screening of Vestibular Schwannomas. Otol. Neurotol. 2019, 40, S59–S66. [Google Scholar]
- Vnencak, M.; Huttunen, E.; Aarnisalo, A.A.; Jero, J.; Liukkonen, K.; Sinkkonen, S.T. Evaluation of pure-tone audiometric protocols in vestibular schwannoma screening. J. Otol. 2021, 16, 138–143. [Google Scholar]
- Celis-Aguilar, E.; Obeso-Pereda, A.; Castro-Bórquez, K.M.; Dehesa-Lopez, E.; Vega-Alarcon, A.; Coutinho-De Toledo, H. Multiple Audiometric Analysis in the Screening of Vestibular Schwannoma. Cureus 2022, 14, e21492. [Google Scholar]
- Mangham, C.A. Hearing threshold difference between ears and risk of acoustic tumor. Otolaryngol. Head Neck Surg. 1991, 105, 814–817. [Google Scholar]
- Dawes, P.J.; Jeannon, J.P. Audit of regional screening guidelines for vestibular schwannoma. J. Laryngol. Otol. 1998, 112, 860–864. [Google Scholar]
- Neary, W.J.; Newton, V.E.; Laoide-Kemp, S.N.; Ramsden, R.T.; Hillier, V.F.; Kan, S.W. A clinical, genetic and audiological study of patients and families with unilateral vestibular schwannomas. II. Audiological findings in 93 patients with unilateral vestibular schwannomas. J. Laryngol. Otol. 1996, 110, 1120–1128. [Google Scholar]
- Schlauch, R.S.; Levine, S.; Li, Y.; Haines, S. Evaluating hearing threshold differences between ears as a screen for acoustic neuroma. J. Speech Hear. Res. 1995, 38, 1168–1175. [Google Scholar]
- Sheppard, I.J.; Milford, C.A.; Anslow, P. MRI in the detection of acoustic neuromas—A suggested protocol for screening. Clin. Otolaryngol. Allied Sci. 1996, 21, 301–304. [Google Scholar]
- Hunter, L.L.; Ries, D.T.; Schlauch, R.S.; Levine, S.C.; Ward, W.D. Safety and clinical performance of acoustic reflex tests. Ear Hear. 1999, 20, 506–514. [Google Scholar]
- Margolis, R.H.; Saly, G.L. Asymmetric hearing loss: Definition, validation, and prevalence. Otol. Neurotol. 2008, 29, 422–431. [Google Scholar]
- Urben, S.L.; Benninger, M.S.; Gibbens, N.D. Asymmetric sensorineural hearing loss in a community-based population. Otolaryngol. Head Neck Surg. 1999, 120, 809–814. [Google Scholar]
- Welling, D.B.; Glasscock, M.E., III; Woods, C.I.; Jackson, C.G. Acoustic neuroma: A cost-effective approach. Otolaryngol. Head Neck Surg. 1990, 103, 364–370. [Google Scholar]
- Basu, S.; Youngs, R.; Mitchell-Innes, A. Screening for vestibular schwannoma in the context of an ageing population. J. Laryngol. Otol. 2019, 133, 640–649. [Google Scholar]
- Wilson, Y.L.; Gandolfi, M.M.; Ahn, I.E.; Yu, G.; Huang, T.C.; Kim, A.H. Cost analysis of asymmetric sensorineural hearing loss investigations. Laryngoscope 2010, 120, 1832–1836. [Google Scholar]
- Pan, P.; Huang, J.; Morioka, C.; Hathout, G.; El-Saden, S.M. Cost analysis of vestibular schwannoma screening with contrast-enhanced magnetic resonance imaging in patients with asymmetrical hearing loss. J. Laryngol. Otol. 2016, 130, 21–24. [Google Scholar]
- Jayawardena, A.; Waller, B.; Edwards, B.; Larsen-Reindorf, R.; Esinam Anomah, J.; Frimpong, B.; Gina, A.; Netterville, J.; Saunders, J.; Basura, G.J. Portable audiometric screening platforms used in low-resource settings: A review. J. Laryngol. Otol. 2019, 133, 74–79. [Google Scholar]
- Goldbrunner, R.; Weller, M.; Regis, J.; Lund-Johansen, M.; Stavrinou, P.; Reuss, D.; Evans, D.G.; Lefranc, F.; Sallabanda, K.; Falini, A.; et al. EANO guideline on the diagnosis and treatment of vestibular schwannoma. Neuro Oncol. 2020, 22, 31–45. [Google Scholar]
- Profant, O.; Bureš, Z.; Balogová, Z.; Betka, J.; Fík, Z.; Chovanec, M.; Voráček, J. Decision making on vestibular schwannoma treatment: Predictions based on machine-learning analysis. Sci. Rep. 2021, 11, 18376. [Google Scholar]
- Hentschel, M.; Scholte, M.; Steens, S.; Kunst, H.; Rovers, M. The diagnostic accuracy of non-imaging screening protocols for vestibular schwannoma in patients with asymmetrical hearing loss and/or unilateral audiovestibular dysfunction: A diagnostic review and meta-analysis. Clin. Otolaryngol. 2017, 42, 815–823. [Google Scholar]
- Song, X.D.; Wallace, B.M.; Gardner, J.R.; Ledbetter, N.M.; Weinberger, K.Q.; Barbour, D.L. Fast, Continuous Audiogram Estimation Using Machine Learning. Ear Hear. 2015, 36, e326–e335. [Google Scholar]
- Rahne, T.; Buthut, F.; Plößl, S.; Plontke, S.K. A software tool for pure-tone audiometry. Classification of audiograms for inclusion of patients in clinical trials. HNO 2016, 64 (Suppl. 1), S1–S6. [Google Scholar]
- Pavlič, J.; Tomažič, T.; Kožuh, I. The impact of emerging technology influences product placement effectiveness: A scoping study from interactive marketing perspective. J. Res. Interact. Mark 2021. ahead of print. [Google Scholar]
- Smole-Orehek, K.; Hvalič Touzery, S.; Petrovčič, A.; Dolnicar, V.; Debevc, M.; Kozuh, I. Psychological outcomes of eCare technologies use for informal carers: A scoping study. Gerontechnology 2019, 18, 15–28. [Google Scholar]
- Carey, G.E.; Jacobson, C.E.; Warburton, A.N.; Biddle, E.; Mannarelli, G.; Wilson, M.; Stucken, E.Z. Machine Learning for Vestibular Schwannoma Diagnosis Using Audiometrie Data Alone. Otol. Neurotol. 2022, 43, e530–e534. [Google Scholar]
- Dang, S.; Manzoor, N.F.; Chowdhury, N.; Tittman, S.M.; Yancey, K.L.; Monsour, M.A.; O’Malley, M.R.; Rivas, A.; Haynes, D.S.; Bennett, M.L. Investigating Predictors of Increased Length of Stay After Resection of Vestibular Schwannoma Using Machine Learning. Otol. Neurotol. 2021, 42, e584–e592. [Google Scholar]


| Author | Year | Study Design | Number of Patients Included | Index Tests |
|---|---|---|---|---|
| Obholzer et al. [20] | 2004 | Case-control | 128 | 9 PTA protocols |
| Gimsing [21] | 2009 | Case-control | 424 | PTA shapes 8 PTA protocols |
| Saliba et al. [22] | 2011 | Cohort | 212 | 8 PTA protocols |
| Cheng et al. [18] | 2015 | Cohort | 1751 | 15 PTA protocols |
| Bhargava et al. [23] | 2019 | Cross-sectional | 1059 | 14 PTA protocols |
| Vnencak et al. [24] | 2020 | Case-control | 688 | 14 PTA protocols |
| Celis-Aguilar et al. [25] | 2022 | Cross-sectional | 107 | 15 PTA protocols |
| Study | Risk of Bias | Applicability Concerns | |||||
|---|---|---|---|---|---|---|---|
| Patient Selection | Index Test | Reference Standard | Flow and Timing | Patient Selection | Index Test | Reference Standard | |
| Gimsing | ? | ? | ☺ | ? | ☺ | ☺ | ? |
| Obholzer et al. [20] | ? | ? | ? | ? | ☺ | ☺ | ☺ |
| Saliba et al. [22] | ☺ | ☺ | ☺ | ? | ☺ | ☺ | ☺ |
| Bhargava et al. [23] | ? | ? | ? | ? | ? | ☺ | ☺ |
| Vnencak et al. [24] | ☹ | ? | ? | ? | ? | ☺ | ☺ |
| Cheng et al. [18] | ? | ? | ? | ? | ☺ | ? | ☺ |
| Celis-Aguilar et al. [25] | ☹ | ☺ | ? | ? | ? | ☺ | ☺ |
| PTA Protocol | Sensitivity (Pooled Estimate/95% CI) | Specificity (Pooled Estimate/95% CI) | Positive Likelihood Ratio (Pooled Estimate/95% CI) | Negative Likelihood Ratio (Pooled Estimate/95% CI) | Diagnostic Odds Ratio (Pooled Estimate/95% CI) |
|---|---|---|---|---|---|
| Mangham [26] | 0.93 (0.76–0.98) | 0.40 (0.26–0.55) | 1.5 (1.2–2.1) | 0.17 (0.04–0.79) | 9 (2–55) |
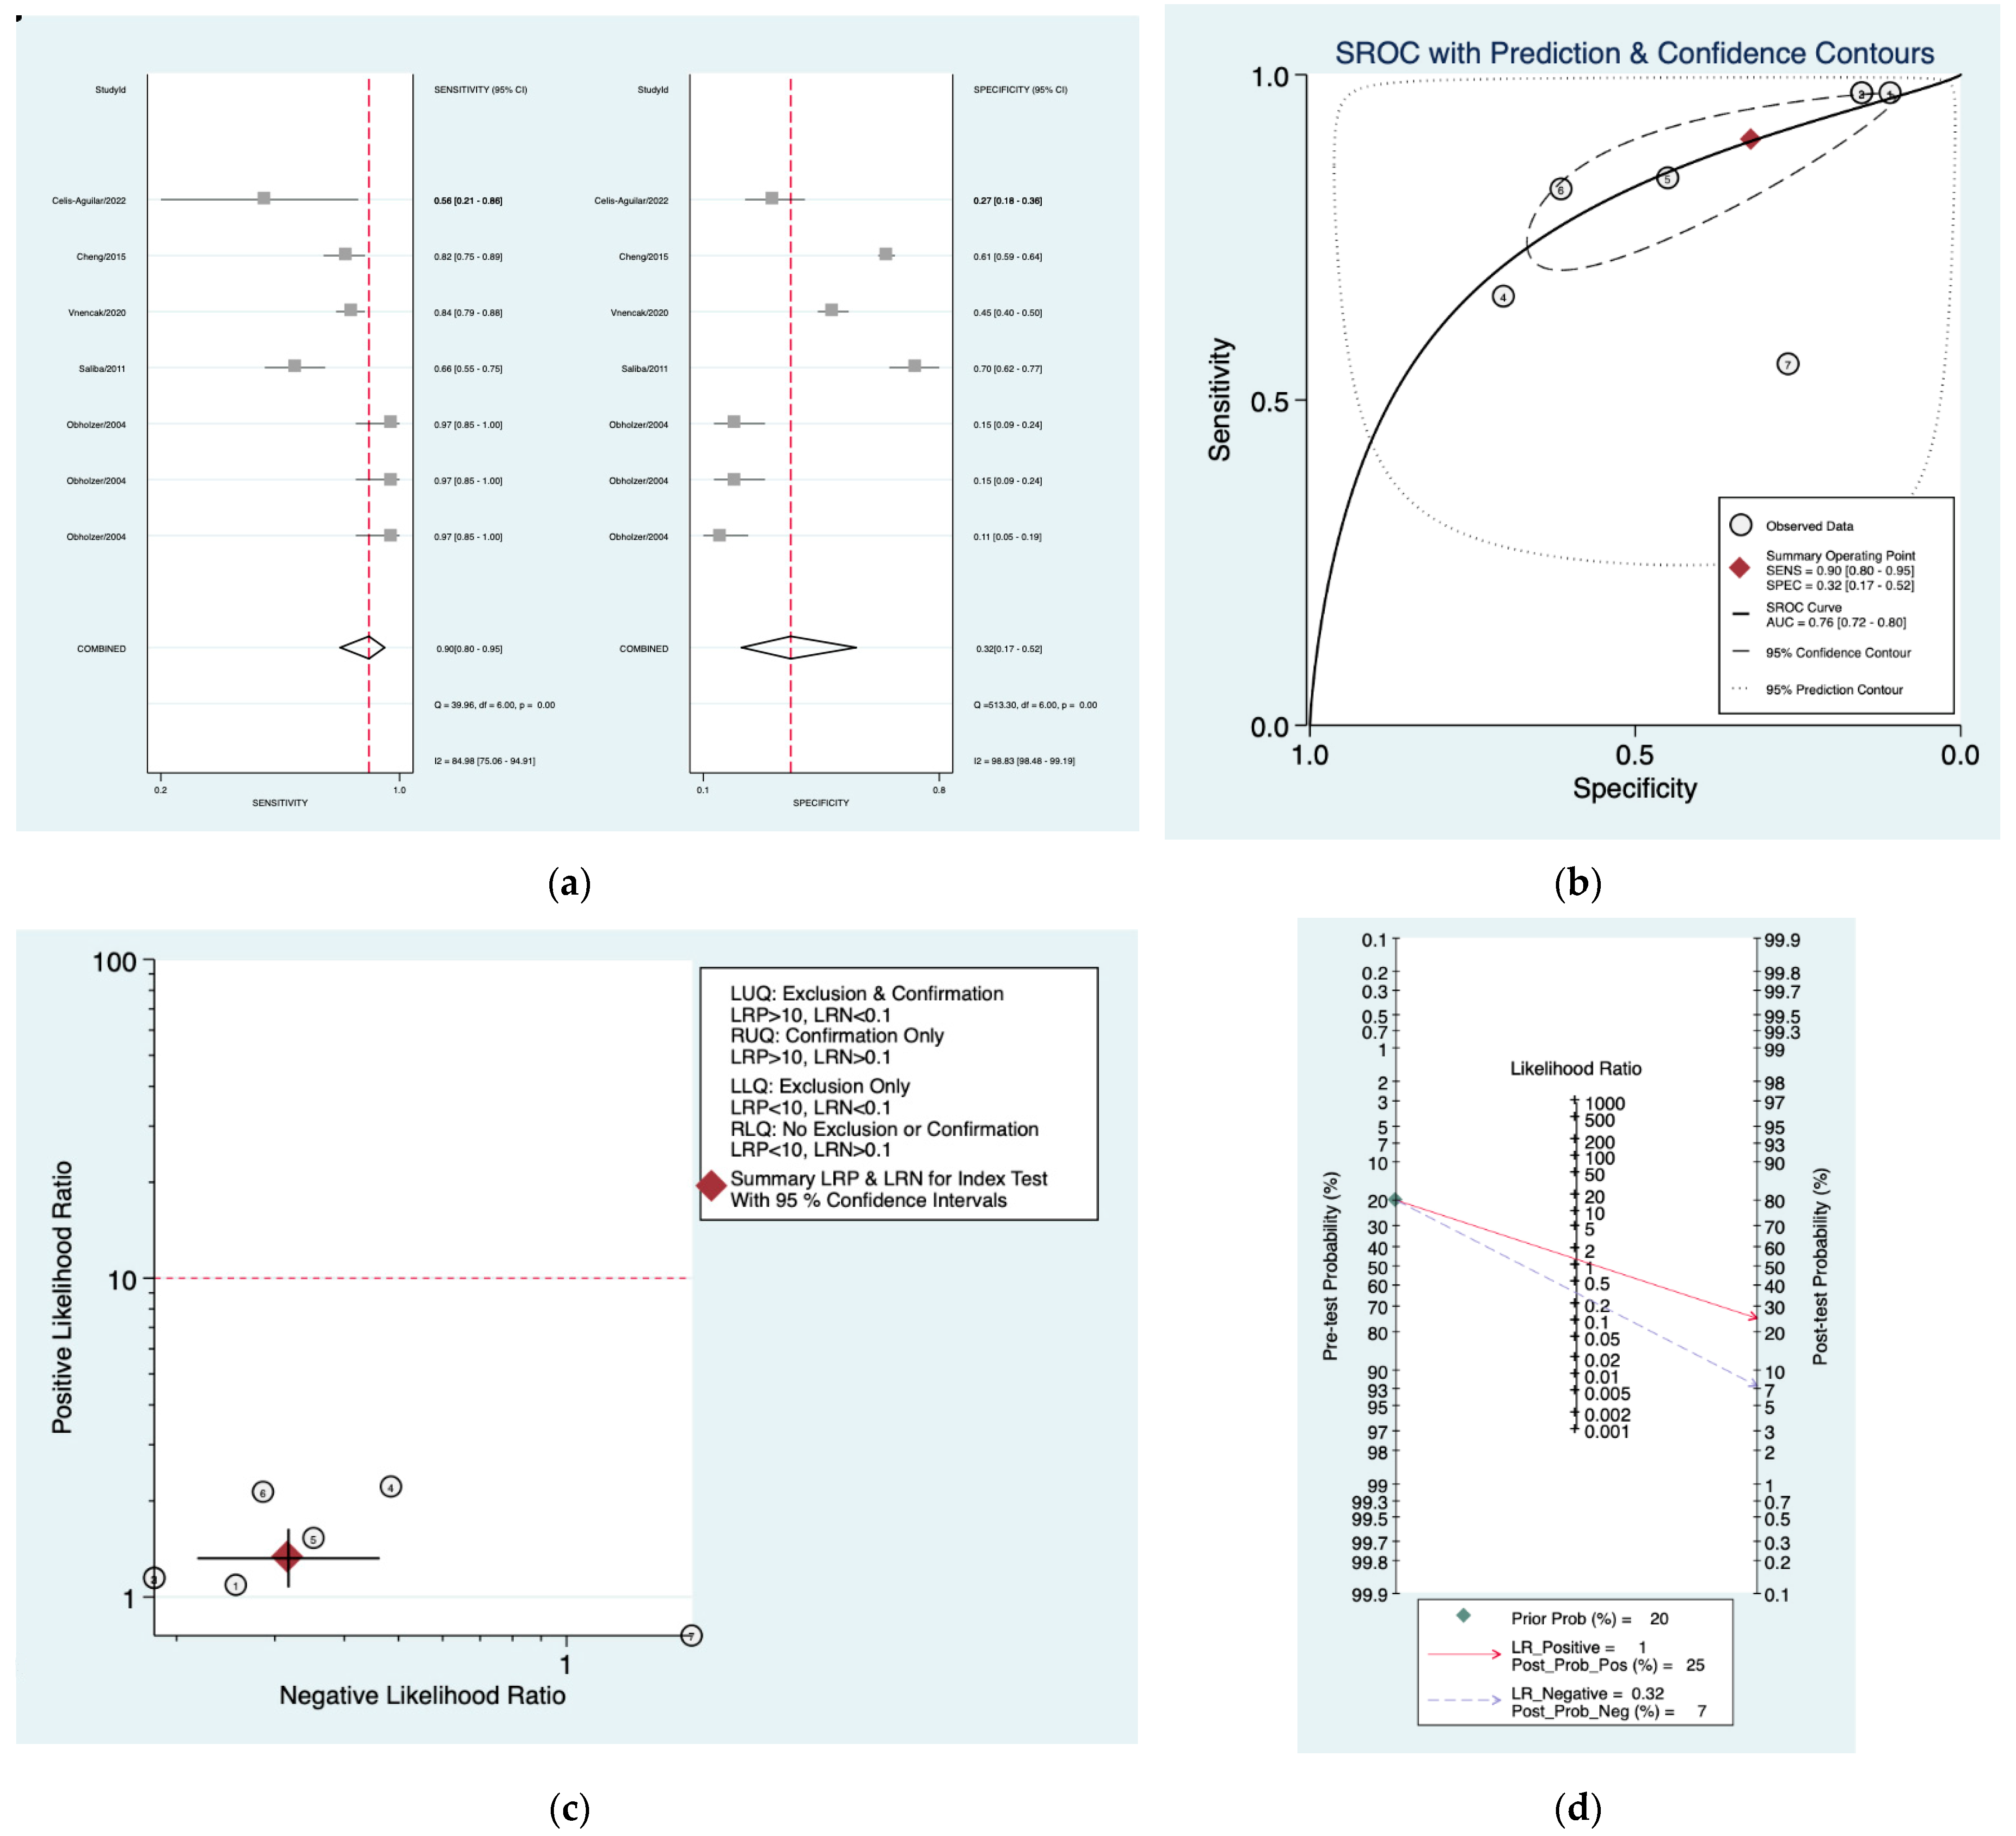
| Sunderland [27] | 0.90 (0.80–0.95) | 0.32 (0.17–0.52) | 1.3 (1.1–1.6) | 0.32 (0.22–0.46) | 4 (3–7) |
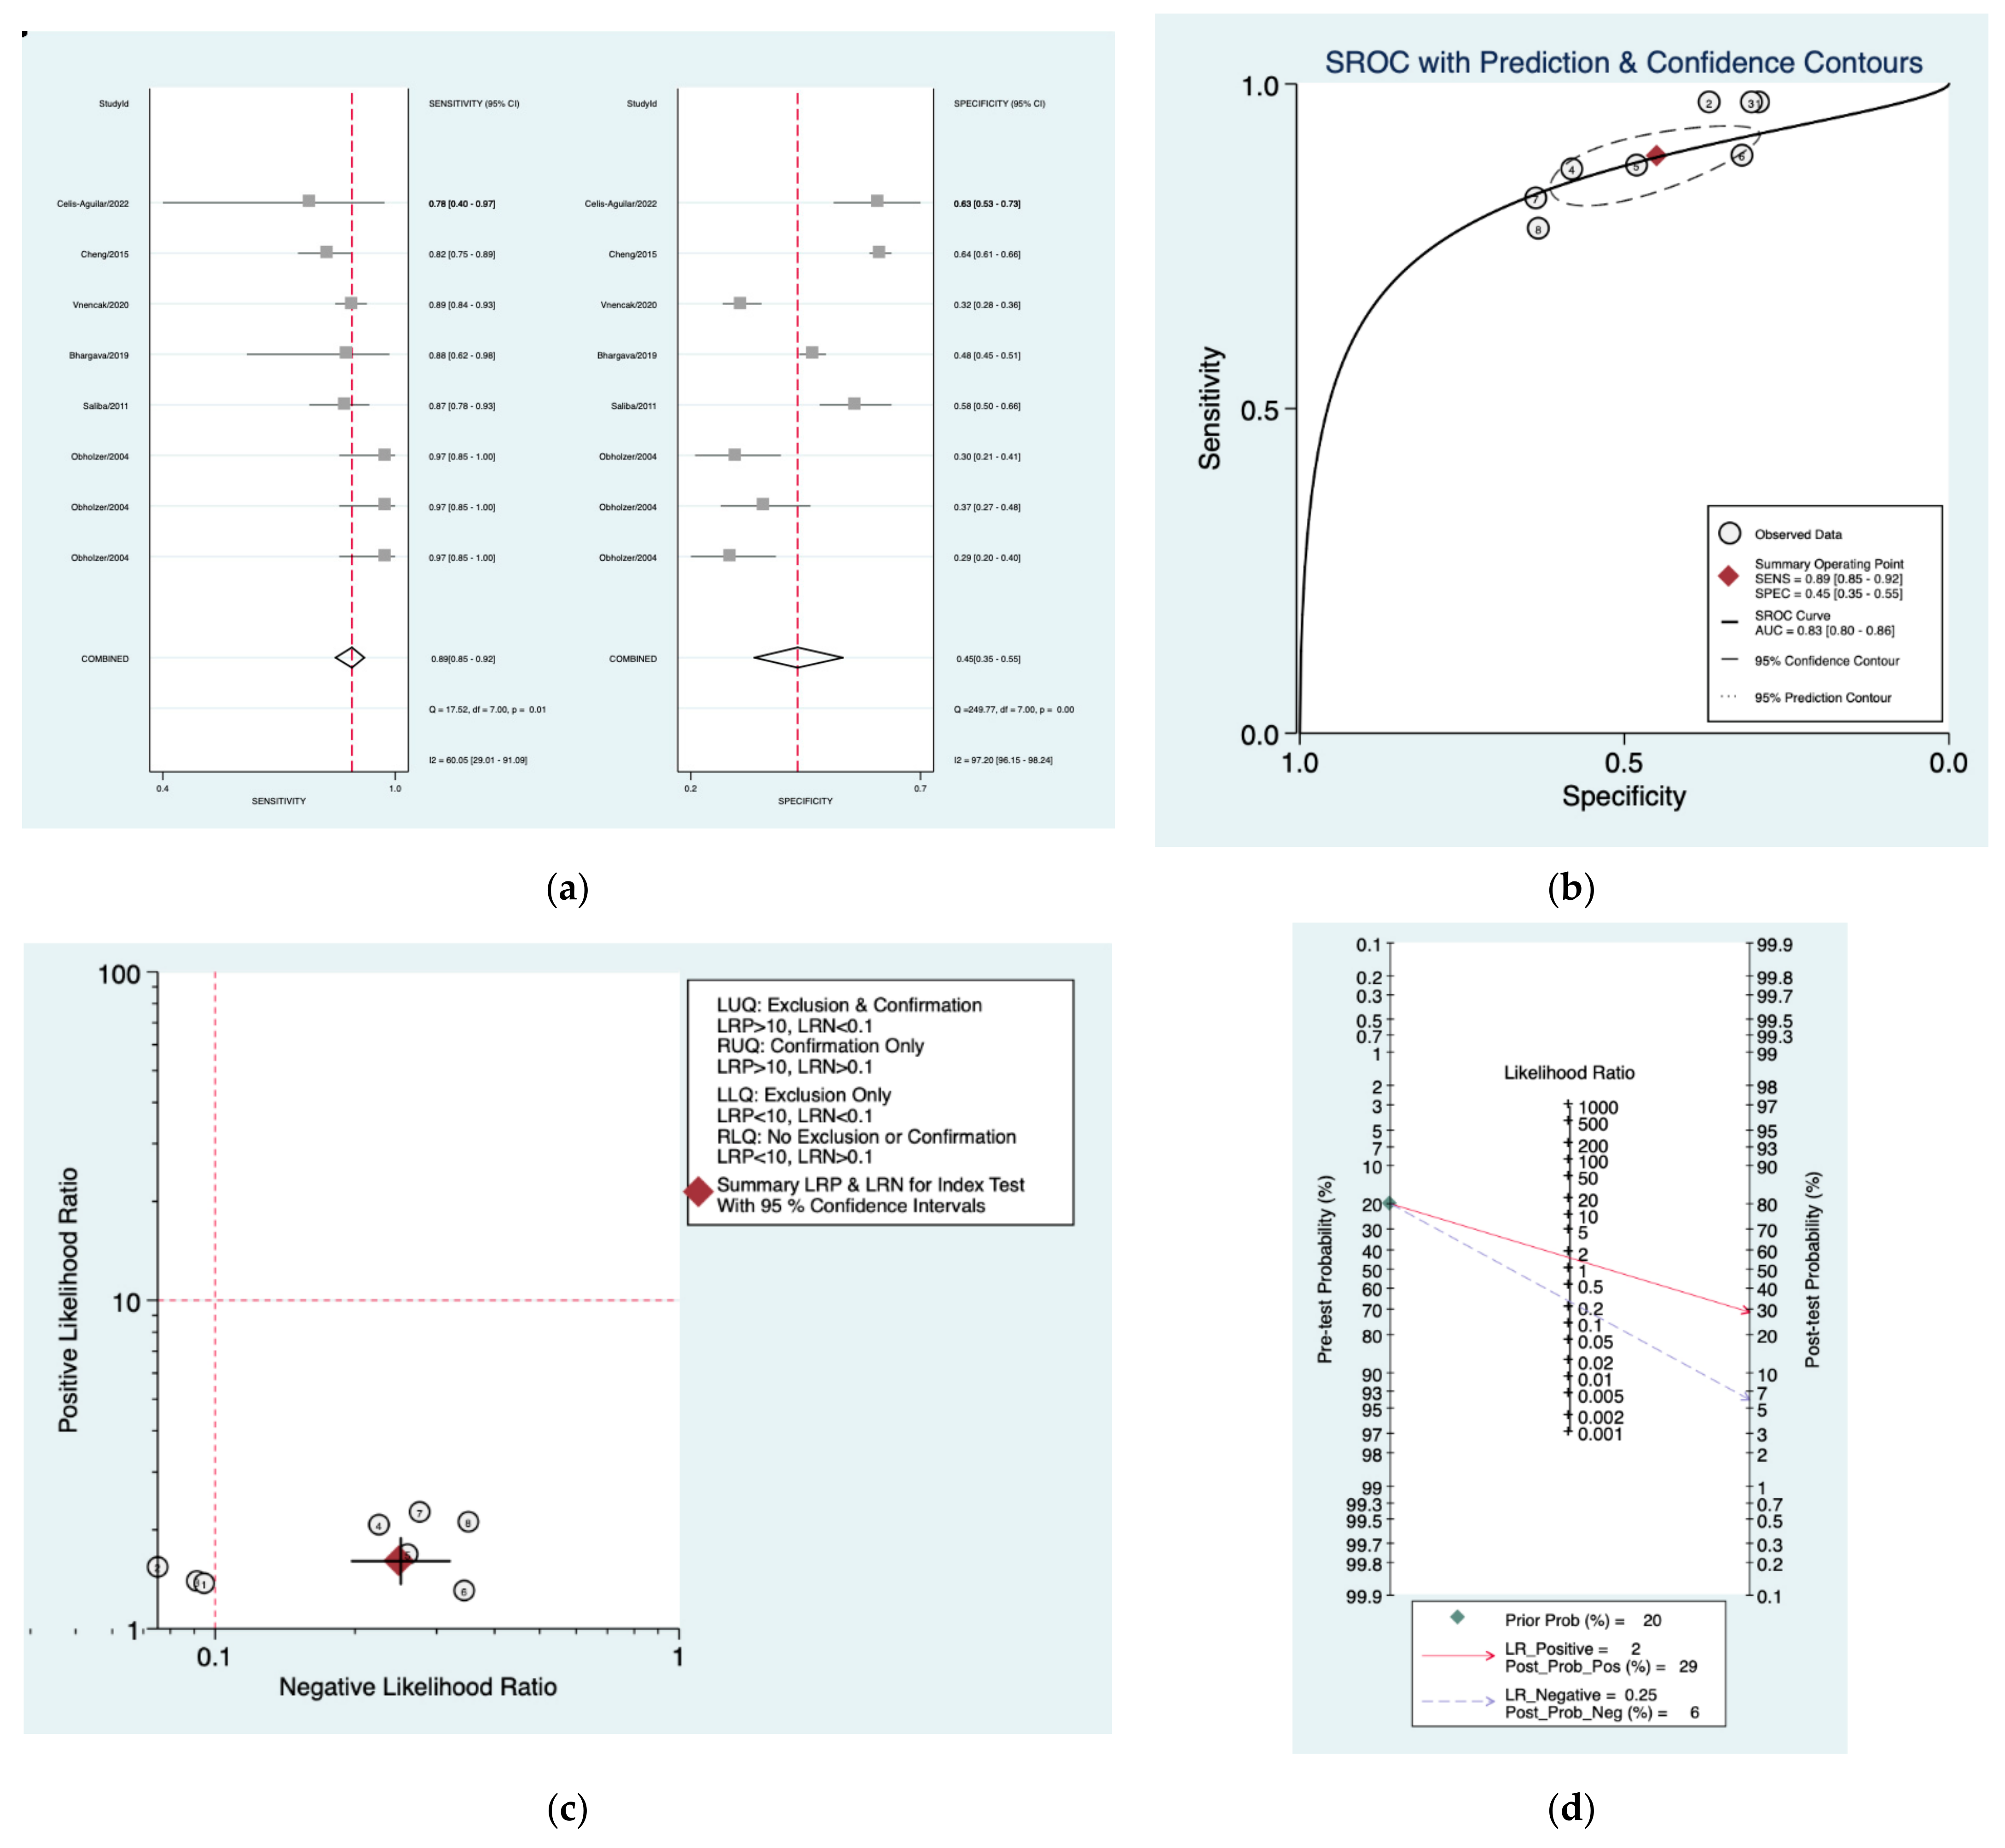
| DOH [28] | 0.89 (0.85–0.92) | 0.45 (0.35–0.55) | 1.6 (1.4–1.9) | 0.25 (0.20–0.32) | 6 (5–9) |
| Schlauch and Levine [29] | 0.73 (0.64–0.80) | 0.55 (0.44–0.66) | 1.6 (1.2–2.3) | 0.49 (0.31–0.77) | 3 (2–7) |
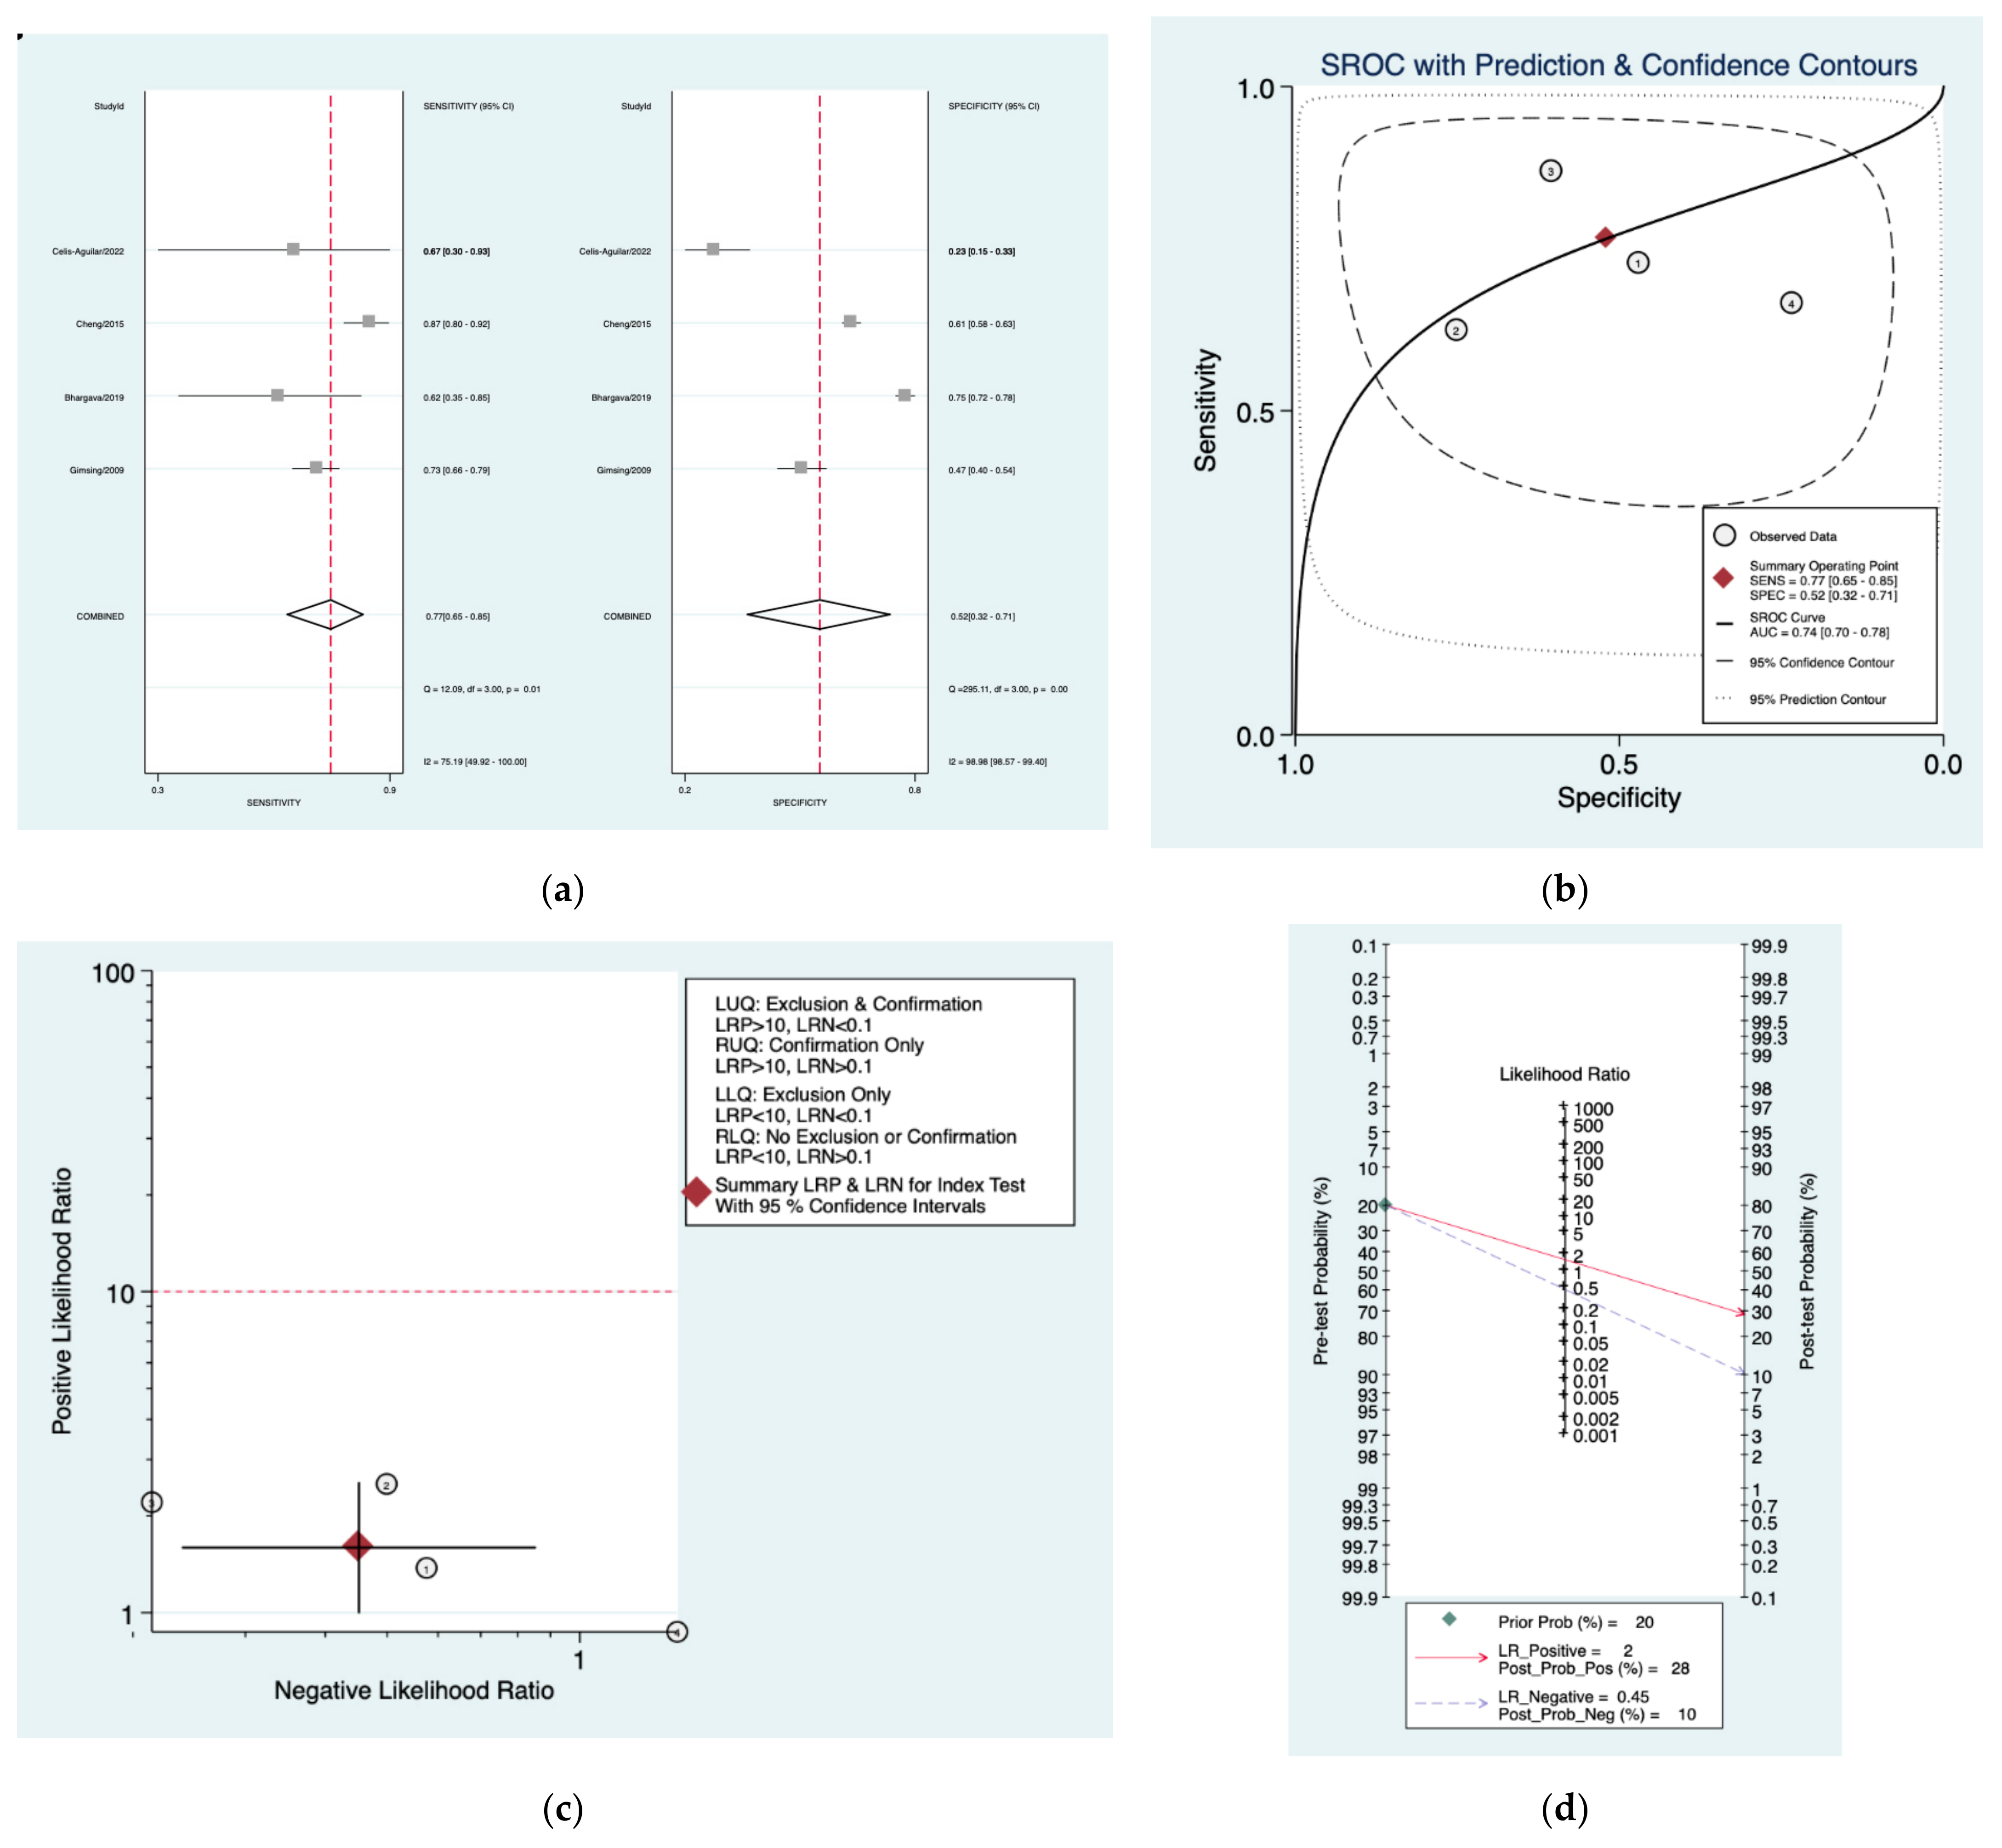
| Sheppard [30] | 0.77 (0.65–0.85) | 0.52 (0.32–0.71) | 1.6 (1.0–2.5) | 0.45 (0.24–0.85) | 4 (3–10) |
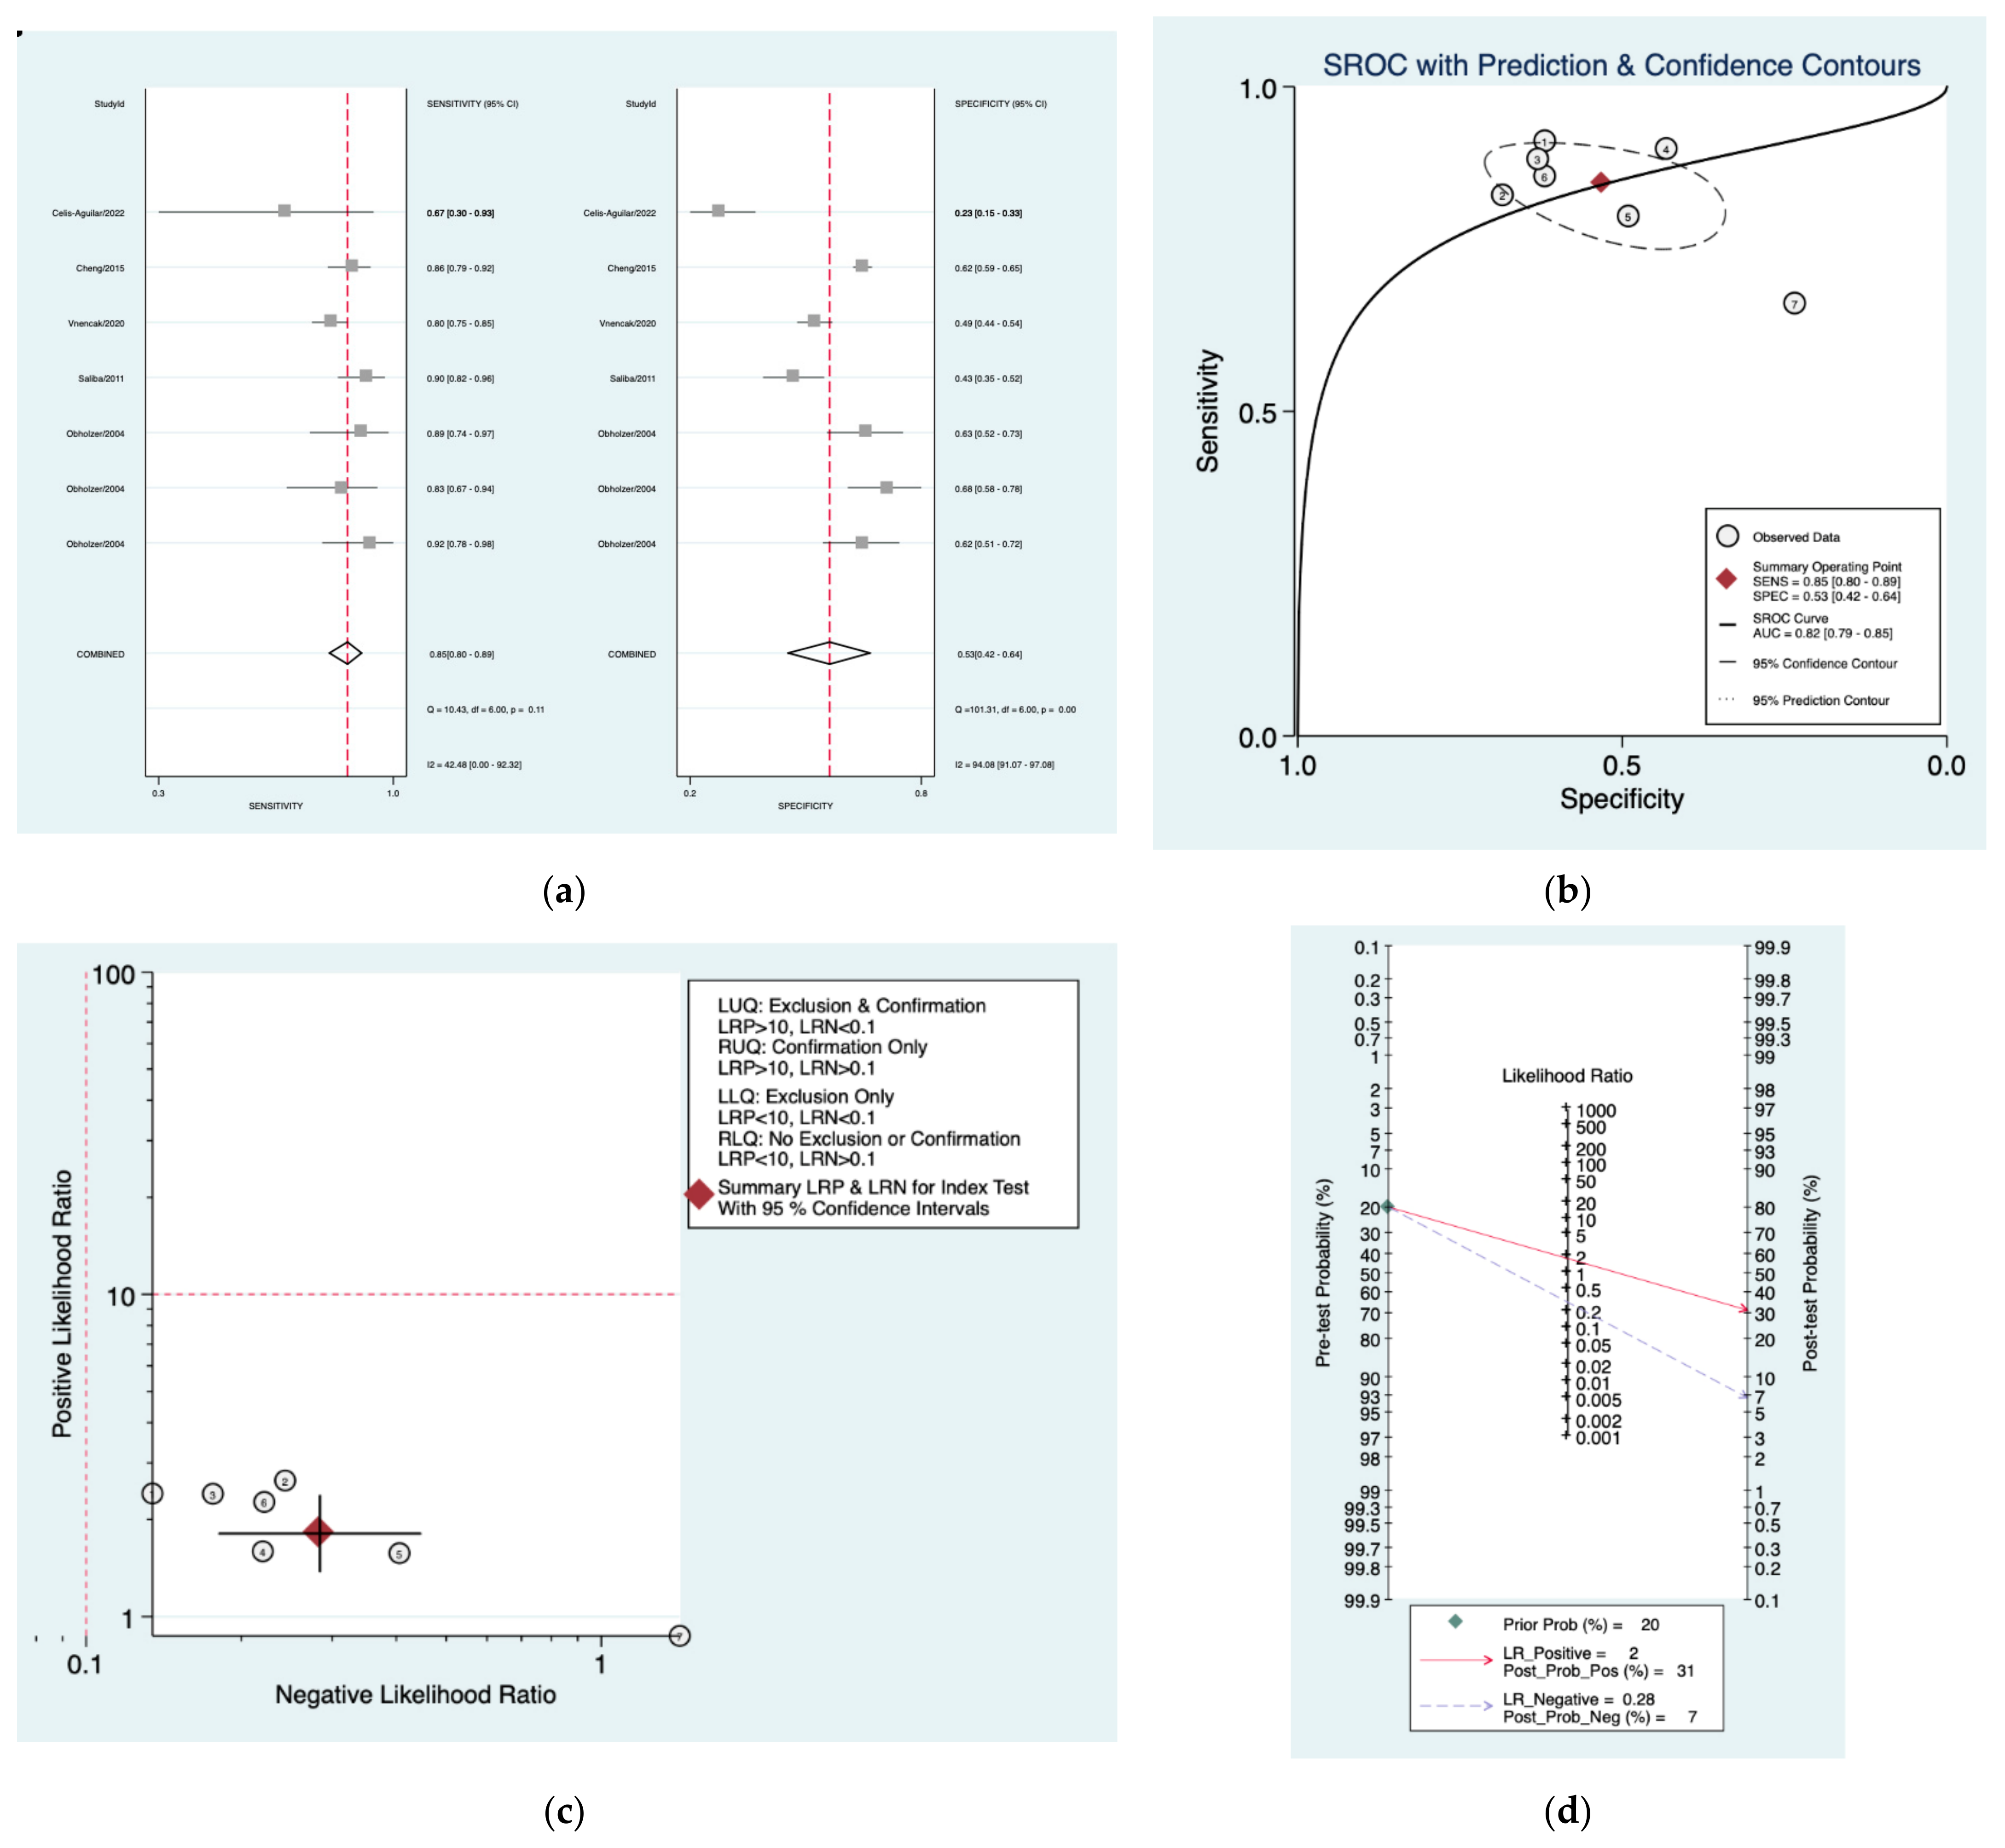
| Seattle [31] | 0.85 (0.80–0.89) | 0.53 (0.42–0.64) | 1.8 (1.4–2.4) | 0.28 (0.18–0.45) | 6 (3–13) |
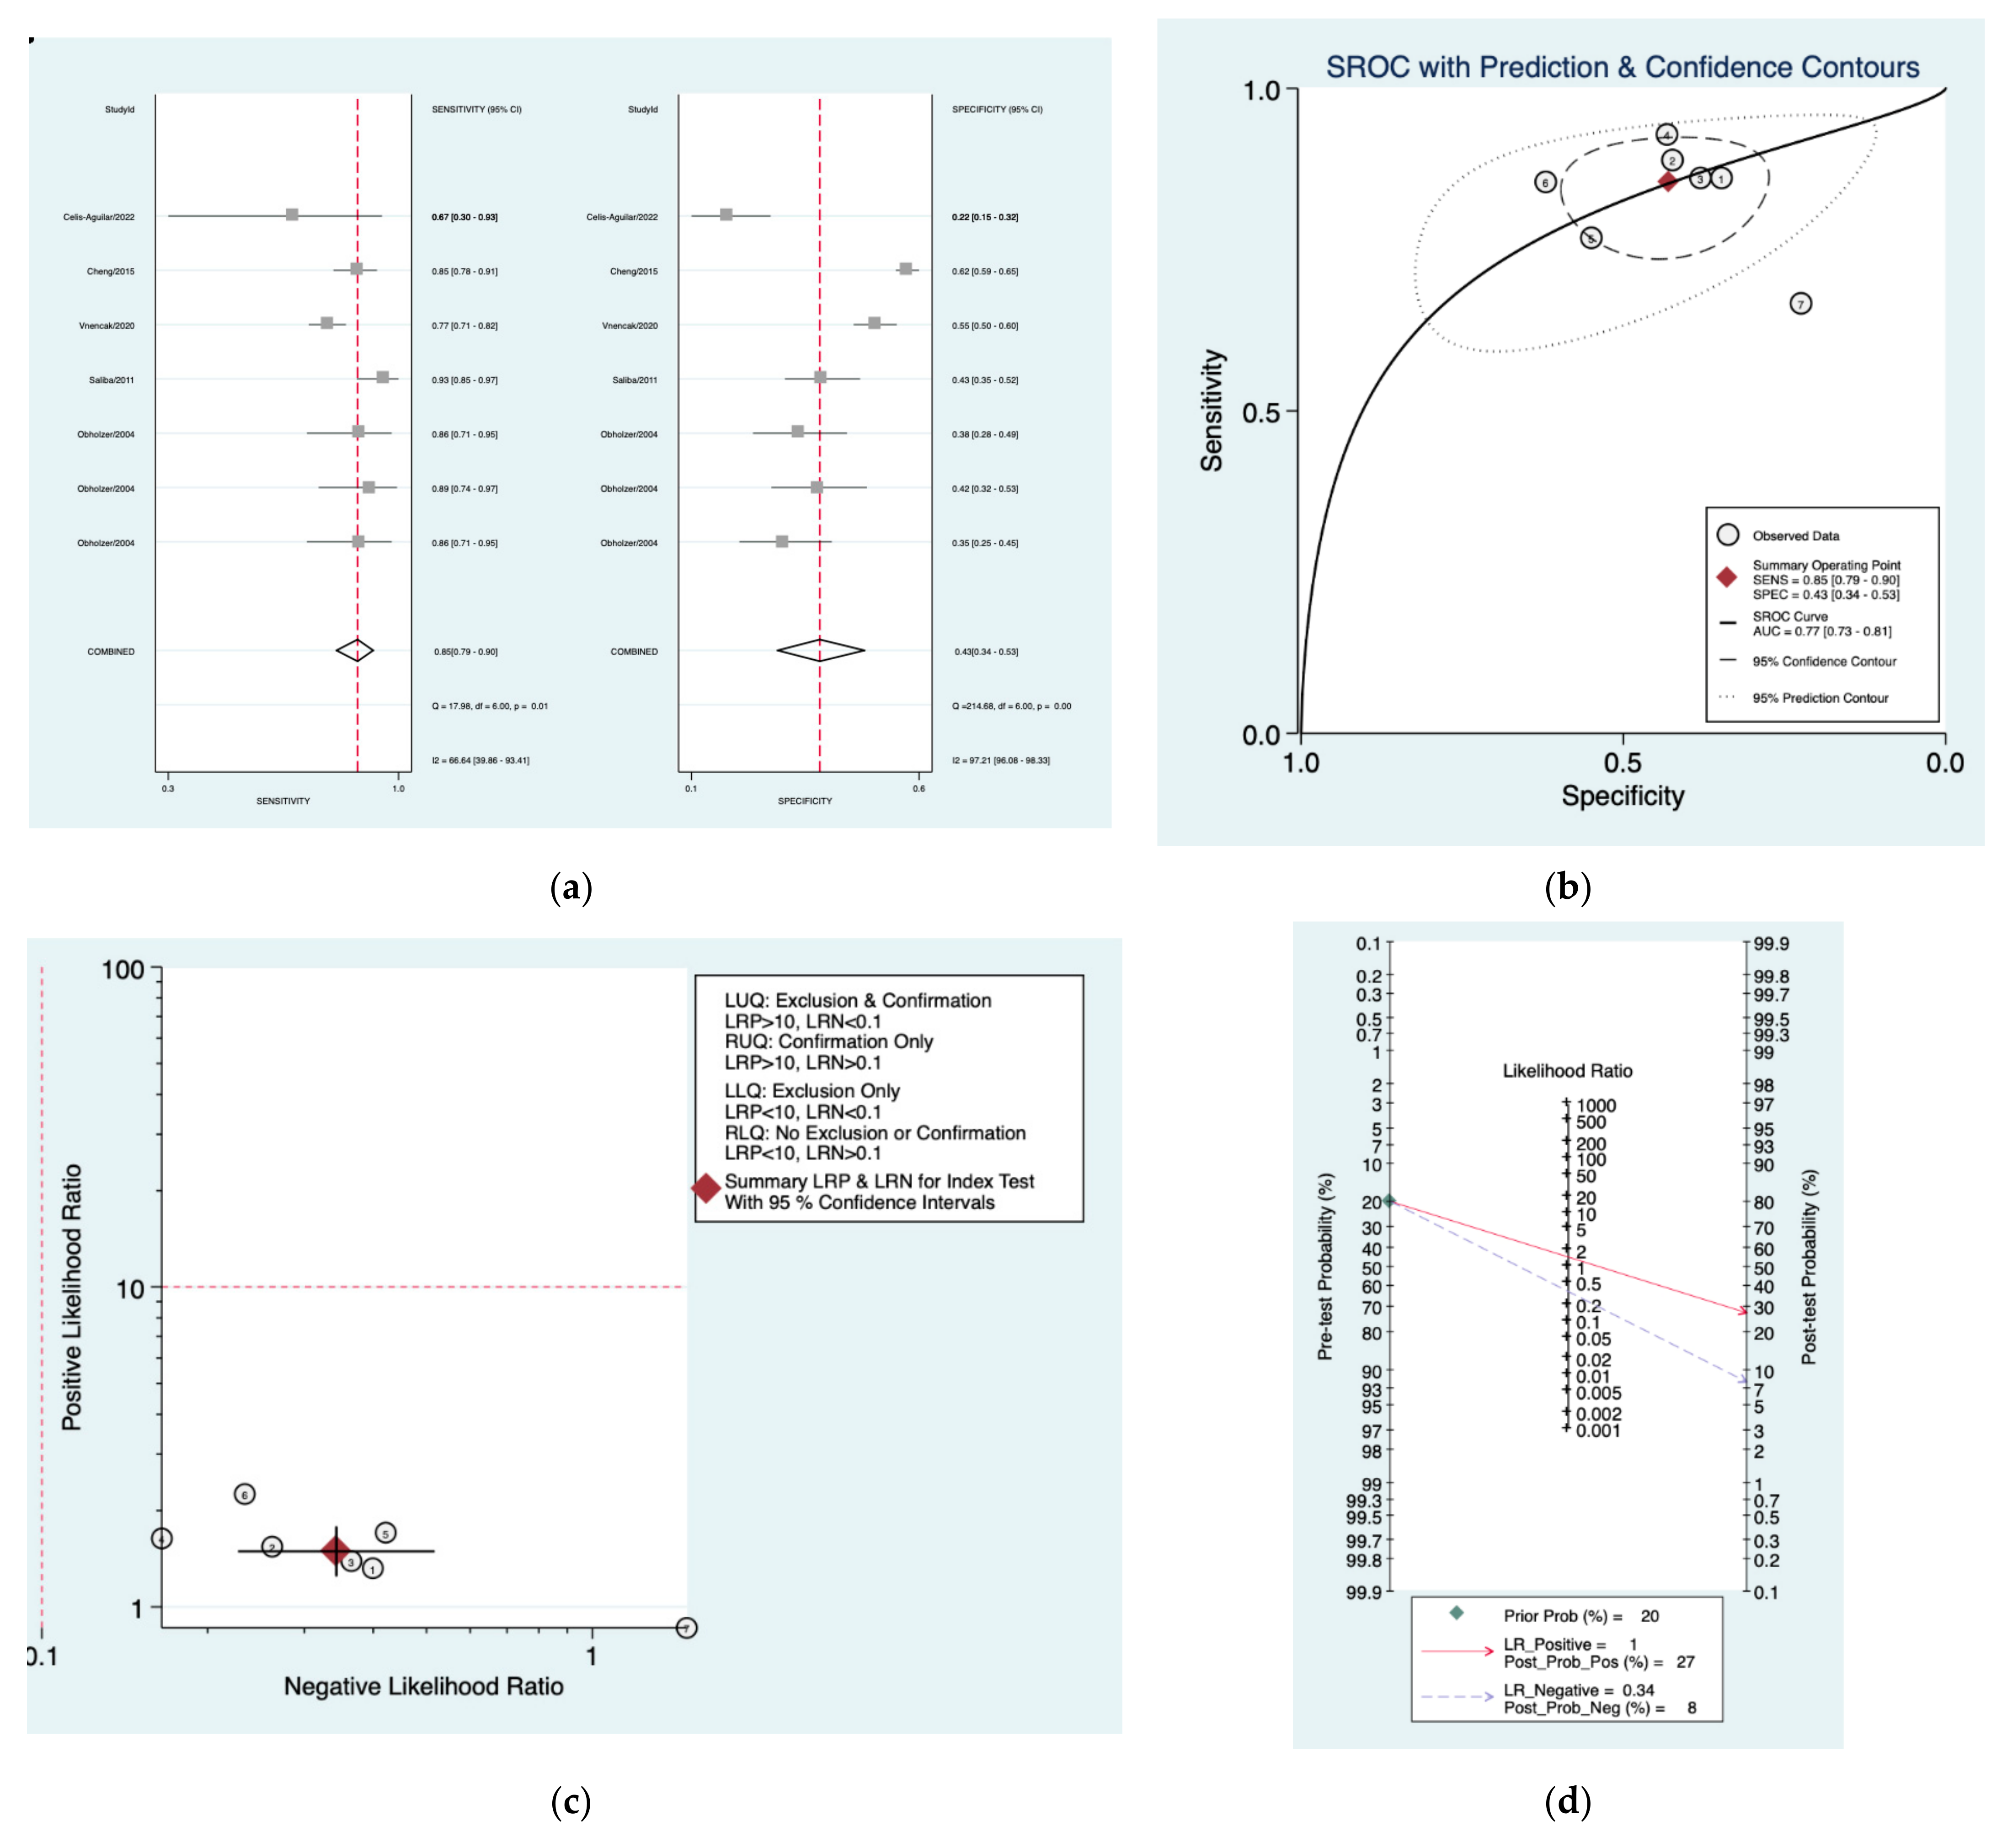
| Oxford [30] | 0.85 (0.79–0.90) | 0.43 (0.34–0.53) | 1.5 (1.3–1.8) | 0.34 (0.23–0.52) | 4 (3–8) |
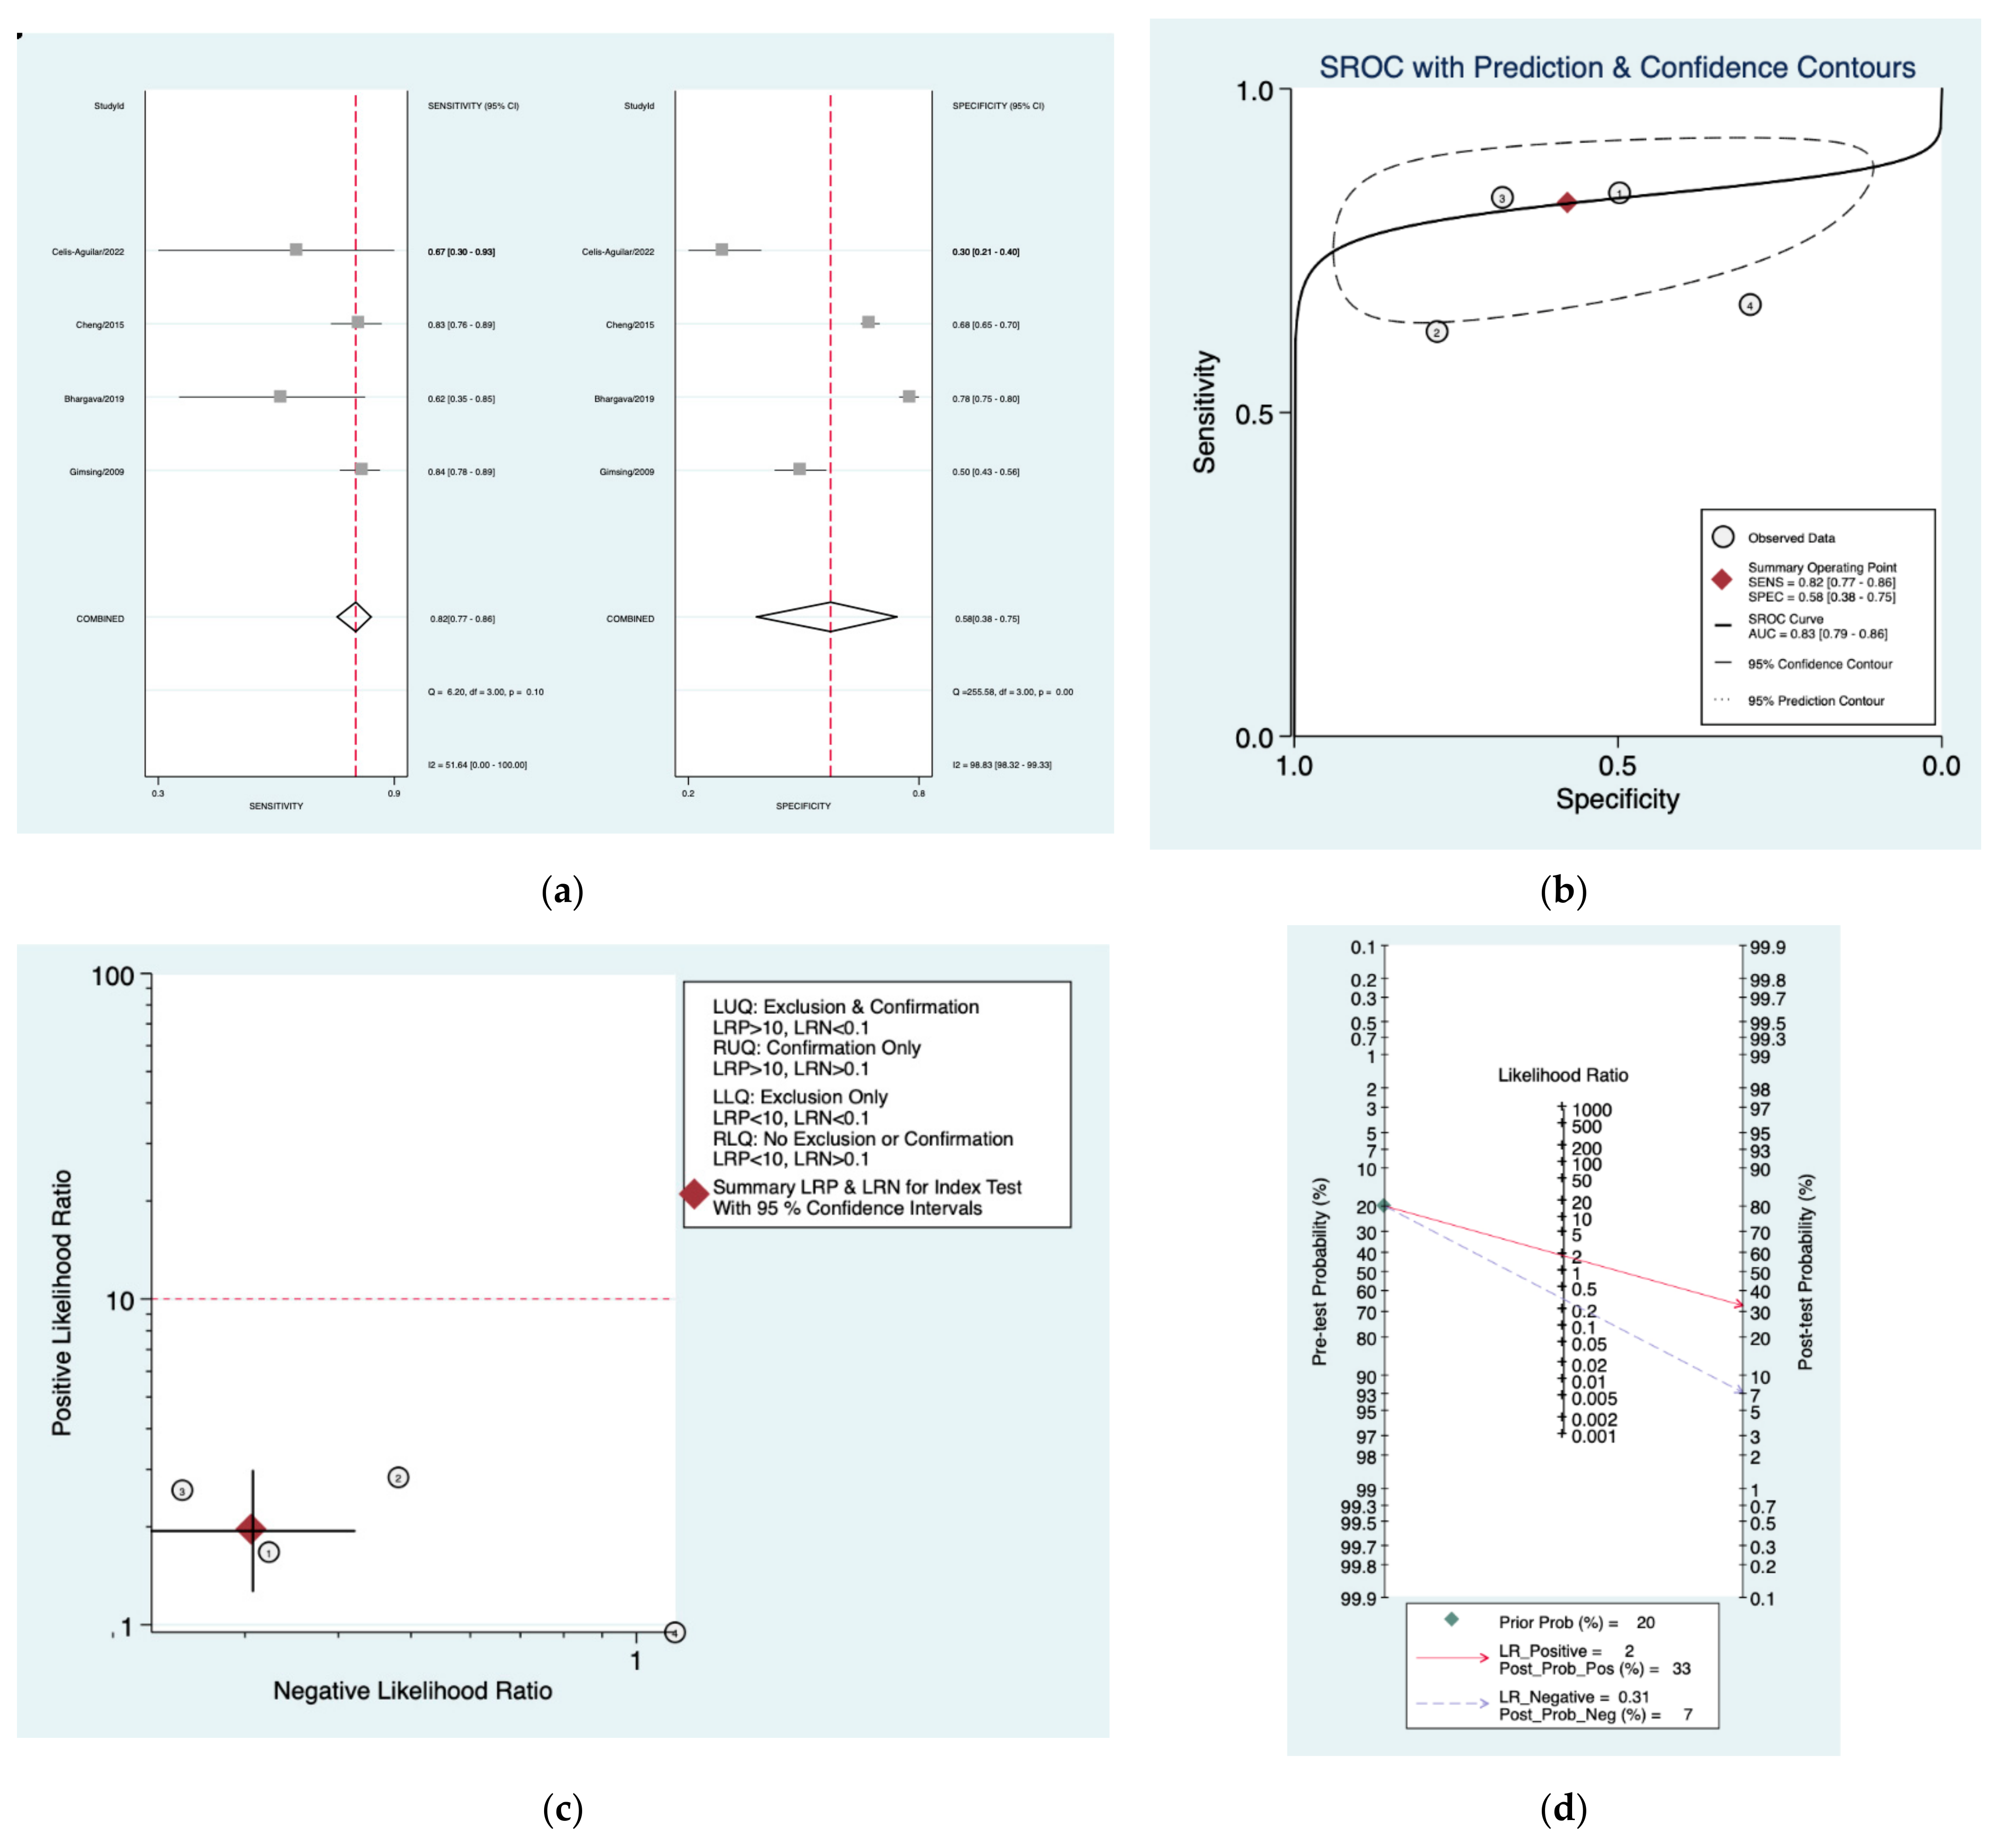
| Obholzer [20] | 0.82 (0.77–0.86) | 0.58 (0.38–0.75) | 1.9 (1.3–3.0) | 0.31 (0.23–0.42) | 6 (3–13) |
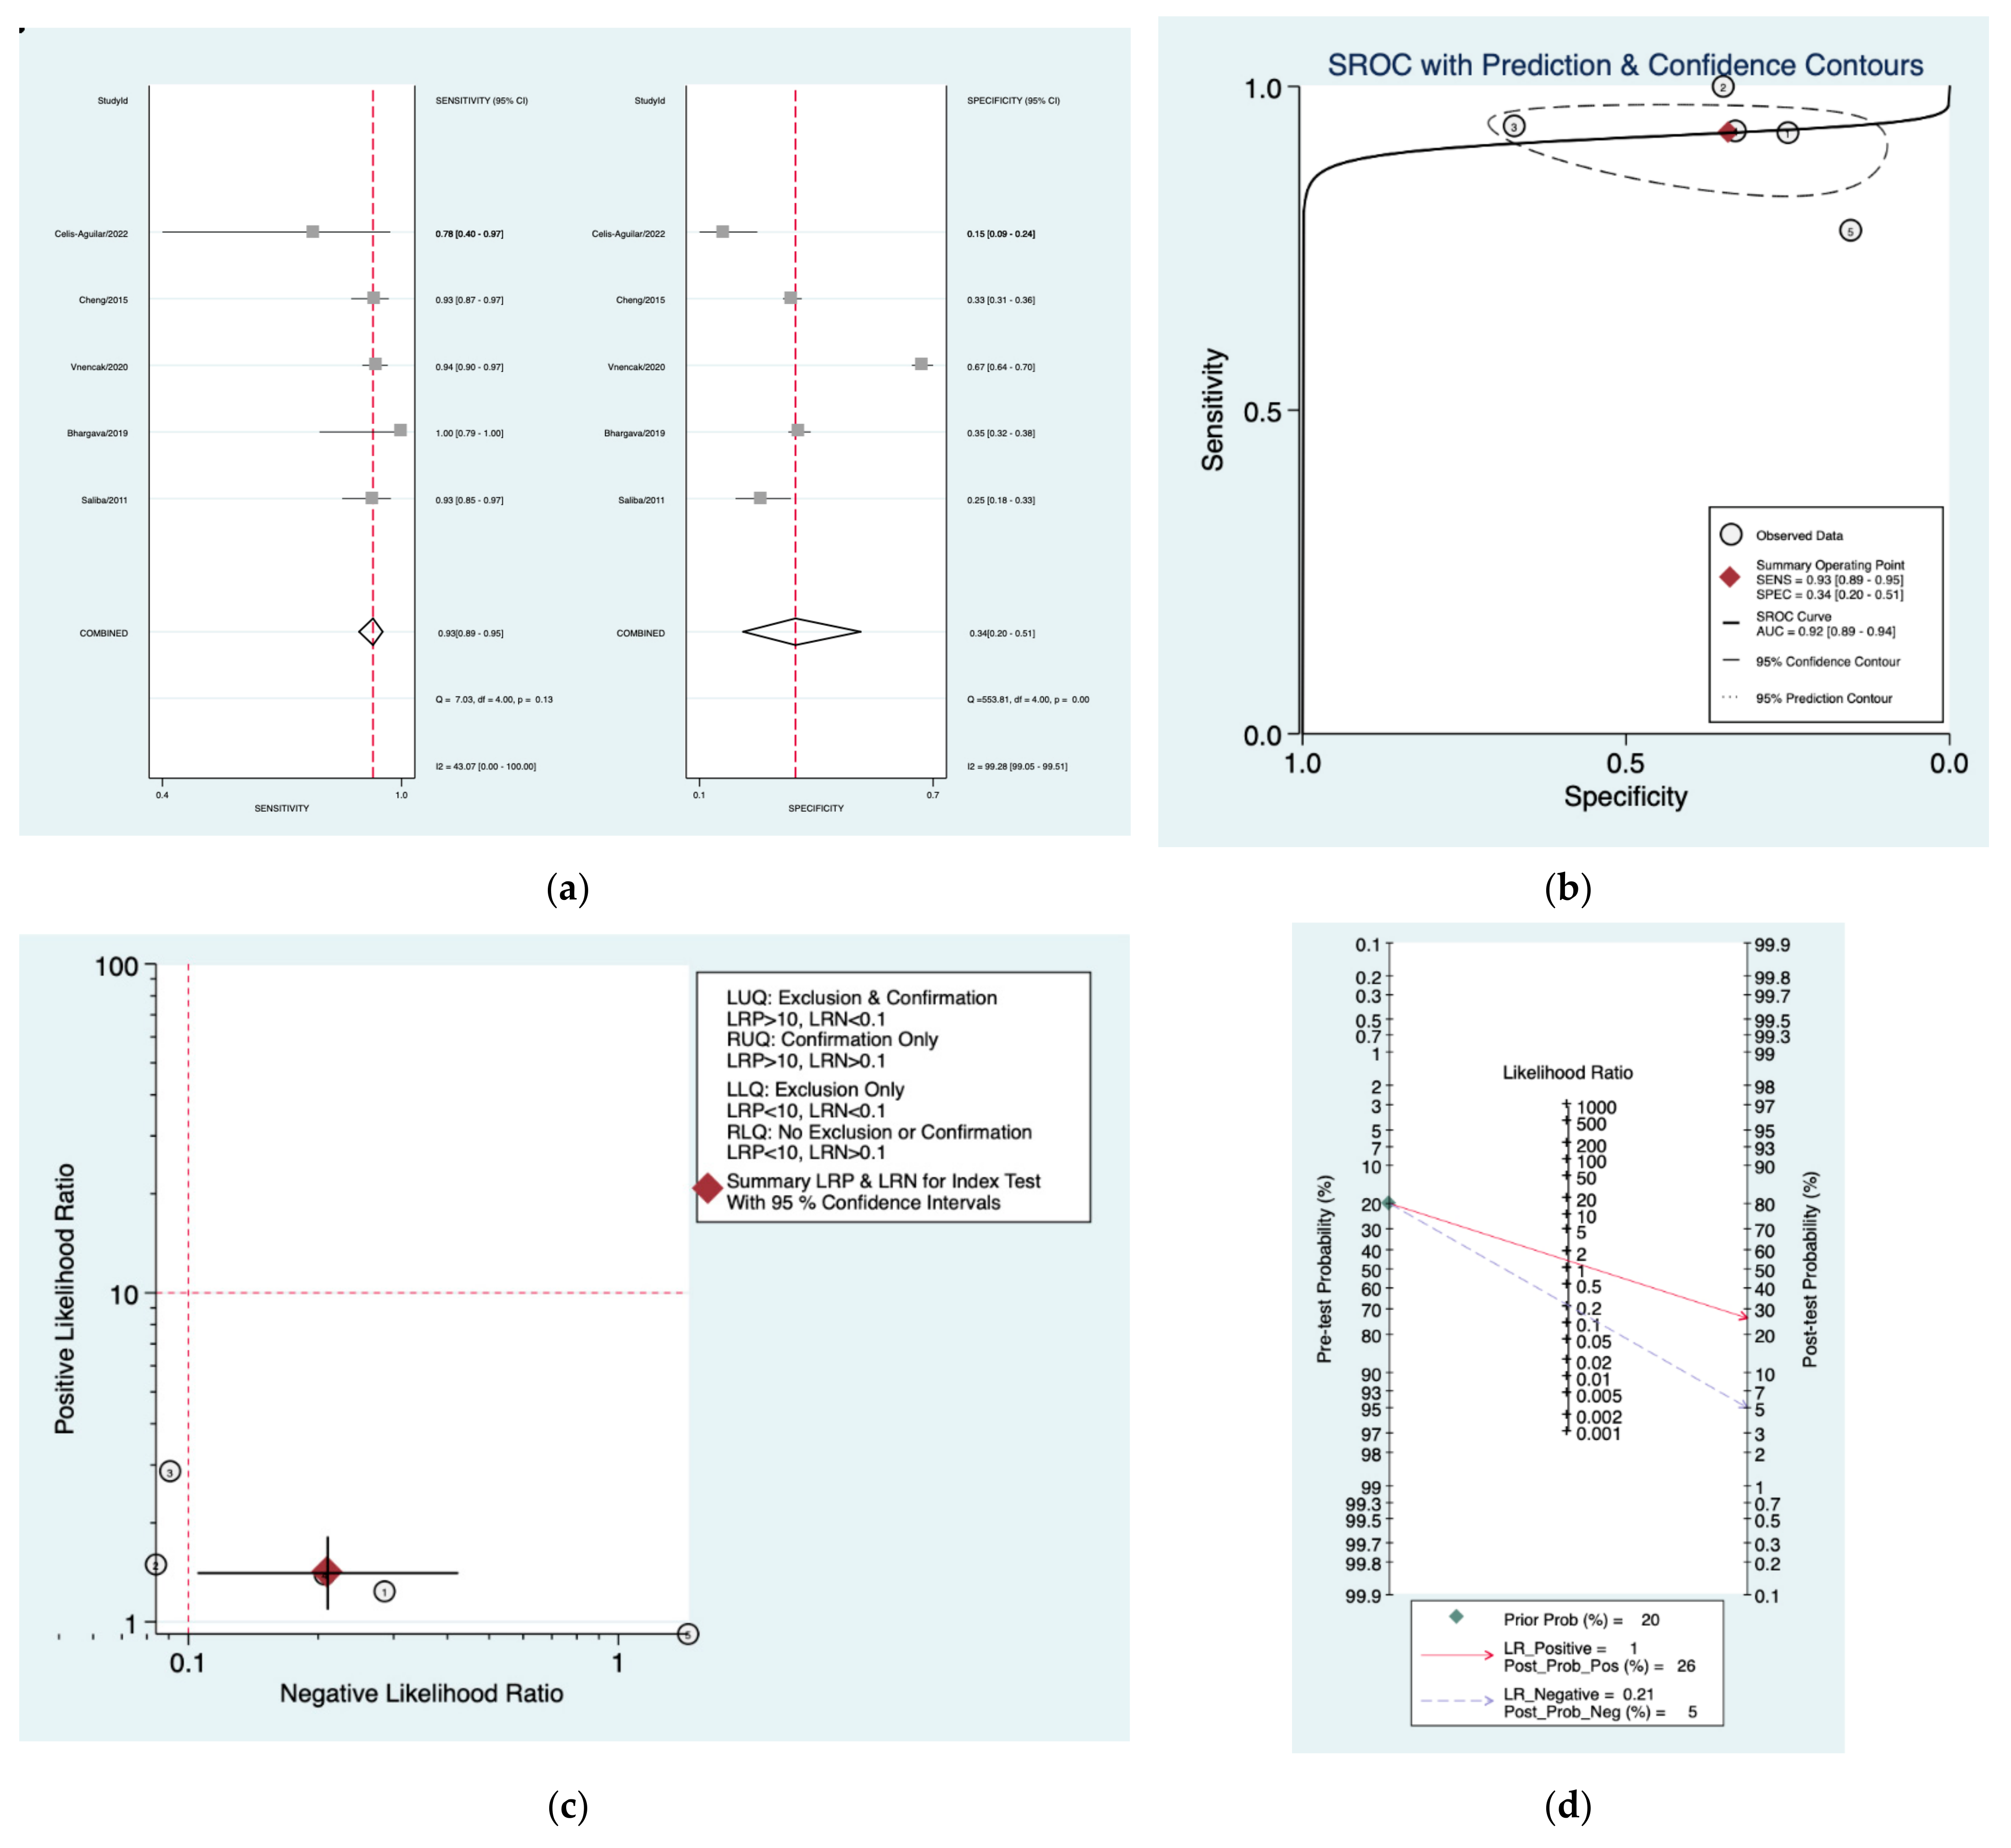
| Amclass [32] | 0.93 (0.89–0.95) | 0.34 (0.20–0.51) | 1.4 (1.1–1.8) | 0.21 (0.11–0.42) | 7 (3–17) |
| AAO [33] | 0.85 (0.77–0.90) | 0.60 (0.49–0.70) | 2.1 (1.6–2.9) | 0.25 (0.15–0.43) | 8 (4–18) |
| Nashville [34] | 0.91 (0.86–0.94) | 0.31 (0.21–0.42) | 1.3 (1.1–1.6) | 0.29 (0.14–0.61) | 5 (4–11) |
Publisher’s Note: MDPI stays neutral with regard to jurisdictional claims in published maps and institutional affiliations. |
© 2022 by the authors. Licensee MDPI, Basel, Switzerland. This article is an open access article distributed under the terms and conditions of the Creative Commons Attribution (CC BY) license (https://creativecommons.org/licenses/by/4.0/).
Share and Cite
Gheorghe, L.; Negru, D.; Cobzeanu, M.D.; Palade, O.D.; Botnariu, E.G.; Cobzeanu, B.M.; Cobzeanu, M.-L. The Diagnostic Accuracy of Pure-Tone Audiometry Screening Protocols for Vestibular Schwannoma in Patients with Asymmetrical Hearing Loss—A Systematic Review and Meta-Analysis. Diagnostics 2022, 12, 2776. https://doi.org/10.3390/diagnostics12112776
Gheorghe L, Negru D, Cobzeanu MD, Palade OD, Botnariu EG, Cobzeanu BM, Cobzeanu M-L. The Diagnostic Accuracy of Pure-Tone Audiometry Screening Protocols for Vestibular Schwannoma in Patients with Asymmetrical Hearing Loss—A Systematic Review and Meta-Analysis. Diagnostics. 2022; 12(11):2776. https://doi.org/10.3390/diagnostics12112776
Chicago/Turabian StyleGheorghe, Liliana, Dragos Negru, Mihail Dan Cobzeanu, Octavian Dragos Palade, Eosefina Gina Botnariu, Bogdan Mihail Cobzeanu, and Maria-Luiza Cobzeanu. 2022. "The Diagnostic Accuracy of Pure-Tone Audiometry Screening Protocols for Vestibular Schwannoma in Patients with Asymmetrical Hearing Loss—A Systematic Review and Meta-Analysis" Diagnostics 12, no. 11: 2776. https://doi.org/10.3390/diagnostics12112776
APA StyleGheorghe, L., Negru, D., Cobzeanu, M. D., Palade, O. D., Botnariu, E. G., Cobzeanu, B. M., & Cobzeanu, M.-L. (2022). The Diagnostic Accuracy of Pure-Tone Audiometry Screening Protocols for Vestibular Schwannoma in Patients with Asymmetrical Hearing Loss—A Systematic Review and Meta-Analysis. Diagnostics, 12(11), 2776. https://doi.org/10.3390/diagnostics12112776