Article

Reduction in Radiation Exposure of CT Perfusion by Optimized Imaging Timing Using Temporal Information of the Preceding CT Angiography of the Carotid Artery in the Stroke Protocol

1
Imaging Urania, Laurenzerberg 2, 1010 Vienna, Austria
2
Department of Radiology, University Hospital of Munich (LMU), Marchioninistr. 15, 81377 Munich, Germany
3
Department of Neuroradiology, University Hospital of Munich (LMU), Marchioninistr. 15, 81377 Munich, Germany
4
Department of Neurology, University Hospital of Munich (LMU), Marchioninistr. 15, 81377 Munich, Germany
*
Author to whom correspondence should be addressed.
Diagnostics 2022, 12(11), 2853; https://doi.org/10.3390/diagnostics12112853
Submission received: 25 September 2022 / Revised: 5 November 2022 / Accepted: 16 November 2022 / Published: 18 November 2022
(This article belongs to the Special Issue Advancements in Neuroimaging)

Abstract

:
(1) Background: CT perfusion (CTP) is a fast, robust and widely available but dose-exposing imaging technique for infarct core and penumbra detection. Carotid CT angiography (CTA) can precede CTP in the stroke protocol. Temporal information of the bolus tracking series of CTA could allow for better timing and a decreased number of scans in CTP, resulting in less radiation exposure, if the shortening of CTP does not alter the calculated infarct core and penumbra or the resulting perfusion maps, which are essential for further treatment decisions. (2) Methods: 66 consecutive patients with ischemic stroke proven by follow-up imaging or endovascular intervention were included in this retrospective study approved by the local ethics committee. In each case, six simulated, stepwise shortened CTP examinations were compared with the original data regarding the perfusion maps, infarct core, penumbra and endovascular treatment decision. (3) Results: In simulated CTPs with 26, 28 and 30 scans, the infarct core, penumbra and PRR values were equivalent, and the resulting clinical decision was identical to the original CTP. (4) Conclusions: The temporal information of the bolus tracking series of the carotid CTA can allow for better timing and a lower radiation exposure by eliminating unnecessary scans in CTP.

1. Introduction

Especially in the early phase, reliable and fast diagnosis is crucial to improve the outcome of thrombolysis in the new era of advanced stroke treatment. Although magnetic resonance imaging (MRI) is the most sensitive method to detect the tissue at risk, CT perfusion (CTP) imaging, a fast and widely available imaging modality, is also able to differentiate the infarct core from the penumbra in patients with suspected stroke. The current CTP acquisition, which covers almost the whole brain, operates in cine mode and scans the first pass, peak and wash-out of the intravenous administered contrast agent in brain tissue. CTP maps depicting cerebral blood volume, cerebral blood flow, mean transit time, time to drain and time to maximum can be generated to differentiate the ischemic core from penumbra, and even automated volume calculations are available [1,2,3,4,5]. CTP is a very dose-intensive imaging method. The average radiation exposure of 2.7 mGy for carotid and cerebral CT angiographies is considerably lower than the radiation exposure during perfusion measurements of the brain of about 100–190 mGy. Stochastic radiation risks decrease substantially with age and are markedly higher for females than for males. To balance the diagnostic needs and patient protection, CT perfusions studies have to be strictly justified and carefully optimized [6,7,8]. Since it contributes considerably to the CT-associated radiation exposure of patients, several studies focused on methods for reducing the dose—for example, by lowering the tube voltage or tube current, lowering the acquisition frequency or prolonging the time interval between scans [9].
For patients who otherwise meet the criteria for endovascular therapy, a noninvasive intracranial vascular study is recommended during the initial imaging evaluation of the acute stroke patient, and it is reasonable to proceed with CTA, if indicated, in patients with suspected intracranial large vessel occlusion, as well as to apply CT perfusion to determinate collateral flow status and to determine the eligibility for mechanical thrombectomy [10].
Carotid CT angiography can precede CTP in the diagnostic CT algorithm in stroke patients, and the order of CT angiography and CTP does not significantly affect the quantitative parameters of CTP [11]. The timing of image acquisition after intravenous contrast administration is of great importance to obtain optimal contrast in the intra- and extracranial arteries in the CT angiography. Typically, an aortic bolus tracking is performed, and image acquisition begins when intraluminal enhancement of the ascending aorta exceeds the threshold value. If CT angiography precedes CTP, the arrival of the contrast bolus in the ascending aorta is known and could be interpreted as a test bolus. Using this information, a better timing of the CTP data acquisition could be achieved.
In our study, we used the temporal information of the bolus tracking series of a preceding CT angiography to investigate whether optimal timing of the CTP has the potential to reduce the number of scans applied and whether shortening the CTP affects the automatically calculated infarct core and penumbra. In addition, we investigated whether altering the number of CTP scans in this manner significantly affects the resulting maps as well as influences the resulting clinical decision pathway. These are critical to the decision to choose interventional or conventional lysis therapy.
In the current literature, there is no comparable study using the bolus tracking series of the carotid CT angiography to assess the optimal timing for CT perfusion of the brain.

2. Materials and Methods

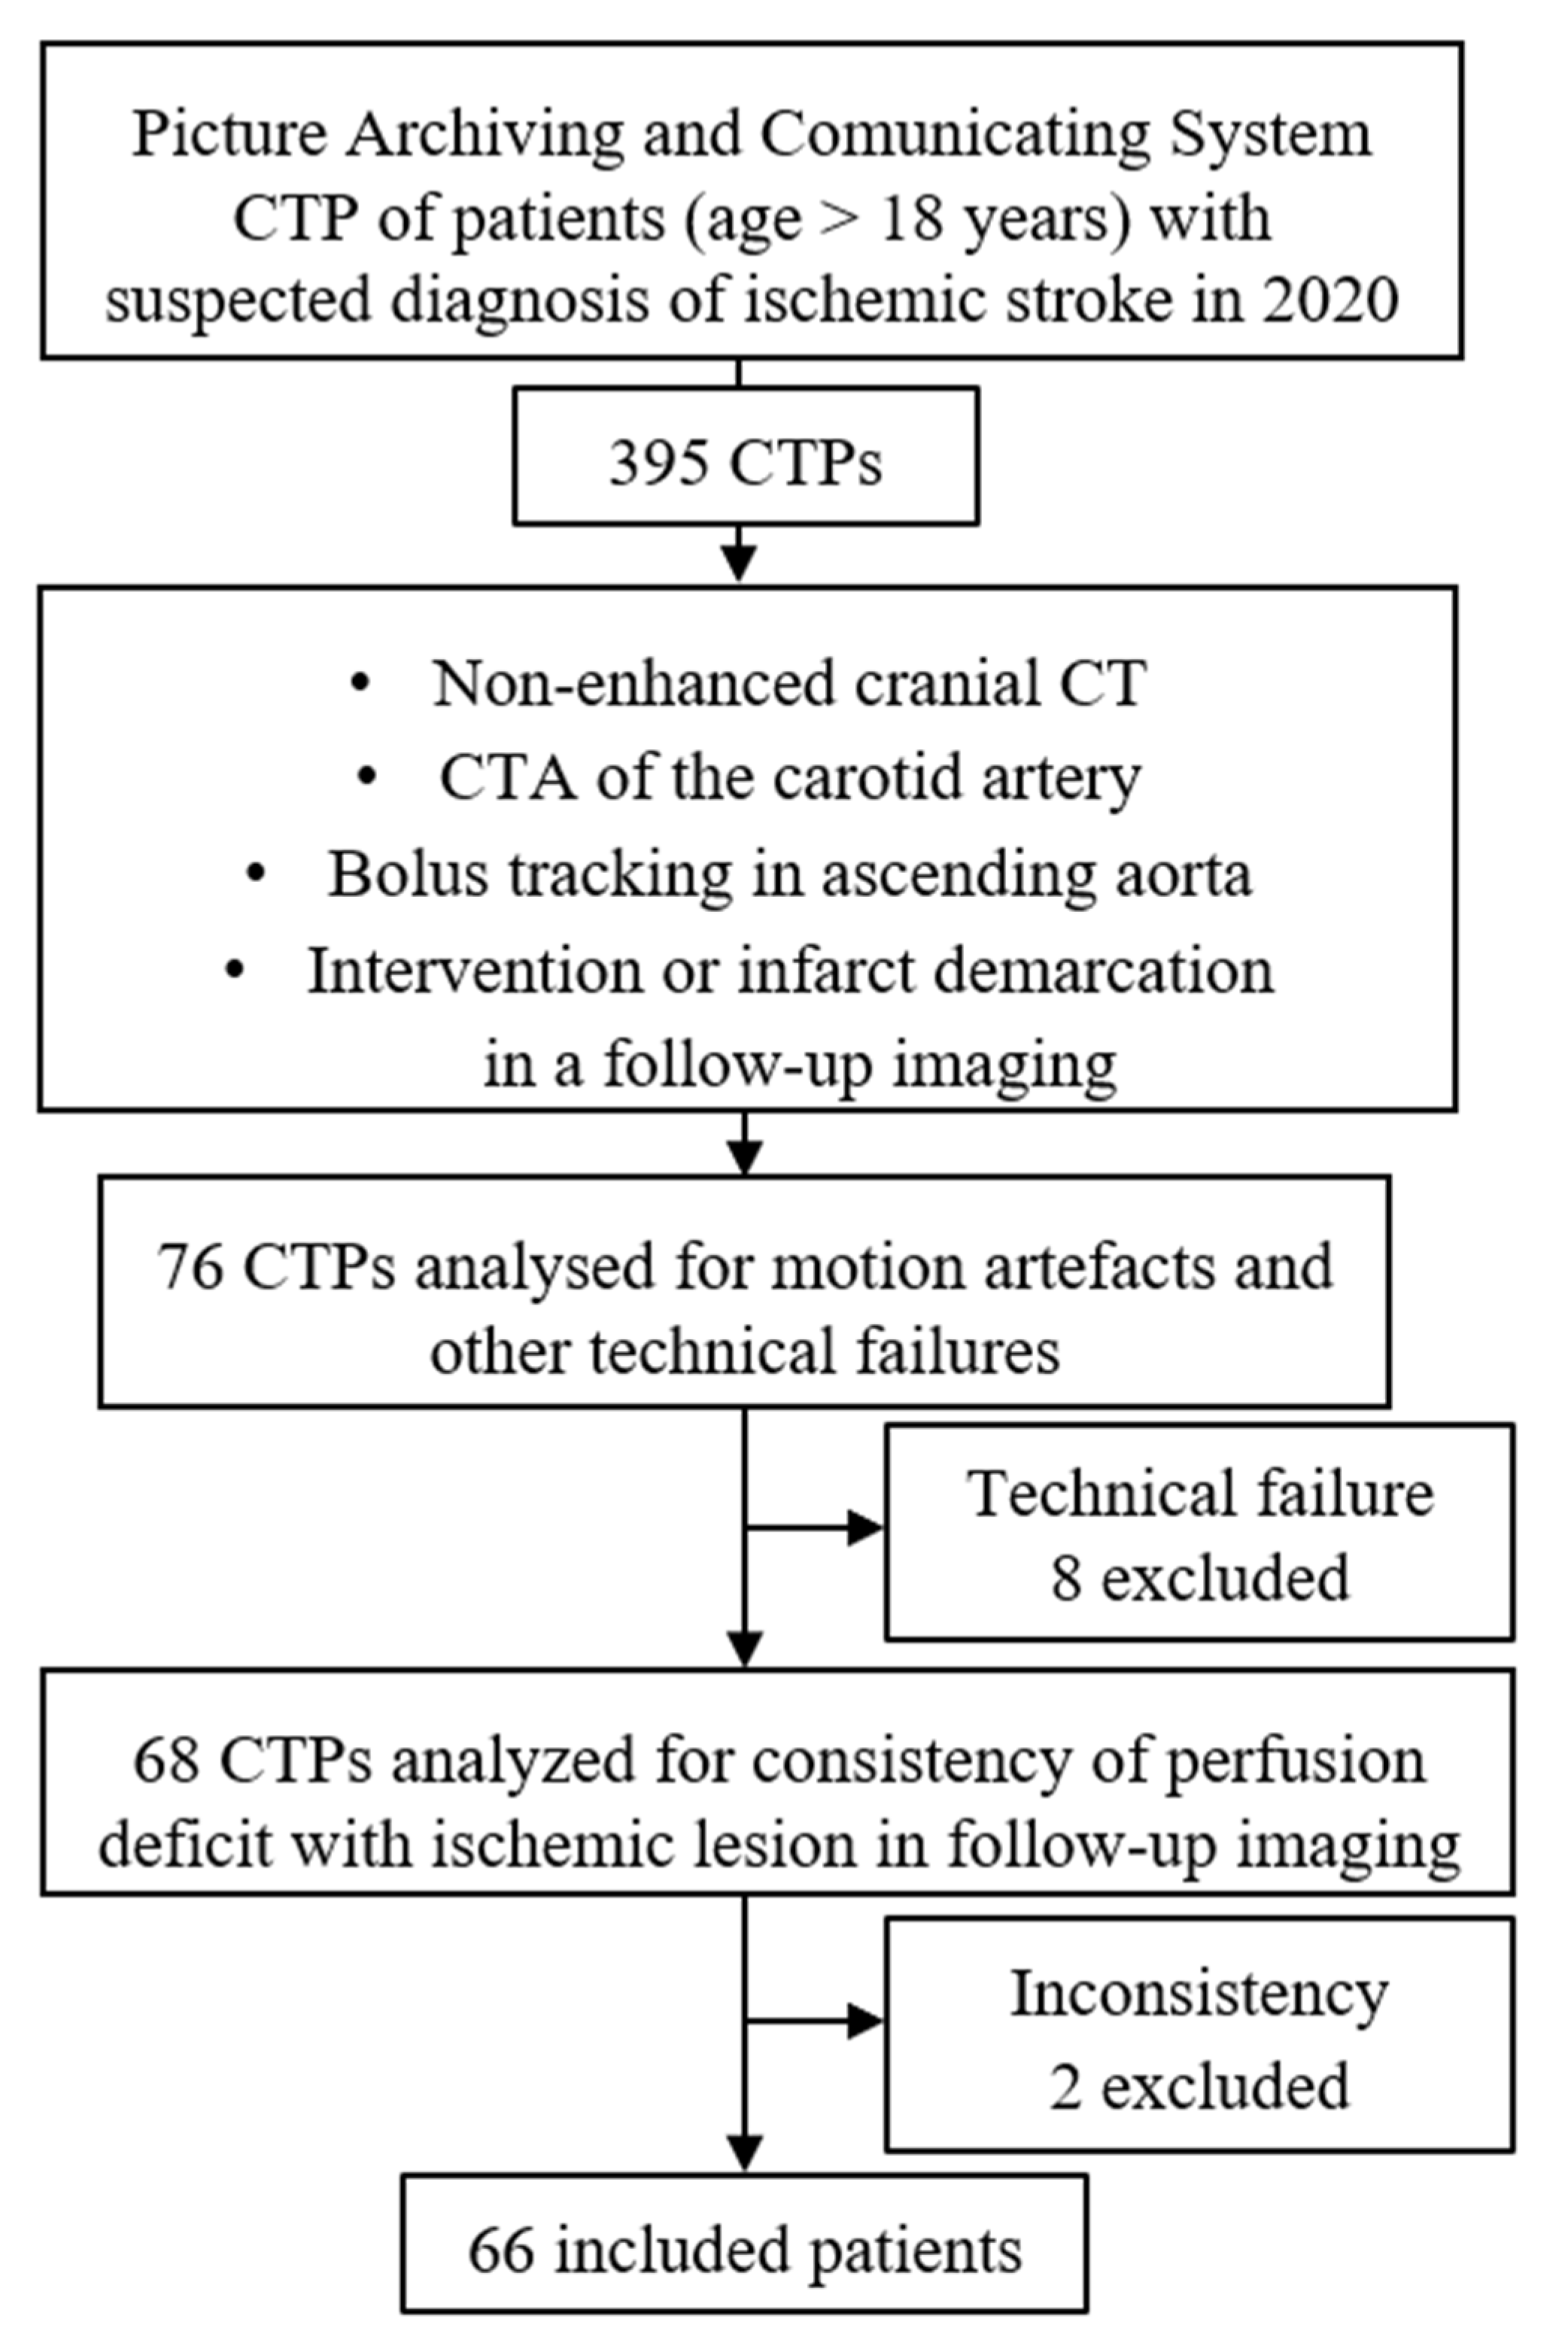
2.1. Patient Population

Our study was conducted in accordance with the Declaration of Helsinki, approved by the local ethical committee and registered with the following ID: DRKS00023941 in the German Clinical Trials Register. The imaging data of all included patients were retrospectively collected and anonymized.
Patients with a suspected diagnosis of ischemic stroke who received CTP from 1 January to 31 December 2020 were searched for in our institutional Picture Archiving and Communicating System. Patients with a perfusion deficit had to meet the following inclusion criteria: age over 18 years, institutional standard imaging protocol including non-enhanced cranial CT, CT angiography of the carotid arteries and CTP, follow-up imaging or subsequent intervention and archived scans of the bolus tracking in the ascending aorta. Patients with perfusion disturbances in the initial CTP imaging but without any evidence of an ischemic event in the follow-up imaging were not included in the study group. A total of 395 patients with suspected ischemic stroke received the institutional standard protocol during this period. A total of 76 patients with available bolus tracking records and perfusion deficits who had infarct demarcation in the follow-up imaging or underwent mechanical intravascular procedures because of cerebral artery occlusion were included in our study. A total of 10 patients were excluded: 2 due to the inconsistency of the perfusion deficit with the infarct lesion in the follow-up imaging, 2 due to an invalid bolus tracking dataset (technical problem) and 6 due to an invalid CTP dataset (motion artifacts). The total of 66 patients (33 males, 33 females; mean age ± standard deviation: 71.3 ± 15.2 years, ranging from 28 to 96) constituted our study group. Patient recruitment is shown as a flow chart in Figure 1.

2.2. CT Examination Protocol

Imaging was performed on a 192-detector-row dual-source-CT scanner (Somatom Force; Siemens Healthineers, Erlangen, Germany) according to the vendor’s recommendations. The following optimized scan parameters were applied for CTP in each patient: whole brain coverage with a scan length of 294 mm, applying a tube voltage of 70 kV, a fixed tube current of 250 mAs and a rotation time of 0.25 s and acquiring 32 scans with a time interval of 1.5 s between two scans. The contrast agent was administered in the antecubital vein as a bolus of 40 mL, with 300 mg iodine per mL (Imeron; Bracco Imaging Deutschland, Konstanz, Germany) at a flow rate of 6 mL per second, followed by a saline bolus of 50 mL. The scan phase began 8 s after the start of the contrast agent injection. For the CT angiography of the carotid arteries, the contrast agent was administered as a bolus of 40 mL at a flow of 5 mL per second, and the first bolus tracking scan began 7 s after injection. The tracking scans were performed at the level of the ascending aorta, with a frequency of 1 per second. The scanning period of the CT angiography began as the intraluminal enhancement of the aorta reached the threshold CT attenuation value of 100 HU.

2.3. Image Processing and Volumetry

After image acquisition, all CTP datasets: 32 scans—each of them operating with 116 slices of 1.5 mm—were reconstructed, anonymized and transferred to a dedicated image processing software. For all datasets, we performed perfusion analysis with the vendor-given Syngo Volume Perfusion CT Neuro software (Syngo.Via VB40A 2019; Siemens Healthineers, Erlangen, Germany). The infarct core and penumbra were automatically calculated by applying the same software using the vendor-given fixed specification for cerebral blood volume and cerebral blood flow threshold values: cerebral blood volume < 1.2 mL/100 mL and cerebral blood flow < 35.1 mL/100 mL [12,13,14]. The arterial input region was selected from the vessels of the anterior cerebral arteries, and the venous input was located in the superior sagittal sinus. A set of 31 color-coded slices were calculated for each of the five CTP maps (cerebral blood volume, cerebral blood flow, mean transit time, time to drain and time to maximum). Perfusion deficits were analyzed; the volumetric data of the infarct core [mL] and penumbra [mL] and the data of the automatically assessed Potential Recuperation Ratio (PRR, [%]) were extracted [15].

2.4. Study Design

In each patient, simulated and gradually shortened CTP datasets were generated using the temporal information of the contrast agent arrival in the ascending aorta. The temporal information was extracted from the corresponding bolus tracking scans. In a preliminary study of 50 patients receiving a valid CTP, enhancement curves and aortic bolus arrival were analyzed to compare the delay of the contrast agent arrival in the ascending aorta and in the intracranial arteries. Considering these results, an exact time interval was identified to define the first scan of the CTP dataset in the simulated CTP (sCTP) examinations of our patient study group. This interval was constant for each patient and was considered in each patient. It was added to the personalized time information we retrieved from the corresponding data of the aortal bolus tracking series in each patient, and it was respected in all simulated datasets to identify the first scan. After the first scan of the sCTPs was selected and tagged, we generated shortened scan series: the 32 scans of the oCTPs were gradually decreased to 30 scans (sCTP30), 28 scans (sCTP28), 26 scans (sCTP26), 24 scans (sCTP24), 22 scans (sCTP22) and 20 scans (sCTP20), resulting in six additional sCTP datasets in each patient.
In the next step, all of the six sCTP examination (66 × 6 = 396) datasets were reloaded into Syngo.Via, and the infarct core, penumbra and PRR (potential recuperation ratio) were automatically calculated for each patient of the study group.
PRR values of the simulated datasets (sCTPs) were compared to PRR values of the original imaging data (oCTPs) and analyzed regarding discrepancy.
In all perfusion CT examinations including original imaging data and simulated datasets, the clinical decision pathway concerning the differentiation between the “target mismatch profile” (volume of infarct core ≤ 50 mL; volume of mismatch > 15 mL; volume of mismatch/volume of infarct core ≥ 1.8) and the “malignant profile” was examined according to previous studies investigating stroke evolution and the effect of intravenous thrombolysis with or without mechanical thrombectomy [16,17,18,19].
The data of radiation exposure were extracted from the clinical dose-monitoring software (Radimetrics, Bayer, Germany, Leverkusen).
The relationship between the delay of the aortal bolus arrival and the chronological data of the wash-in and wash-out phases was analyzed.

2.5. Statistical Analysis

A paired sample t-test was used to investigate the equivalence of the calculated values for the infarct and penumbra and the PRR values between oCTP and the six sCTPs. The level of significance was set at a p-value of 0.05. With the aid of Bonferroni correction, the confidence interval was adjusted because of multiple comparisons, and the significance level was set at 0.003 (0.05/18 = 0.00278).
The linear relationship between the aortal bolus arrival, the arterial inflow peak, the venous inflow peak, the end point of the wash-out phase and the duration of the complete perfusion curve covering both the wash-in and the wash-out phase was investigated by calculating the Pearson product–moment correlation coefficient.
The statistical calculations were performed with a statistical software (SPSS 22.0, IBM Corporation, Armonk, NY, USA).

3. Results

The mean value and the standard deviation for the infarct core volume and penumbra in the standard CTP protocol were 35.71 ± 34.83 mL (ranged from 6.4 mL to 218.59 mL) and 131.37 ± 59.71 mL (ranged from 45.45 mL to 338.61 mL), respectively. The radiation exposure of the standard protocol operating with 32 scans was 196.13 mGy (computed tomography dose index) and 2908.3 mGycm (dose length product).
The results of the volumetric calculations of the shortened simulated CTPs, including p-values and radiation exposure, are shown in Table 1.
In the comparative analysis of the PRR values of standard and simulated CTPs, the percentages of the simulated examinations, which present a deviation not exceeding 1%, 3%, 5% and 10%, are given in Table 2.
In standard CTP, a “target mismatch” profile was identified in 55 of the 66 patients. We detected a “malignant” profile in nine patients because of a large infarct core (>50 mL) and in two patients because of an insufficient mismatch (ratio < 1.8). The number of patients with a “malignant” profile was higher in some of the simulated CTPs: 21 (sCTP20), 19 (sCTP22) and 15 (sCTP24). In the simulated CTPs with 26, 28 and 30 scans, the patients with a “target mismatch” profile were identical.
The mean value ± standard deviation for the aortal bolus delay was 11.92 ± 3.33 s, and it ranged from 7.0 s to 19.0 s. The mean value ± standard deviation for the arterial inflow peak was 22.83 ± 4.81 s, and it ranged from 14.0 s to 38.0 s. The mean value ± standard deviation for the venous inflow peak was 27.81 ± 5.75 s, and it ranged from 17.0 s to 42.5 s. The mean value ± standard deviation for the end point of the wash-out phase was 41.01 ± 7.60 s, and it ranged from 7.0 s to 54.5 s. The mean value ± standard deviation for the duration of the complete perfusion curve was 30.13 ± 5.13 s, and it ranged from 19.0 s to 39.0 s.
The correlation analysis showed a strong positive correlation of the aortal bolus arrival with all evaluated parameters of the perfusion curve (arterial inflow peak: 0.81520; p ˂ 0.00001, venous inflow peak: 0.81510; p ˂ 0.00001, end point of the wash-out phase: 0.8623; p ˂ 0.00001, duration of complete perfusion: 0.8534; p ˂ 0.00001).

4. Discussion

CT perfusion is a high-dose exposure imaging technique requiring optimization. With the aid of the temporal information of the aortal bolus arrival, we could effectively reduce the radiation level of CTP without a loss of substantial information.
Acute ischemic stroke, with a high global incidence, is commonly responsible for severe disability in developed nations. Thrombolysis in the acute setting including endovascular intervention is essential and requires fast and reliable diagnostics [20].
After MRI, CTP is the most sensitive diagnostic tool to offer reliable identification and assessment of the infarct core and ischemic penumbra, and it is well integrated into CT-based stroke protocols [21].
However, the recommended temporal resolution of 1 or 2 scans per second, which provides a precise plotting of time-attenuation curves, is associated with a substantial radiation exposure. For this reason, many publications have addressed the dose reduction of CTP—for example, by adjusting the tube current, temporal resolution or total scan duration, by modifying the chaser bolus volume and by using modern reconstruction algorithms to optimize imaging and to fulfil the ALARA (As Low As Reasonably Achievable) principle [22,23,24,25,26].
Given that CT angiography of the carotid artery, which precedes CTP in the diagnostic CT algorithm, has no influence on CTP results [11], the bolus arrival in the aorta could be considered as a test bolus that provides information for the optimal timing of CTP. In the simulated CTP examinations in our study, the initial scan was set to at least 1 s but not more than 2 s before the time at which the contrast agent bolus approached the threshold value of 100 HU in the ascending aorta. This means that if the contrast agent reached the threshold value (for example, 20 s after injection), we declared the first CTP scan 18 s after injection—in this case, the 8th scan acquired 19 s after the contrast agent injection—to be the initial CTP scan. The relationship and temporal data of the attenuation curves of the bolus tracking series, arterial inflow and venous inflow are visualized in Figure 2.
Using this method, we were able to generate personalized shortened CTPs with the same diagnostic quality, allowing for a dose reduction of at least 18.75% in all patients without a loss of image information and without changing the clinical decision based on the imaging results in our study. The calculated CTP maps were also visually identical in all cases with comparable volumetric results. An example is presented in Figure 3.
Furthermore, PRR values showed no more than 5% deviation in 75.8% of sCTP24 (50 patients) and 62.1% of sCTP22 (41 patients) compared with the oCTP series. These results suggest that, in certain cases, a further dose reduction could be achieved by lowering the number of scans to 24 or even to 20. Underlying this, 10.6% of the sCTP20 (7 patients) had PRR values that were more than 99% identical to oCTP series. These results indicate that, in these cases, the number of scans could be decreased to 20 without any impairment of the diagnostic quality, which corresponded to a 28.5 s-long scanning window and a dose reduction of 37.5%. The duration of the wash-in and wash-out phase took less than 24 s in these patients, and they also had a very fast aortal bolus arrival as well as an early arterial and venous inflow peak. The flow curves of a corresponding patient are visualized in Figure 4.
Our correlation analysis indicates a strong relationship between a fast aortal bolus arrival and a fast wash-in phase and an early arterial inflow peak and a fast wash-out phase.
Considering this information, personalized CTP protocols with an optimized number of perfusion scans as well as dose-optimized CT examinations could be easily available and should be applied in all suitable patients.
On the other hand, bolus tracking in 4 patients (6.1%) revealed a very early contrast arrival (enhancement well above 100 HU in the first bolus tracking scan) in the ascending aorta, resulting in a shift in the ascending arterial inflow curve closer to the venous inflow curve in the original CTP and indicating an unwelcome delay of the original CTP, suggesting a probable loss of information. The flow curves of a corresponding patient are visualized in Figure 5.
The classic CTP protocol recommended by Wintermark et al., applying a 40 s scanning window starting 7 s after the contrast injection, has similar characteristics to the protocol we used, with a delay of 8 s, a scanning window of 46.5 s and a scan interval of 1.5 s [25,26].
Corcuera-Solano et al. advocated for the use of adapted variable and extended sampling (3 passes every 3 s intended for the baseline before arrival, 13 passes every 1.5 s for the rise and fall of enhancement and 3 passes every 7.5 s to complete and extend the sampling window to 51 s) to improve quality and to reduce radiation exposure to 1588 mGycm at 70 kVp. However, Kasasbeh et al. found that an acquisition duration of 65 s or longer is required [27,28].
The lack of optimal timing can significantly impede the efficiency of this scanning technique. Due to the variation in cardiac output among patients (for example, the aortal bolus arrival ranged from 7 to 19 s in our study group), the overall duration of the entire contrast circle, including the arterial arrival and venous return, might not be appropriately captured if it does not fit within the scan window. In this case, patients with a delayed bolus arrival may have a truncated descending slope of the venous wash-out curve; we observed this phenomenon in seven patients (10.6%) in our study. The flow curves of a corresponding patient are visualized in Figure 6.
These findings indicate the urgent need for proper and personally adapted timing of CTP imaging instead of the use of a fixed delay to receive high-quality perfusion data in all patients. Moreover, in patients with a very slow bolus arrival, a prolonged scanning interval instead of 1 or 2 s could be considered to improve the quality of the data acquisition.
However, the manual adjustment of the timing of the imaging or the imaging parameter can be highly operator-dependent. The integration of the temporal information of the bolus tracking series of the carotid CT angiography into the CT perfusion protocol by the vendor might reduce the operator-dependent character of this method.
We acknowledge the limitations of our study. The injection rates of contrast agents were similar for CT angiography (5 mL/s) and CTP (6 mL/s) but not completely identical. Because of the automated software-based calculation method, our results are quite reproducible within our study but not comparable to the results of other software that use different parameters for infarct core and penumbra identification (e.g., RAPID; iSchemaView, Menlo Park, CA, USA).

5. Conclusions

In conclusion, the timing information of the bolus tracking of previous carotid CT angiography can be used in the stroke protocol to reduce radiation exposure by avoiding unnecessary scans. In addition, the information from bolus tracking allows for the better timing of CTP, which could lead to better outcomes in certain cases by adjusted timing.

Author Contributions

Conceptualization, Z.D., R.F., W.K. and B.S.; Methodology, Z.D., M.F., P.R., W.K. and B.S.; Software, M.F. and J.R.; Validation, R.F. and K.D.; Formal analysis, M.F. and W.K.; Investigation, L.S., A.-K.L. and K.D.; Resources, J.R.; Data curation, L.S. and A.-K.L.; Writing–original draft, Z.D.; Visualization, P.R.; Supervision, Z.D., J.R. and B.S. All authors have read and agreed to the published version of the manuscript.

Funding

This research received no external funding.

Institutional Review Board Statement

This retrospective study was conducted in accordance with the Declaration of Helsinki, and approved by the Ethics Committee of the Medical Faculty of the Ludwig Maximilian University on 4. March 2021 with the project number 21-0032. All patient data including imaging data were anonymized. The study was registered in the German Clinical Trials Register with the following ID: DRKS00023941.

Informed Consent Statement

Not applicable.

Conflicts of Interest

The authors declare no conflict of interest.

Abbreviations

CTcomputed tomography
CTPCT perfusion
MRImagnetic resonance imaging
PRRpotential recuperation ration
oCTPoriginal CTP
sCTPsimulated CTP

References

  1. Amiri, H.; Bluhmki, E.; Bendszus, M.; Eschenfelder, C.C.; Donnan, G.A.; Leys, D.; Molina, C.; Ringleb, P.A.; Schellinger, P.D.; Schwab, S.; et al. European Cooperative Acute Stroke Study-4: Extending the time for thrombolysis in emergency neurological deficits ECASS-4: ExTEND. Int. J. Stroke 2016, 11, 260–267. [Google Scholar] [CrossRef] [PubMed]
  2. Gasparotti, R.; Grassi, M.; Mardighian, D.; Frigerio, M.; Pavia, M.; Liserre, R.; Magoni, M.; Mascaro, L.; Padovani, A.; Pezzini, A. Perfusion CT in Patients with Acute Ischemic Stroke Treated with Intra-Arterial Thrombolysis: Predictive Value of Infarct Core Size on Clinical Outcome. Am. J. Neuroradiol. 2009, 30, 722–727. [Google Scholar] [CrossRef] [Green Version]
  3. Campbell, B.C.V.; Christensen, S.; Levi, C.; Desmond, P.M.; Donnan, G.; Davis, S.M.; Parsons, M.W. Comparison of Computed Tomography Perfusion and Magnetic Resonance Imaging Perfusion-Diffusion Mismatch in Ischemic Stroke. Stroke 2012, 43, 2648–2653. [Google Scholar] [CrossRef]
  4. Ribo, M.; Tomasello, A.; Lemus, M.; Rubiera, M.; Vert, C.; Flores, A.; Coscojuela, P.; Pagola, J.; Rodriguez-Luna, D.; Bonet, S.; et al. Maximal Admission Core Lesion Compatible with Favorable Outcome in Acute Stroke Patients Undergoing Endovascular Procedures. Stroke 2015, 46, 2849–2852. [Google Scholar] [CrossRef] [PubMed] [Green Version]
  5. Bivard, A.; Levi, C.; Krishnamurthy, V.; McElduff, P.; Miteff, F.; Spratt, N.; Bateman, G.; Donnan, G.; Davis, S.; Parsons, M. Perfusion computed tomography to assist decision making for stroke thrombolysis. Brain 2015, 138, 1919–1931. [Google Scholar] [CrossRef] [PubMed] [Green Version]
  6. Othman, A.E.; Afat, S.; Brockmann, M.A.; Nikoubashman, O.; Brockmann, C.; Nikolaou, K.; Wiesmann, M. Radiation dose reduction in perfusion CT imaging of the brain: A review of the literature. J. Neuroradiol. 2016, 43, 1–5. [Google Scholar] [CrossRef] [PubMed]
  7. Brix, G.; Lechel, U.; Nekolla, E.; Griebel, J.; Becker, C. Radiation protection issues in dynamic contrast-enhanced (perfusion) computed tomography. Eur. J. Radiol. 2015, 84, 2347–2358. [Google Scholar] [CrossRef] [PubMed]
  8. Eller, A.; Wiesmüller, M.; Wüst, W.; Heiss, R.; Kopp, M.; Saake, M.; Brand, M.; Uder, M.; May, M. Carotid CTA at the Lowest Tube Voltage (70 kV) in Comparison with Automated Tube Voltage Adaption. Am. J. Neuroradiol. 2019, 40, 1374–1382. [Google Scholar] [CrossRef]
  9. Zensen, S.; Guberina, N.; Opitz, M.; Köhrmann, M.; Deuschl, C.; Forsting, M.; Wetter, A.; Bos, D. Radiation exposure of computed tomography imaging for the assessment of acute stroke. Neuroradiology 2020, 63, 511–518. [Google Scholar] [CrossRef]
  10. Powers, W.J.; Rabinstein, A.A.; Ackerson, T.; Adeoye, O.M.; Bambakidis, N.C.; Becker, K.; Biller, J.; Brown, M.; Demaerschalk, B.M.; Hoh, B.; et al. Guidelines for the Early Management of Patients with Acute Ischemic Stroke: 2019 Update to the 2018 Guidelines for the Early Management of Acute Ischemic Stroke: A Guideline for Healthcare Professionals From the American Heart Association/American Stroke Association. Stroke 2019, 50, e344–e418, Correction in Stroke 2019, 50, e440–e441. [Google Scholar] [CrossRef]
  11. Dorn, F.; Liebig, T.; Muenzel, D.; Meier, R.; Poppert, H.; Rummeny, E.J.; Huber, A. Order of CT stroke protocol (CTA before or after CTP): Impact on image quality. Neuroradiology 2011, 54, 105–112. [Google Scholar] [CrossRef] [PubMed]
  12. Abels, B.; Klotz, E.; Tomandl, B.; Kloska, S.; Lell, M. Perfusion CT in Acute Ischemic Stroke: A Qualitative and Quantitative Comparison of Deconvolution and Maximum Slope Approach. Am. J. Neuroradiol. 2010, 31, 1690–1698. [Google Scholar] [CrossRef] [PubMed] [Green Version]
  13. Klotz, E.; König, M. Perfusion measurements of the brain: Using dynamic CT for the quantitative assessment of cerebral ischemia in acute stroke. Eur. J. Radiol. 1999, 30, 170–184. [Google Scholar] [CrossRef]
  14. Koenig, M.; Kraus, M.; Theek, C.; Klotz, E.; Gehlen, W.; Heuser, L. Quantitative Assessment of the Ischemic Brain by Means of Perfusion-Related Parameters Derived from Perfusion CT. Stroke 2001, 32, 431–437. [Google Scholar] [CrossRef] [PubMed] [Green Version]
  15. Borst, J.; Berkhemer, O.A.; Roos, Y.B.; van Bavel, E.; van Zwam, W.H.; van Oostenbrugge, R.J.; van Walderveen, M.A.; Lingsma, H.F.; van der Lugt, A.; Dippel, D.W.; et al. Value of Computed Tomographic Perfusion–Based Patient Selection for Intra-Arterial Acute Ischemic Stroke Treatment. Stroke 2015, 46, 3375–3382. [Google Scholar] [CrossRef]
  16. Karwacki, G.M.; Vögele, S.; Blackham, K.A. Dose reduction in perfusion CT in stroke patients by lowering scan frequency does not affect automatically calculated infarct core volumes. J. Neuroradiol. 2019, 46, 351–358. [Google Scholar] [CrossRef]
  17. Albers, G.W.; Thijs, V.N.; Wechsler, L.; Bs, S.K.; Schlaug, G.; Skalabrin, E.; Bammer, R.; Kakuda, W.; Lansberg, M.G.; Shuaib, A.; et al. Magnetic resonance imaging profiles predict clinical response to early reperfusion: The diffusion and perfusion imaging evaluation for understanding stroke evolution (DEFUSE) study. Ann. Neurol. 2006, 60, 508–517. [Google Scholar] [CrossRef]
  18. Lansberg, M.G.; Straka, M.; Kemp, S.; Mlynash, M.; Wechsler, L.R.; Jovin, T.G.; Wilder, M.J.; Lutsep, H.L.; Czartoski, T.J.; Bernstein, R.A.; et al. MRI profile and response to endovascular reperfusion after stroke (DEFUSE 2): A prospective cohort study. Lancet Neurol. 2012, 11, 860–867. [Google Scholar] [CrossRef] [Green Version]
  19. Saver, J.L.; Goyal, M.; Bonafe, A.; Diener, H.-C.; Levy, E.I.; Pereira, V.M.; Albers, G.W.; Cognard, C.; Cohen, D.J.; Hacke, W.; et al. Solitaire™ with the Intention for Thrombectomy as Primary Endovascular Treatment for Acute Ischemic Stroke (SWIFT PRIME) Trial: Protocol for a Randomized, Controlled, Multicenter Study Comparing the Solitaire Revascularization Device with IV tPA with IV tPA Alone in Acute Ischemic Stroke. Int. J. Stroke 2015, 10, 439–448. [Google Scholar] [CrossRef] [Green Version]
  20. Palm, F.; Urbanek, C.; Wolf, J.; Buggle, F.; Kleemann, T.; Hennerici, M.; Inselmann, G.; Hagar, M.; Safer, A.; Becher, H.; et al. Etiology, Risk Factors and Sex Differences in Ischemic Stroke in the Ludwigshafen Stroke Study, a Population-Based Stroke Registry. Cerebrovasc. Dis. 2011, 33, 69–75. [Google Scholar] [CrossRef]
  21. Barber, P.A.; Demchuk, A.M.; Zhang, J.; Buchan, A.M. Validity and reliability of a quantitative computed tomography score in predicting outcome of hyperacute stroke before thrombolytic therapy. ASPECTS Study Group. Alberta Stroke Programme Early CT Score. Lancet 2000, 355, 1670–1674. [Google Scholar] [CrossRef]
  22. Othman, A.E.; Brockmann, C.; Yang, Z.; Kim, C.; Afat, S.; Pjontek, R.; Nikobashman, O.; Brockmann, M.A.; Kim, J.H.; Wiesmann, M. Effects of radiation dose reduction in Volume Perfusion CT imaging of acute ischemic stroke. Eur. Radiol. 2015, 25, 3415–3422. [Google Scholar] [CrossRef] [PubMed]
  23. Wiesmann, M.; Berg, S.; Bohner, G.; Klingebiel, R.; Schöpf, V.; Stoeckelhuber, B.M.; Yousry, I.; Linn, J.; Missler, U. Dose reduction in dynamic perfusion CT of the brain: Effects of the scan frequency on measurements of cerebral blood flow, cerebral blood volume, and mean transit time. Eur. Radiol. 2008, 18, 2967–2974. [Google Scholar] [CrossRef] [PubMed]
  24. Niesten, J.M.; van der Schaaf, I.C.; Riordan, A.J.; de Jong, H.W.A.M.; Horsch, A.D.; Eijspaart, D.; Smit, E.J.; Mali, W.P.T.M.; Velthuis, B.K. Radiation dose reduction in cerebral CT perfusion imaging using iterative reconstruction. Eur. Radiol. 2013, 24, 484–493. [Google Scholar] [CrossRef]
  25. Wintermark, M.; Flanders, A.E.; Velthuis, B.; Meuli, R.; Van Leeuwen, M.; Goldsher, D.; Pineda, C.; Serena, J.; van der Schaaf, I.; Waaijer, A.; et al. Perfusion-CT assessment of infarct core and penumbra: Receiver operating characteristic curve analysis in 130 patients suspected of acute hemispheric stroke. Stroke 2006, 37, 979–985. [Google Scholar] [CrossRef] [PubMed] [Green Version]
  26. Wintermark, M.; Smith, W.S.; Ko, N.U.; Quist, M.; Schnyder, P.; Dillon, W.P. Dynamic Perfusion CT: Optimizing the Temporal Resolution and Contrast Volume for Calculation of Perfusion CT Parameters in Stroke Patients. Am. J. Neuroradiol. 2004, 25, 720–729. [Google Scholar]
  27. Kasasbeh, A.S.; Christensen, S.; Straka, M.; Mishra, N.; Mlynash, M.; Bammer, R.; Albers, G.W.; Lansberg, M.G. Optimal Computed Tomographic Perfusion Scan Duration for Assessment of Acute Stroke Lesion Volumes. Stroke 2016, 47, 2966–2971. [Google Scholar] [CrossRef] [Green Version]
  28. Corcuera-Solano, I.; McLellan, A.M.; Doshi, A.H.; Pawha, P.S.; Tanenbaum, L.N. Whole-Brain Adaptive 70-kVp Perfusion Imaging with Variable and Extended Sampling Improves Quality and Consistency While Reducing Dose. Am. J. Neuroradiol. 2014, 35, 2045–2051. [Google Scholar] [CrossRef]
Figure 1. Flow chart of patient recruitment.
Diagnostics 12 02853 g001
Figure 2. With the aid of an example, this figure explains the method of identifying the first scan of the simulated data sets. The CT attenuation values of the bolus tracking scan are marked with *. The x axis indicates the time passed after the contrast agent injection. The y axis represents the corresponding attenuation values. In the simulated CTP examinations, the initial scan was set to at least 1 s but not more than 2 s before the time at which the contrast agent bolus approached the threshold value of 100 HU in the ascending aorta. This means that if the contrast agent reached the threshold value (for example, 20 s after injection), the first CTP scan should be chosen around 18 s after injection, corresponding to the 8th scan acquired at 19 s after the contrast agent injection in this case. nAIF: arterial inflow peak; RefV: venous inflow peak.
Diagnostics 12 02853 g002
Figure 3. Visually identical perfusion maps of the original and the simulated examinations operating with 30, 28 or 26 scans.
Diagnostics 12 02853 g003
Figure 4. In patients with a fast bolus arrival, the number of scans could be decreased to 20.
Diagnostics 12 02853 g004
Figure 5. A shift in the ascending arterial inflow curve closer to the venous inflow curve was detected in the case of a very early contrast arrival in the ascending aorta.
Diagnostics 12 02853 g005
Figure 6. In the case of a slow bolus arrival, the descending slope of the arterial and venous inflow curves becomes truncated.
Diagnostics 12 02853 g006
Table 1. The data of the volumetric calculations of the shortened simulated CTPs are given as the mean value, standard deviation, minimum and maximum, including p-values and the data of radiation exposure as the CT dose index (CTDI). Significant p values are marked with *.
Simulated
CTP30
Simulated
CTP28
Simulated
CTP26
Simulated
CTP24
Simulated
CTP22
Simulated
CTP20
Number of Scans302826242220
CTDI183.9 mGy171.6 mGy159.4 mGy147.1 mGy134.8 mGy122.6 mGy
Infarct core
(mL)
Mean33.01p value = 0.193037.52p value = 0.888036.97p value = 0.056438.58p value = 0.0001 *39.03p value = 0.0024 *41.57p value < 0.0001 *
Standard deviation29.4836.6536.3436.7938.0738.19
Minimum8.316.346.166.043.496.00
Maximum174.75219.21222.55226.50228.6225.87
Penumbra
(mL)
Mean118.86p value = 0.1215132.68p value = 0.3609131.64p value = 0.0508119.82p value < 0.0001 *109.86p value < 0.0001 *102.96p value < 0.0001 *
Standard deviation59.8662.3757.8554.2352.5549.29
Minimum46.1743.3943.8440.7311.822.26
Maximum174.75326.08317.44296.27175.05245.10
Potential Recuperation
Ratio
Mean78.0%p value = 0.736977.0%p value = 0.707178.7%p value = 0.780576.6%p value < 0.0001 *74.6%p value < 0.000171.2%p value < 0.0001 *
Standard deviation13.2%16.7%13.3%13.6%14.2%17.8%
Minimum35.5%0.8%33.7%28.9%27.3%8.8%
Maximum95.4%96.0%96.5%93.6%92.9%92.8%
Table 2. The results of the comparative analysis of the PRR values of standard and simulated CTPs are given as the percentages of the simulated examinations, which present a deviation not exceeding 1%, 3%, 5% and 10%.
sCTP30sCTP28sCTP26sCTP24sCTP22sCTP20
Number of Scans302826242220
Percentage of patients with a difference in PRR value of≤1%84.5%58.5%55.4%24.2%15.2%10.6%
≤3%96.9%86.2%84.8%50.0%36.4%22.7%
≤5%100.0%100.0%100.0%75.8%62.1%40.9%
≤10%100.0%100.0%100.0%97.0%78.8%66.7%
Publisher’s Note: MDPI stays neutral with regard to jurisdictional claims in published maps and institutional affiliations.

