
Well-Aerated Lung and Mean Lung Density Quantified by CT at Discharge to Predict Pulmonary Diffusion Function 5 Months after COVID-19

 , , , ,
Abstract
:1. Introduction
2. Materials and Methods
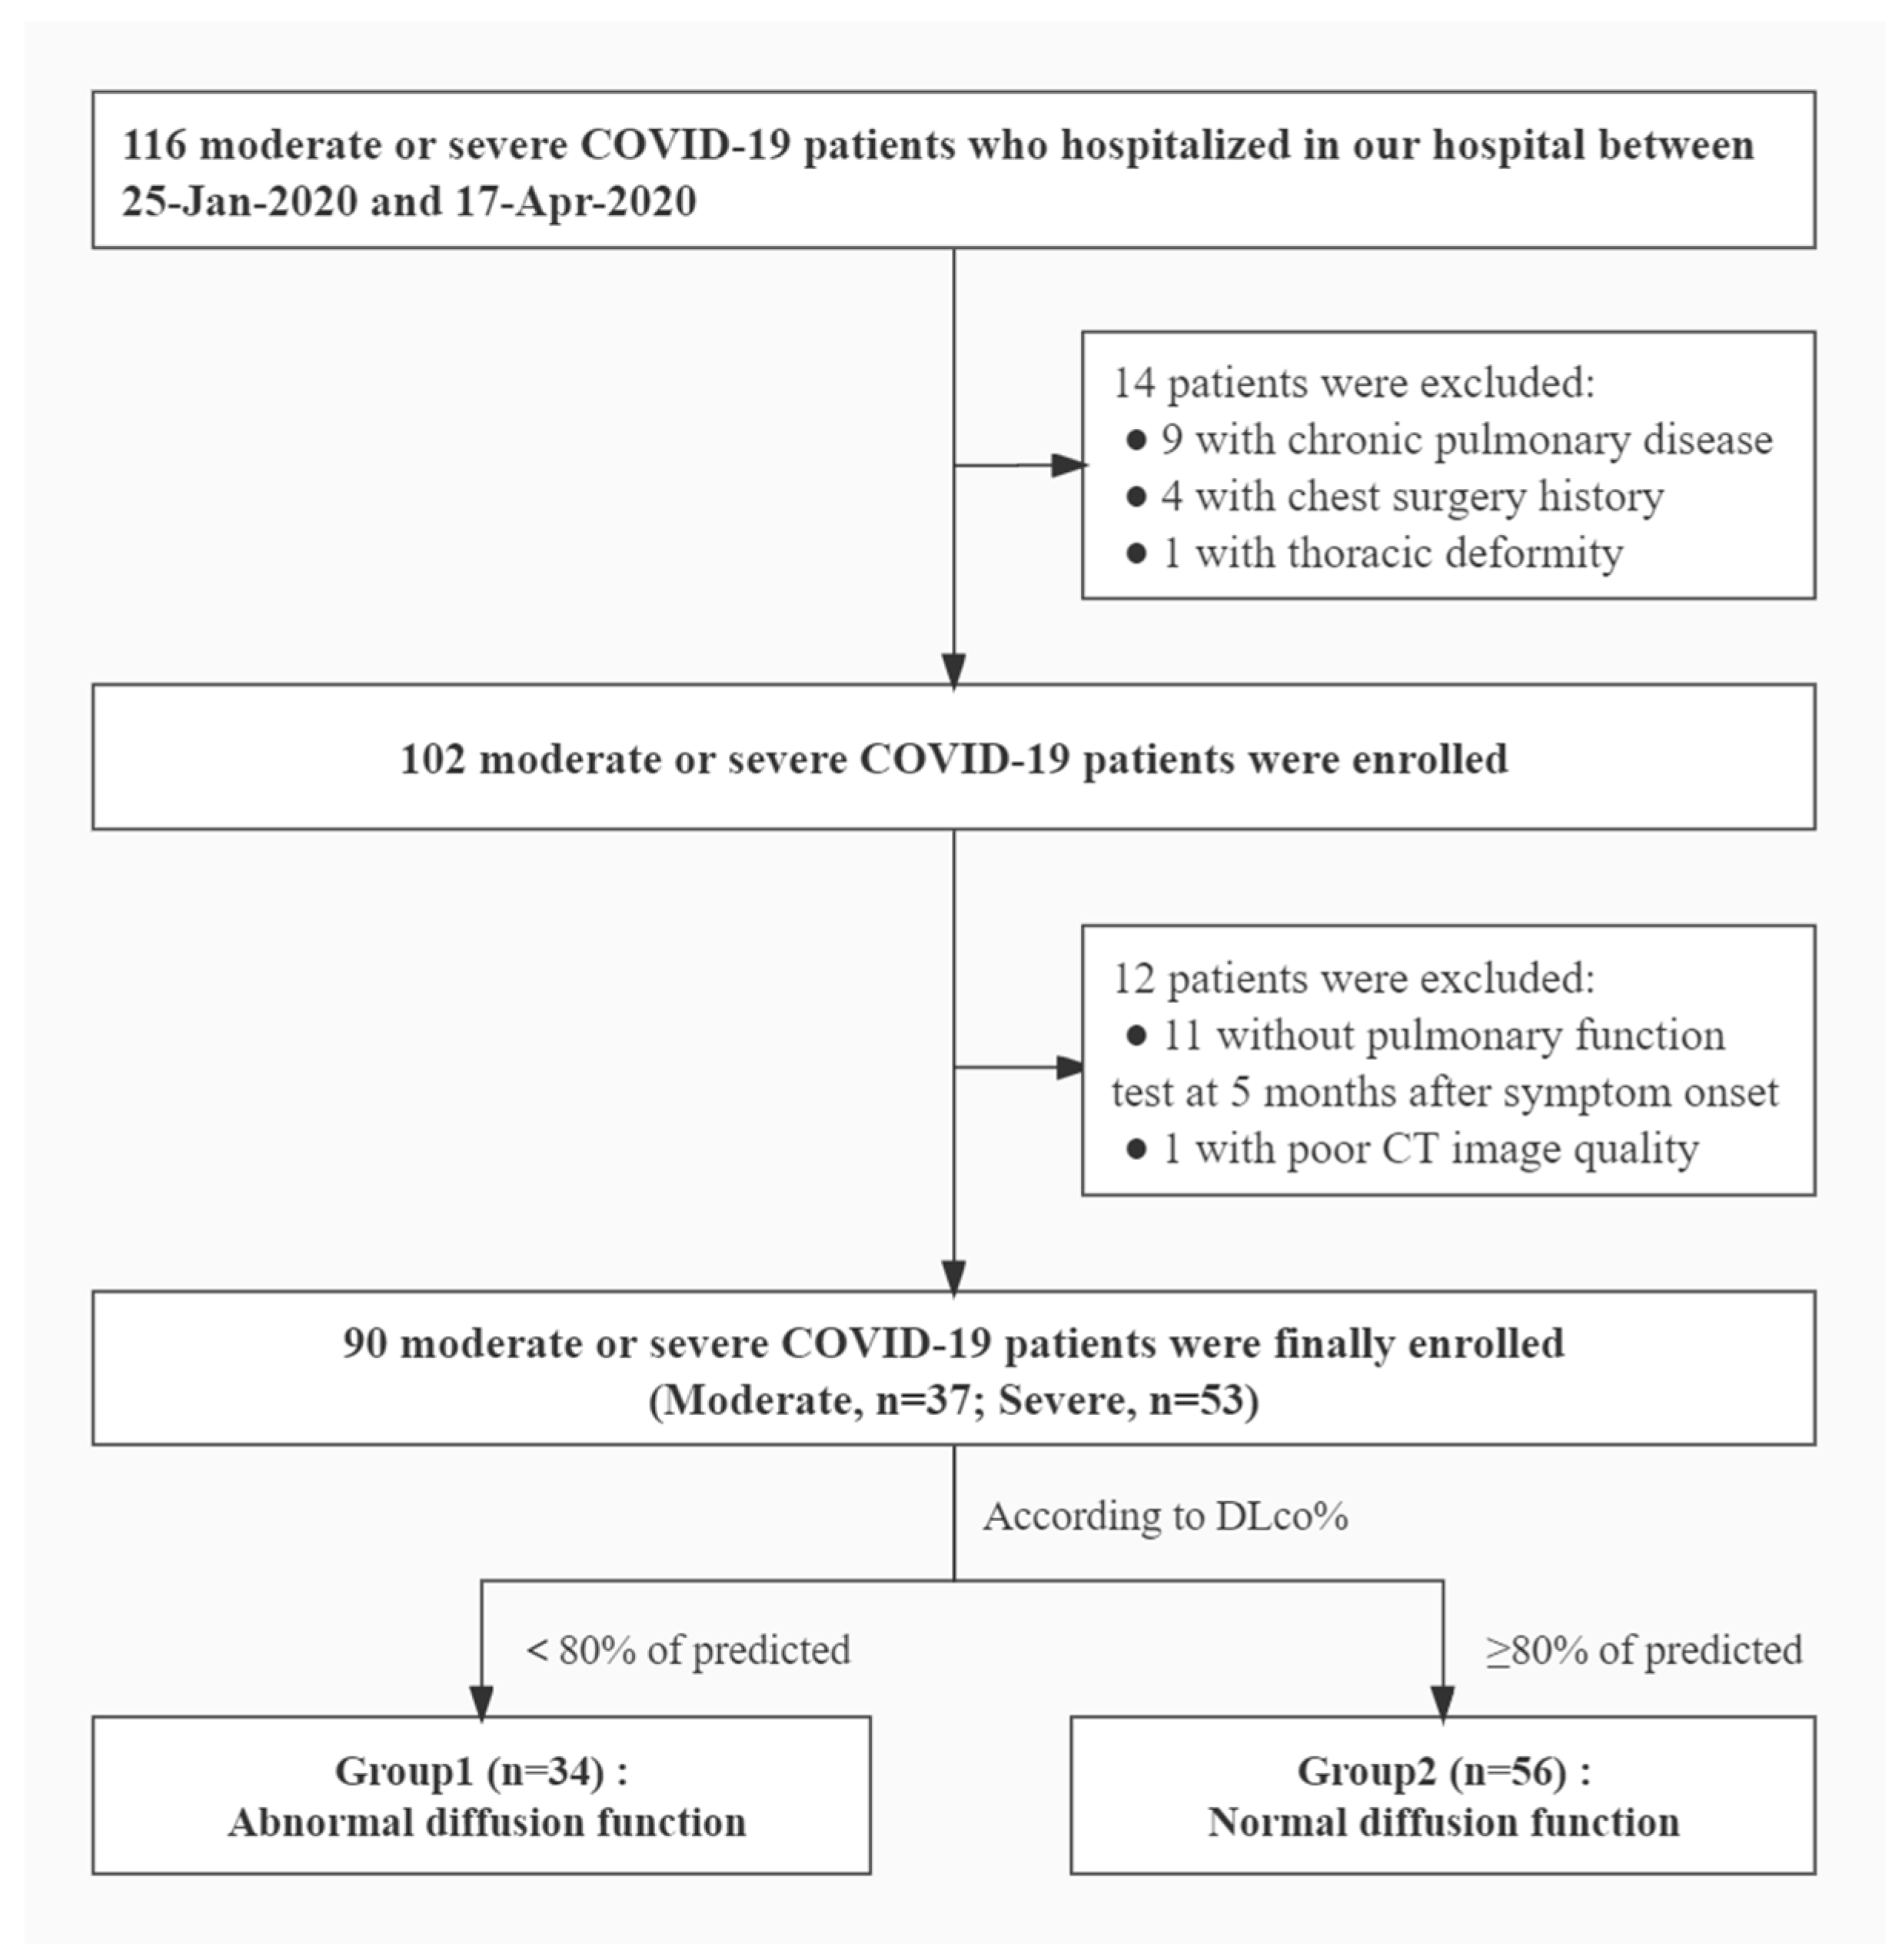
2.1. Patients
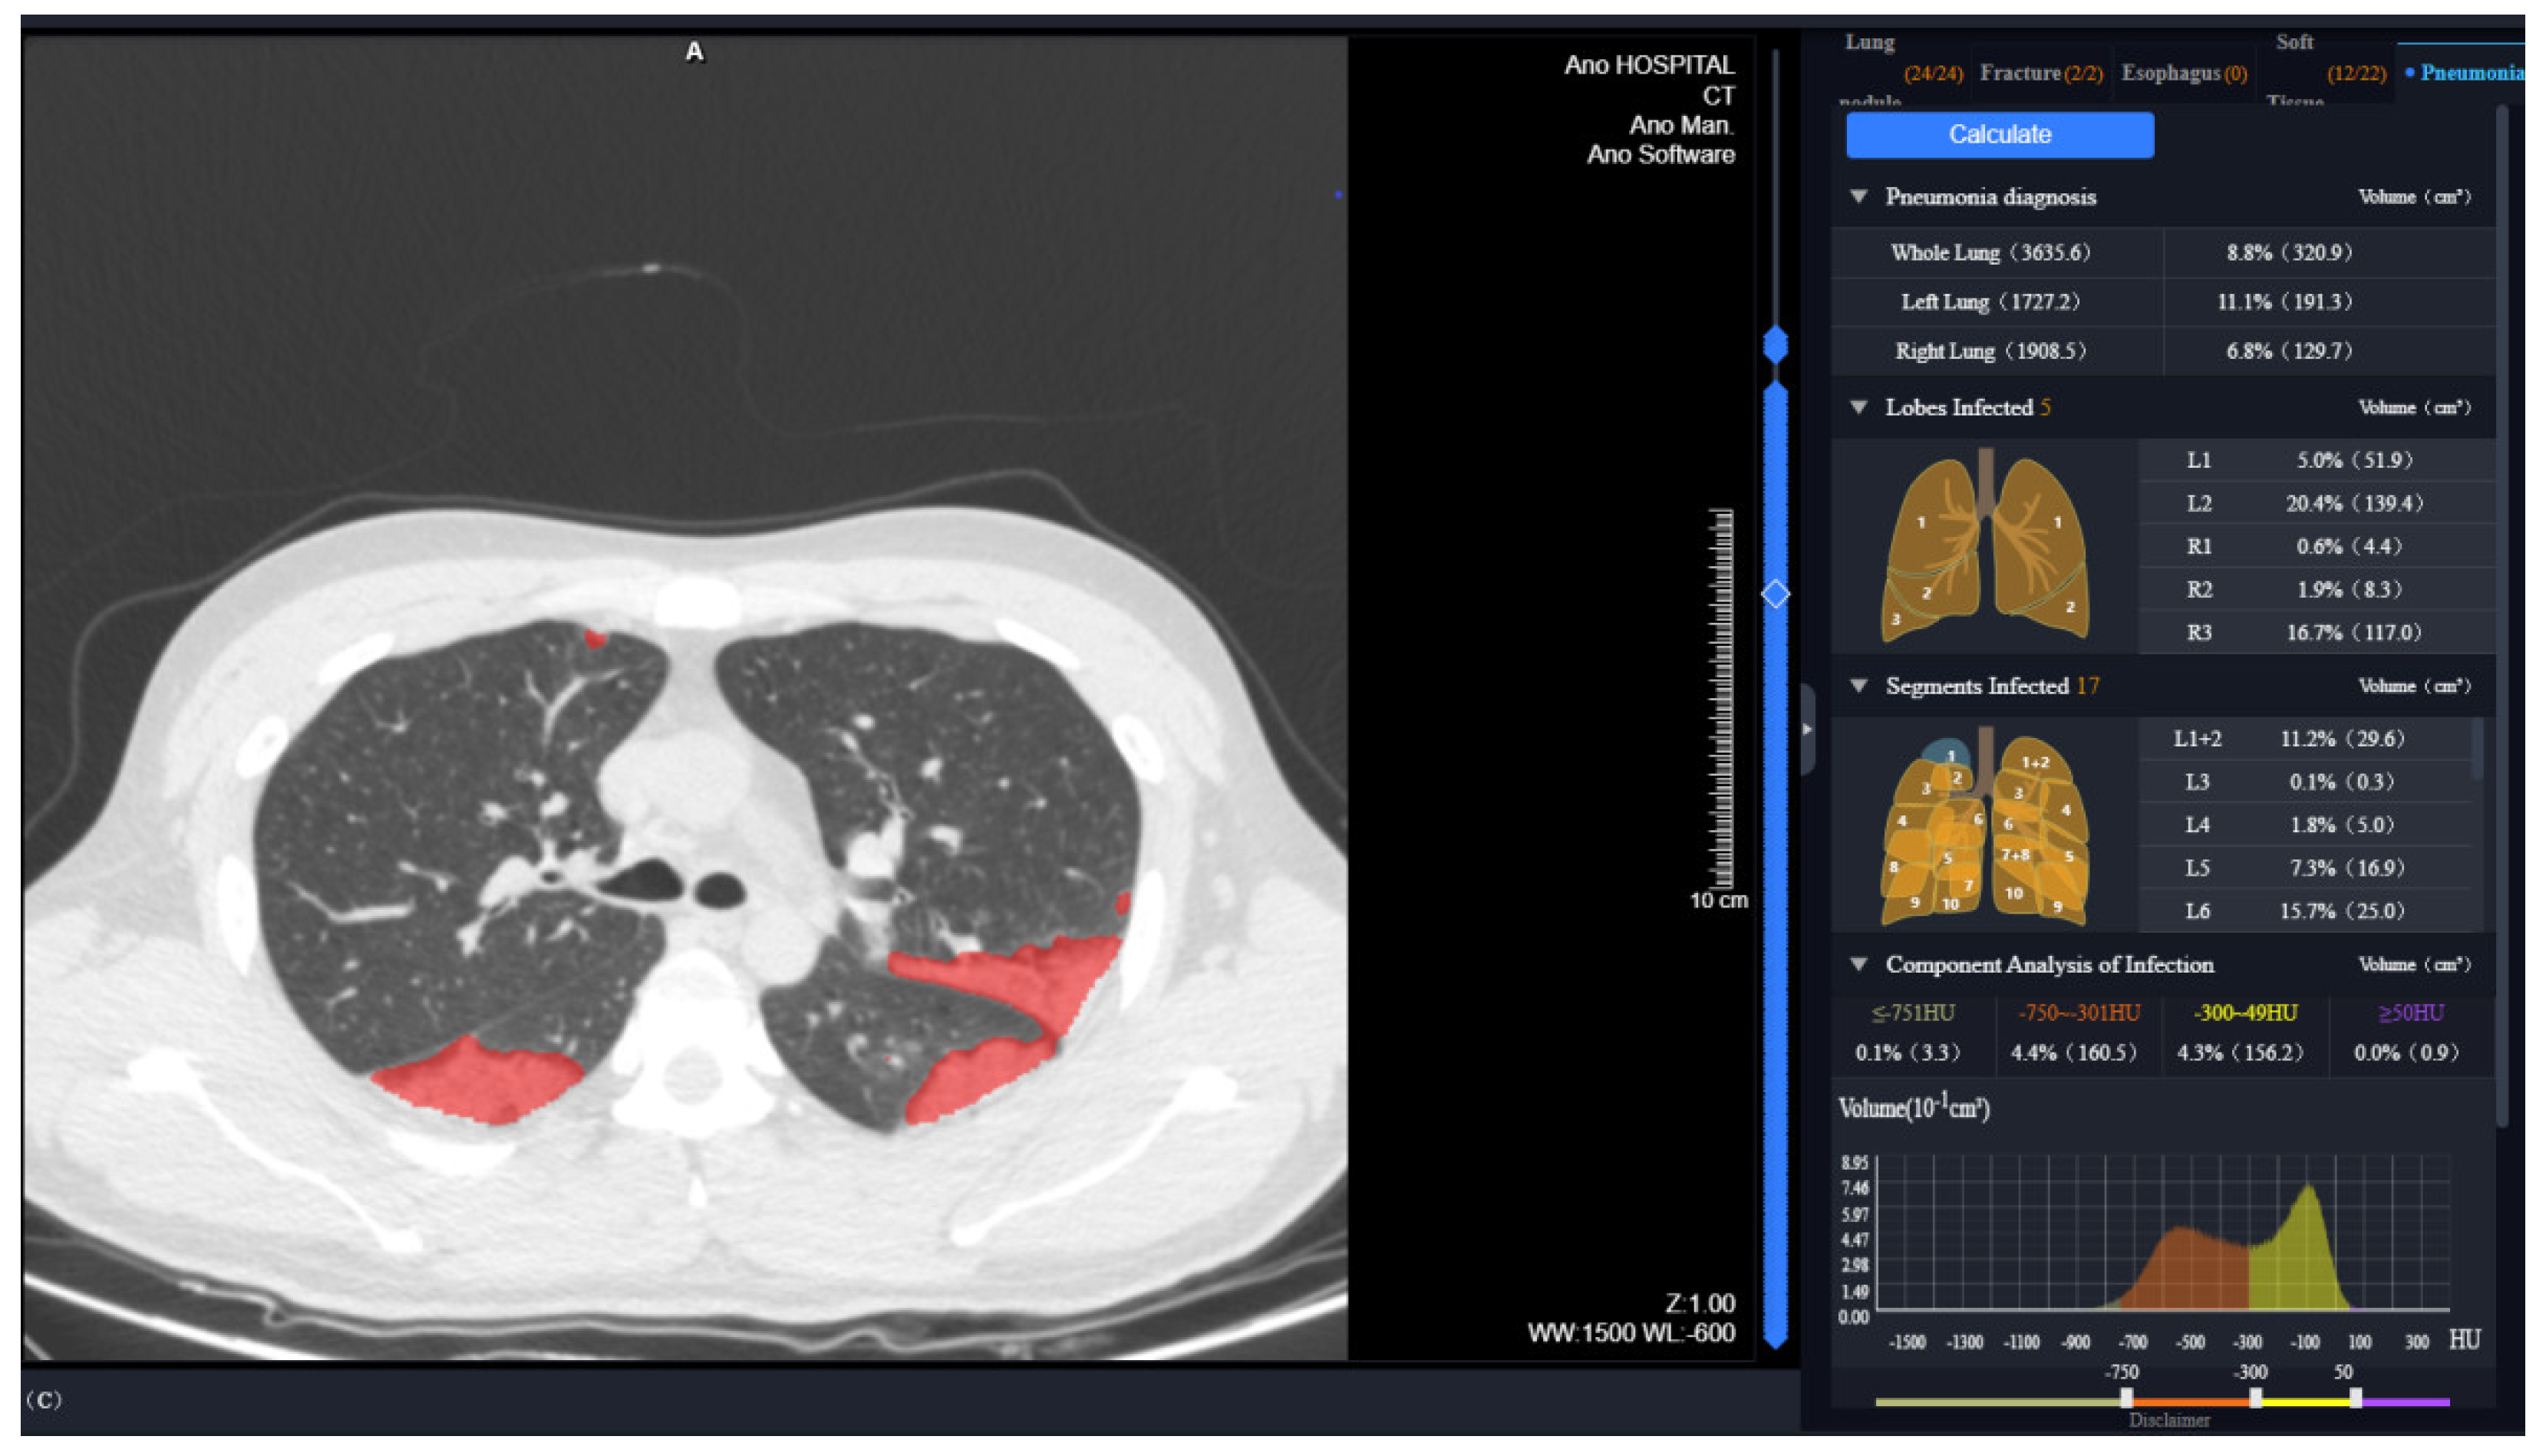
2.2. Chest CT Scan Protocol and AI-Based Quantitative Data Acquisition
2.3. Pulmonary Function Tests (PFTs)
2.4. Statistical Analysis
3. Results
3.1. Characteristics of COVID-19 Patients
3.2. CT Findings and Quantitative Results of COVID-19 Survivors at Discharge
3.3. Pulmonary Function of COVID-19 Survivors at 5 Months after Symptom Onset
3.4. Quantitative CT Factors Associated with Abnormal Diffusion Function at 5 Months after Symptom Onset
4. Discussion
5. Conclusions
Supplementary Materials
Author Contributions
Funding
Institutional Review Board Statement
Informed Consent Statement
Data Availability Statement
Conflicts of Interest
References
- Hui, D.S.; Joynt, G.M.; Wong, K.T.; Gomersall, C.D.; Li, T.S.; Antonio, G.; Ko, F.W.; Chan, M.C.; Chan, D.P.; Tong, M.W.; et al. Impact of severe acute respiratory syndrome (SARS) on pulmonary function, functional capacity and quality of life in a cohort of survivors. Thorax 2005, 60, 401–409. [Google Scholar] [CrossRef] [Green Version]
- Ngai, J.C.; Ko, F.W.S.; Ng, S.; To, K.-W.; Tong, M.; Hui, D.S. The long-term impact of severe acute respiratory syndrome on pulmonary function, exercise capacity and health status. Respirology 2010, 15, 543–550. [Google Scholar] [CrossRef] [PubMed] [Green Version]
- Qin, W.; Chen, S.; Zhang, Y.; Dong, F.; Zhang, Z.; Hu, B.; Zhu, Z.; Li, F.; Wang, X.; Wang, Y.; et al. Diffusion capacity abnormalities for carbon monoxide in patients with COVID-19 at Three-Month follow-up. Eur. Respir. J. 2021, 58, 2003677. [Google Scholar] [CrossRef] [PubMed]
- Mo, X.; Jian, W.; Su, Z.; Chen, M.; Peng, H.; Peng, P.; Lei, C.; Chen, R.; Zhong, N.; Li, S. Abnormal pulmonary function in COVID-19 patients at time of hospital discharge. Eur. Respir. J. 2020, 55, 2001217. [Google Scholar] [CrossRef] [PubMed]
- Huang, C.; Huang, L.; Wang, Y.; Li, X.; Ren, L.; Gu, X.; Kang, L.; Guo, L.; Liu, M.; Zhou, X.; et al. 6-Month consequences of COVID-19 in patients discharged from hospital: A cohort study. Lancet 2021, 397, 220–232. [Google Scholar] [CrossRef]
- Wu, X.; Liu, X.; Zhou, Y.; Yu, H.; Li, R.; Zhan, Q.; Ni, F.; Fang, S.; Lu, Y.; Ding, X.; et al. 3-Month, 6-month, 9-month, and 12-month respiratory outcomes in patients following COVID-19-related hospitalisation: A prospective study. Lancet Respir. Med. 2021, 9, 747–754. [Google Scholar] [CrossRef]
- Blanco, J.R.; Cobos-Ceballos, M.J.; Navarro, F.; Sanjoaquin, I.; Arnaiz, D.L.R.F.; Bernal, E.; Buzon-Martin, L.; Viribay, M.; Romero, L.; Espejo-Perez, S.; et al. Pulmonary long-term consequences of COVID-19 infections after hospital discharge. Clin. Microbiol. Infect. 2021, 27, 892–896. [Google Scholar] [CrossRef] [PubMed]
- Graham, B.L.; Brusasco, V.; Burgos, F.; Cooper, B.G.; Jensen, R.; Kendrick, A.; MacIntyre, N.R.; Thompson, B.R.; Wanger, J. 2017 ERS/ATS standards for single-breath carbon monoxide uptake in the lung. Eur. Respir. J. 2017, 49, 1600016. [Google Scholar] [CrossRef] [PubMed] [Green Version]
- Huang, Y.; Tan, C.; Wu, J.; Chen, M.; Wang, Z.; Luo, L.; Zhou, X.; Liu, X.; Huang, X.; Yuan, S.; et al. Impact of coronavirus disease 2019 on pulmonary function in early convalescence phase. Respir. Res. 2020, 21, 1–10. [Google Scholar] [CrossRef] [PubMed]
- Burgos, F.; Torres, A.; González, J.; Puig De La Bellacasa, J.; Rodriguez-Roisin, R.; Roca, J. Bacterial colonization as a potential source of nosocomial respiratory infections in two types of spirometer. Eur. Respir. J. 1996, 9, 2612–2617. [Google Scholar] [CrossRef]
- Li, L.; Yang, L.; Gui, S.; Pan, F.; Ye, T.; Liang, B.; Hu, Y.; Zheng, C. Association of clinical and radiographic findings with the outcomes of 93 patients with COVID-19 in Wuhan, China. Theranostics 2020, 10, 6113–6121. [Google Scholar] [CrossRef]
- Xiong, Y.; Sun, D.; Liu, Y.; Fan, Y.; Zhao, L.; Li, X.; Zhu, W. Clinical and High-Resolution CT features of the COVID-19 infection. Investig. Radiol. 2020, 55, 332–339. [Google Scholar] [CrossRef] [PubMed]
- Francone, M.; Iafrate, F.; Masci, G.M.; Coco, S.; Cilia, F.; Manganaro, L.; Panebianco, V.; Andreoli, C.; Colaiacomo, M.C.; Zingaropoli, M.A.; et al. Chest CT score in COVID-19 patients: Correlation with disease severity and short-term prognosis. Eur. Radiol. 2020, 30, 6808–6817. [Google Scholar] [CrossRef] [PubMed]
- Zhang, K.; Liu, X.; Shen, J.; Li, Z.; Sang, Y.; Wu, X.; Zha, Y.; Liang, W.; Wang, C.; Wang, K.; et al. Clinically applicable AI system for accurate diagnosis, quantitative measurements and prognosis of COVID-19 pneumonia using computed tomography. Cell 2020, 181, 1423–1433. [Google Scholar] [CrossRef] [PubMed]
- Murphy, K.; Smits, H.; Knoops, A.J.G.; Korst, M.B.J.M.; Samson, T.; Scholten, E.T.; Schalekamp, S.; Schaefer-Prokop, C.M.; Philipsen, R.H.; Meijers, A.; et al. COVID-19 on the chest radiograph: A Multi-Reader evaluation of an AI system. Radiology 2020, 201874. [Google Scholar] [CrossRef]
- Wang, X.; Deng, X.; Fu, Q.; Zhou, Q.; Feng, J.; Ma, H.; Liu, W.; Zheng, C. A Weakly-Supervised framework for COVID-19 classification and lesion localization from chest CT. IEEE Trans. Med Imaging 2020, 39, 2615–2625. [Google Scholar] [CrossRef]
- Zhang, H.; Zhang, J.; Zhang, H.; Nan, Y.; Zhao, Y.; Fu, E.; Xie, Y.H.; Liu, W.; Li, W.P.; Zhang, H.J.; et al. Automated detection and quantification of COVID-19 pneumonia: CT imaging analysis by a deep learning-based software. Eur. J. Nucl. Med. Mol. Imaging 2020, 47, 2525–2532. [Google Scholar] [CrossRef] [PubMed]
- WHO. Clinical Management of Severe Acute Respiratory Infection When Novel Coronavirus (2019-nCoV) Infection Is Suspected; WHO: Geneva, Switzerland, 2020. [Google Scholar]
- Wang, D.; Hu, B.; Hu, C.; Zhu, F.; Liu, X.; Zhang, J.; Wang, B.; Xiang, H.; Cheng, Z.; Xiong, Y.; et al. Clinical Characteristics of 138 Hospitalized Patients with 2019 Novel Coronavirus-Infected Pneumonia in Wuhan, China. JAMA 2020, 323, 1061–1069. [Google Scholar] [CrossRef] [PubMed]
- National Health Commision of the People’s Republic of China. Diagnosis and Treatment Protocol for COVID-19 in China, 5th ed.; National Health Commision of the People’s Republic of China: Beijing, China, 2020. [Google Scholar]
- Shan, F.; Gao, Y.; Wang, J.; Shi, W.; Shi, N.; Han, M.; Xue, Z.; Shen, D.; Shi, Y. Abnormal lung quantification in chest CT images of COVID-19 patients with deep learning and its application to severity prediction. Med. Phys. 2020, 48, 1633–1645. [Google Scholar] [CrossRef] [PubMed]
- Karimi, R.; Tornling, G.; Forsslund, H.; Mikko, M.; Wheelock, Å.M.; Nyrén, S.; Sköld, C.M. Lung density on high resolution computer tomography (HRCT) reflects degree of inflammation in smokers. Respir. Res. 2014, 15, 23. [Google Scholar] [CrossRef]
- Kauczor, H.U.; Heitmann, K.; Heussel, C.P.; Marwede, D.; Uthmann, T.; Thelen, M. Automatic detection and quantification of ground-glass opacities on high-resolution CT using multiple neural networks: Comparison with a density mask. AJR Am. J. Roentgenol. 2000, 175, 1329–1334. [Google Scholar] [CrossRef] [Green Version]
- Ippolito, D.; Ragusi, M.; Gandola, D.; Maino, C.; Pecorelli, A.; Terrani, S.; Peroni, M.; Giandola, T.; Porta, M.; Talei Franzesi, C.; et al. Computed tomography semi-automated lung volume quantification in SARS-CoV-2-related pneumonia. Eur. Radiol. 2021, 31, 2726–2736. [Google Scholar] [CrossRef]
- Culver, B.H.; Graham, B.L.; Coates, A.L.; Wanger, J.; Berry, C.E.; Clarke, P.K.; Hallstrand, T.S.; Hankinson, J.L.; Kaminsky, D.A.; MacIntyre, N.R.; et al. Recommendations for a standardized pulmonary function report. An official american thoracic society technical statement. Am. J. Respir. Crit. Care 2017, 196, 1463–1472. [Google Scholar] [CrossRef] [PubMed]
- Shi, H.; Han, X.; Jiang, N.; Cao, Y.; Alwalid, O.; Gu, J.; Fan, Y.; Zheng, C. Radiological findings from 81 patients with COVID-19 pneumonia in Wuhan, China: A descriptive study. Lancet Infect. Dis. 2020, 20, 425–434. [Google Scholar] [CrossRef] [PubMed]
- Pan, F.; Ye, T.; Sun, P.; Gui, S.; Liang, B.; Li, L.; Zheng, D.; Wang, J.; Hesketh, R.L.; Yang, L.; et al. Time course of lung changes on chest CT during recovery from 2019 novel coronavirus (COVID-19) pneumonia. Radiology 2020, 200370. [Google Scholar] [CrossRef] [Green Version]
- Xie, L.; Liu, Y.; Xiao, Y.; Tian, Q.; Fan, B.; Zhao, H.; Chen, W. Follow-up study on pulmonary function and lung radiographic changes in rehabilitating severe acute respiratory syndrome patients after discharge. Chest 2005, 127, 2119–2124. [Google Scholar] [CrossRef] [PubMed] [Green Version]
- Gevenois, P.A.; De Vuyst, P.; De Maertelaer, V.; Zanen, J.; Jacobovitz, D.; Cosio, M.G.; Yernault, J.C. Comparison of computed density and microscopic morphometry in pulmonary emphysema. Am. J. Respir. Crit. Care 1996, 154, 187. [Google Scholar] [CrossRef]
- Matsuoka, S.; Yamashiro, T.; Matsushita, S.; Kotoku, A.; Fujikawa, A.; Yagihashi, K.; Nakajima, Y. Quantitative CT evaluation in patients with combined pulmonary fibrosis and emphysema. Acad. Radiol. 2015, 22, 626–631. [Google Scholar] [CrossRef] [PubMed]
- Colombi, D.; Bodini, F.C.; Petrini, M.; Maffi, G.; Morelli, N.; Milanese, G.; Silva, M.; Sverzellati, N.; Michieletti, E. Well-aerated lung on admitting chest CT to predict adverse outcome in COVID-19 pneumonia. Radiology 2020, 296, E86–E96. [Google Scholar] [CrossRef] [PubMed] [Green Version]
- Nishiyama, A.; Kawata, N.; Yokota, H.; Sugiura, T.; Matsumura, Y.; Higashide, T.; Horikoshi, T.; Oda, S.; Tatsumi, K.; Uno, T. A predictive factor for patients with acute respiratory distress syndrome: CT lung volumetry of the well-aerated region as an automated method. Eur. J. Radiol. 2020, 122, 108748. [Google Scholar] [CrossRef] [PubMed]
- Ackermann, M.; Verleden, S.E.; Kuehnel, M.; Haverich, A.; Welte, T.; Laenger, F.; Vanstapel, A.; Werlein, C.; Stark, H.; Tzankov, A.; et al. Pulmonary vascular endothelialitis, thrombosis, and angiogenesis in COVID-19. N. Engl. J. Med. 2020, 383, 120–128. [Google Scholar] [CrossRef] [PubMed]
- Kalef-Ezra, J.; Karantanas, A.; Tsekeris, P. CT measurement of lung density. Acta Radiol. 1999, 40, 333–337. [Google Scholar] [CrossRef] [PubMed]
- Robert, H.B.; Robert, A.W.; Kirk, G.; Drummond, M.B.; Mitzner, W. Lung density changes with growth and inflation. Chest 2015, 148, 995–1002. [Google Scholar] [CrossRef] [Green Version]
- Bao, C.; Liu, X.; Zhang, H.; Li, Y.; Liu, J. Coronavirus disease 2019 (COVID-19) CT findings: A systematic review and meta-analysis. J. Am. Coll. Radiol. 2020, 17, 701–709. [Google Scholar] [CrossRef] [PubMed]
- Zhu, J.; Huang, W.-C.; Huang, B.; Zhu, Y.; Jiang, X.-J.; Zou, J.-N.; Yang, G.; Wang, Z.; Ji, T.; Gu, M.-M.; et al. Clinical characteristics and prognosis of COVID-19 patients with initial presentation of lung lesions confined to a single pulmonary lobe. Am. J. Transl. Res. 2020, 12, 7501–7509. [Google Scholar] [PubMed]
- Yu, Q.; Wang, Y.; Huang, S.; Liu, S.; Zhou, Z.; Zhang, S.; Zhao, Z.; Yu, Y.; Yang, Y.; Ju, S. Multicenter cohort study demonstrates more consolidation in upper lungs on initial CT increases the risk of adverse clinical outcome in COVID-19 patients. Theranostics 2020, 10, 5641–5648. [Google Scholar] [CrossRef]

| Characteristics | All Patients (n = 90) | Group 1, Abnormal Diffusion Function (n = 34) | Group 2, Normal Diffusion Function (n = 56) | p Value |
|---|---|---|---|---|
| Age, years | 57.00 (49.75, 64.25) | 59.00 (49.75, 67.00) | 56.00 (47.75, 63.00) | 0.275 |
| ≤50 | 24/90 (26.7%) | 9/34 (26.5%) | 15/56 (26.8%) | 0.974 |
| >50 | 66/90 (73.3%) | 25/34 (73.5%) | 41/56 (73.2%) | |
| Sex | ||||
| Male | 35/90 (38.9%) | 12/34 (35.3%) | 23/56 (41.1%) | 0.586 |
| Female | 55/90 (61.1%) | 22/34 (64.7%) | 33/56 (58.9%) | |
| Height, cm | 163.00 (158.75, 170.00) | 164.50 (160.00, 170.00) | 161.50 (158.00, 169.75) | 0.499 |
| Weight, kg | 64.00 (58.00, 72.25) | 63.00 (58.00, 71.50) | 64.50 (58.00, 74.25) | 0.881 |
| BMI, kg/m² | 23.96 (22.18, 25.41) | 23.34 (21.92, 25.45) | 24.02 (22.72, 25.44) | 0.495 |
| Comorbidities | ||||
| Hypertension | 10/90 (11.1%) | 6/34 (17.6%) | 4/56 (7.1%) | 0.124 |
| Diabetes | 4/90 (4.4%) | 3/34 (8.8%) | 1/56 (1.8%) | 0.116 |
| Coronary heart disease | 2/90 (2.2%) | 1/34 (2.9%) | 1/56 (1.8%) | 0.718 |
| Liver history | 5/90 (5.6%) | 3/34 (8.8%) | 2/56 (3.6%) | 0.292 |
| Kidney history | 1/90 (1.1%) | 1/34 (2.9%) | 0/56 (0%) | 0.197 |
| Clinical classification | ||||
| Moderate | 37/90 (41.1%) | 12/34 (35.3%) | 25/56 (44.6%) | 0.382 |
| Severe | 53/90 (58.9%) | 22/34 (64.7%) | 31/56 (55.4%) | |
| Hospital stay duration, days | 32 (14, 40) | 33.5 (13.25, 44.75) | 31.5 (14.25, 38.75) | 0.386 |
| Characteristics | All Patients (n = 90) | Group1, Abnormal Diffusion Function (n = 34) | Group2, Normal Diffusion Function (n = 56) | p Value |
|---|---|---|---|---|
| MLD, HU | −810.35 (−829.05, −778.78) | −803.6 (−823.48, −752.5) | −815.75 (−832.88, −796.33) | 0.023 * |
| LV, cm3 | 3978.3 (3524.8, 4576.38) | 3978.45 (3429.48, 4334.05) | 3971.35 (3526.6, 4805.35) | 0.276 |
| Well-aerated lung tissue | ||||
| WAL, cm3 | 3203.9 (2641.35, 3830.05) | 3130.75 (2298.55, 3547.93) | 3310.7 (2799.98, 4022.8) | 0.101 |
| WAL% | 82.15 (72.59, 85.32) | 79.38 (68.37, 83.03) | 83.18 (76.49, 85.66) | 0.019 * |
| MLDLe, HU | −679.95 (−739.3, −592.83) | −687 (−738, −642.78) | −674.85 (−740.1, −527.25) | 0.221 |
| LeV, cm3 | 150.35 (18.9, 389.9) | 244.1 (36.38, 608.25) | 118.3 (13.23, 331.4) | 0.092 |
| LeV% | 3.35 (0.5, 10.75) | 5.4 (0.83, 16.08) | 3 (0.35, 8.73) | 0.080 |
| GGO | ||||
| GV, cm3 | 64.1 (10.45, 163.98) | 100.7 (18.03, 345.93) | 50.55 (7.38, 143.95) | 0.105 |
| GV% | 45.74 (34.42, 59.99) | 45 (34.57, 61.36) | 45.8 (33.37, 59.53) | 0.552 |
| Consolidation | ||||
| CV, cm3 | 4.2 (0.6, 20.55) | 6.05 (1.08, 25.68) | 3.05 (0.43, 17.73) | 0.191 |
| CV% | 3.18 (1.26, 5.99) | 3.43 (1.84, 5.87) | 2.8 (1.18, 6.15) | 0.407 |
| With residual lesions, n/N (%) | 80/90 (88.9%) | 33/34 (97.1%) | 47/56 (83.9%) | 0.055 |
| Location of residual lesion a | ||||
| Unilateral, n/N (%) | 2/80 (2.5%) | 0/33 (0%) | 2/47 (4.3%) | 0.230 |
| Bilateral, n/N (%) | 78/80 (97.5%) | 33/33 (100%) | 45/47 (95.7%) | |
| Left upper lobe (LUL), n/N (%) | 76/80 (95%) | 32/33 (97%) | 44/47 (93.6%) | 0.498 |
| Left lower lobe (LLL), n/N (%) | 78/80 (97.5%) | 32/33 (97%) | 46/47 (97.9%) | 0.799 |
| Right upper lobe (RUL), n/N (%) | 74/80 (92.5%) | 32/33 (97%) | 42/47 (89.4%) | 0.203 |
| Right middle lobe (RML), n/N (%) | 65/80 (81.3%) | 29/33 (87.9%) | 36/47 (76.6%) | 0.203 |
| Right lower lobe (RLL), n/N (%) | 78/80 (97.5%) | 33/33 (100%) | 45/47 (95.7%) | 0.230 |
| Characteristics | All Patients (n = 90) | Group 1, Abnormal Diffusion Function (n = 34) | Group 2, Normal Diffusion Function (n = 56) | p Value |
|---|---|---|---|---|
| Time from PFTs to symptom onset (days) | 146 (140, 164) | 150 (141, 165.25) | 146 (139.25, 153.75) | 0.244 |
| Gas diffusion | ||||
| DLCO (% of pred. value) | 84.6 (75.53, 93.7) | 74.55 (65.73, 75.73) | 91.45 (85.28, 98.95) | <0.001 ** |
| <80% of pred. value, n/N (%) | 34/90 (37.8%) | 34/34 (100%) | 0/56 (0%) | |
| DLCO/VA (% of pred. value) | 95.7 (85.25, 105.15) | 84.95 (77.08, 97.75) | 100.65 (90.6, 106.58) | <0.001 ** |
| <80% of pred. value, n/N (%) | 13/90 (14.4%) | 13/34 (38.2%) | 0/56 (0%) | <0.001 ** |
| Spirometry | ||||
| FEV1/FVC (%) | 76.54 (71.68, 80.45) | 78.75 (71.03, 81.17) | 76.42 (71.94, 79.69) | 0.506 |
| <70%, n/N (%) | 17/90 (18.9%) | 8/34 (23.5%) | 9/56 (16.1%) | 0.381 |
| FEV1 (% of pred. value) | 97.05 (88.15, 110.25) | 89.1 (80.38, 111.93) | 100.6 (92.95, 109.35) | 0.011 * |
| <80% of pred. value, n/N (%) | 7/90 (7.8%) | 5/34 (14.7%) | 2/56 (3.6%) | 0.056 |
| MEF75% (% of pred. value) | 100.15 (81.63, 121.45) | 102.9 (75.9, 122.1) | 100.15 (85.3, 121.2) | 0.677 |
| <65% of pred. value, n/N (%) | 4/90 (4.4%) | 2/34 (5.9%) | 2/56 (3.6%) | 0.606 |
| MEF50% (% of pred. value) | 75.40 (55.03, 97.93) | 79.95 (49.38, 100.43) | 71.55 (57, 90.38) | 0.894 |
| <65% of pred. value, n/N (%) | 33/90 (36.7%) | 14/34 (41.2%) | 19/56 (33.9%) | 0.489 |
| MMEF (% of pred. value) | 64.4 (47.23, 81.43) | 66.5 (41.78, 90.35) | 63.45 (50.53, 79.9) | 0.884 |
| <65% of pred. value, n/N (%) | 46/90 (51.1%) | 17/34 (50%) | 29/56 (51.8%) | 0.869 |
| Lung volume | ||||
| TLC (% of pred. value) | 93.2 (84.03, 101.2) | 86.8 (75.13, 92.95) | 96.45 (87.83, 102.73) | <0.001 ** |
| <80% of pred. value, n/N (%) | 14/90 (15.6%) | 12/34 (35.3%) | 2/56 (3.6%) | <0.001 ** |
| FVC (% of pred. value) | 107.15 (96.25, 118.93) | 101.35 (90.75, 112.1) | 110.05 (101.8, 118.98) | 0.014 * |
| <80% of pred. value, n/N (%) | 1/90 (1.1%) | 1/34 (2.9%) | 0/56 (0%) | 0.197 |
| Variables | Univariable Analysis | Multivariable Analysis | ||||
|---|---|---|---|---|---|---|
| Coefficient (95% CI) | OR (95% CI) | p Value | Coefficient (95% CI) | OR (95% CI) | p Value | |
| Linear regression analysis | ||||||
| MLD, HU | −0.075 (−0.133, −0.018) | / | 0.011 * | / | / | / |
| LV, cm3 | 0.004 (0.001, 0.007) | / | 0.008 * | / | / | / |
| WAL, cm3 | 0.004 (0.001, 0.007) | / | 0.002 * | 0.004 (0.001, 0.007) | / | 0.002 * |
| WAL% | 0.331 (0.075, 0.588) | / | 0.012 * | / | / | / |
| MLDLe, HU | 0.007 (−0.005, 0.02) | / | 0.234 | / | / | / |
| LeV, cm3 | −0.01 (−0.017, −0.002) | / | 0.011 * | / | / | / |
| LeV% | −0.377 (−0.635, −0.12) | / | 0.005 * | / | / | / |
| GV, cm3 | −0.016 (−0.029, −0.002) | / | 0.025 * | / | / | / |
| GV% | −0.065 (−0.2, 0.071) | / | 0.347 | / | / | / |
| CV, cm3 | −0.043 (−0.091, 0.005) | / | 0.075 | / | / | / |
| CV% | −0.224 (−0.639, 0.19) | / | 0.286 | / | / | / |
| Logistic regression analysis | ||||||
| MLD, HU | 0.01 (0.001, 0.02) | 1.011 (1.001, 1.02) | 0.035 * | 0.01 (0.001, 0.02) | 1.011 (1.001, 1.02) | 0.035 * |
| LV, cm3 | 0 (−0.001, 0) | 1 (0.999, 1) | 0.109 | / | / | / |
| WAL, cm3 | 0 (−0.001, 0) | 1 (0.999, 1) | 0.046 * | / | / | / |
| WAL% | −0.042 (−0.082, −0.001) | 0.959 (0.921, 0.999) | 0.045 * | / | / | / |
| MLDLe, HU | −0.002 (−0.005, 0) | 0.998 (0.995, 1) | 0.077 | / | / | / |
| LeV, cm3 | 0.001 (0, 0.002) | 1.001 (1, 1.002) | 0.058 | / | / | / |
| LeV% | 0.044 (0.003, 0.086) | 1.045 (1.003, 1.09) | 0.036 * | / | / | / |
| GV, cm3 | 0.002 (0, 0.004) | 1.002 (1, 1.004) | 0.111 | / | / | / |
| GV% | 0.013 (−0.008, 0.035) | 1.013 (0.992, 1.035) | 0.217 | / | / | / |
| SCV, cm3 | 0.007 (−0.007, 0.02) | 1.007 (0.993, 1.021) | 0.320 | / | / | / |
| SCV% | 0.008 (−0.053, 0.069) | 1.008 (0.948, 1.071) | 0.801 | / | / | / |
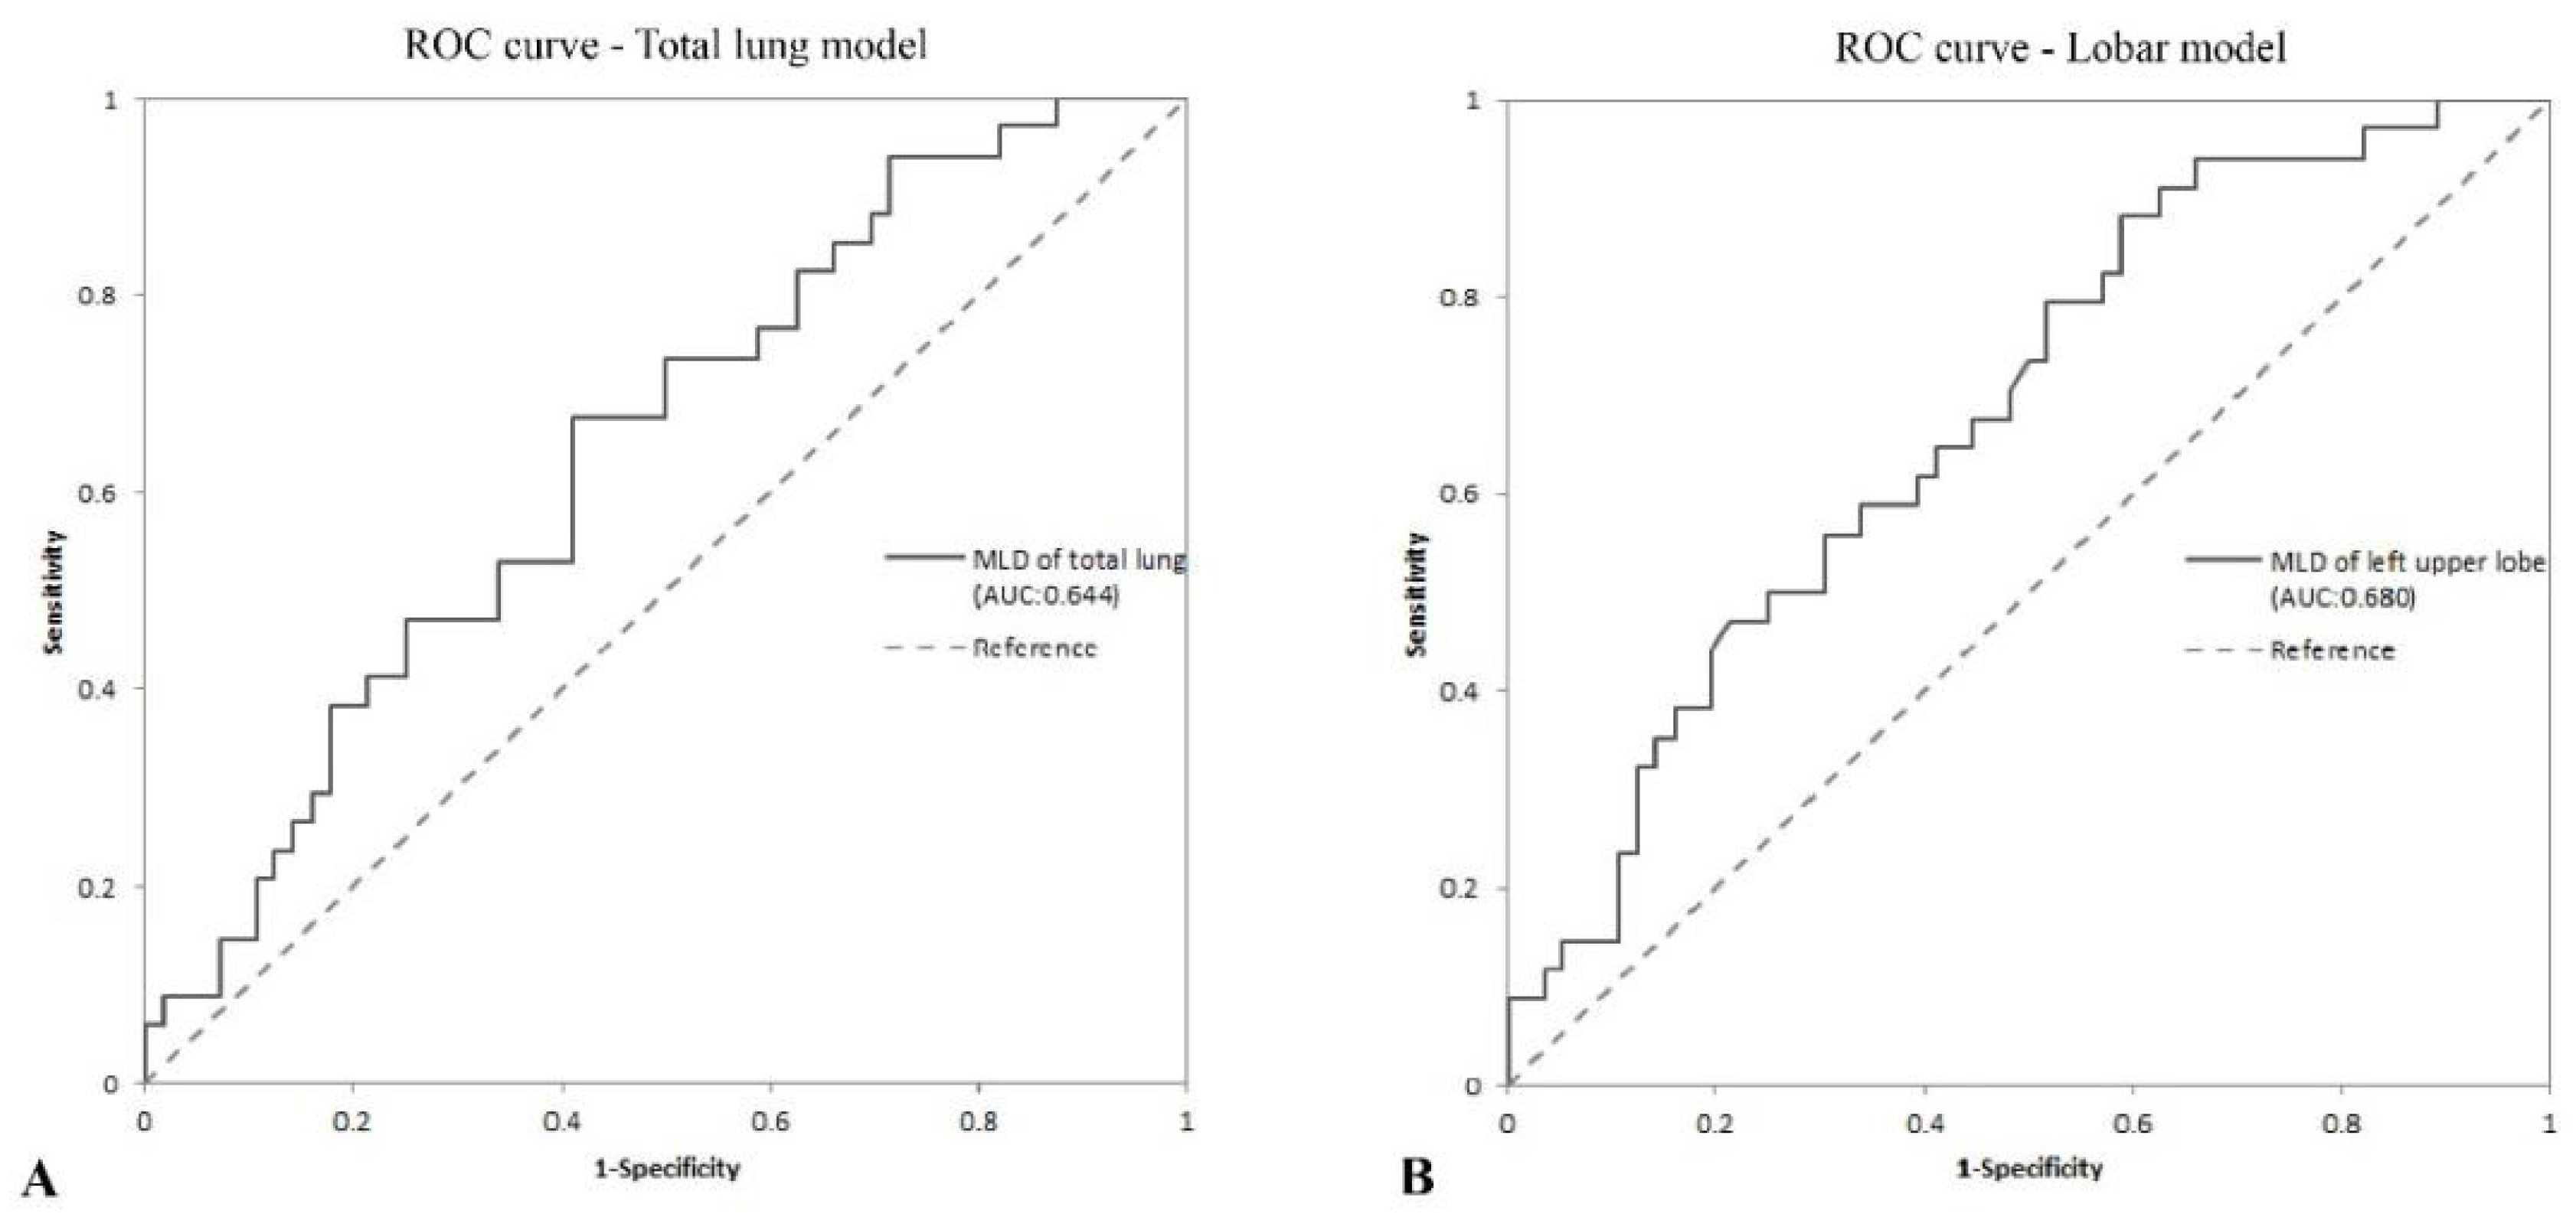
| AUC (95% CI) | p Value | Cut-Off | Sensitivity (%) | Specificity (%) | PPV (%) | NPV (%) | |
|---|---|---|---|---|---|---|---|
| Total lung model | |||||||
| MLDTL, HU | 0.644 (0.528, 0.760) | 0.007 * | −810.7 | 67.6 | 58.9 | 50 | 75 |
| Lobar model | |||||||
| MLDLUL, HU | 0.680 (0.568, 0.791) | <0.001 ** | −837.8 | 88.2 | 41.1 | 47.6 | 85.2 |
Publisher’s Note: MDPI stays neutral with regard to jurisdictional claims in published maps and institutional affiliations. |
© 2022 by the authors. Licensee MDPI, Basel, Switzerland. This article is an open access article distributed under the terms and conditions of the Creative Commons Attribution (CC BY) license (https://creativecommons.org/licenses/by/4.0/).
Share and Cite
Chen, L.; Wu, F.; Huang, J.; Yang, J.; Fan, W.; Nie, Z.; Jiang, H.; Wang, J.; Xia, W.; Yang, F. Well-Aerated Lung and Mean Lung Density Quantified by CT at Discharge to Predict Pulmonary Diffusion Function 5 Months after COVID-19. Diagnostics 2022, 12, 2921. https://doi.org/10.3390/diagnostics12122921
Chen L, Wu F, Huang J, Yang J, Fan W, Nie Z, Jiang H, Wang J, Xia W, Yang F. Well-Aerated Lung and Mean Lung Density Quantified by CT at Discharge to Predict Pulmonary Diffusion Function 5 Months after COVID-19. Diagnostics. 2022; 12(12):2921. https://doi.org/10.3390/diagnostics12122921
Chicago/Turabian StyleChen, Leqing, Feihong Wu, Jia Huang, Jinrong Yang, Wenliang Fan, Zhuang Nie, Hongwei Jiang, Jiazheng Wang, Wenfang Xia, and Fan Yang. 2022. "Well-Aerated Lung and Mean Lung Density Quantified by CT at Discharge to Predict Pulmonary Diffusion Function 5 Months after COVID-19" Diagnostics 12, no. 12: 2921. https://doi.org/10.3390/diagnostics12122921
APA StyleChen, L., Wu, F., Huang, J., Yang, J., Fan, W., Nie, Z., Jiang, H., Wang, J., Xia, W., & Yang, F. (2022). Well-Aerated Lung and Mean Lung Density Quantified by CT at Discharge to Predict Pulmonary Diffusion Function 5 Months after COVID-19. Diagnostics, 12(12), 2921. https://doi.org/10.3390/diagnostics12122921