
The Strengths and Obstacles in the Differential Diagnosis of Progressive Supranuclear Palsy—Parkinsonism Predominant (PSP-P) and Multiple System Atrophy (MSA) Using Magnetic Resonance Imaging (MRI) and Perfusion Single Photon Emission Computed Tomography (SPECT)

 , , , ,
Abstract
:1. Introduction
2. Materials
3. Methods
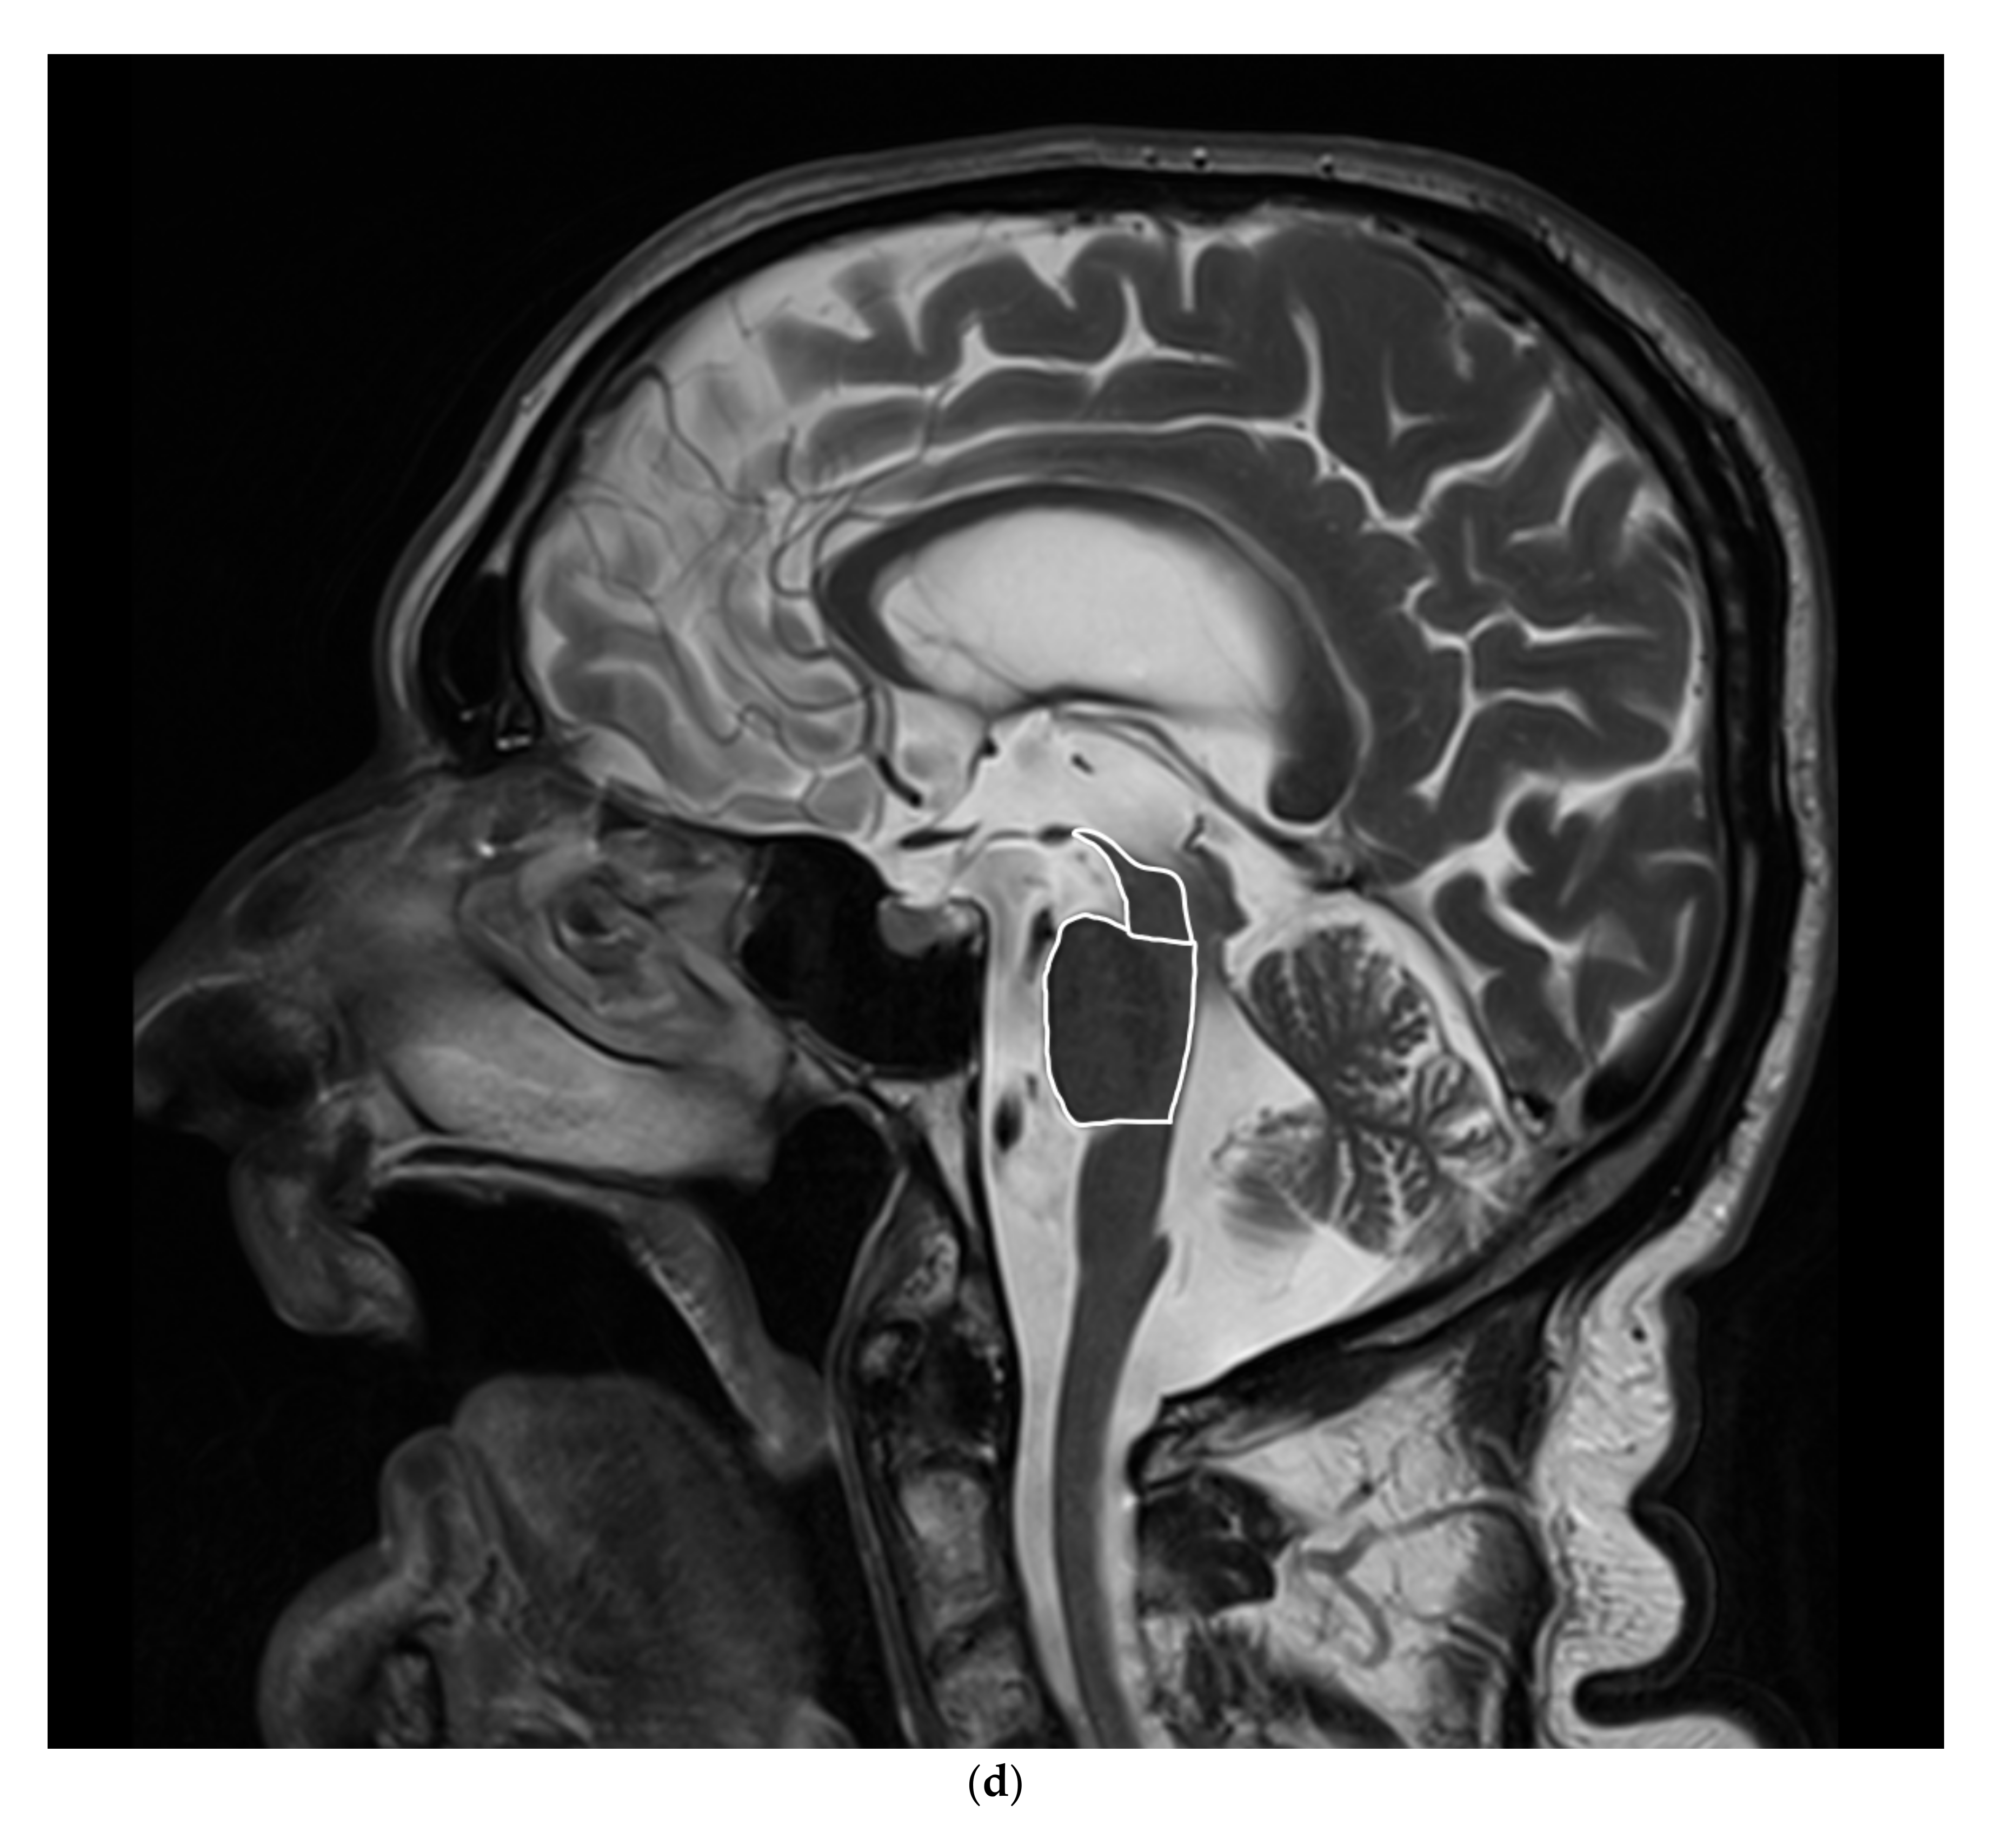
3.1. MRI
3.2. SPECT
3.3. Cognitive Screening
4. Statistical Analysis
5. Results
5.1. Subgroup Analysis
5.1.1. Psychological Tests: MMSE and MoCA
5.1.2. MRI
5.1.3. SPECT
6. Discussion
7. Conclusions
Supplementary Materials
Author Contributions
Funding
Institutional Review Board Statement
Informed Consent Statement
Data Availability Statement
Acknowledgments
Conflicts of Interest
References
- Höglinger, G.U.; Respondek, G.; Stamelou, M.; Kurz, C.; Josephs, K.A.; Lang, A.E.; Mollenhauer, B.; Müller, U.; Nilsson, C.; Whitwell, J.L.; et al. Clinical diagnosis of progressive supranuclear palsy: The movement disorder society criteria. Mov. Disord. 2017, 32, 853–864. [Google Scholar] [CrossRef] [PubMed]
- Gilman, S.; Wenning, G.K.; Low, P.A.; Brooks, D.J.; Mathias, C.J.; Trojanowski, J.Q.; Wood, N.W.; Colosimo, C.; Dürr, A.; Fowler, C.J.; et al. Second consensus statement on the diagnosis of multiple system atrophy. Neurology 2008, 71, 670–676. [Google Scholar] [CrossRef] [PubMed]
- Armstrong, M.J.; Litvan, I.; Lang, A.E.; Bak, T.H.; Bhatia, K.P.; Borroni, B.; Boxer, A.L.; Dickson, D.W.; Grossman, M.; Hallett, M.; et al. Criteria for the diagnosis of corticobasal degeneration. Neurology 2013, 80, 496–503. [Google Scholar] [CrossRef] [PubMed] [Green Version]
- Yamawaki, T. Diagnosis of MSA-P and PSP-P in Early Stage. Brain Nerve 2020, 72, 331–343. (In Japanese) [Google Scholar] [CrossRef] [PubMed]
- Alster, P.; Madetko, N.; Koziorowski, D.; Friedman, A. Progressive Supranuclear Palsy-Parkinsonism Predominant (PSP-P)-A Clinical Challenge at the Boundaries of PSP and Parkinson’s Disease (PD). Front. Neurol. 2020, 10, 180. [Google Scholar] [CrossRef]
- Quattrone, A.; Morelli, M.; Vescio, B.; Nigro, S.; Le Piane, E.; Sabatini, U.; Caracciolo, M.; Vescio, V.; Quattrone, A.; Barbagallo, G.; et al. Refining initial diagnosis of Parkinson’s disease after follow-up: A 4-year prospective clinical and magnetic resonance imaging study. Mov. Disord. 2019, 34, 487–495. [Google Scholar] [CrossRef] [Green Version]
- Quattrone, A.; Morelli, M.; Nigro, S.; Quattrone, A.; Vescio, B.; Arabia, G.; Nicoletti, G.; Nisticò, R.; Salsone, M.; Novellino, F.; et al. A new MR imaging index for differentia-tion of progressive supranuclear palsyparkinsonism from Parkinson’s disease. Parkinsonism Relat. Disord. 2018, 54, 3–8. [Google Scholar] [CrossRef]
- Hwang, M.; Yang, H.; Kim, Y.; Youn, J.; Park, J.; Huh, Y.E.; Kim, H.T.; Cho, J.W. Differential progression of midbrain atrophy in parkinsonism: Longitudinal MRI study. Neurodegener. Dis. 2017, 17, 31–37. [Google Scholar] [CrossRef]
- Longoni, G.; Agosta, F.; Kostić, V.S.; Stojković, T.; Pagani, E.; Stošić-Opinćal, T.; Filippi, M. MRI measurements of brainstem structures in patients with Richardson’s syndrome, progressive supranuclear palsy-parkinsonism, and Parkinson’s disease. Mov. Disord. 2011, 26, 247–255. [Google Scholar] [CrossRef]
- Quattrone, A.; Morelli, M.; Williams, D.R.; Vescio, B.; Arabia, G.; Nigro, S.; Nicoletti, G.; Salsone, M.; Novellino, F.; Nisticò, R.; et al. MR parkinsonism index predicts vertical supranuclear gaze palsy in patients with PSP–parkinsonism. Neurology 2016, 87, 1266–1273. [Google Scholar] [CrossRef] [Green Version]
- Quattrone, A.; Caligiuri, M.E.; Morelli, M.; Nigro, S.; Vescio, B.; Arabia, G.; Nicoletti, G.; Nisticò, R.; Salsone, M.; Novellino, F.; et al. Imaging counterpart of postural instability and vertical ocular dysfunction in patients with PSP: A multimodal MRI study. Parkinsonism Relat. Disord. 2019, 63, 124–130. [Google Scholar] [CrossRef] [PubMed]
- Alster, P.; Nieciecki, M.; Koziorowski, D.M.; Cacko, A.; Charzyńska, I.; Królicki, L.; Friedman, A. Thalamic and cerebellar hypoperfusion in single photon emission computed tomography may differentiate multiple system atrophy and progressive supranuclear palsy. Medicine 2019, 98, e16603. [Google Scholar] [CrossRef] [PubMed]
- Alster, P.; Nieciecki, M.; Koziorowski, D.M.; Cacko, A.; Charzyńska, I.; Królicki, L.; Friedman, A. Is brain perfusion a differentiating feature in the comparison of Progressive Supranuclear Palsy Syndrome (PSPS) and Corticobasal Syndrome (CBS)? J. Clin. Neurosci. 2020, 77, 123–127. [Google Scholar] [CrossRef] [PubMed]
- Takaya, S.; Sawamoto, N.; Okada, T.; Okubo, G.; Nishida, S.; Togashi, K.; Fukuyama, H.; Takahashi, R. Differential diagnosis of parkinsonian syndromes using dopamine transporter and perfusion SPECT. Parkinsonism Relat. Disord. 2018, 47, 15–21. [Google Scholar] [CrossRef] [PubMed]
- Whitwell, J.L.; Höglinger, G.U.; Antonini, A.; Bordelon, Y.; Boxer, A.L.; Colosimo, C.; van Eimeren, T.; Golbe, L.I.; Kassubek, J.; Kurz, C. Radio-logical biomarkers for diagnosis in PSP: Where are we and where do we need to be? Mov. Disord. 2017, 32, 955–971. [Google Scholar] [CrossRef]
- Alster, P.; Madetko, N.K.; Koziorowski, D.M.; Królicki, L.; Budrewicz, S.; Friedman, A. Accumulation of Tau Protein, Metabolism and Perfusion-Application and Efficacy of Positron Emission Tomography (PET) and Single Photon Emission Computed Tomography (SPECT) Imaging in the Examination of Progressive Supranuclear Palsy (PSP) and Corticobasal Syndrome (CBS). Front. Neurol. 2019, 14, 101. [Google Scholar]
- Song, M.; Beyer, L.; Kaiser, L.; Barthel, H.; van Eimeren, T.; Marek, K.; Nitschmann, A.; Scheifele, M.; Palleis, C.; Respondek, G.; et al. Binding characteristics of [18F]PI-2620 distinguish the clinically predicted tau iso-form in different tauopathies by PET. J. Cereb. Blood Flow Metab. 2021, 27, 271678X211018904. [Google Scholar]
- Nigro, S.; Antonini, A.; Vaillancourt, D.E.; Seppi, K.; Ceravolo, R.; Strafella, A.P.; Augimeri, A.; Quattrone, A.; Morelli, M.; Weis, L. Automated MRI Classification in Progressive Supranuclear Palsy: A Large International Cohort Study. Mov. Disord. 2020, 35, 976–983. [Google Scholar] [CrossRef]
- Nicoletti, G.; Fera, F.; Condino, F.; Auteri, W.; Gallo, O.; Pugliese, P.; Arabia, G.; Morgante, L.; Barone, P.; Zappia, M. MR imaging of middle cerebellar peduncle width: Differentiation of multiple system atrophy from Parkinson disease. Radiology 2006, 239, 825–830. [Google Scholar] [CrossRef]
- Quattrone, A.; Nicoletti, G.; Messina, D.; Fera, F.; Condino, F.; Pugliese, P.; Lanza, P.; Barone, P.; Morgante, L.; Zappia, M.; et al. MR imaging index for differentiation of progressive supranuclear palsy from Parkinson disease and the Parkinson variant of multiple system atrophy. Radiology 2008, 246, 214–221. [Google Scholar] [CrossRef]
- Despotović, I.; Goossens, B.; Philips, W. MRI segmentation of the human brain: Challenges, methods, and applications. Comput. Math. Methods Med. 2015, 2015, 450341. [Google Scholar] [CrossRef] [PubMed] [Green Version]
- Helms, G. Segmentation of human brain using structural MRI. Magn. Reson. Mater. Phys. Biol. Med. 2016, 29, 111–124. [Google Scholar] [CrossRef] [PubMed]
- Quattrone, A.; Antonini, A.; Vaillancourt, D.E.; Seppi, K.; Ceravolo, R.; Strafella, A.P.; Morelli, M.; Nigro, S.; Vescio, B.; Bianco, M.G.; et al. A New MRI Measure to Early Differentiate Progressive Supranuclear Palsy From De Novo Parkinson’s Disease in Clinical Practice: An International Study. Mov. Disord. 2021, 36, 681–689. [Google Scholar] [CrossRef] [PubMed]
- Oba, H.; Yagishita, A.; Terada, H.; Barkovich, A.J.; Kutomi, K.; Yamauchi, T.; Furui, S.; Shimizu, T.; Uchigata, M.; Matsumura, K. New and reliable MRI diagnosis for progressive supranuclear palsy. Neurology 2005, 28, 2050–2055. [Google Scholar] [CrossRef] [PubMed]
- Alster, P.; Migda, B.; Madetko, N.; Duszyńska-Wąs, K.; Drzewińska, A.; Charzyńska, I.; Starczyński, M.; Szepelska, A.; Królicki, L.; Friedman, A. The role of frontal assessment battery and frontal lobe single-photon emission computed tomography in the differential diagnosis of progressive supranuclear palsy variants and corticobasal syn-drome-a pilot study. Front. Neurol. 2021, 4, 630153. [Google Scholar] [CrossRef]
- Hoops, S.; Nazem, S.; Siderowf, A.D.; Duda, J.E.; Xie, S.X.; Stern, M.B.; Weintraub, D. Validity of the MoCA and MMSE in the detection of MCI and dementia in Parkinson disease. Neurology 2009, 73, 1738–1745. [Google Scholar] [CrossRef]
- Fiorenzato, E.; Weis, L.; Falup-Pecurariu, C.; Diaconu, S.; Siri, C.; Reali, E.; Pezzoli, G.; Bisiacchi, P.; Antonini, A.; Biundo, R. Montreal Cognitive Assessment (MoCA) and Mini-Mental State Examination (MMSE) performance in progressive supranuclear palsy and multiple system atrophy. J. Neural Transm. 2016, 123, 1435–1442. [Google Scholar] [CrossRef]
- Dalrymple-Alford, J.C.; MacAskill, M.R.; Nakas, C.T.; Livingston, L.; Graham, C.; Crucian, G.P.; Melzer, T.R.; Kirwan, J.; Keenan, R.; Wells, S.; et al. The MoCA: Well-suited screen for cognitive impairment in Parkinson disease. Neurology 2010, 9, 1717–1725. [Google Scholar] [CrossRef]
- Jecmenica-Lukic, M.; Petrovic, I.N.; Pekmezovic, T.; Kostic, V.S. Clinical outcomes of two main variants of progressive supranuclear palsy and multiple system atrophy: A prospective natural history study. J. Neurol. 2014, 261, 1575–1583. [Google Scholar] [CrossRef]


| Parameter | Whole Group | PSP-P (N = 16) | MSA-P (N = 20) | |||
|---|---|---|---|---|---|---|
| Mean (Min-Max) | SD ± 95% CI | Mean (Min-Max) | SD ± 95% CI | Mean (Min-Max) | SD ± 95% CI | |
| Age | 66.53 (50–81) | 9.21 ± 7.47–12.02 | 71.44 (61–81) | 6.88 ± 5.08–10.65 | 62.6 (50–81) | 9.08 ± 6.91–13.26 |
| Psychological tests: | ||||||
| MMSE | 27.82 (21–30) | 2.32 ± 1.79–3.32 | 28.6 (26–30) | 1.26 ± 0.87–2.31 | 27.17 (21–30) | 2.82 ± 2–4.79 |
| MoCA | 23.4 (16–29) | 3.64 ± 2.67–5.74 | 21.6 (20–24) | 1.52 ± 0.91–4.36 | 24.3 (16–29) | 4.11 ± 2.83–7.51 |
| MRI Parameters: | ||||||
| III ventricle (mm) | 10.09 (6–16) | 2.62 ± 2.11–3.45 | 11.14 (6–16) | 2.48 ± 1.8–3.99 | 9.35 (6–14) | 2.52 ± 1.92–3.68 |
| Pons (cm2) | 4.72 (3.05–5.79) | 0.56 ± 0.45–0.75 | 4.79 (3.75–5.79) | 0.61 ± 0.44–1.01 | 4.68 (3.05–5.55) | 0.54 ± 0.41–0.79 |
| Midbrain (cm2) | 0.96 (0.57–1.5) | 0.23 ± 0.18–0.3 | 0.76 (0.57–1.03) | 0.12 ± 0.09–0.21 | 1.08 (0.76–1.5) | 0.19 ± 0.15–0.28 |
| M/P ratio | 0.21 (0.13–0.34) | 0.05 ± 0.04–0.07 | 0.16 (0.13–0.2) | 0.02 ± 0.01–0.03 | 0.23 (0.16–0.34) | 0.05 ± 0.04–0.07 |
| MCP width (mm) | 7.57 (5.3–9.3) | 1.04 ± 0.84–1.37 | 8.15 (6.8–9.3) | 0.76 ± 0.55–1.22 | 7.16 (5.3–8.9) | 1.03 ± 0.78–1.5 |
| SCP width (mm) | 2.95 (1.5–3.7) | 0.48 ± 0.39–0.63 | 2.84 (1.5–3.5) | 0.58 ± 0.42–0.93 | 3.03 (2.4–3.7) | 0.4 ± 0.3–0.58 |
| MRPI | 13.81 (6.33–33.43) | 5.75 ± 4.62–7.61 | 18.75 (12.02–33.43) | 5.81 ± 4.17–9.6 | 10.6 (6.33–17.15) | 2.61 ± 1.99–3.81 |
| SPECT parameters: | ||||||
| Amygdala L | −0.65 (−3.3–3.1) | 1.84 ± 1.49–2.39 | −0.85 (−3.3–3.1) | 1.69 ± 1.25–2.62 | −0.49 (−3.3–2.8) | 1.97 ± 1.5–2.88 |
| Amygdala R | −0.75 (−3.4–4.1) | 1.41 ± 1.14–1.84 | −0.77 (−2.5–1.3) | 1.14 ± 0.84–1.76 | −0.74 (−3.4–4.1) | 1.62 ± 1.23–2.37 |
| Basal Ganglia L | −1.97 (−7.4–1.5) | 1.95 ± 1.58–2.54 | −1.89 (−5.3–1) | 1.87 ± 1.38–2.9 | −2.03 (−7.4–1.5) | 2.05 ± 1.56–3 |
| Basal Ganglia R | −1.62 (−5.3–2.1) | 1.58 ± 1.28–2.06 | −1.82 (−5.3–1) | 1.54 ± 1.14–2.38 | −1.46 (−4.5–2.1) | 1.64 ± 1.24–2.39 |
| Brainstem | −2.86 (−7–1.6) | 2 ± 1.61–2.66 | −3.04 (−7–0.4) | 2.23 ± 1.62–3.59 | −2.73 (−4.8–1.6) | 1.86 ± 1.4–2.8 |
| Cerebellum L | −2.13 (−10.4–1.4) | 2.72 ± 2.21–3.55 | −1.19 (−5.4–1.4) | 1.92 ± 1.42–2.98 | −2.89 (−10.4–1.1) | 3.06 ± 2.33–4.47 |
| Cerebellum R | −1.64 (−9.5–2.1) | 2.79 ± 2.26–3.64 | −1.27 (−5.3–1.1) | 2.16 ± 1.59–3.34 | −1.95 (−9.5–2.1) | 3.23 ± 2.46–4.72 |
| Frontal Lobe L | −0.09 (−4.8–3.4) | 2.02 ± 1.63–2.65 | −1.05 (−4.8–3.4) | 2.39 ± 1.75–3.77 | 0.64 (−2.8–2.6) | 1.34 ± 1.02–1.96 |
| Frontal Lobe R | −0.14 (−4.6–3.1) | 2.26 ± 1.83–2.97 | −1.5 (−4.6–3.1) | 2.36 ± 1.73–3.72 | 0.88 (−3.6–2.7) | 1.59 ± 1.21–2.32 |
| Hippocampus L | −1.78 (−4.8–1.4) | 1.68 ± 1.36–2.19 | −1.67 (−4.2–0.9) | 1.44 ± 1.06–2.22 | −1.88 (−4.8–1.4) | 1.88 ± 1.43–2.74 |
| Hippocampus R | −1.38 (−4.8–3) | 1.78 ± 1.44–2.32 | −1.26 (−4.8–1.7) | 1.82 ± 1.34–2.81 | −1.48 (−3.6–3) | 1.79 ± 1.36–2.62 |
| Insula L | −2.39 (−8.6–4) | 2.95 ± 2.39–3.85 | −2.45 (−7.1–4) | 2.81 ± 2.08–4.35 | −2.35 (−8.6–3.5) | 3.13 ± 2.38–4.57 |
| Insula R | −0.92 (−5.2–5.4) | 2.27 ± 1.84–2.97 | −1.01 (−3.2–5.4) | 1.99 ± 1.47–3.08 | −0.85 (−5.2–4.4) | 2.53 ± 1.92–3.69 |
| Pons | −2.73 (−5–−0.3) | 1.34 ± 1.07–1.78 | −2.79 (−5–−0.3) | 1.45 ± 1.05–2.34 | −2.68 (−4.9–−0.5) | 1.28 ± 0.96–1.92 |
| Temporal L | 0.38 (−3.3–3.5) | 1.65 ± 1.33–2.16 | 0.2 (−3.2–3.5) | 1.46 ± 1.08–2.26 | 0.53 (−3.3–3.2) | 1.82 ± 1.37–2.68 |
| Temporal R | 1.5 (−2.7–4.5) | 1.63 ± 1.32–2.12 | 1.26 (−0.3–4) | 1.21 ± 0.89–1.87 | 1.69 (−2.7–4.5) | 1.91 ± 1.45–2.79 |
| Thalamus L | −3.28 (−7–0.6) | 1.8 ± 1.46–2.35 | −3.71 (−7–−1.1) | 2.08 ± 1.54–3.22 | −2.94 (−5.3–0.6) | 1.52 ± 1.15–2.22 |
| Thalamus R | −3.36 (−7.6–1.5) | 1.81 ± 1.47–2.36 | −4.08 (−7.6–−1.7) | 1.87 ± 1.38–2.9 | −2.79 (−6.4–1.5) | 1.58 ± 1.2–2.3 |
| Whole Brain | −1.73 (−4.9–1.5) | 1.63 ± 1.31–2.18 | −2.13 (−4.9–1.5) | 1.96 ± 1.42–3.15 | −1.39 (−3–1.4) | 1.28 ± 0.95–1.95 |
| Parameter | p |
|---|---|
| Psychological tests: | |
| MMSE | 0.154 |
| MoCA | 0.1851 |
| MRI Parameters: | |
| III ventricle (mm) | 0.0480 |
| Pons (cm2) | 0.5947 |
| Midbrain (cm2) | 0.0000 |
| M/P ratio | 0.0000 |
| MCP width (mm) | 0.0045 |
| SCP width (mm) | 0.2823 |
| MRPI | 0.0000 |
| SPECT parameters: | |
| Amygdala L | 0.5663 |
| Amygdala R | 0.9525 |
| Basal Ganglia L | 0.831 |
| Basal Ganglia R | 0.5065 |
| Brainstem | 0.6735 |
| Cerebellum L | 0.061 |
| Cerebellum R | 0.4776 |
| Frontal Lobe L | 0.0121 |
| Frontal Lobe R | 0.0012 |
| Hippocampus L | 0.7195 |
| Hippocampus R | 0.7274 |
| Insula L | 0.9173 |
| Insula R | 0.8349 |
| Pons | 0.8253 |
| Temporal L | 0.5673 |
| Temporal R | 0.4347 |
| Thalamus L | 0.2061 |
| Thalamus R | 0.0314 |
| Whole Brain | 0.2186 |
Publisher’s Note: MDPI stays neutral with regard to jurisdictional claims in published maps and institutional affiliations. |
© 2022 by the authors. Licensee MDPI, Basel, Switzerland. This article is an open access article distributed under the terms and conditions of the Creative Commons Attribution (CC BY) license (https://creativecommons.org/licenses/by/4.0/).
Share and Cite
Alster, P.; Nieciecki, M.; Migda, B.; Kutyłowski, M.; Madetko, N.; Duszyńska-Wąs, K.; Charzyńska, I.; Koziorowski, D.; Królicki, L.; Friedman, A. The Strengths and Obstacles in the Differential Diagnosis of Progressive Supranuclear Palsy—Parkinsonism Predominant (PSP-P) and Multiple System Atrophy (MSA) Using Magnetic Resonance Imaging (MRI) and Perfusion Single Photon Emission Computed Tomography (SPECT). Diagnostics 2022, 12, 385. https://doi.org/10.3390/diagnostics12020385
Alster P, Nieciecki M, Migda B, Kutyłowski M, Madetko N, Duszyńska-Wąs K, Charzyńska I, Koziorowski D, Królicki L, Friedman A. The Strengths and Obstacles in the Differential Diagnosis of Progressive Supranuclear Palsy—Parkinsonism Predominant (PSP-P) and Multiple System Atrophy (MSA) Using Magnetic Resonance Imaging (MRI) and Perfusion Single Photon Emission Computed Tomography (SPECT). Diagnostics. 2022; 12(2):385. https://doi.org/10.3390/diagnostics12020385
Chicago/Turabian StyleAlster, Piotr, Michał Nieciecki, Bartosz Migda, Michał Kutyłowski, Natalia Madetko, Karolina Duszyńska-Wąs, Ingeborga Charzyńska, Dariusz Koziorowski, Leszek Królicki, and Andrzej Friedman. 2022. "The Strengths and Obstacles in the Differential Diagnosis of Progressive Supranuclear Palsy—Parkinsonism Predominant (PSP-P) and Multiple System Atrophy (MSA) Using Magnetic Resonance Imaging (MRI) and Perfusion Single Photon Emission Computed Tomography (SPECT)" Diagnostics 12, no. 2: 385. https://doi.org/10.3390/diagnostics12020385