Automatic Detection of Age-Related Macular Degeneration Based on Deep Learning and Local Outlier Factor Algorithm
Abstract
:1. Introduction
2. Related Work
3. Method
3.1. ResNet-50
3.2. LOF Algorithm
4. Experiment
4.1. Datasets
4.2. Model Training
5. Results and Discussion
5.1. Performance Evaluation
5.2. Results
5.2.1. UCSD Dataset
5.2.2. Duke Dataset
6. Conclusions
Author Contributions
Funding
Institutional Review Board Statement
Informed Consent Statement
Data Availability Statement
Acknowledgments
Conflicts of Interest
References
- GBD 2017 Disease and Injury Incidence and Prevalence Collaborators. Global, regional, and national incidence, prevalence, and years lived with disability for 354 diseases and injuries for 195 countries and territories, 1990–2017: A systematic analysis for the Global Burden of Disease Study 2017. Lancet 2018, 392, 1789–1858. [Google Scholar] [CrossRef] [Green Version]
- Heesterbeek, T.J.; Lorés-Motta, L.; Hoyng, C.B.; Lechanteur, Y.; den Hollander, A.I. Risk factors for progression of age-related macular degeneration. Ophthalmic Physiol. Opt. 2020, 40, 140–170. [Google Scholar] [CrossRef] [PubMed] [Green Version]
- Wong, W.L.; Su, X.; Li, X.; Cheung, C.M.; Klein, R.; Cheng, C.Y.; Wong, T.Y. Global prevalence of age-related macular degeneration and disease burden projection for 2020 and 2040: A systematic review and meta-analysis. Lancet Glob. Health 2014, 2, 106–116. [Google Scholar] [CrossRef] [Green Version]
- Schultz, N.M.; Bhardwaj, S.; Barclay, C.; Gaspar, L.; Schwartz, J. Global Burden of Dry Age-Related Macular Degeneration: A Targeted Literature Review. Clin. Ther. 2021, 43, 1792–1818. [Google Scholar] [CrossRef] [PubMed]
- Stahl, A. The Diagnosis and Treatment of Age-Related Macular Degeneration. Dtsch. Arztebl. Int. 2020, 117, 513–520. [Google Scholar] [CrossRef] [PubMed]
- Davis, M.D.; Gangnon, R.E.; Lee, L.Y.; Hubbard, L.D.; Klein, B.E.; Klein, R.; Ferris, F.L.; Bressler, S.B.; Milton, R.C. The Age-Related Eye Disease Study severity scale for age-related macular degeneration: AREDS Report No. 17. Arch. Ophthalmol. 2005, 123, 1484–1498. [Google Scholar] [CrossRef] [Green Version]
- Gheorghe, A.; Mahdi, L.; Musat, O. Age-related macular degeneration. Rom. J. Ophthalmol. 2015, 59, 74–77. [Google Scholar]
- Mitchell, P.; Liew, G.; Gopinath, B.; Wong, T.Y. Age-related macular degeneration. Lancet 2018, 392, 1147–1159. [Google Scholar] [CrossRef]
- Huang, D.; Swanson, E.A.; Lin, C.P.; Schuman, J.S.; Stinson, W.G.; Chang, W.; Hee, M.R.; Flotte, T.; Gregory, K.; Puliafito, C.A. Optical coherence tomography. Science 1991, 254, 1178–1181. [Google Scholar] [CrossRef] [Green Version]
- Swanson, E.A.; Izatt, J.A.; Hee, M.R.; Huang, D.; Lin, C.P.; Schuman, J.S.; Puliafito, C.A.; Fujimoto, J.G. In vivo retinal imaging by optical coherence tomography. Opt. Lett. 1993, 18, 1864–1866. [Google Scholar] [CrossRef]
- Balasubramani, V.; Kujawińska, M.; Allier, C.; Anand, V.; Cheng, C.J.; Depeursinge, C.; Hai, N.; Juodkazis, S.; Kalkman, J.; Kuś, A.; et al. Roadmap on Digital Holography-Based Quantitative Phase Imaging. J. Imaging 2021, 7, 252. [Google Scholar] [CrossRef] [PubMed]
- Rosen, J.; Alford, S.; Anand, V.; Art, J.; Bouchal, P.; Bouchal, Z.; Erdenebat, M.U.; Huang, L.; Ishii, A.; Juodkazis, S.; et al. Roadmap on Recent Progress in FINCH Technology. J. Imaging 2021, 7, 197. [Google Scholar] [CrossRef] [PubMed]
- Puliafito, C.A.; Hee, M.R.; Lin, C.P.; Reichel, E.; Schuman, J.S.; Duker, J.S.; Izatt, J.A.; Swanson, E.A.; Fujimoto, J.G. Imaging of macular diseases with optical coherence tomography. Ophthalmology 1995, 102, 217–229. [Google Scholar] [CrossRef]
- Araveti, S.K.; Hiraishi, N.; Kominami, N.; Otsuki, M.; Sumi, Y.; Yiu, C.; Tagami, J. Swept-source optical coherence tomographic observation on prevalence and variations of cemento-enamel junction morphology. Lasers Med. Sci. 2020, 35, 213–219. [Google Scholar] [CrossRef]
- Yow, A.P.; Srivastava, R.; Cheng, J.; Li, A.; Liu, J.; Schmetterer, L.; Tey, H.L.; Wong, D. Techniques and Applications in Skin OCT Analysis. Adv. Exp. Med. Biol. 2020, 1213, 149–163. [Google Scholar] [CrossRef]
- Wang, J.; Paritala, P.K.; Mendieta, J.B.; Komori, Y.; Raffel, O.C.; Gu, Y.; Li, Z. Optical coherence tomography-based patient-specific coronary artery reconstruction and fluid-structure interaction simulation. Biomech. Modeling Mechanobiol. 2020, 19, 7–20. [Google Scholar] [CrossRef]
- Wong, P.W.; Guo, J.; Khanzada, N.K.; Yim, V.; Kyoungjin, A. In-situ 3D fouling visualization of membrane distillation treating industrial textile wastewater by optical coherence tomography imaging. Water Res. 2021, 205, 117668. [Google Scholar] [CrossRef]
- Larimer, C.J.; Denis, E.H.; Suter, J.D.; Moran, J.J. Optical coherence tomography imaging of plant root growth in soil. Appl. Opt. 2020, 59, 2474–2481. [Google Scholar] [CrossRef]
- Elsharkawy, M.; Elrazzaz, M.; Ghazal, M.; Alhalabi, M.; Soliman, A.; Mahmoud, A.; El-Daydamony, E.; Atwan, A.; Thanos, A.; Sandhu, H.S.; et al. Role of Optical Coherence Tomography Imaging in Predicting Progression of Age-Related Macular Disease: A Survey. Diagnostics 2021, 11, 2313. [Google Scholar] [CrossRef]
- Costa, R.A.; Skaf, M.; Melo, L.A., Jr.; Calucci, D.; Cardillo, J.A.; Castro, J.C.; Huang, D.; Wojtkowski, M. Retinal assessment using optical coherence tomography. Prog. Retin. Eye Res. 2006, 25, 325–353. [Google Scholar] [CrossRef]
- van Velthoven, M.E.; Faber, D.J.; Verbraak, F.D.; van Leeuwen, T.G.; de Smet, M.D. Recent developments in optical coherence tomography for imaging the retina. Prog. Retin. Eye Res. 2007, 26, 57–77. [Google Scholar] [CrossRef] [PubMed]
- Regatieri, C.V.; Branchini, L.; Duker, J.S. The role of spectral-domain OCT in the diagnosis and management of neovascular age-related macular degeneration. Ophthalmic Surg. Lasers Imaging 2011, 42, 56–66. [Google Scholar] [CrossRef] [PubMed] [Green Version]
- Farsiu, S.; Chiu, S.J.; O’Connell, R.V.; Folgar, F.A.; Yuan, E.; Izatt, J.A.; Toth, C.A.; Age-Related Eye Disease Study 2 Ancillary Spectral Domain Optical Coherence Tomography Study Group. Quantitative classification of eyes with and without intermediate age-related macular degeneration using optical coherence tomography. Ophthalmology 2014, 121, 162–172. [Google Scholar] [CrossRef] [PubMed] [Green Version]
- Naz, A.; Ahmed, A.; Akram, M.U.; Khan, S.A. Automated segmentation of RPE layer for the detection of age macular degeneration using OCT images. In Proceedings of the 2016 Sixth International Conference on Image Processing Theory, Tools and Applications, Oulu, Finland, 12–15 December 2016. [Google Scholar] [CrossRef]
- Arabi, P.M.; Krishna, N.; Ashwini, V.; Prathibha, H.M. Identification of Age-Related Macular Degeneration Using OCT Images. Int. Conf. Adv. Mater. Manuf. Appl. 2018, 310, 012096. [Google Scholar] [CrossRef]
- Thomas, A.; Sunija, A.P.; Manoj, R.; Ramachandran, R.; Ramachandran, S.; Varun, P.G.; Palanisamy, P. RPE layer detection and baseline estimation using statistical methods and randomization for classification of AMD from retinal OCT. Comput. Methods Programs Biomed. 2021, 200, 105822. [Google Scholar] [CrossRef]
- Sharif, M.M.; Akram, M.U.; Malik, A.W. Extraction and Analysis of RPE layer from OCT Images for Detection of Age Related Macular Degeneration. In Proceedings of the 2018 IEEE 20th International Conference on e-Health Networking, Applications and Services (Healthcom), Ostrava, Czech Republic, 17–20 September 2018. [Google Scholar] [CrossRef]
- Gu, J.; Wang, Z.; Kuen, J.; Ma, L.; Shahroudy, A.; Shuai, B.; Liu, T.; Wang, X.; Wang, G.; Cai, J.; et al. Recent advances in convolutional neural networks. Pattern Recognit. 2018, 77, 354–377. [Google Scholar] [CrossRef] [Green Version]
- Lee, C.S.; Baughman, D.M.; Lee, A.Y. Deep learning is effective for the classification of OCT images of normal versus Age-related Macular Degeneration. Ophthalmol. Retin. 2017, 1, 322–327. [Google Scholar] [CrossRef]
- Serener, A.; Serte, S. Dry and Wet Age-Related Macular Degeneration Classification Using OCT Images and Deep Learning. In Proceedings of the 2019 Scientific Meeting on Electrical-Electronics & Biomedical Engineering and Computer Science (EBBT), Istanbul, Turkey, 24–26 April 2019. [Google Scholar] [CrossRef]
- Thomas, A.; Harikrishnan, P.M.; Ramachandran, R.; Ramachandran, S.; Manoj, R.; Palanisamy, P.; Gopi, V.P. A novel multiscale and multipath convolutional neural network based age-related macular degeneration detection using OCT images. Comput. Methods Programs Biomed. 2021, 209, 106294. [Google Scholar] [CrossRef]
- Thomas, A.; Harikrishnan, P.M.; Krishna, A.K.; Palanisamy, P.; Gopi, V.P. A novel multiscale convolutional neural network based age-related macular degeneration detection using OCT images. Biomed. Signal Process. Control 2021, 67, 102538. [Google Scholar] [CrossRef]
- Yoo, T.K.; Choi, J.Y.; Seo, J.G.; Ramasubramanian, B.; Selvaperumal, S.; Kim, D.W. The possibility of the combination of OCT and fundus images for improving the diagnostic accuracy of deep learning for age-related macular degeneration: A preliminary experiment. Med. Biol. Eng. Comput. 2019, 57, 677–687. [Google Scholar] [CrossRef]
- Kadry, S.; Rajinikanth, V.; González Crespo, R.; Verdú, E. Automated detection of age-related macular degeneration using a pre-trained deep-learning scheme. J. Supercomput. 2021. [Google Scholar] [CrossRef]
- He, K.; Zhang, X.; Ren, S.; Sun, J. Deep residual learning for image recognition. In Proceedings of the 2016 IEEE Conference on Computer Vision and Pattern Recognition (CVPR), Las Vegas, NV, USA, 26 June–1 July 2016; pp. 770–778. [Google Scholar] [CrossRef] [Green Version]
- Lu, J.; Behbood, V.; Hao, P.; Zuo, H.; Xue, S.; Zhang, G. Transfer learning using computational intelligence: A survey. Knowl.-Based Syst. 2015, 80, 14–23. [Google Scholar] [CrossRef]
- Breunig, M.M.; Kriegel, H.; Ng, R.T.; Sander, J. LOF: Identifying density-based local outliers. ACM SIGMOD Rec. 2000, 29, 93–104. [Google Scholar] [CrossRef]
- Baltruschat, I.M.; Nickisch, H.; Grass, M.; Knopp, T.; Saalbach, A. Comparison of Deep Learning Approaches for Multi-Label Chest X-Ray Classification. Sci. Rep. 2019, 9, 6381. [Google Scholar] [CrossRef] [Green Version]
- Serte, S.; Demirel, H. Deep learning for diagnosis of COVID-19 using 3D CT scans. Comput. Biol. Med. 2021, 132, 104306. [Google Scholar] [CrossRef]
- Khojasteh, P.; Passos Júnior, L.A.; Carvalho, T.; Rezende, E.; Aliahmad, B.; Papa, J.P.; Kumar, D.K. Exudate detection in fundus images using deeply-learnable features. Comput. Biol. Med. 2019, 104, 62–69. [Google Scholar] [CrossRef]
- Ranjan, R.; Castillo, C.D.; Chellappa, R. L2-constrained Softmax Loss for Discriminative Face Verification. arXiv 2017, arXiv:1703.09507. [Google Scholar]
- Kermany, D.S.; Goldbaum, M.; Cai, W.; Valentim, C.; Liang, H.; Baxter, S.L.; McKeown, A.; Yang, G.; Wu, X.; Yan, F.; et al. Identifying Medical Diagnoses and Treatable Diseases by Image-Based Deep Learning. Cell 2018, 172, 1122–1131. [Google Scholar] [CrossRef]
- Srinivasan, P.P.; Kim, L.A.; Mettu, P.S.; Cousins, S.W.; Comer, G.M.; Izatt, J.A.; Farsiu, S. Fully automated detection of diabetic macular edema and dry age-related macular degeneration from optical coherence tomography images. Biomed. Opt. Express 2014, 5, 3568–3577. [Google Scholar] [CrossRef] [Green Version]
- Das, V.; Dandapat, S.; Bora, P.K. Multi-scale deep feature fusion for automated classification of macular pathologies from OCT images. Biomed. Signal Process. Control 2019, 54, 101605. [Google Scholar] [CrossRef]
- Kaymak, S.; Serener, A. Automated Age-Related Macular Degeneration and Diabetic Macular Edema Detection on OCT Images using Deep Learning. In Proceedings of the 2018 IEEE 14th International Conference on Intelligent Computer Communication and Processing (ICCP), Cluj-Napoca, Romania, 6–8 September 2018; pp. 265–269. [Google Scholar] [CrossRef]
- Fang, L.; Jin, Y.; Huang, L.; Guo, S.; Zhao, G.; Chen, X. Iterative fusion convolutional neural networks for classification of optical coherence tomography images. J. Vis. Commun. Image Represent. 2019, 59, 327–333. [Google Scholar] [CrossRef]
- Khalid, S.; Akram, M.U.; Jameel, A.; Khalil, T. Automated Detection of Drusens to Diagnose Age Related Macular Degeneration Using OCT Images. IJCSIS 2016, 14. Available online: https://www.researchgate.net/publication/310799504_Automated_Detection_of_Drusens_to_Diagnose_Age_Related_Macular_Degeneration_Using_OCT_Images (accessed on 19 January 2022).
- Hussain, M.A.; Bhuiyan, A.; Luu, C.D.; Theodore Smith, R.; Guymer, R.H.; Ishikawa, H.; Schuman, J.S.; Ramamohanarao, K. Classification of healthy and diseased retina using SD-OCT imaging and Random Forest algorithm. PLoS ONE 2018, 13, 0198281. [Google Scholar] [CrossRef] [PubMed]
- Wang, Y.; Zhang, Y.; Yao, Z.; Zhao, R.; Zhou, F. Machine learning based detection of age-related macular degeneration (AMD) and diabetic macular edema (DME) from optical coherence tomography (OCT) images. Biomed. Opt. Express 2016, 7, 4928–4940. [Google Scholar] [CrossRef] [PubMed] [Green Version]
- Meng, T.; Wu, C.; Jia, T.; Jiang, Y.; Jia, Z. Recombined Convolutional Neural Network for Recognition of Macular Disorders in SD-OCT Images. In Proceedings of the 2018 37th Chinese Control Conference (CCC), Wuhan, China, 25–27 July 2018; pp. 9362–9367. [Google Scholar] [CrossRef]
- Sun, Y.; Li, S.; Sun, Z. Fully automated macular pathology detection in retina optical coherence tomography images using sparse coding and dictionary learning. J. Biomed. Opt. 2017, 22, 16012. [Google Scholar] [CrossRef] [Green Version]



| UCSD Dataset | AMD | NORMAL | TOTAL |
|---|---|---|---|
| Training set (80%) | 36,656 | 40,912 | 77,568 |
| Validation set (20%) | 9165 | 10,228 | 19,393 |
| True Label | Predict Label | |
|---|---|---|
| AMD | NORMAL | |
| AMD | True Positive (TP) | False Negative (FN) |
| NORMAL | False Positive (FP) | True Negative (TN) |
| Class | Accuracy % | Sensitivity % | Precision % | F1-Score % | AUC |
|---|---|---|---|---|---|
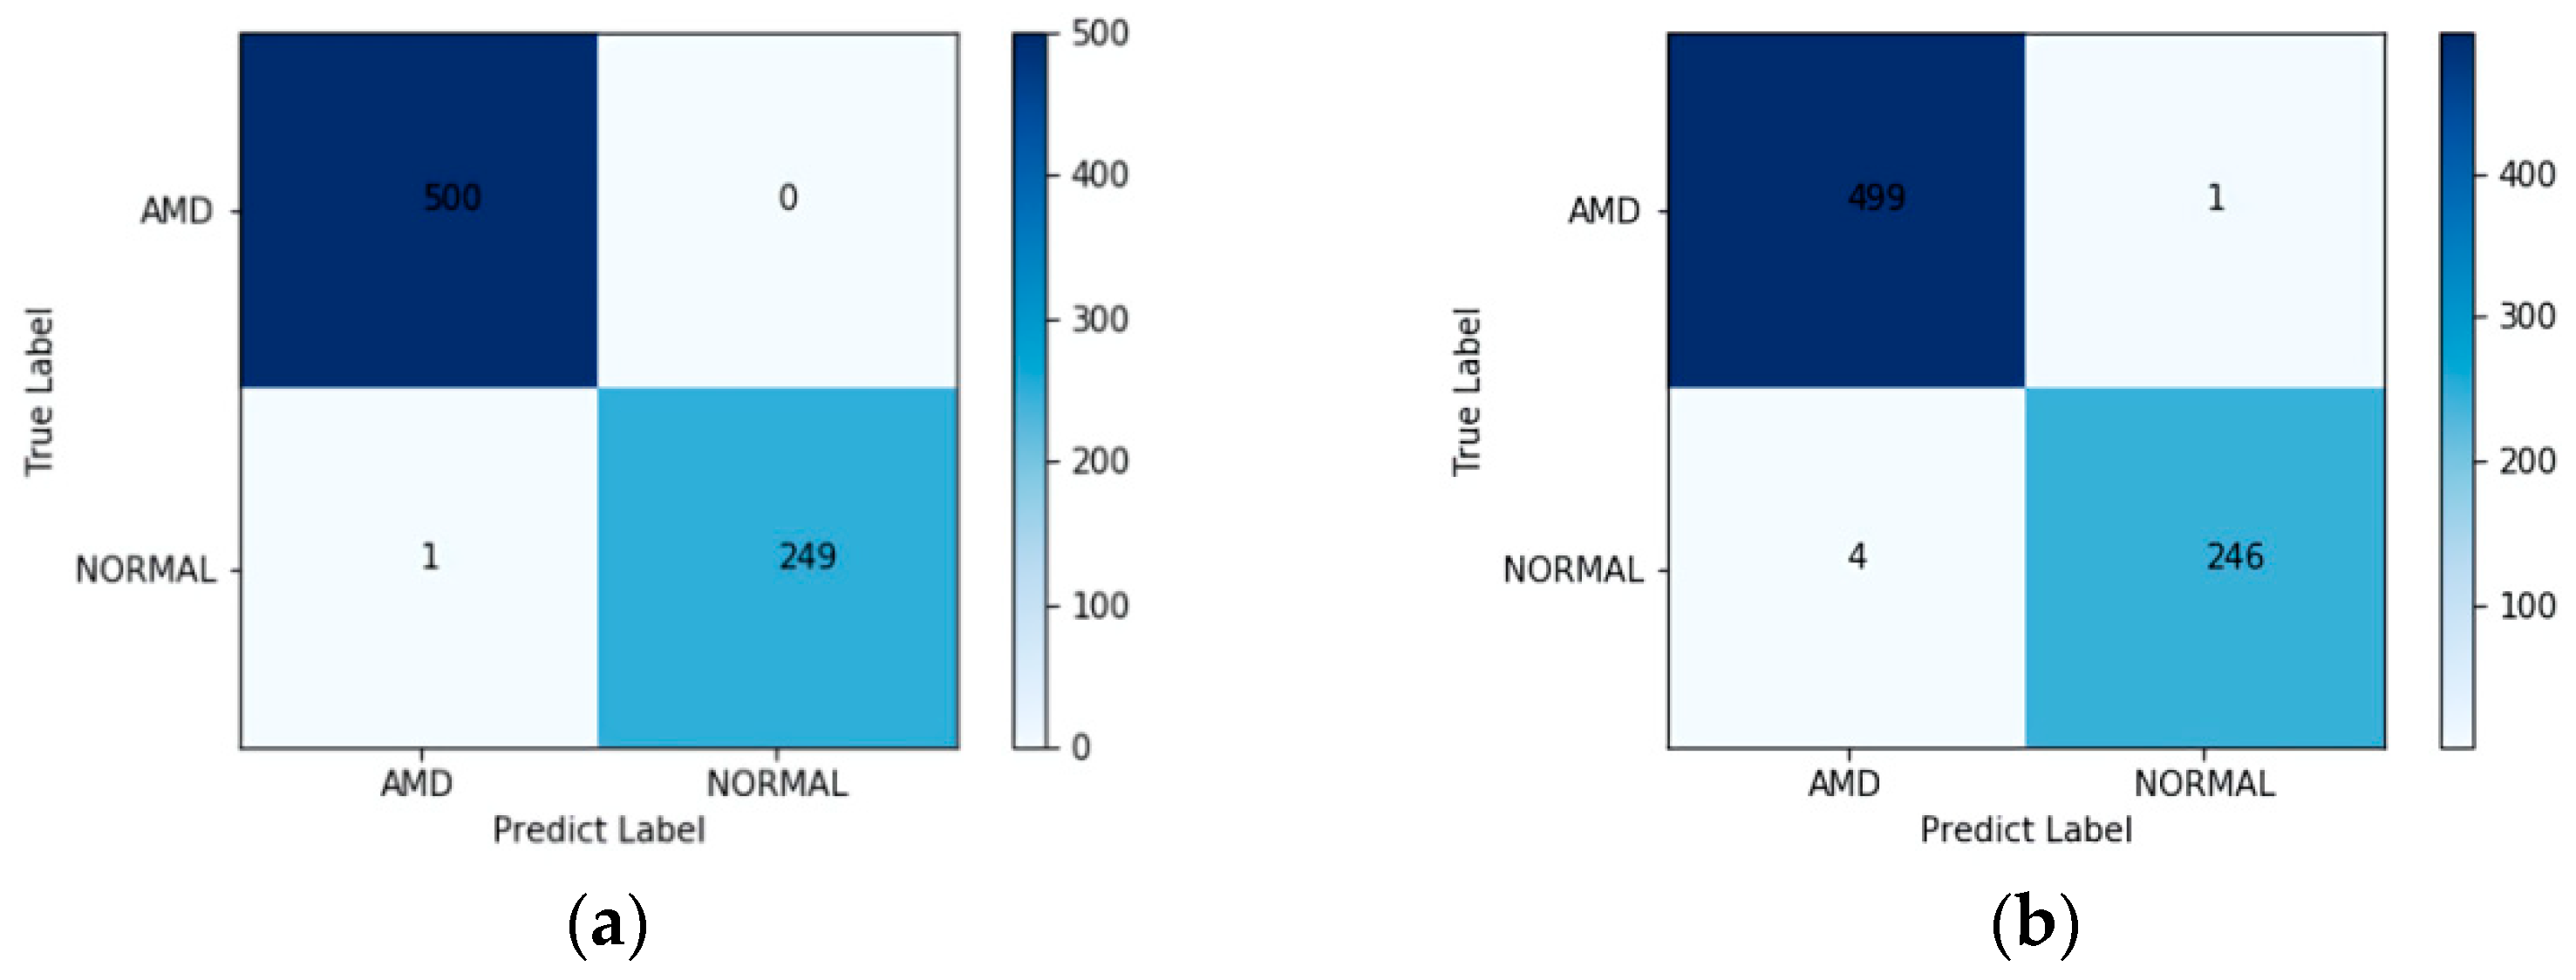
| AMD | 100.00 | 100.00 | 99.80 | 99.90 | - |
| NORMAL | 99.60 | 99.60 | 100.00 | 99.80 | - |
| Weighted Average | 99.87 | 99.87 | 99.87 | 99.87 | 1.0000 |
| Method | Weighted Average Accuracy % | AUC |
|---|---|---|
| Multi-scale and multi-path CNN [31] | 99.78 | 0.9978 |
| Multi-scale CNN [32] | 99.73 | 0.9999 |
| Inception V3 transfer learning [42] | 96.53 | 0.9762 |
| Multi-scale deep feature fusion [44] | 97.71 | 0.9900 |
| AlexNet transfer learning [45] | 98.26 | 0.9917 |
| Iterative fusion CNN [46] | 93.40 | 0.9798 |
| Proposed method | 99.87 | 1.0000 |
| Class | Accuracy % | Sensitivity % | Precision % | F1-Score % | AUC |
|---|---|---|---|---|---|
| AMD | 95.02 | 95.02 | 97.72 | 96.38 | - |
| NORMAL | 98.86 | 98.86 | 97.48 | 98.17 | - |
| Weighted Average | 97.56 | 97.56 | 97.56 | 97.56 | 0.9954 |
| Method | Weighted Average Accuracy % | AUC |
|---|---|---|
| RPE detection and baseline estimation [26] | 96.66 | - |
| Feature extraction + SVM [43] | 93.30 | - |
| Intensity-based threshold + Ploy fitting curve [47] | 92.00 | - |
| Feature extraction + RF classifier [48] | 97.70 | 0.9900 |
| Feature extraction + Sequential Minimal Optimization [49] | 96.60 | 0.9910 |
| 18-layer recombined residual CNN [50] | 96.66 | - |
| Sparse coding +Dictionary learning [51] | 96.66 | - |
| Proposed method | 97.56 | 0.9954 |
Publisher’s Note: MDPI stays neutral with regard to jurisdictional claims in published maps and institutional affiliations. |
© 2022 by the authors. Licensee MDPI, Basel, Switzerland. This article is an open access article distributed under the terms and conditions of the Creative Commons Attribution (CC BY) license (https://creativecommons.org/licenses/by/4.0/).
Share and Cite
He, T.; Zhou, Q.; Zou, Y. Automatic Detection of Age-Related Macular Degeneration Based on Deep Learning and Local Outlier Factor Algorithm. Diagnostics 2022, 12, 532. https://doi.org/10.3390/diagnostics12020532
He T, Zhou Q, Zou Y. Automatic Detection of Age-Related Macular Degeneration Based on Deep Learning and Local Outlier Factor Algorithm. Diagnostics. 2022; 12(2):532. https://doi.org/10.3390/diagnostics12020532
Chicago/Turabian StyleHe, Tingting, Qiaoer Zhou, and Yuanwen Zou. 2022. "Automatic Detection of Age-Related Macular Degeneration Based on Deep Learning and Local Outlier Factor Algorithm" Diagnostics 12, no. 2: 532. https://doi.org/10.3390/diagnostics12020532
APA StyleHe, T., Zhou, Q., & Zou, Y. (2022). Automatic Detection of Age-Related Macular Degeneration Based on Deep Learning and Local Outlier Factor Algorithm. Diagnostics, 12(2), 532. https://doi.org/10.3390/diagnostics12020532


