
Changes in Liver Steatosis Using Controlled Attenuation Parameter among Patients with Chronic Hepatitis C Infection Treated with Direct-Acting Antivirals Therapy Who Achieved Sustained Virological Response

 ,
,  , , , , , , ,
  , ,
, ,  ,
,  and
and
Abstract
:1. Introduction
2. Materials and Methods
2.1. Patients
2.2. Clinical and Laboratory Assessment
2.3. VCTE Examination
2.4. Statistical Analysis
3. Results
3.1. Patients Characteristics
3.2. Changes in CAP and LSM
3.3. Changes in Clinical and Biological Parameters
3.4. Clinical and Biological Parameters in Patients with Liver Steatosis at SVR12 and in Those with No Hepatic Steatosis at SVR12
3.5. Factors Associated with Increased CAP
4. Discussion
5. Conclusions
Author Contributions
Funding
Institutional Review Board Statement
Informed Consent Statement
Data Availability Statement
Conflicts of Interest
References
- World Health Organization. Global Hepatitis Report 2017; World Health Organization: Geneva, Switzerland, 2017; pp. 1–83. [Google Scholar]
- Axley, P.; Ahmed, Z.; Ravi, S.; Singal, A.K. Hepatitis C virus and hepatocellular carcinoma: A narrative review. J. Clin. Transl. Hepatol. 2017, 6, 1–6. [Google Scholar] [CrossRef] [PubMed] [Green Version]
- Marcellin, P.; Boyer, N.; Gervais, A.; Martinot, M.; Pouteau, M.; Castelnau, C.; Kilani, A.; Areias, J.; Auperin, A.; Benhamou, J.P.; et al. Long-term histologic improvement and loss of detectable intrahepatic HCV RNA in patients with chronic hepatitis C and sustained response to interferon-α therapy. Ann. Intern. Med. 1997, 127, 875. [Google Scholar] [CrossRef] [PubMed]
- Dusheiko, G. Side effects of α interferon in chronic hepatitis C. Hepatology 1997, 26, 112S–121S. [Google Scholar] [CrossRef] [PubMed]
- Chavalitdhamrong, T.T.D.; Tanwandee, T. Long-term outcomes of chronic hepatitis C patients with sustained virological response at 6 months after the end of treatment. World J. Gastroenterol. 2006, 12, 5532–5535. [Google Scholar] [CrossRef] [PubMed]
- Del Campo, J.A.; Romero-Gómez, M. Steatosis and insulin resistance in hepatitis C: A way out for the virus? World J. Gastro-enterol. 2009, 15, 5014–5019. [Google Scholar] [CrossRef] [PubMed]
- Trifan, A.; Stanciu, C.; Gheorghe, L.; Iacob, S.; Curescu, M.; Prelipcean, C.C.; Stefanescu, G.; Girleanu, I.; Chiriac, S.; Mihai, C.; et al. Efficacy and safety of paritaprevir/ritonavir, ombitasvir, and dasabuvir with ribavirin for the treatment of HCV genotype 1b compensated cirrhosis in patients aged 70 years or older. Medicine 2017, 96, e9271. [Google Scholar] [CrossRef] [PubMed]
- Adinolfi, L.E.; Gambardella, M.; Andreana, A.; Tripodi, M.F.; Utili, R.; Ruggiero, G. Steatosis accelerates the progression of liver damage of chronic hepatitis C patients and correlates with specific HCV genotype and visceral obesity. Hepatology 2001, 33, 1358–1364. [Google Scholar] [CrossRef] [PubMed]
- Rubbia-Brandt, L.; Quadri, R.; Abid, K.; Giostra, E.; Malé, P.-J.; Mentha, G.; Spahr, L.; Zarski, J.-P.; Borisch, B.; Hadengue, A.; et al. Hepatocyte steatosis is a cytopathic effect of hepatitis C virus genotype 3. J. Hepatol. 2000, 33, 106–115. [Google Scholar] [CrossRef]
- Hézode, C. Treatment of hepatitis C: Results in real life. Liver Int. 2018, 38, 21–27. [Google Scholar] [CrossRef] [PubMed] [Green Version]
- Hammerstad, S.S.; Grock, S.F.; Lee, H.J.; Hasham, A.; Sundaram, N.K.; Tomer, Y. Diabetes and hepatitis C: A two-way association. Front. Endocrinol. 2015, 6, 134. [Google Scholar] [CrossRef] [PubMed] [Green Version]
- Bose, S.K.; Shrivastava, S.; Meyer, K.; Ray, R.B.; Ray, R. Hepatitis C virus activates the mTOR/S6K1 signaling pathway in inhibiting IRS-1 function for insulin resistance. J. Virol. 2012, 86, 6315–6322. [Google Scholar] [CrossRef] [PubMed] [Green Version]
- Trifan, A.; Stanciu, C. Checkmate to liver biopsy in chronic hepatitis C? World J. Gastroenterol. 2012, 18, 5514–5520. [Google Scholar] [CrossRef] [PubMed]
- Regev, A.; Berho, M.; Jeffers, L.J.; Milikowski, C.; Molina, E.G.; Pyrsopoulos, N.T.; Feng, Z.Z.; Reddy, K.R.; Schiff, E.R. Sampling error and intraobserver variation in liver biopsy in patients with chronic HCV infection. Am. J. Gastroenterol. 2002, 97, 2614–2618. [Google Scholar] [CrossRef] [PubMed]
- Szymczak, A.; Simon, K.; Inglot, M.; Gladysz, A. Safety and effectiveness of blind percutaneous liver biopsy: Analysis of 1412 procedures. Hepat. Mon. 2012, 12, 32–37. [Google Scholar] [CrossRef] [PubMed] [Green Version]
- Sasso, M.; Beaugrand, M.; de Ledinghen, V.; Douvin, C.; Marcellin, P.; Poupon, R.; Sandrin, L.; Miette, V. Controlled attenuation pa-rameter (CAP): A novel VCTE™ guided ultrasonic attenuation measurement for the evaluation of hepatic steatosis: Preliminary study and validation in a cohort of patients with chronic liver disease from various causes. Ultrasound Med. Biol. 2010, 36, 1825–1835. [Google Scholar] [CrossRef] [PubMed]
- Vuppalanchi, R.; Siddiqui, M.S.; van Natta, M.L.; Hallinan, E.; Brandman, D.; Kowdley, K.; Neuschwander-Tetri, B.A.; Loomba, R.; Dasarathy, S.; Abdelmalek, M.; et al. Performance characteristics of vibration-controlled transient elastography for evaluation of nonalcoholic fatty liver disease. Hepatology 2018, 67, 134–144. [Google Scholar] [CrossRef] [PubMed]
- Wong, V.W.-S.; Irles, M.; Wong, G.L.-H.; Shili, S.; Chan, A.W.-H.; Merrouche, W.; Shu, S.S.-T.; Foucher, J.; le Bail, B.; Chan, W.K.; et al. Unified interpretation of liver stiffness measurement by M and XL probes in non-alcoholic fatty liver disease. Gut 2019, 68, 2057–2064. [Google Scholar] [CrossRef] [PubMed]
- Sadeghi, A.; Amiri, R.; Akbarpour, E.; Mirminachi, B.; Sharifi, A.H.; Merat, S. Changes in liver steatosis as well as liver fibrosis in patients with chronic hepatitis C after successful direct-acting antiviral therapy. Int. J. Clin. Pract. 2021, 75, e14145. [Google Scholar] [CrossRef] [PubMed]
- Kobayashi, N.; Iijima, H.; Tada, T.; Kumada, T.; Yoshida, M.; Aoki, T.; Nishimura, T.; Nakano, C.; Takata, R.; Yoh, K.; et al. Changes in liver stiffness and steatosis among patients with hepatitis C virus infection who received direct-acting antiviral therapy and achieved sustained virological response. Eur. J. Gastroenterol. Hepatol. 2018, 30, 546–551. [Google Scholar] [CrossRef] [PubMed]
- World Health Organization. Obesity and Overweight. Available online: http://www.who.int/mediacentre/factssheets/fs311/en/ (accessed on 12 January 2022).
- Schlevogt, B.; Boeker, K.H.W.; Mauss, S.; Klinker, H.; Heyne, R.; Link, R.; Simon, K.-G.; Sarrazin, C.; Serfert, Y.; Manns, M.P.; et al. Weight gain after interferon-free treatment of chronic hepatitis C—Results from the German hepatitis C-registry (DHC-R). Biomedicines 2021, 9, 1495. [Google Scholar] [CrossRef]
- Castéra, L.; Vergniol, J.; Foucher, J.; le Bail, B.; Chanteloup, E.; Haaser, M.; Darriet, M.; Couzigou, P.; de Lédinghen, V. Prospective comparison of transient elastography, Fibrotest, APRI, and liver biopsy for the assessment of fibrosis in chronic hepatitis C. Gastroenterology 2005, 128, 343–350. [Google Scholar] [CrossRef] [PubMed]
- Karlas, T.; Petroff, D.; Sasso, M.; Fan, J.G.; Mi, Y.Q.; de Lédinghen, V.; Kumar, M.; Lupsor-Platon, M.; Han, K.H.; Cardoso, A.C.; et al. Individual patient data meta-analysis of controlled attenuation parameter (CAP) technology for assessing steatosis. J. Hepatol. 2017, 66, 1022–1030. [Google Scholar] [CrossRef] [PubMed]
- Wong, V.W.-S.; Vergniol, J.; Wong, G.L.-H.; Foucher, J.; Chan, H.L.-Y.; le Bail, B.; Choi, P.C.-L.; Kowo, M.; Chan, A.; Merrouche, W.; et al. Diagnosis of fibrosis and cirrhosis using liver stiffness measurement in nonalcoholic fatty liver disease. Hepatology 2010, 51, 454–462. [Google Scholar] [CrossRef] [PubMed]
- Lonardo, A.; Adinolfi, L.E.; Restivo, L.; Ballestri, S.; Romagnoli, D.; Baldelli, E.; Nascimbeni, F.; Loria, P. Pathogenesis and significance of hepatitis C virus steatosis: An update on survival strategy of a successful pathogen. World J. Gastroenterol. 2014, 20, 7089–7103. [Google Scholar] [CrossRef] [PubMed]
- Saldarriaga, O.A.; Dye, B.; Pham, J.; Wanninger, T.G.; Millian, D.; Kueht, M.; Freiberg, B.; Utay, N.; Stevenson, H.L. Comparison of liver biopsies before and after direct-acting antiviral therapy for hepatitis C and correlation with clinical outcome. Sci. Rep. 2021, 11, 14506. [Google Scholar] [CrossRef] [PubMed]
- Siphepho, P.Y.; Liu, Y.-T.; Shabangu, C.S.; Huang, J.-F.; Huang, C.-F.; Yeh, M.-L.; Yu, M.-L.; Wang, S.-C. The impact of steatosis on chronic hepatitis C progression and response to antiviral treatments. Biomedicines 2021, 9, 1491. [Google Scholar] [CrossRef] [PubMed]
- Jacobson, I.M.; Lim, J.K.; Fried, M.W. American Gastroenterological Association Institute clinical practice update-expert review: Care of patients who have achieved a sustained virologic response after antiviral therapy for chronic hepatitis C infection. Gastroenterology 2017, 152, 1578–1587. [Google Scholar] [CrossRef] [PubMed] [Green Version]
- Lonardo, A.; Adinolfi, L.E.; Petta, S.; Craxì, A.; Loria, P. Hepatitis C and diabetes: The inevitable coincidence? Expert Rev. Anti-Infect. Ther. 2009, 7, 293–308. [Google Scholar] [CrossRef] [PubMed]
- Azad, A.; Bichoupan, K.; Chekuri, S.; Schiano, T.; Branch, A.D. Diabetes is a risk factor for weight gain among patients cured of HCV with sofosbuvir/ledipasvir. Hepatology 2016, 64 (Suppl. S1), 377A. [Google Scholar]
- Strauhs-Nitsch, L.; Campiolo, M.F.; Morsoletto, D.B.G.; Junior, A.P.; Ivantes, C.A.P. Curing hepatitis C with the new direct acting antivirals did not improve insulin resistance after one year. Arq. Gastroenterol. 2020, 57, 267–271. [Google Scholar] [CrossRef]
- Ciancio, A.; Bosio, R.; Bo, S.; Pellegrini, M.; Sacco, M.; Vogliotti, E.; Fassio, G.; Degerfeld, A.G.B.M.; Gallo, M.; Giordanino, C.; et al. Significant improvement of glycemic control in diabetic patients with HCV infection responding to direct-acting antiviral agents. J. Med. Virol. 2018, 90, 320–327. [Google Scholar] [CrossRef] [PubMed] [Green Version]
- Do, A.; Esserman, D.A.; Krishnan, S.; Lim, J.K.; Taddei, T.H.; Hauser, R.G.; Tate, J.P.; Re, V.L.; Justice, A.C. Excess weight gain after cure of hepatitis C infection with direct-acting antivirals. J. Gen. Intern. Med. 2020, 35, 2025–2034, Erratum in J. Gen. Intern. Med. 2020, 35, 3140. [Google Scholar] [CrossRef] [PubMed]
- Schlevogt, B.; Deterding, K.; Port, K.; Zu Siederdissen, C.H.; Sollik, L.; Kirschner, J.; Mix, C.; Manns, M.P.; Cornberg, M.; Wedemeyer, H. Interferon-free cure of chronic hepatitis C is associated with weight gain during long-term follow-up. Z. Gastroenterol. 2017, 55, 848–856. [Google Scholar] [CrossRef] [PubMed]
- Sugimoto, R.; Iwasa, M.; Hara, N.; Tamai, Y.; Yoshikawa, K.; Ogura, S.; Tanaka, H.; Eguchi, A.; Yamamoto, N.; Kobayashi, Y.; et al. Changes in liver function and body composition by direct-acting antiviral therapy for hepatitis C virus infection. Hepatol. Res. 2018, 48, 337–344. [Google Scholar] [CrossRef] [PubMed]
- Negro, F. Facts and fictions of HCV and comorbidities: Steatosis, diabetes mellitus, and cardiovascular diseases. J. Hepatol. 2014, 61, S69–S78. [Google Scholar] [CrossRef] [PubMed]
- Kumar, D.; Farrell, G.C.; Fung, C.; George, J. Hepatitis C virus genotype 3 is cytopathic to hepatocytes: Reversal of hepatic steatosis after sustained therapeutic response. Hepatology 2002, 36, 1266–1272. [Google Scholar] [CrossRef] [PubMed]
- Manuc, M.; Preda, C.M.; Popescu, C.P.; Baicuș, C.; Voiosu, T.; Pop, C.S.; Gheorghe, L.; Sporea, I.; Trifan, A.; Tanțău, M.; et al. New epidemiologic data regarding hepatitis C virus infection in Romania. J. Gastrointest. Liver Dis. 2017, 26, 381–386. [Google Scholar] [CrossRef] [PubMed] [Green Version]
- Han, M.A.T.; Saouaf, R.; Ayoub, W.; Todo, T.; Mena, E.; Noureddin, M. Magnetic resonance imaging and transient elastography in the management of nonalcoholic fatty liver disease (NAFLD). Expert Rev. Clin. Pharmacol. 2017, 10, 379–390. [Google Scholar] [CrossRef]
- Fedchuk, L.; Nascimbeni, F.; Pais, R.; Charlotte, F.; Housset, C.; Ratziu, V.; The Lido Study Group. Performance and limitations of steatosis biomarkers in patients with nonalcoholic fatty liver disease. Aliment. Pharmacol. Ther. 2014, 40, 1209–1222. [Google Scholar] [CrossRef] [PubMed]
- Eddowes, P.J.; Sasso, M.; Allison, M.; Tsochatzis, E.; Anstee, Q.M.; Sheridan, D.; Guha, I.N.; Cobbold, J.F.; Deeks, J.J.; Paradis, V.; et al. Accuracy of fibro, scan controlled attenuation parameter and liver stiffness meas-urement in assessing steatosis and fibrosis in patients with nonalcoholic fatty liver disease. Gastroenterology 2019, 156, 1717–1730. [Google Scholar] [CrossRef] [PubMed] [Green Version]
- Semmler, G.; Wöran, K.; Scheiner, B.; Unger, L.W.; Paternostro, R.; Stift, J.; Schwabl, P.; Bucsics, T.; Bauer, D.; Simbrunner, B.; et al. Novel reliability criteria for controlled attenuation parameter assessments for non-invasive evaluation of hepatic steatosis. United Eur. Gastroenterol. J. 2020, 8, 321–331. [Google Scholar] [CrossRef] [PubMed] [Green Version]
- Noureddin, M.; Wong, M.M.; Todo, T.; Lu, S.C.; Sanyal, A.J.; Mena, E.A. Fatty liver in hepatitis C patients post-sustained virological response with direct-acting antivirals. World J. Gastroenterol. 2018, 24, 1269–1277. [Google Scholar] [CrossRef] [PubMed]
- Ogasawara, N.; Kobayashi, M.; Akuta, N.; Kominami, Y.; Fujiyama, S.; Kawamura, Y.; Sezaki, H.; Hosaka, T.; Suzuki, F.; Saitoh, S.; et al. Serial changes in liver stiffness and controlled attenuation parameter following direct-acting antiviral therapy against hepatitis C virus genotype 1b. J. Med. Virol. 2018, 90, 313–319. [Google Scholar] [CrossRef] [PubMed]
- Rout, G.; Nayak, B.; Patel, A.H.; Gunjan, D.; Singh, V.; Kedia, S. Therapy with oral directly acting agents in hepatitis C infection is associated with reduction in fibrosis and increase in hepatic steatosis on transient elastography. J. Clin. Exp. Hepatol. 2019, 9, 207–214. [Google Scholar] [CrossRef] [PubMed]
- Shimizu, K.; Soroida, Y.; Sato, M.; Hikita, H.; Kobayashi, T.; Endo, M.; Sato, M.; Gotoh, H.; Iwai, T.; Tateishi, R.; et al. Eradication of hepatitis C virus is associated with the attenuation of steatosis as evaluated using a controlled attenuation parameter. Sci. Rep. 2018, 8, 7845. [Google Scholar] [CrossRef] [PubMed]
- Tada, T.; Kumada, T.; Toyoda, H.; Sone, Y.; Takeshima, K.; Ogawa, S.; Goto, T.; Wakahata, A.; Nakashima, M.; Nakamuta, M.; et al. Viral eradication reduces both liver stiffness and steatosis in patients with chronic hepatitis C virus infection who received direct-acting anti-viral therapy. Aliment. Pharmacol. Ther. 2018, 47, 1012–1022. [Google Scholar] [CrossRef] [PubMed]
- Endo, D.; Satoh, K.; Shimada, N.; Hokari, A.; Aizawa, Y. Impact of interferon-free antivirus therapy on lipid profiles in patients with chronic hepatitis C genotype 1b. World J. Gastroenterol. 2017, 23, 2355–2364. [Google Scholar] [CrossRef] [PubMed] [Green Version]
- Kawagishi, N.; Suda, G.; Nakamura, A.; Kimura, M.; Maehara, O.; Suzuki, K.; Nakamura, A.; Ohara, M.; Izumi, T.; Umemura, M.; et al. Liver steatosis and dyslipidemia after HCV eradication by direct acting antiviral agents are synergistic risks of atherosclerosis. PLoS ONE 2018, 13, e0209615. [Google Scholar] [CrossRef] [PubMed] [Green Version]
- Villani, R.; di Cosimo, F.; Romano, A.D.; Sangineto, M.; Serviddio, G. Serum lipid profile in HCV patients treated with direct-acting antivirals: A systematic review and meta-analysis. Sci. Rep. 2021, 11, 13944. [Google Scholar] [CrossRef] [PubMed]
- European Association for the Study of the Liver. EASL recommendations on treatment of hepatitis C 2016. J. Hepatol. 2017, 66, 153–194. [Google Scholar] [CrossRef] [PubMed] [Green Version]


| Overall Cohort n (%) | Characteristics Baseline | Characteristics SVR12 | p-Value | |
|---|---|---|---|---|
| Variable | Overall (n = 280) | |||
| Gender (female), n (%) | 188 (67.1) | |||
| Age, yr. | 59.91 ± 12.185 | |||
| BMI (kg/m2) | 27.13 ± 3.62 | 26.96 ± 4.15 | 27.87 ± 4.23 | 0.042 |
| HGB (g/dl) | 13.23 ± 1.67 | 13.04 ± 1.48 | 13.32 ± 1.56 | 0.651 |
| Platelet count (G/L) | 192.18 ± 66.18 | 188.42 ± 71.39 | 193.53 ± 68.23 | 0.798 |
| ALT (IU/L) | 30.24 ± 26.76 | 40.72 ± 27.34 | 28.72 ± 24.71 | 0.013 |
| AST (IU/L) | 31.77 ± 22.61 | 33.35 ± 23.37 | 27.21 ± 11.15 | 0.029 |
| GGT (IU/L) | 41.89 ± 48.91 | 40.64 ± 31.07 | 43.33 ± 38.03 | 0.237 |
| ALP (IU/L) | 80.70 ± 36.92 | 76.67 ± 30.65 | 79.37 ± 35.01 | 0.709 |
| Total bilirubin (mg/dL) | 0.72 ± 0.68 | 0.75 ± 0.39 | 0.69 ± 0.38 | 0.465 |
| Albumin (g/dL) | 4.56 ± 0.38 | 4.53 ± 0.44 | 4.57 ± 0.36 | 0.559 |
| Creatinine (mg/dL) | 0.73 ± 0.13 | 0.71 ± 0.13 | 0.73 ± 0.13 | 0.505 |
| Urea (mg/dL) | 36.56 ± 10.81 | 34.40 ± 37.08 | 37.08 ± 11.22 | 0.188 |
| Fasting glucose (mg/dL) | 111.37 ± 43.77 | 106.37 ± 18.86 | 114.96 ± 47.19 | 0.024 |
| Total cholesterol (mg/dL) | 211.68 ± 55.04 | 191.61 ± 67.19 | 216.52 ± 50.85 | 0.031 |
| Triglycerides (mg/dL) | 148 ± 98.78 | 124.03 ± 113.49 | 153.78 ± 94.53 | 0.004 |
| CAP dB/m | 293 (245.5–339) | 225 ± 48.28 | 257 ± 65.49 | <0.001 |
| CAP ≥ 248 dB/m n (%) | 173 (61.8%) | 186 (66.4%) | ||
| Steatosis degree | ||||
| S0 n(%) | 107(38.2%) | 94 (33.6%) | ||
| S1 n(%) | 46 (16.5%) | 56 (20%) | ||
| S2 n (%) | 58 (20.7%) | 62 (22.1%) | ||
| S3 n (%) | 69 (24.6%) | 68 (24.3%) | ||
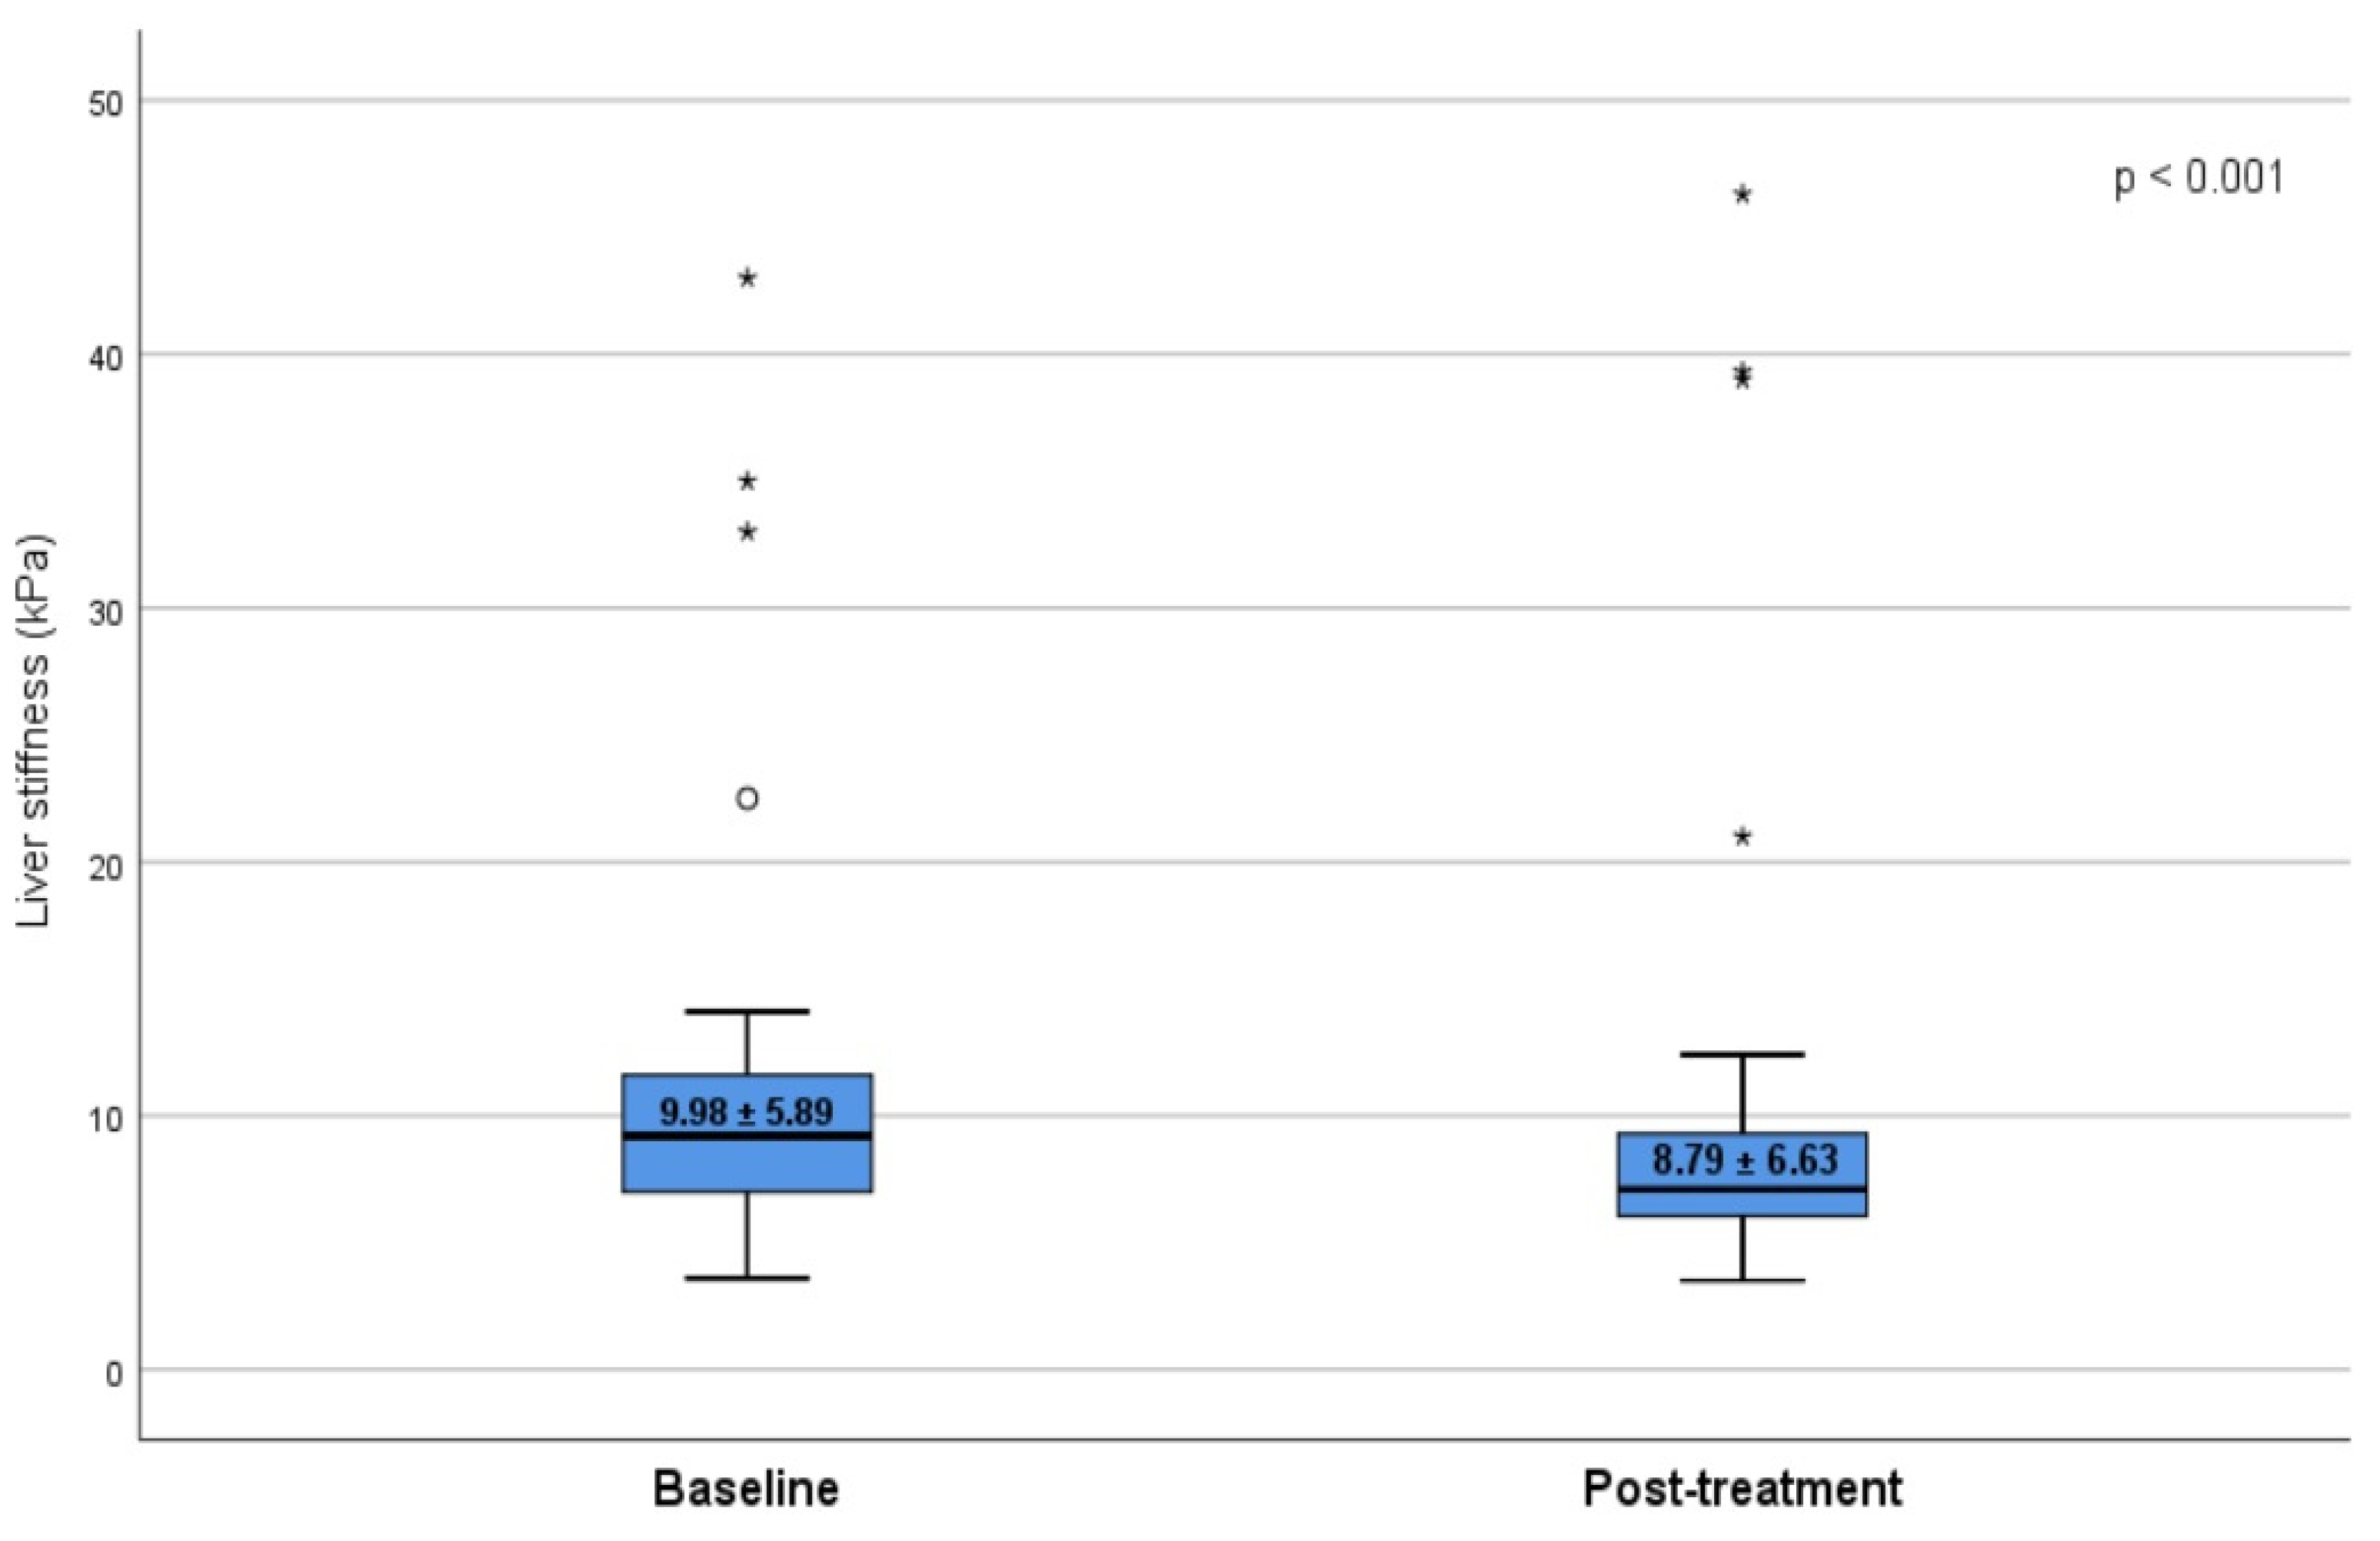
| Fibrosis score (mean ± SD) | 9.98 ± 5.89 | 8.79 ± 6.63 | 0.019 | |
| Fibrosis stages | ||||
| F0 n (%) | 61 (21.8%) | 72 (25.7%) | ||
| F1 n (%) | 42 (15%) | 54 (19.3%) | ||
| F2 n (%) | 58 (20.7%) | 47 (16.8%) | ||
| F3 n (%) | 39 (13.9%) | 44 (15.7%) | ||
| F4 n (%) | 80 (28.6%) | 63 (22.5%) |
| Patients without Steatosis (n = 94) | Patients with Steatosis (n = 186) | |||||
|---|---|---|---|---|---|---|
| Baseline | SVR12 | p-Value | Baseline | SVR12 | p-Value | |
| Body mass index (kg/m2) | 25.3 ± 5.0 | 26.1 ± 5.9 | NS | 25.19 ± 5.17 | 28.15 ± 4.51 | 0.003 |
| Weight (Kg) | 72.4 ± 4.53 | 73.4 ± 3.27 | NS | 73.1 ± 11.21 | 85.05 ± 10.4 | 0.006 |
| Laboratory panel (mean ± SD) | ||||||
| HCV viral load log10 IU/mL | 7.1 ± 1.4 | 0.0 ± 0.0 | 0.0001 | 7.1 ± 1.4 | 0.0 ± 0.0 | 0.0001 |
| AST (U/L) | 71.3 ± 58.7 | 21.8 ± 10.8 | 0.0001 | 36.3 ± 35.6 | 18.3 ± 4.4 | 0.0001 |
| ALT (U/L) | 57.78 ± 42.1 | 19.4 ± 12.5 | 0.0001 | 45.6 ± 50.8 | 20.3 ± 4.5 | 0.0001 |
| Alkaline phosphatase (U/L) | 79.5 ± 22.8 | 61.2 ± 18.4 | 0.05 | 81.4 ± 42.1 | 60.8 ± 24.5 | 0.01 |
| Fibrosis score (kPa) | 7.5 ± 1.4 | 5.5 ± 1.2 | 0.0001 | 7.5 ± 1.5 | 8.3 ± 3.8 | 0.038 |
| Variable | Univariate | Multivariate | ||
|---|---|---|---|---|
| β | p | β | p | |
| Age | 0.126 | 0.287 | ||
| Gender | 0.07 | 0.912 | ||
| BMI (kg/m2) | 0.561 | <0.001 | 0.328 | <0.001 |
| HGB (g/dL) | 0.143 | 0.728 | ||
| Platelet count (G/L) | −0.072 | 0.896 | ||
| ALT (IU/L) | −0.15 | 0.872 | ||
| AST (IU/L) | −0.218 | 0.726 | ||
| GGT (IU/L) | 0.182 | 0.787 | ||
| ALP (IU/L) | −0.139 | 0.639 | ||
| Fasting glucose (mg/dL) | 0.299 | 0.041 | 0.187 | 0.056 |
| Creatinine (mg/dL) | 0.331 | 0.648 | ||
| Urea (mg/dL) | −0.013 | 0.627 | ||
| Total cholesterol (mg/dL) | 0.310 | 0.008 | 0.108 | 0.052 |
| Triglicerides (mg/dL) | 0.426 | <0.001 | 0.148 | 0.017 |
| Albumin (g/dL) | −8.44 | 0.711 | ||
| Total bilirubin (mg/dL) | −0.23 | 0.580 | ||
| Baseline CAP | −0.594 | <0.001 | −0.596 | <0.001 |
Publisher’s Note: MDPI stays neutral with regard to jurisdictional claims in published maps and institutional affiliations. |
© 2022 by the authors. Licensee MDPI, Basel, Switzerland. This article is an open access article distributed under the terms and conditions of the Creative Commons Attribution (CC BY) license (https://creativecommons.org/licenses/by/4.0/).
Share and Cite
Trifan, A.; Stratina, E.; Rotaru, A.; Stafie, R.; Zenovia, S.; Nastasa, R.; Huiban, L.; Sfarti, C.; Cojocariu, C.; Cuciureanu, T.; et al. Changes in Liver Steatosis Using Controlled Attenuation Parameter among Patients with Chronic Hepatitis C Infection Treated with Direct-Acting Antivirals Therapy Who Achieved Sustained Virological Response. Diagnostics 2022, 12, 702. https://doi.org/10.3390/diagnostics12030702
Trifan A, Stratina E, Rotaru A, Stafie R, Zenovia S, Nastasa R, Huiban L, Sfarti C, Cojocariu C, Cuciureanu T, et al. Changes in Liver Steatosis Using Controlled Attenuation Parameter among Patients with Chronic Hepatitis C Infection Treated with Direct-Acting Antivirals Therapy Who Achieved Sustained Virological Response. Diagnostics. 2022; 12(3):702. https://doi.org/10.3390/diagnostics12030702
Chicago/Turabian StyleTrifan, Anca, Ermina Stratina, Adrian Rotaru, Remus Stafie, Sebastian Zenovia, Robert Nastasa, Laura Huiban, Catalin Sfarti, Camelia Cojocariu, Tudor Cuciureanu, and et al. 2022. "Changes in Liver Steatosis Using Controlled Attenuation Parameter among Patients with Chronic Hepatitis C Infection Treated with Direct-Acting Antivirals Therapy Who Achieved Sustained Virological Response" Diagnostics 12, no. 3: 702. https://doi.org/10.3390/diagnostics12030702
APA StyleTrifan, A., Stratina, E., Rotaru, A., Stafie, R., Zenovia, S., Nastasa, R., Huiban, L., Sfarti, C., Cojocariu, C., Cuciureanu, T., Muzica, C., Chiriac, S., Girleanu, I., Singeap, A.-M., & Stanciu, C. (2022). Changes in Liver Steatosis Using Controlled Attenuation Parameter among Patients with Chronic Hepatitis C Infection Treated with Direct-Acting Antivirals Therapy Who Achieved Sustained Virological Response. Diagnostics, 12(3), 702. https://doi.org/10.3390/diagnostics12030702