
Carbon Monoxide Diffusing Capacity (DLCO) Correlates with CT Morphology after Chemo-Radio-Immunotherapy for Non-Small Cell Lung Cancer Stage III

 , ,
, , 
Abstract
:1. Introduction
2. Materials and Methods
2.1. Patients
2.2. Treatments: Chemotherapy, Irradiation, Immune Checkpoint Inhibition
2.3. Pulmonary Function Parameters
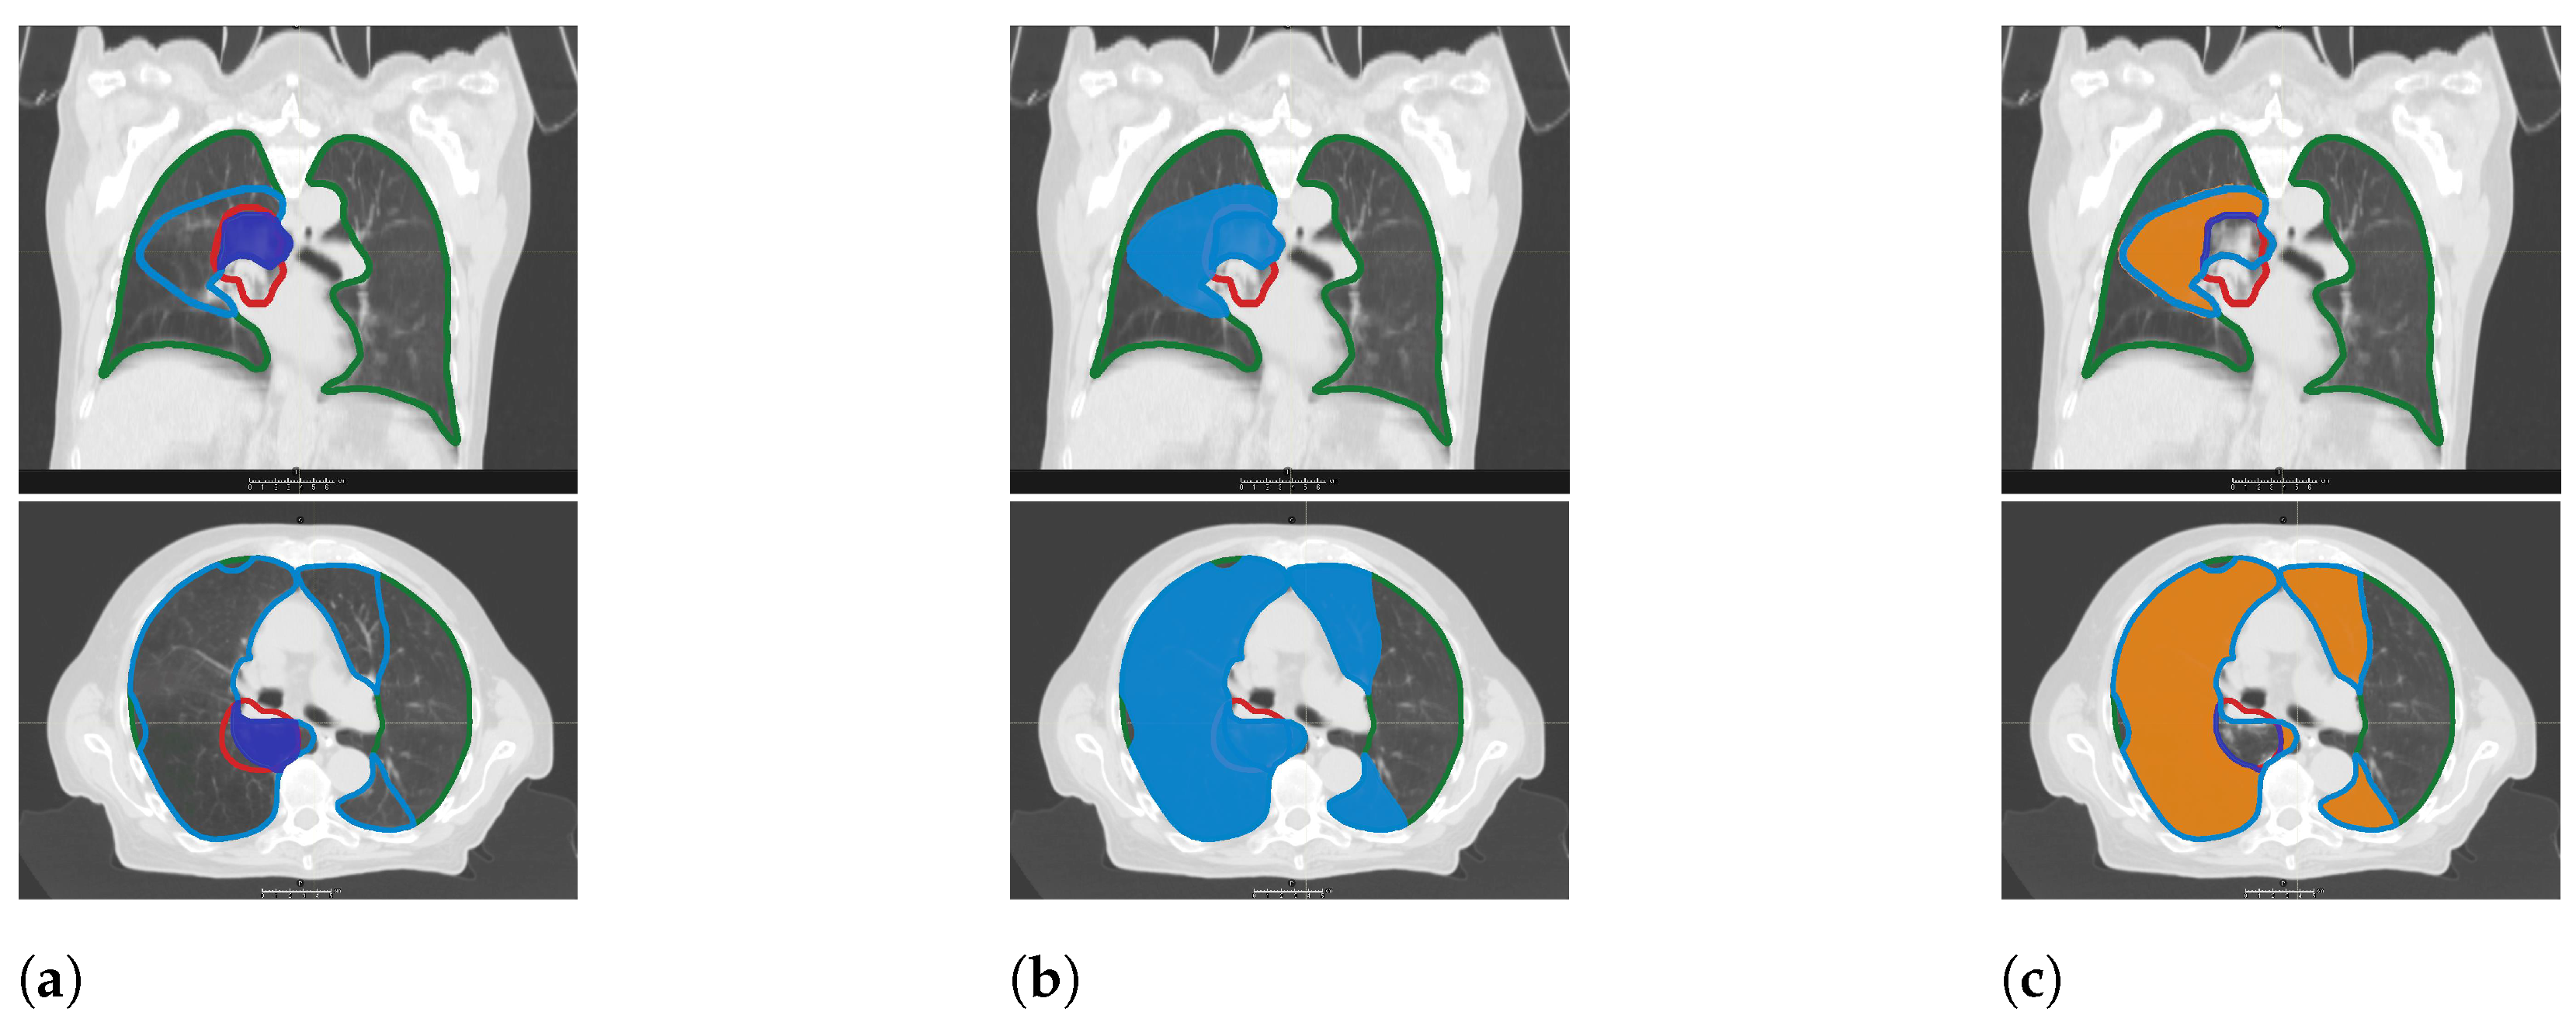
2.4. CT Morphology Changes
2.5. Statistics
3. Results
3.1. Patients
3.2. Radiation Treatment and Systemic Therapy
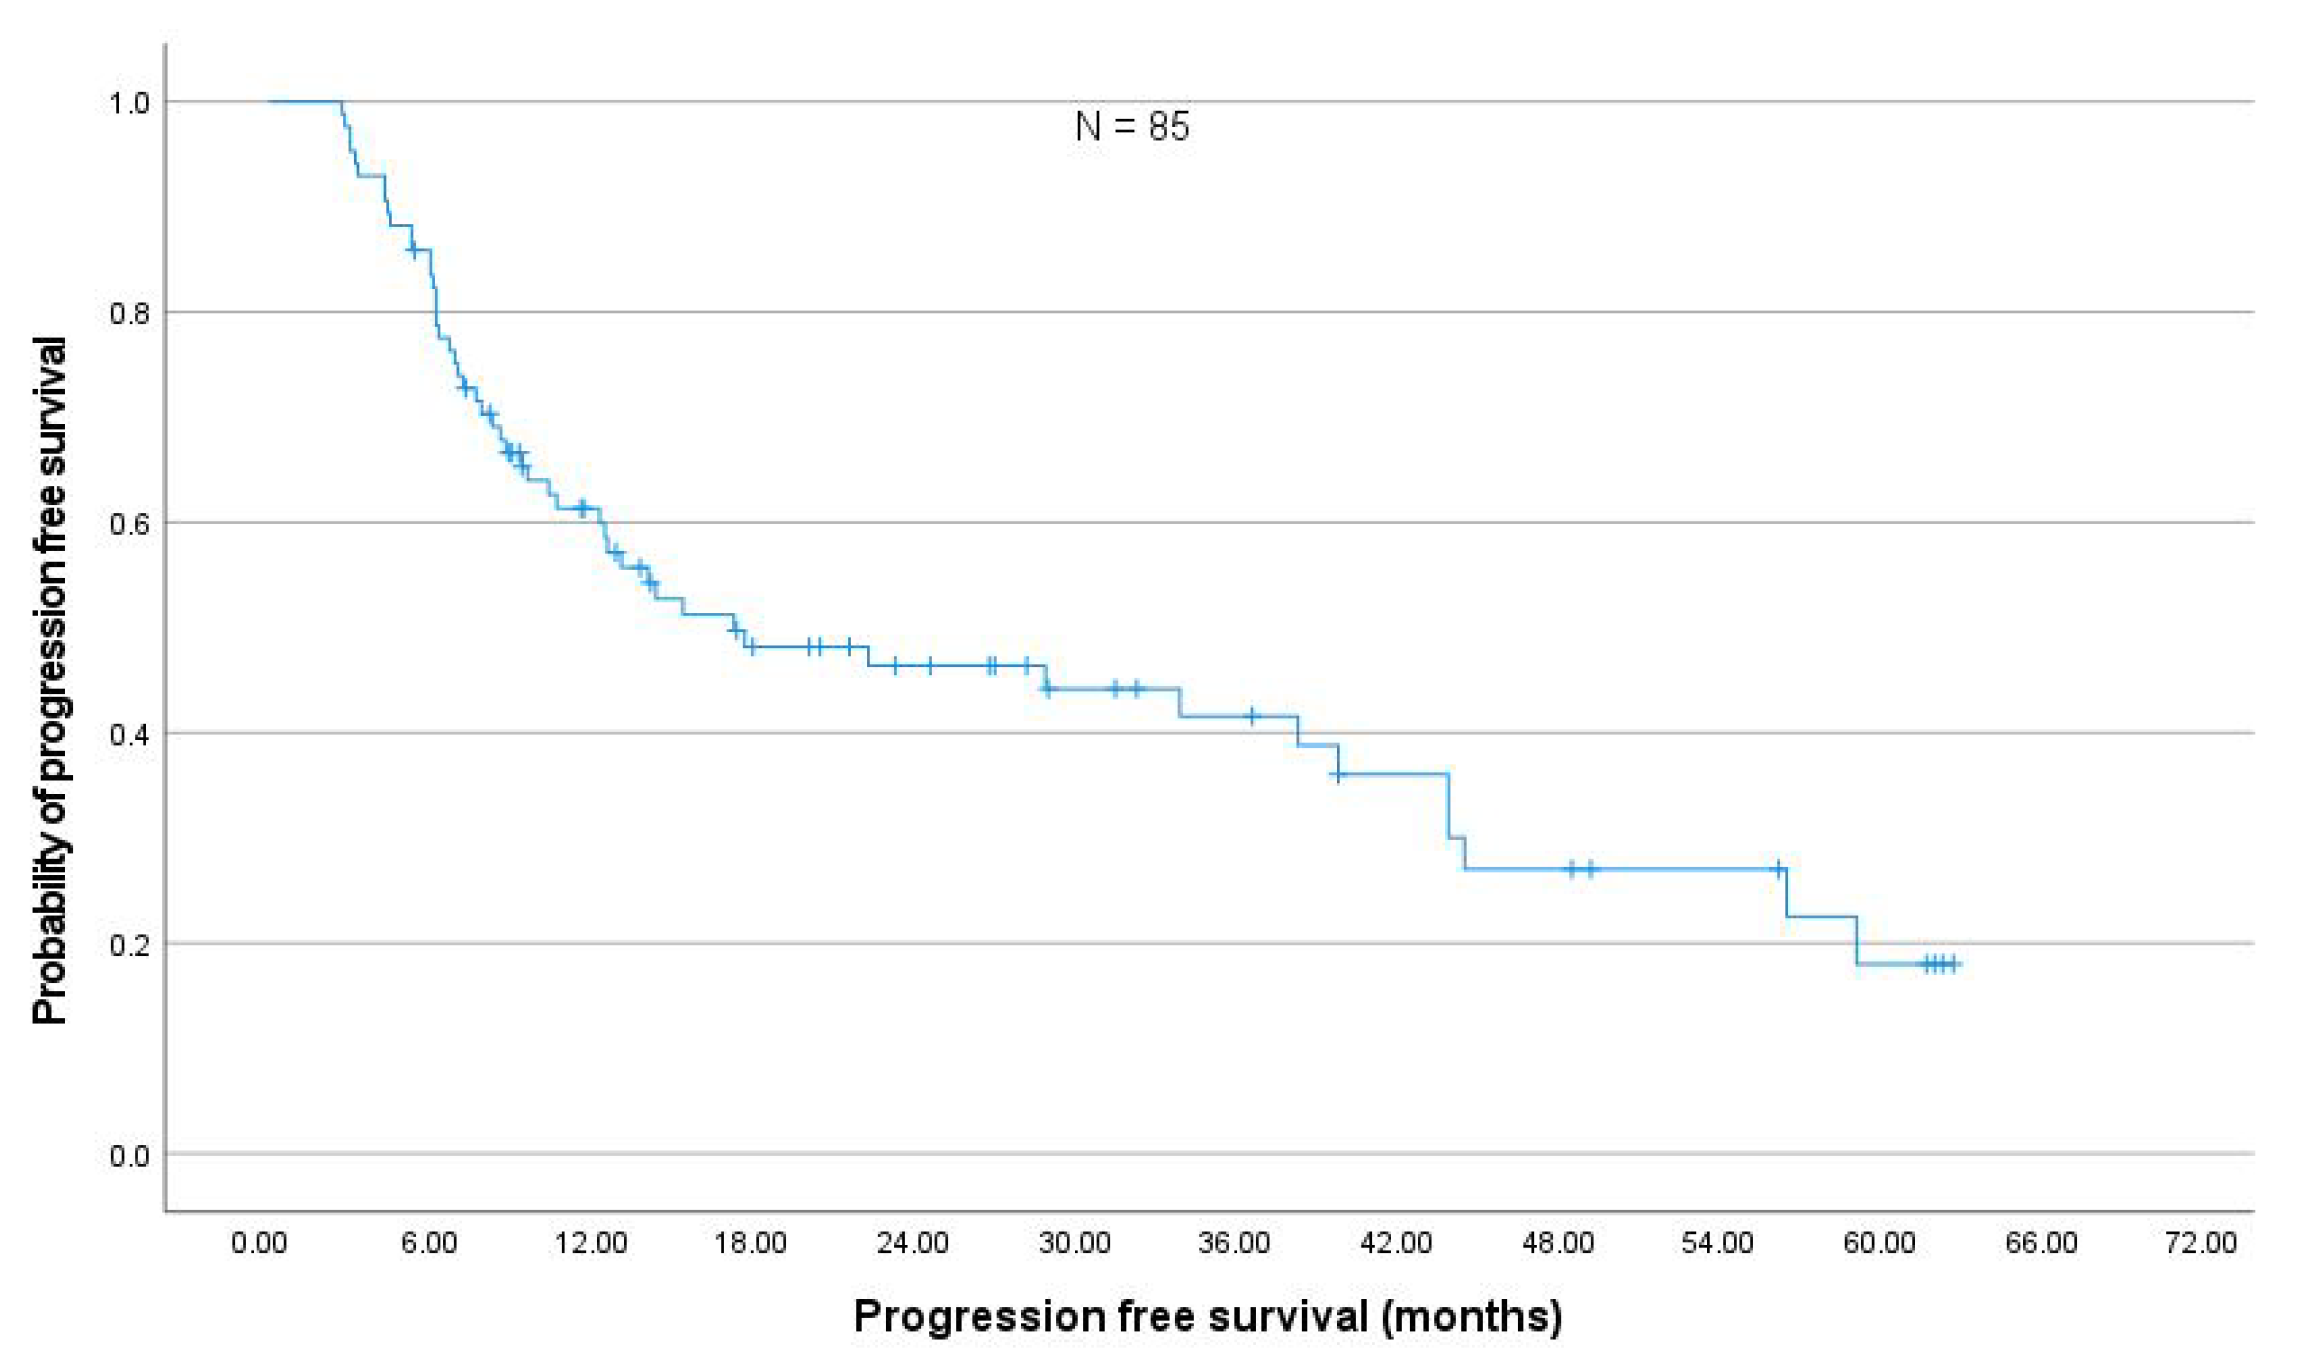
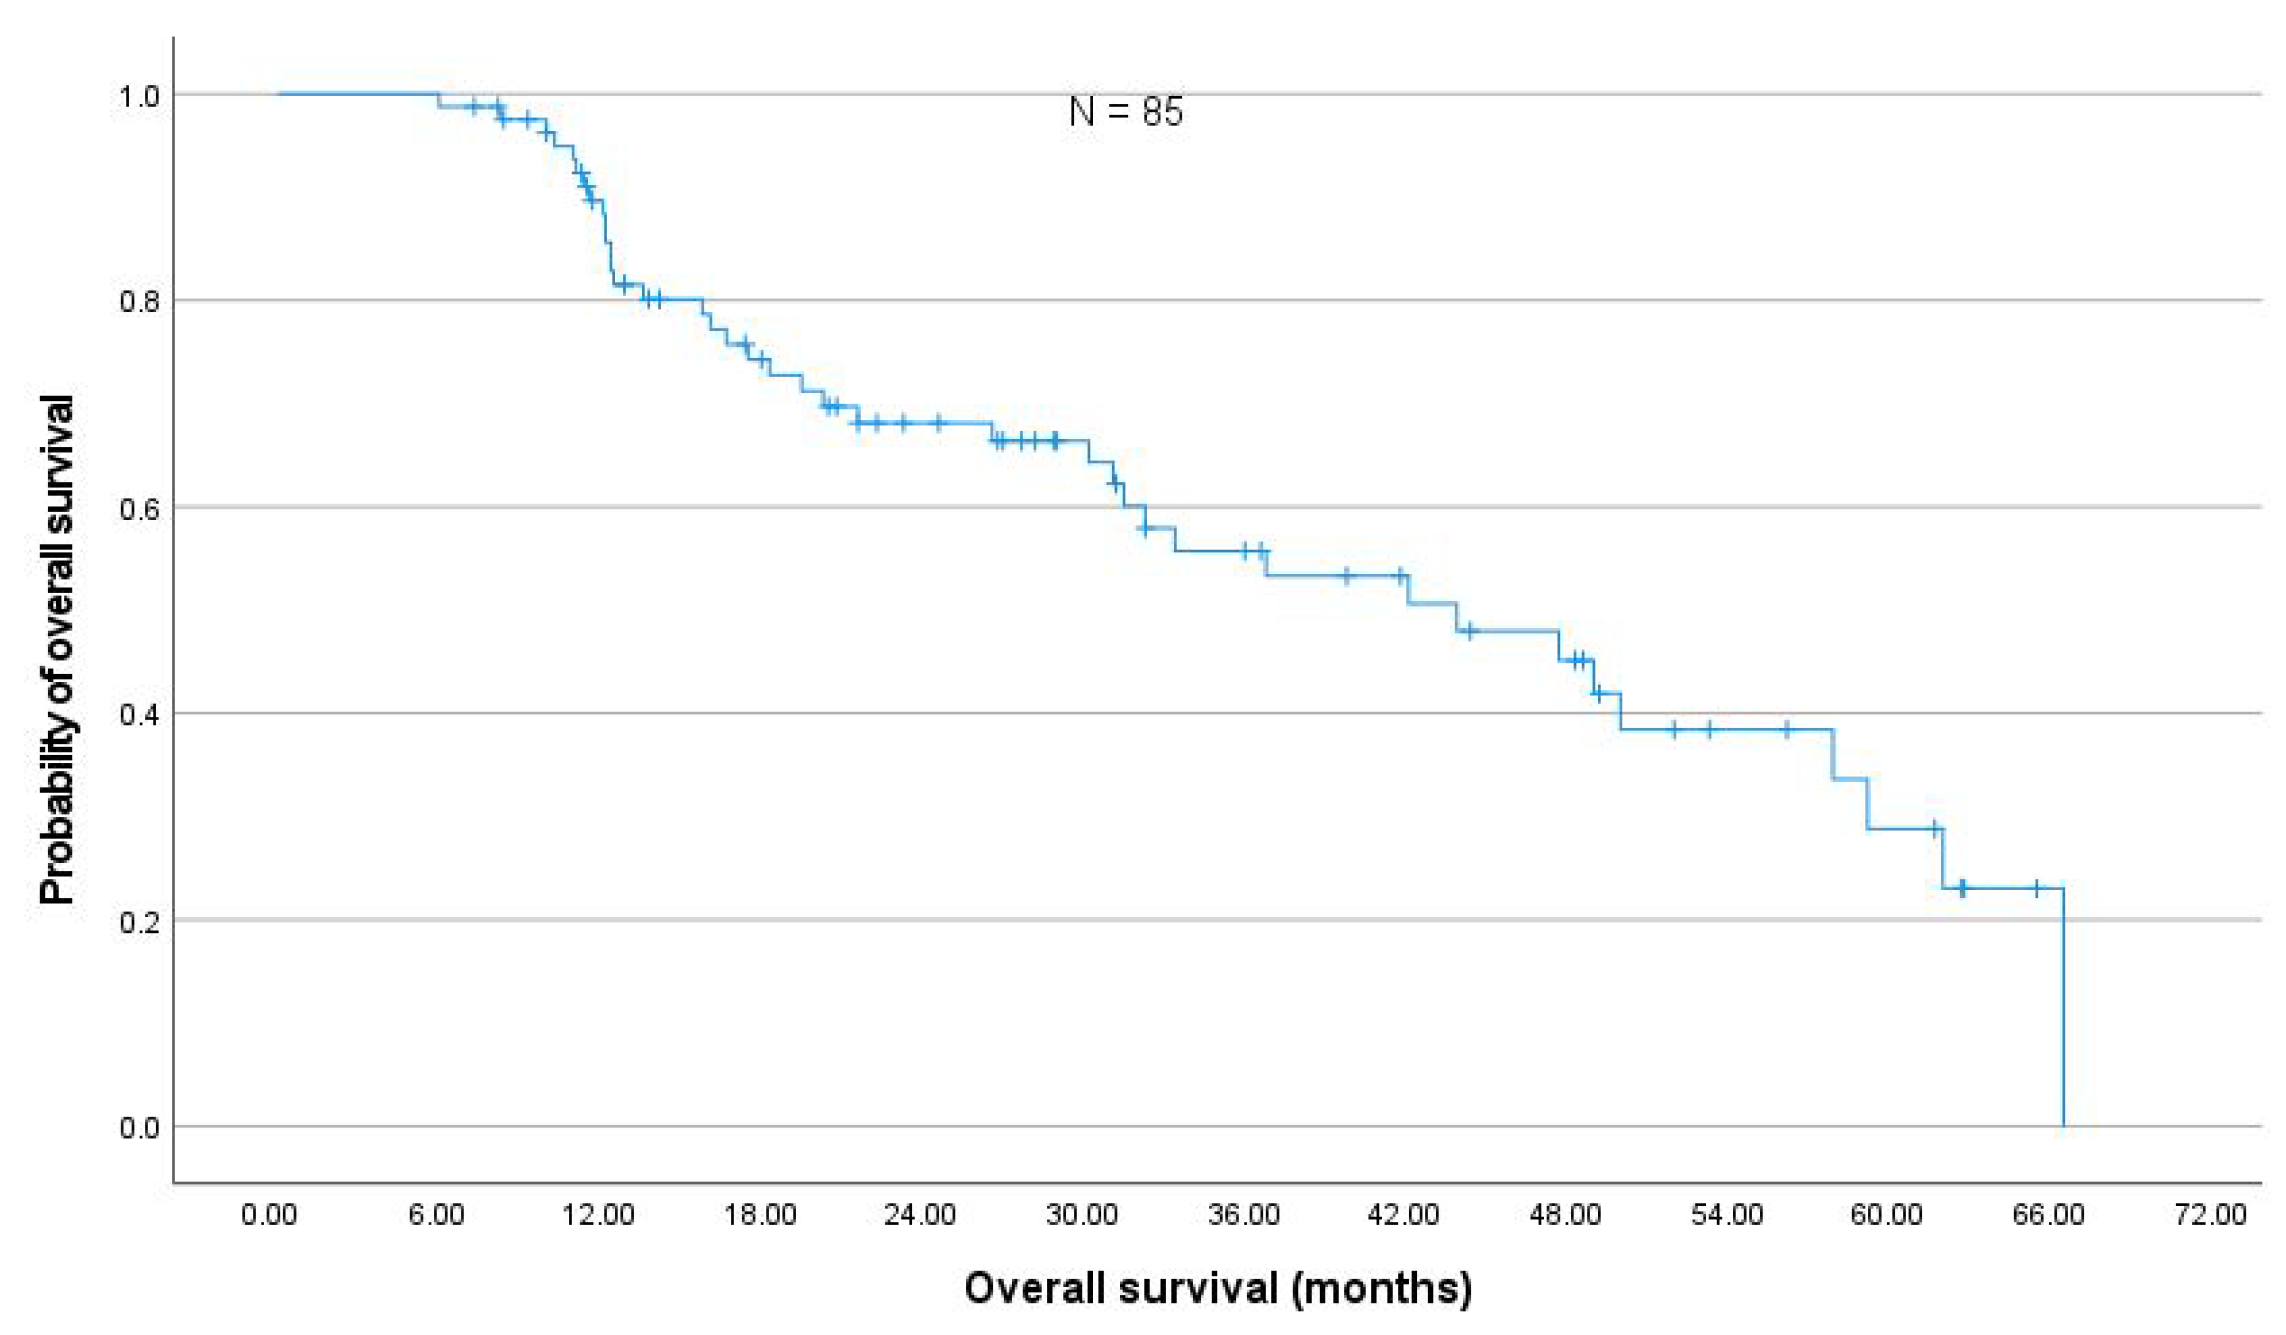
3.3. Local Control, Progression Free and Overall Survival
3.4. Toxicity
3.5. DL Correlates with V
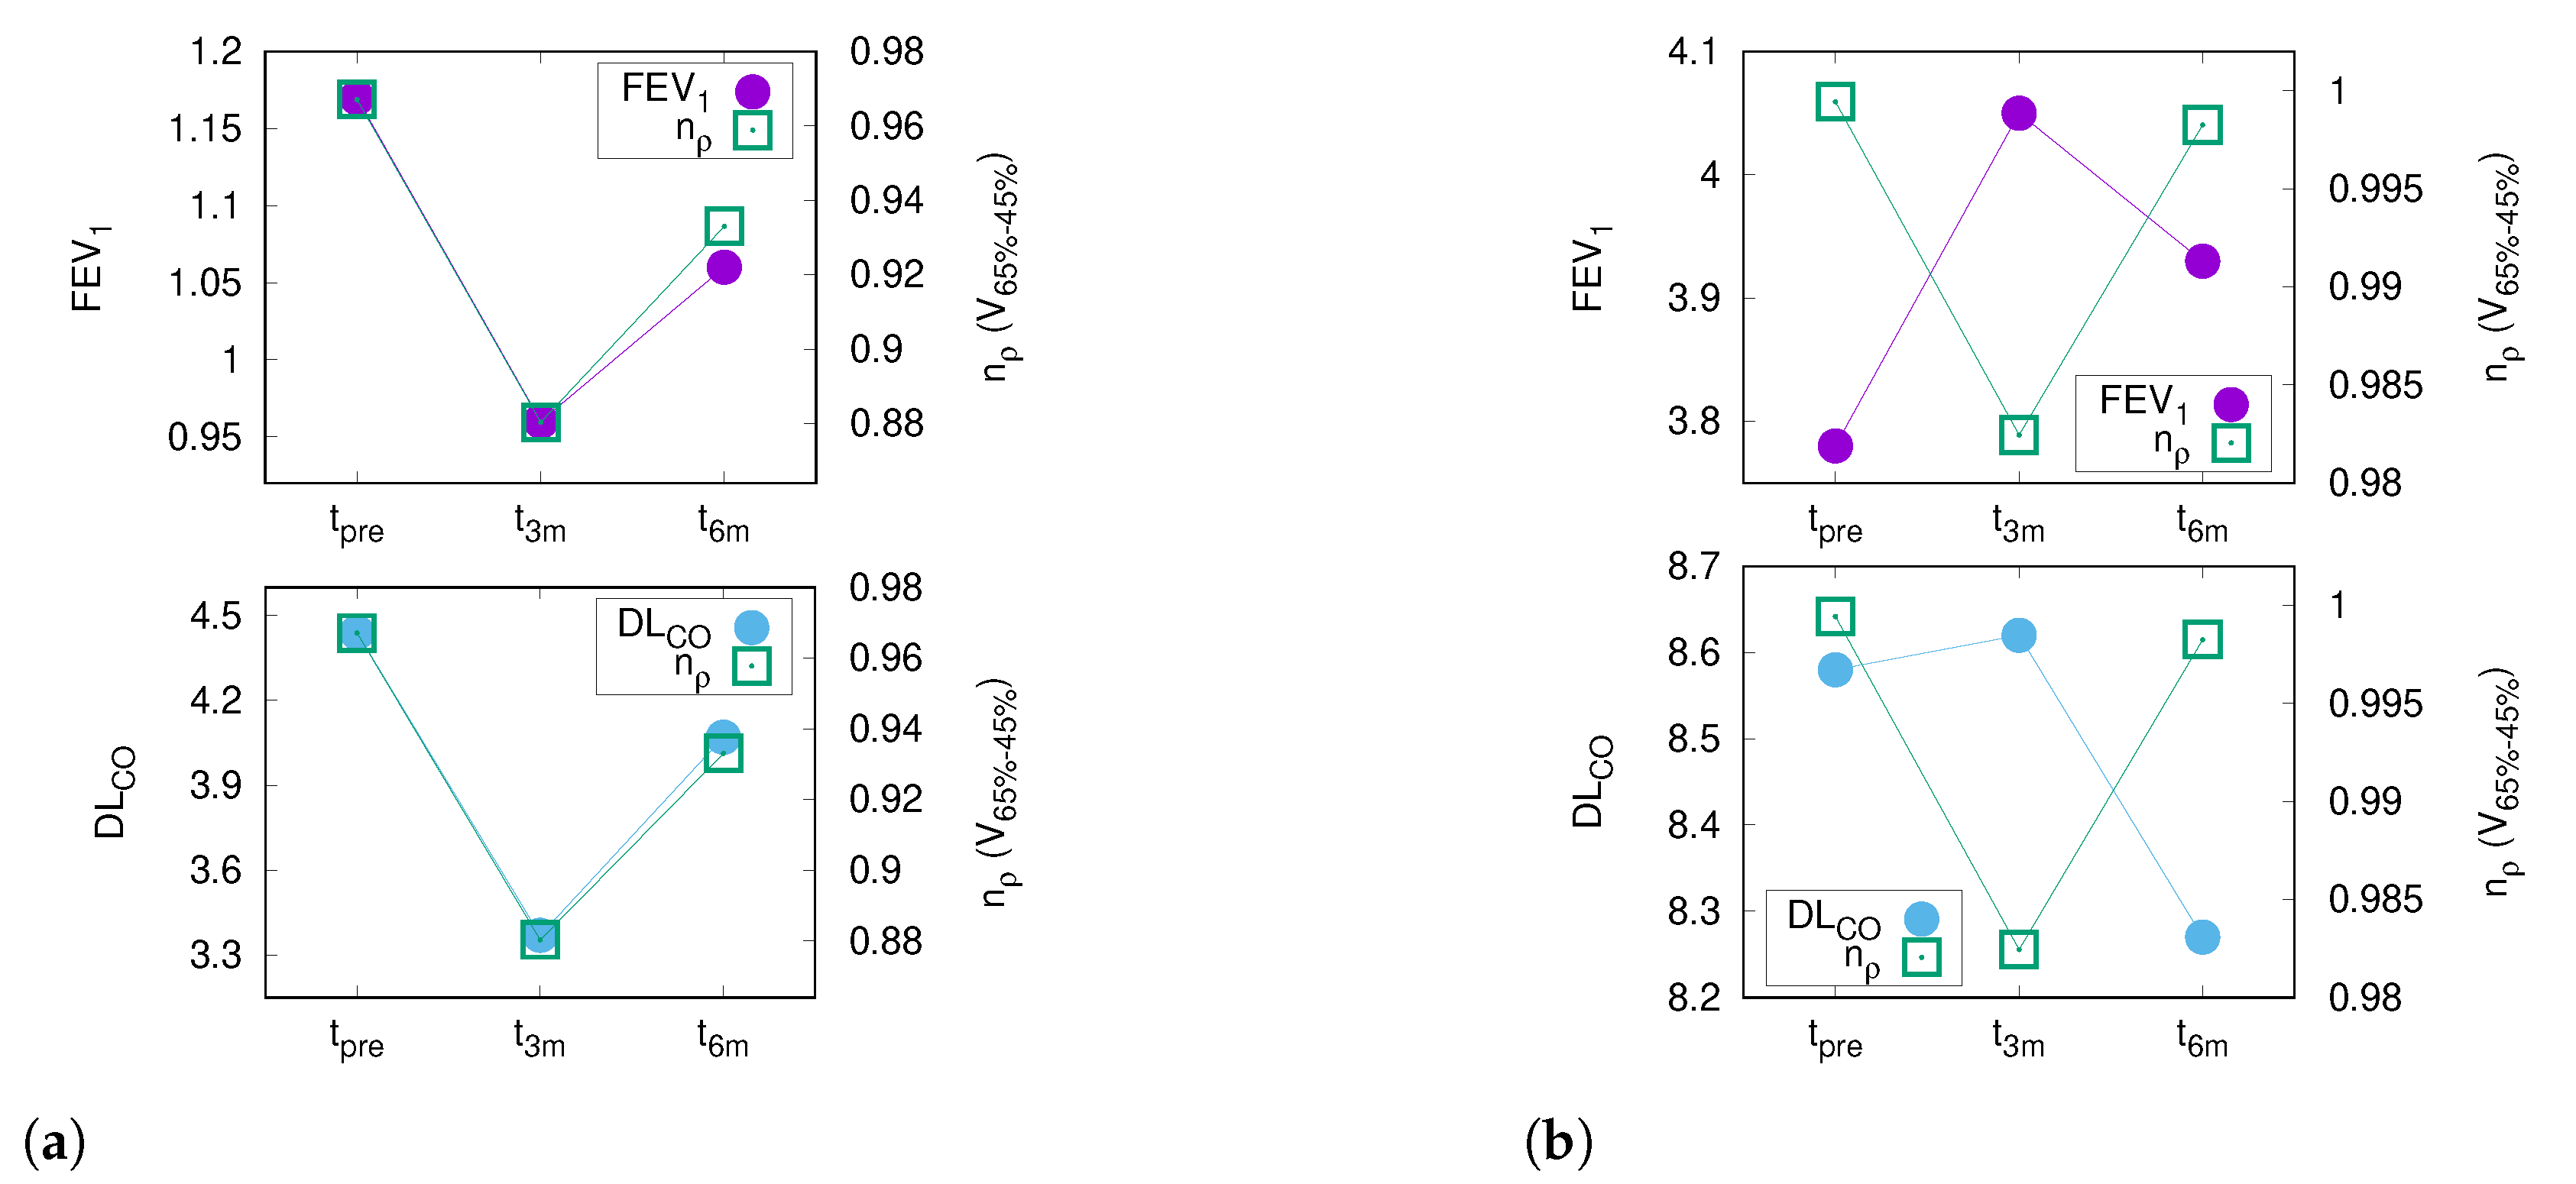
3.6. PFT and CT Density Changes after RT
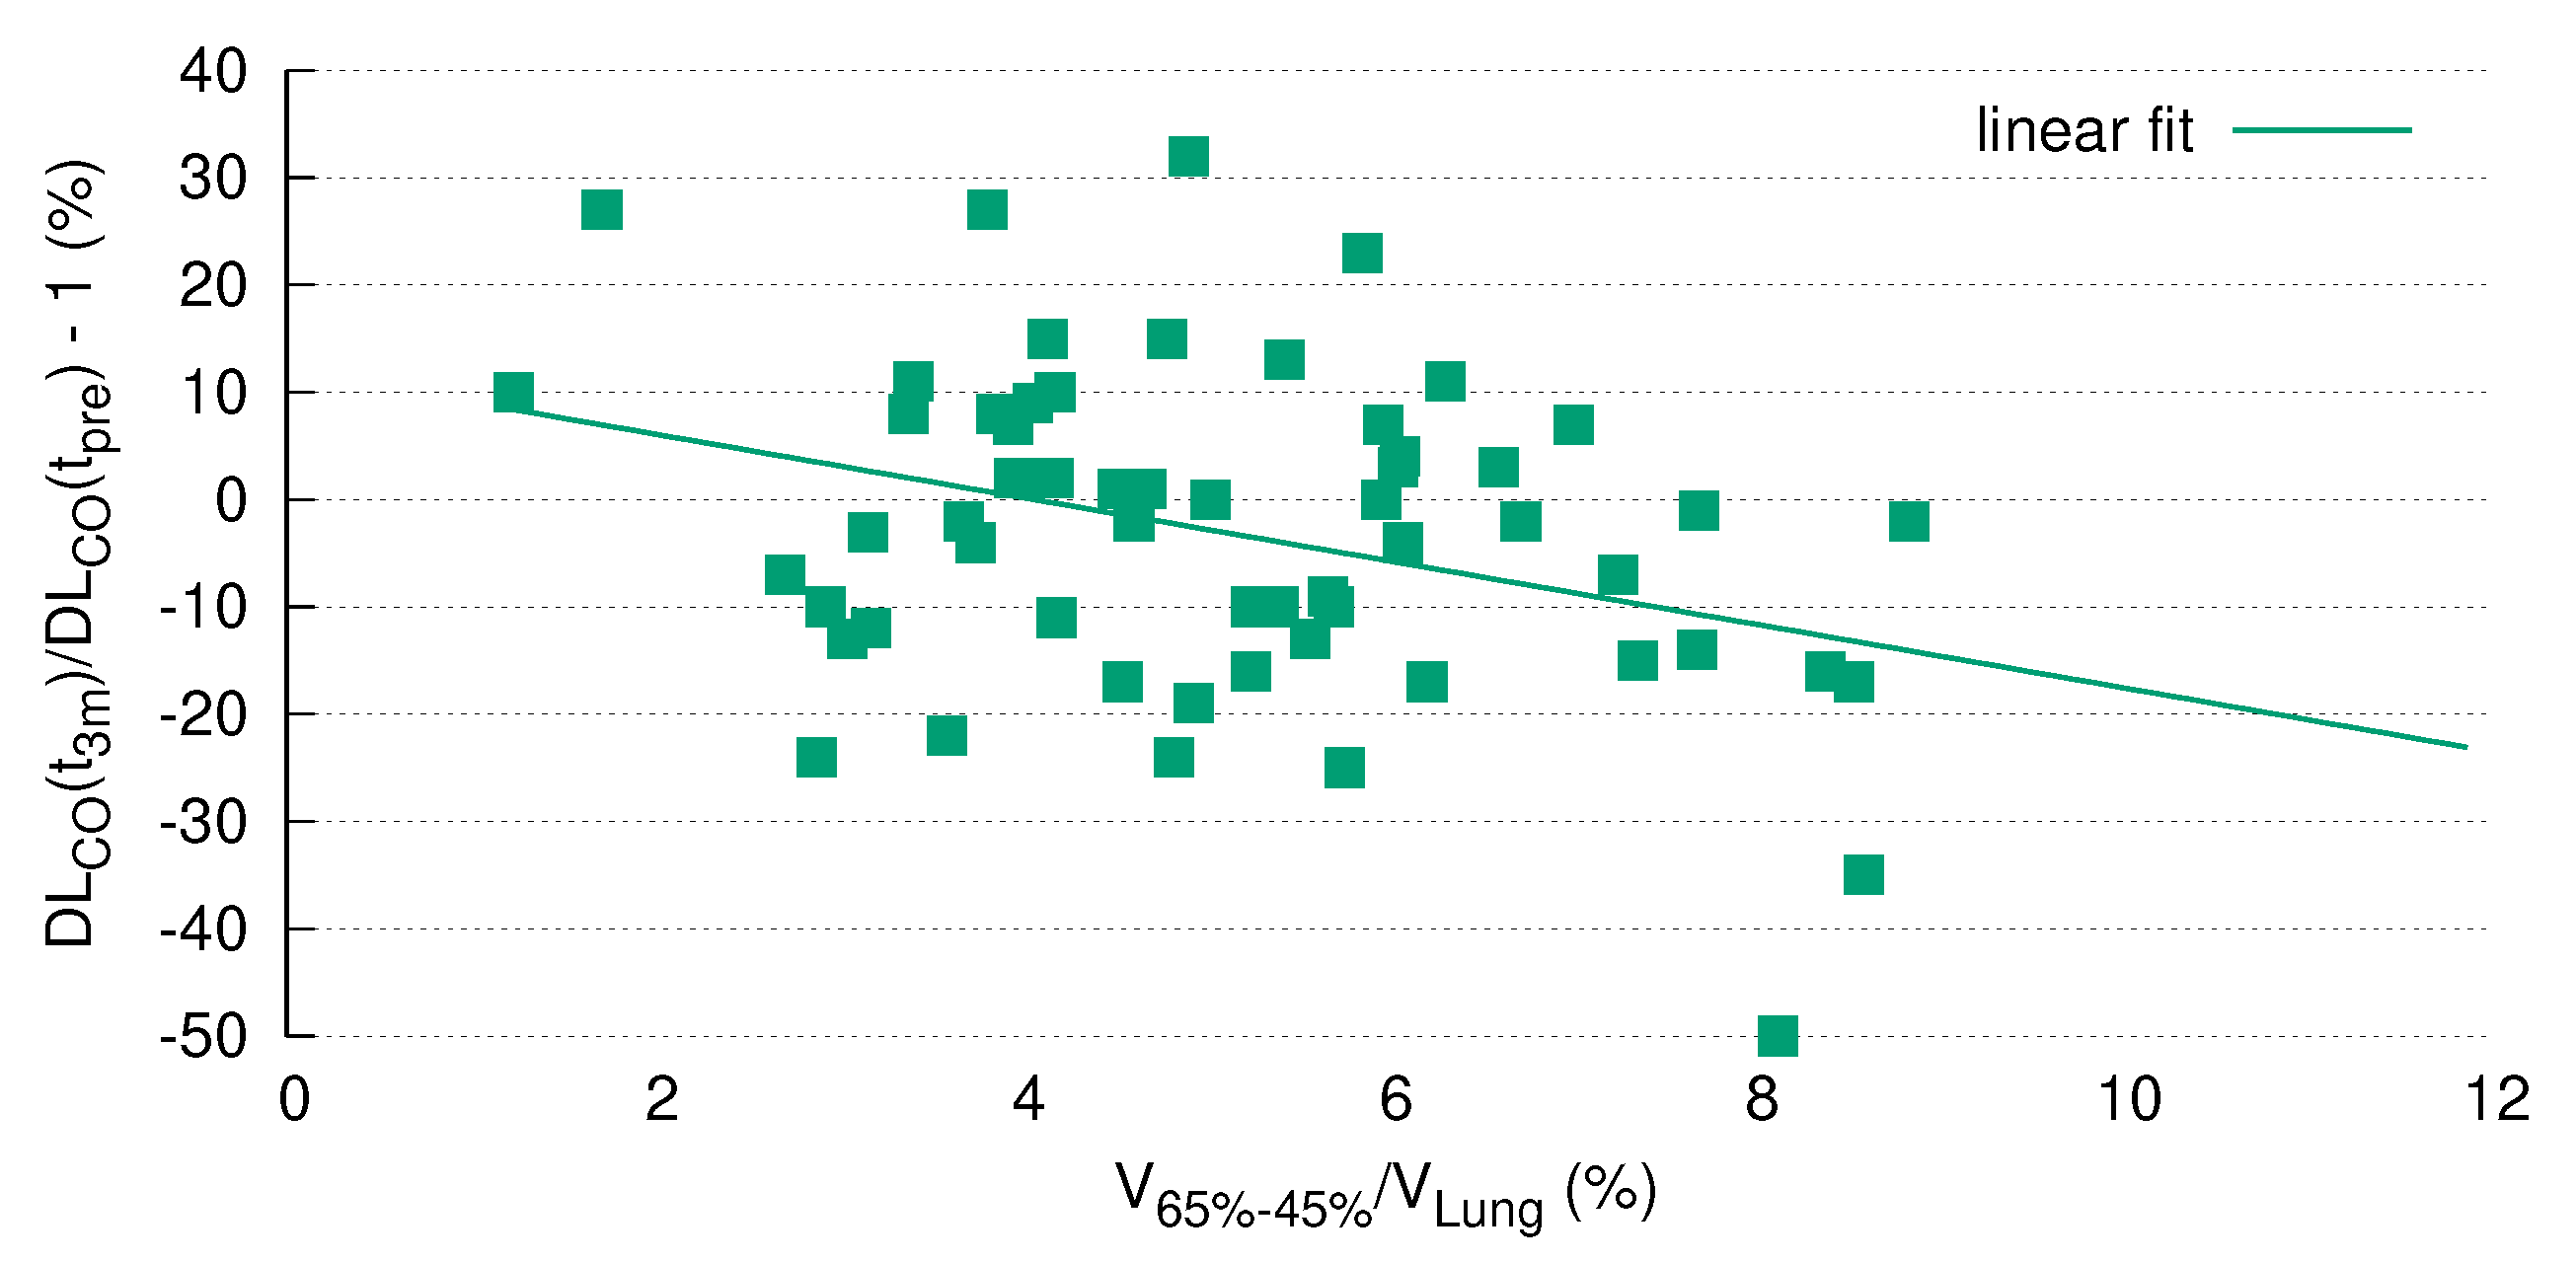
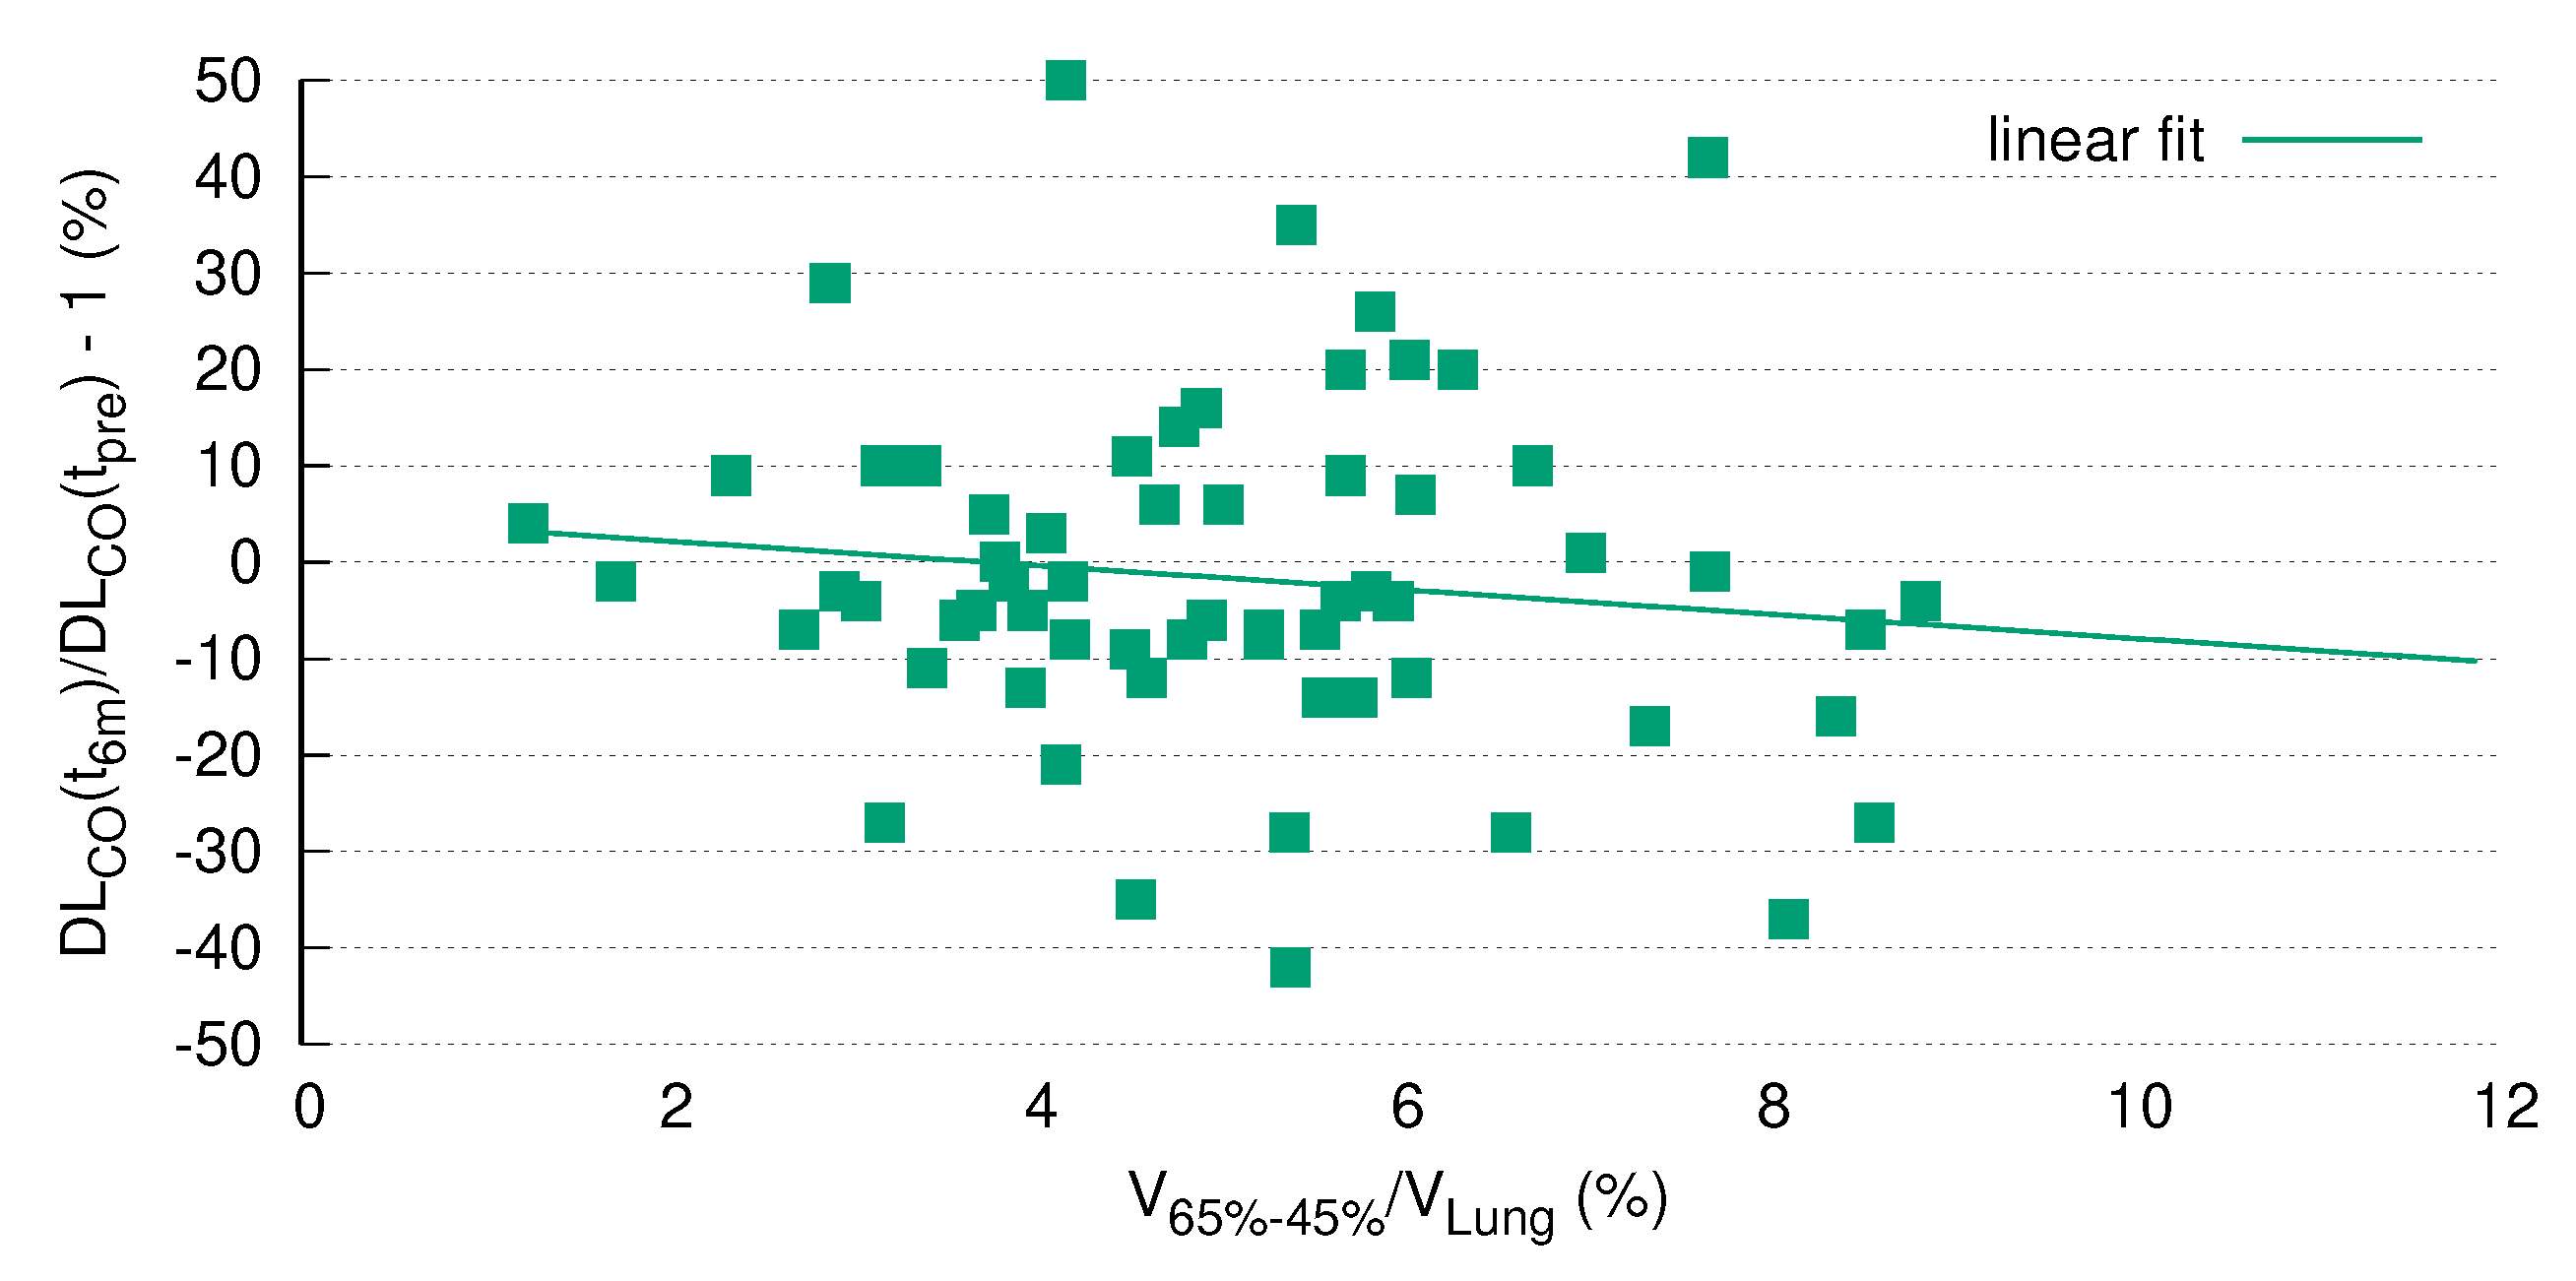
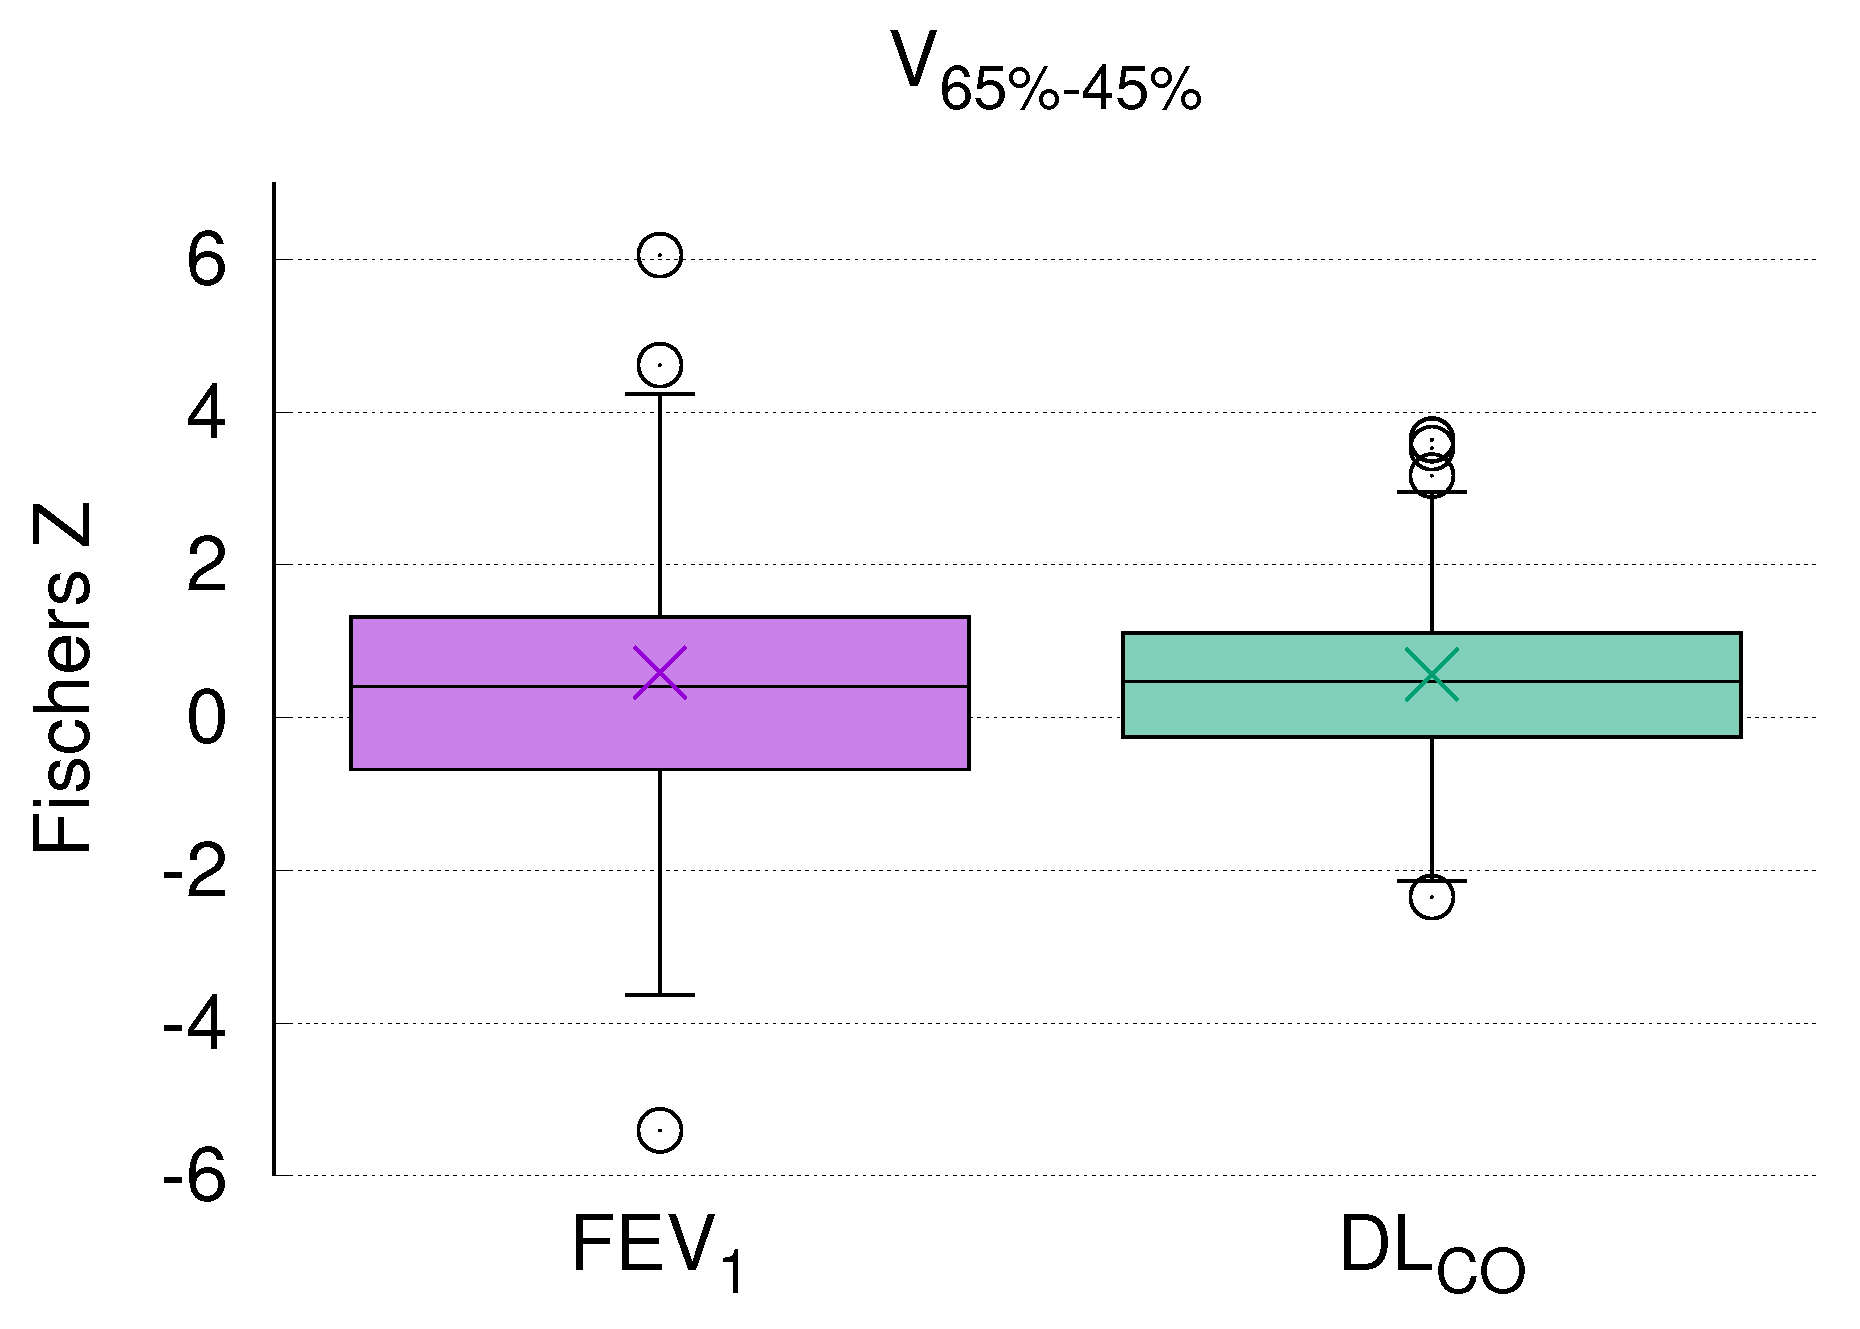
3.7. DL after RT Is Predicted by V
4. Discussion
5. Conclusions
Author Contributions
Funding
Institutional Review Board Statement
Informed Consent Statement
Data Availability Statement
Conflicts of Interest
Abbreviations
| ANACONDA | automatically constrained deformation algorithm |
| CC | correlation coefficient |
| CCI | Charlson Comorbidity Index |
| CPFE | combined pulmonary fibrosis and emphysema |
| CTV | clinical target volume |
| CTX | chemotherapy |
| D | maximum dose |
| DART | dose-differentiated accelerated radiotherapy |
| dCT | diagnostic CT |
| DL | carbon monoxide diffusing capacity |
| EQD | biologically equivalent dose in 2 Gy fractions |
| FDR | false discovery rate |
| GTV | gross tumor volume |
| HAA | high attenuation areas |
| HU | Hounsfield unit |
| IMRT | intensity modulated radiotherapy |
| IO | immunotherapy |
| IPF | idiopathic pulmonary fibrosis |
| LAA | low attenuation areas |
| LC | local control |
| MED | mean esophageal dose |
| MLD | mean lung dose |
| MVA | multivariate analysis |
| NSCLC | non-small cell lung cancer |
| OS | overall survival |
| pCT | planning CT |
| PF | pulmonary function |
| PFS | progression free survival |
| PFT | pulmonary function test |
| PTV | planning target volume |
| RT | radiotherapy |
| three months before RT | |
| three months after the end of RT | |
| three months after the end of RT | |
| V20total_lung | volume of the lungs receiving at least 20 Gy |
| V65–45% | differential volume composed be 65% and 45%-isodose |
| VMAT | volumetric arc therapy |
Appendix A


| Pearson Correlation between DL and Relative Size of Differential Volumes | ||||||||||
|---|---|---|---|---|---|---|---|---|---|---|
| V | V | V | V | V | V | V | V | V | V | |
| Coefficient | 0.077 | −0.164 | −0.279 * | −0.270 * | −0.18 | −0.347 ** | −0.254 * | −0.358 ** | −0.340 ** | −0.232 |
| p-value | 0.54 | 0.191 | 0.024 | 0.029 | 0.152 | 0.005 | 0.042 | 0.003 | 0.006 | 0.063 |
| Pearson Correlation between DL and Relative Size of Differential Volumes | ||||||||||
|---|---|---|---|---|---|---|---|---|---|---|
| V | V | V | V | V | V | V | V | V | V | |
| Coefficient | 0.065 | −0.193 | −0.290 * | −0.243 | −0.138 | −0.341 ** | −0.219 | −0.340 ** | −0.320 * | −0.188 |
| p-value | 0.626 | 0.142 | 0.026 | 0.063 | 0.299 | 0.008 | 0.096 | 0.008 | 0.014 | 0.154 |

References
- Seppenwoolde, Y.; Lebesque, J.V.; De Jaeger, K.; Belderbos, J.S.; Boersma, L.J.; Schilstra, C.; Henning, G.T.; Hayman, J.A.; Martel, M.K.; Ten Haken, R.K. Comparing different NTCP models that predict the incidence of radiation pneumonitis. Int. J. Radiat. Oncol. Biol. Phys. 2003, 55, 724–735. [Google Scholar] [CrossRef]
- Marks, L.B.; Bentzen, S.M.; Deasy, J.O.; Bradley, J.D.; Vogelius, I.S.; El Naqa, I.; Hubbs, J.L.; Lebesque, J.V.; Timmerman, R.D.; Martel, M.K.; et al. Radiation dose–volume effects in the lung. Int. J. Radiat. Oncol. Biol. Phys. 2010, 76, S70–S76. [Google Scholar] [CrossRef] [PubMed] [Green Version]
- Tucker, S.L.; Liu, A.; Gomez, D.; Tang, L.L.; Allen, P.; Yang, J.; Liao, Z.; Grosshans, D. Impact of heart and lung dose on early survival in patients with non-small cell lung cancer treated with chemoradiation. Radiother. Oncol. 2016, 119, 495–500. [Google Scholar] [CrossRef] [PubMed]
- Ma, J.; Zhang, J.; Zhou, S.; Hubbs, J.L.; Foltz, R.J.; Hollis, D.R.; Light, K.L.; Wong, T.Z.; Kelsey, C.R.; Marks, L.B. Regional lung density changes after radiation therapy for tumors in and around thorax. Int. J. Radiat. Oncol. Biol. Phys. 2010, 76, 116–122. [Google Scholar] [CrossRef]
- Niezink, A.G.; de Jong, R.A.; Muijs, C.T.; Langendijk, J.A.; Widder, J. Pulmonary function changes after radiotherapy for lung or esophageal cancer: A systematic review focusing on dose-volume parameters. Oncologist 2017, 22, 1257. [Google Scholar] [CrossRef] [Green Version]
- Guckenberger, M.; Andratschke, N.; Dieckmann, K.; Hoogeman, M.S.; Hoyer, M.; Hurkmans, C.; Tanadini-Lang, S.; Lartigau, E.; Romero, A.M.; Senan, S.; et al. ESTRO ACROP consensus guideline on implementation and practice of stereotactic body radiotherapy for peripherally located early stage non-small cell lung cancer. Radiother. Oncol. 2017, 124, 11–17. [Google Scholar] [CrossRef] [Green Version]
- Ma, J.; Zhang, J.; Zhou, S.; Hubbs, J.L.; Foltz, R.J.; Hollis, D.R.; Light, K.L.; Wong, T.Z.; Kelsey, C.R.; Marks, L.B. Association between RT-induced changes in lung tissue density and global lung function. Int. J. Radiat. Oncol. Biol. Phys. 2009, 74, 781–789. [Google Scholar] [CrossRef] [Green Version]
- Kishan, A.U.; Wang, P.C.; Sheng, K.; Yu, V.; Ruan, D.; Cao, M.; Tenn, S.; Low, D.A.; Lee, P. Correlation of clinical and dosimetric parameters with radiographic lung injury following stereotactic body radiotherapy. Technol. Cancer Res. Treat. 2015, 14, 411–418. [Google Scholar] [CrossRef] [Green Version]
- Borst, G.R.; De Jaeger, K.; Belderbos, J.S.; Burgers, S.A.; Lebesque, J.V. Pulmonary function changes after radiotherapy in non–small-cell lung cancer patients with long-term disease-free survival. Int. J. Radiat. Oncol. Biol. Phys. 2005, 62, 639–644. [Google Scholar] [CrossRef]
- Brennan, D.; Schubert, L.; Diot, Q.; Castillo, R.; Castillo, E.; Guerrero, T.; Martel, M.K.; Linderman, D.; Gaspar, L.E.; Miften, M.; et al. Clinical validation of 4-dimensional computed tomography ventilation with pulmonary function test data. Int. J. Radiat. Oncol. Biol. Phys. 2015, 92, 423–429. [Google Scholar] [CrossRef] [Green Version]
- Palma, D.A.; De Koste, J.V.S.; Verbakel, W.F.; Vincent, A.; Senan, S. Lung density changes after stereotactic radiotherapy: A quantitative analysis in 50 patients. Int. J. Radiat. Oncol. Biol. Phys. 2011, 81, 974–978. [Google Scholar] [CrossRef] [PubMed]
- Hübner, R.H.; Gitter, W.; Eddine El Mokhtari, N.; Mathiak, M.; Both, M.; Bolte, H.; Freitag-Wolf, S.; Bewig, B. Standardized quantification of pulmonary fibrosis in histological samples. Biotechniques 2008, 44, 507–517. [Google Scholar] [CrossRef] [PubMed]
- Ghobadi, G.; Hogeweg, L.E.; Faber, H.; Tukker, W.G.; Schippers, J.M.; Brandenburg, S.; Langendijk, J.A.; Coppes, R.P.; van Luijk, P. Quantifying local radiation-induced lung damage from computed tomography. Int. J. Radiat. Oncol. Biol. Phys. 2010, 76, 548–556. [Google Scholar] [CrossRef] [PubMed]
- Grambozov, B.; Wolf, F.; Kaiser, J.; Wass, R.; Fastner, G.; Gaisberger, C.; Rettenbacher, L.; Studnicka, M.; Pirich, C.; Sedlmayer, F.; et al. Pulmonary function decreases moderately after accelerated high-dose irradiation for stage III non-small cell lung cancer. Thorac. Cancer 2020, 11, 369–378. [Google Scholar] [CrossRef]
- Graham, M.V.; Purdy, J.A.; Emami, B.; Harms, W.; Bosch, W.; Lockett, M.A.; Perez, C.A. Clinical dose–volume histogram analysis for pneumonitis after 3D treatment for non-small cell lung cancer (NSCLC). Int. J. Radiat. Oncol. Biol. Phys. 1999, 45, 323–329. [Google Scholar] [CrossRef]
- Armstrong, J.G.; Zelefsky, M.J.; Leibel, S.A.; Burman, C.; Han, C.; Harrison, L.B.; Kutcher, G.J.; Fuks, Z.Y. Strategy for dose escalation using 3-dimensional conformal radiation therapy for lung cancer. Ann. Oncol. 1995, 6, 693–697. [Google Scholar] [CrossRef]
- Antonia, S.J.; Villegas, A.; Daniel, D.; Vicente, D.; Murakami, S.; Hui, R.; Kurata, T.; Chiappori, A.; Lee, K.H.; De Wit, M.; et al. Overall survival with durvalumab after chemoradiotherapy in stage III NSCLC. N. Engl. J. Med. 2018, 379, 2342–2350. [Google Scholar] [CrossRef]
- Kadoya, N.; Nakajima, Y.; Saito, M.; Miyabe, Y.; Kurooka, M.; Kito, S.; Fujita, Y.; Sasaki, M.; Arai, K.; Tani, K.; et al. Multi-institutional validation study of commercially available deformable image registration software for thoracic images. Int. J. Radiat. Oncol. Biol. Phys. 2016, 96, 422–431. [Google Scholar] [CrossRef]
- Heremans, A.; Verschakelen, J.A.; Demedts, M. Measurement of lung density by means of quantitative CT scanning: A study of correlations with pulmonary function tests. Chest 1992, 102, 805–811. [Google Scholar] [CrossRef]
- Matsuoka, S.; Yamashiro, T.; Matsushita, S.; Kotoku, A.; Fujikawa, A.; Yagihashi, K.; Nakajima, Y. Quantitative CT evaluation in patients with combined pulmonary fibrosis and emphysema: Correlation with pulmonary function. Acad. Radiol. 2015, 22, 626–631. [Google Scholar] [CrossRef]
- Gomes, P.; e Bastos, H.N.; Carvalho, A.; Lobo, A.; Guimarães, A.; Rodrigues, R.S.; Zin, W.A.; Carvalho, A.R.S. Pulmonary Emphysema Regional Distribution and Extent Assessed by Chest Computed Tomography Is Associated With Pulmonary Function Impairment in Patients With COPD. Front. Med. 2021, 8, 705184. [Google Scholar] [CrossRef] [PubMed]
- Gagliardi, G.; Constine, L.S.; Moiseenko, V.; Correa, C.; Pierce, L.J.; Allen, A.M.; Marks, L.B. Radiation dose–volume effects in the heart. Int. J. Radiat. Oncol. Biol. Phys. 2010, 76, S77–S85. [Google Scholar] [CrossRef] [PubMed]
- Defraene, G.; La Fontaine, M.; van Kranen, S.; Reymen, B.; Belderbos, J.; Sonke, J.J.; De Ruysscher, D. Radiation-induced lung density changes on CT scan for NSCLC: No impact of dose-escalation level or volume. Int. J. Radiat. Oncol. Biol. Phys. 2018, 102, 642–650. [Google Scholar] [CrossRef] [PubMed]
- Defraene, G.; van Elmpt, W.; Crijns, W.; Slagmolen, P.; De Ruysscher, D. CT characteristics allow identification of patient-specific susceptibility for radiation-induced lung damage. Radiother. Oncol. 2015, 117, 29–35. [Google Scholar] [CrossRef]
- Palma, D.A.; Senan, S.; Tsujino, K.; Barriger, R.B.; Rengan, R.; Moreno, M.; Bradley, J.D.; Kim, T.H.; Ramella, S.; Marks, L.B.; et al. Predicting radiation pneumonitis after chemoradiation therapy for lung cancer: An international individual patient data meta-analysis. Int. J. Radiat. Oncol. Biol. Phys. 2013, 85, 444–450. [Google Scholar] [CrossRef] [Green Version]
- Cottin, V.; Nunes, H.; Brillet, P.; Delaval, P.; Devouassoux, G.; Tillie-Leblond, I.; Israel-Biet, D.; Valeyre, D.; Cordier, J.F. Combined pulmonary fibrosis and emphysema: A distinct underrecognised entity. Eur. Respir. J. 2005, 26, 586–593. [Google Scholar] [CrossRef]
- Mura, M.; Zompatori, M.; Pacilli, A.M.G.; Fasano, L.; Schiavina, M.; Fabbri, M. The presence of emphysema further impairs physiologic function in patients with idiopathic pulmonary fibrosis. Respir. Care 2006, 51, 257–265. [Google Scholar]
- Ando, K.; Sekiya, M.; Tobino, K.; Takahashi, K. Relationship between quantitative CT metrics and pulmonary function in combined pulmonary fibrosis and emphysema. Lung 2013, 191, 585–591. [Google Scholar] [CrossRef]


| Patients N = 85 | ||
|---|---|---|
| Age (years) | median | 66 |
| range | 46–81 | |
| Sex | male | 59 (69%) |
| female | 26 (31%) | |
| Weight loss (%) | >5% | 9 (11%) |
| <5% | 76 (89%) | |
| ECOG | 0–1 | 83 (98%) |
| 2 | 2 (2%) | |
| Smoking status | ex | 47 (55%) |
| current | 27 (32% | |
| never | 9 (11%) | |
| unknown | 2 (2%) | |
| Histology | NSCLC | 85 (100%) |
| unknown | 0 (0%) | |
| N-stage | 0 | 2 (2%) |
| 1 | 7 (8%) | |
| 2 | 57 (68%) | |
| 3 | 18 (22%) | |
| UICC | III | 85 (100%) |
| FEV (L) | median | 2.2 |
| range | 0.8–3.8 | |
| DLCOc (mmol/min*kPa) | median | 5.3 |
| range | 1.4–11.0 | |
| COPD grade | 0 | 46 (54%) |
| 1 | 6 (7%) | |
| 2 | 18 (21%) | |
| 3 | 12 (14%) | |
| 4 | 4 (5%) | |
| unknown | 0 (0%) | |
| CCI | median | 5 |
| range | 2–9 | |
| Treatment | ||
| GTV (ml) | median | 19 |
| range | 0.3–308 | |
| Tumor location (n) | peripheral | 44 (52%) |
| central | 41 (48%) | |
| RT technique (n) | IMRT | 52 (61%) |
| VMAT | 33 (39%) | |
| Systemic therapy (n) | CTX | 22 (26%) |
| CTX + IO | 63 (74%) | |
| MLD (Gy) | median | 12.2 |
| range | 7–18 | |
| V20total_lung (%) | median | 21% |
| range | 9–35% | |
| MED (Gy) | median | 21 |
| range | 7.5–34 | |
| EQD (Gy) | median | 72.3 |
| range | 58.3–88.2 | |
| Toxicity (N = 85) | ||||||
|---|---|---|---|---|---|---|
| Type of toxicity | Grade 1 | Grade 2 | Grade 3 | Grade 4 | Grade 5 | |
| Acute | Esophagus | n.a. | 11 (13%) | 7 (8%) | 0 | 0 |
| Lung | n.a. | 8 (9%) | 3 (4%) | 0 | 0 | |
| Late | Esophagus | n.a. | 0 | 0 | 0 | 0 |
| Lung | n.a. | 0 | 0 | 0 | 0 | |
| Heart | n.a. | 0 | 0 | 0 | 2 (2%) | |
| Isodose | Lower Dose | ||||||||||||||||||||
|---|---|---|---|---|---|---|---|---|---|---|---|---|---|---|---|---|---|---|---|---|---|
| Volume | 95% | 85% | 75% | 65% | 55% | 45% | 35% | 25% | 15% | 5% | |||||||||||
| higher dose | max | ||||||||||||||||||||
| 95% | |||||||||||||||||||||
| 85% | |||||||||||||||||||||
| 75% | |||||||||||||||||||||
| 65% | |||||||||||||||||||||
Publisher’s Note: MDPI stays neutral with regard to jurisdictional claims in published maps and institutional affiliations. |
© 2022 by the authors. Licensee MDPI, Basel, Switzerland. This article is an open access article distributed under the terms and conditions of the Creative Commons Attribution (CC BY) license (https://creativecommons.org/licenses/by/4.0/).
Share and Cite
Stana, M.; Grambozov, B.; Gaisberger, C.; Karner, J.; Ruznic, E.; Berchtold, J.; Zellinger, B.; Moosbrugger, R.; Studnicka, M.; Fastner, G.; et al. Carbon Monoxide Diffusing Capacity (DLCO) Correlates with CT Morphology after Chemo-Radio-Immunotherapy for Non-Small Cell Lung Cancer Stage III. Diagnostics 2022, 12, 1027. https://doi.org/10.3390/diagnostics12051027
Stana M, Grambozov B, Gaisberger C, Karner J, Ruznic E, Berchtold J, Zellinger B, Moosbrugger R, Studnicka M, Fastner G, et al. Carbon Monoxide Diffusing Capacity (DLCO) Correlates with CT Morphology after Chemo-Radio-Immunotherapy for Non-Small Cell Lung Cancer Stage III. Diagnostics. 2022; 12(5):1027. https://doi.org/10.3390/diagnostics12051027
Chicago/Turabian StyleStana, Markus, Brane Grambozov, Christoph Gaisberger, Josef Karner, Elvis Ruznic, Johannes Berchtold, Barbara Zellinger, Raphaela Moosbrugger, Michael Studnicka, Gerd Fastner, and et al. 2022. "Carbon Monoxide Diffusing Capacity (DLCO) Correlates with CT Morphology after Chemo-Radio-Immunotherapy for Non-Small Cell Lung Cancer Stage III" Diagnostics 12, no. 5: 1027. https://doi.org/10.3390/diagnostics12051027
APA StyleStana, M., Grambozov, B., Gaisberger, C., Karner, J., Ruznic, E., Berchtold, J., Zellinger, B., Moosbrugger, R., Studnicka, M., Fastner, G., Sedlmayer, F., & Zehentmayr, F. (2022). Carbon Monoxide Diffusing Capacity (DLCO) Correlates with CT Morphology after Chemo-Radio-Immunotherapy for Non-Small Cell Lung Cancer Stage III. Diagnostics, 12(5), 1027. https://doi.org/10.3390/diagnostics12051027