Article

Impact of Different Cell Counting Methods in Molecular Monitoring of Chronic Myeloid Leukemia Patients

by
Stefania Stella
1,2,*,†,
Silvia Rita Vitale
1,2,†,
Fabio Stagno
3,†,
Michele Massimino
1,2,
Adriana Puma
1,2,
Cristina Tomarchio
1,2,
Maria Stella Pennisi
1,2,
Elena Tirrò
2,4,
Chiara Romano
1,2,
Francesco Di Raimondo
3,5,
Emma Cacciola
6,7,
Rossella Cacciola
1,7,‡ and
Livia Manzella
1,2,‡
1
Department of Clinical and Experimental Medicine, University of Catania, 95123 Catania, Italy
2
Center of Experimental Oncology and Hematology, A.O.U. Policlinico “G.Rodolico-San Marco”, 95123 Catania, Italy
3
Division of Hematology and Bone Marrow Transplant, A.O.U. Policlinico “G.Rodolico-San Marco”, 95123 Catania, Italy
4
Department of Surgical, Oncological and Stomatological Sciences, University of Palermo, 90127 Palermo, Italy
5
Department of Surgery, Medical and Surgical Specialities, Section of Hematology, University of Catania, 95123 Catania, Italy
6
Department of Medical, Surgical Sciences and Advanced Technologies “G.F. Ingrassia”, University of Catania, 95123 Catania, Italy
7
Hemostasis/Hematology Unit, A.O.U. Policlinico “G.Rodolico-San Marco”, 95123 Catania, Italy
*
Author to whom correspondence should be addressed.
These authors contributed equally to this work.
Diagnostics 2022, 12(5), 1051; https://doi.org/10.3390/diagnostics12051051
Submission received: 2 April 2022 / Revised: 14 April 2022 / Accepted: 21 April 2022 / Published: 22 April 2022
(This article belongs to the Section Pathology and Molecular Diagnostics)

Abstract

:
Background: Detection of BCR-ABL1 transcript level via real-time quantitative-polymerase-chain reaction (Q-PCR) is a clinical routine for disease monitoring, assessing Tyrosine Kinase Inhibitor therapy efficacy and predicting long-term response in chronic myeloid leukemia (CML) patients. For valid Q-PCR results, each stage of the laboratory procedures need be optimized, including the cell-counting method that represents a critical step in obtaining g an appropriate amount of RNA and reliable Q-PCR results. Traditionally, manual or automated methods are used for the detection and enumeration of white blood cells (WBCs). Here, we compared the performance of the manual counting measurement to the flow cytometry (FC)-based automatic counting assay employing CytoFLEX platform. Methods: We tested five different types of measurements: one manual hemocytometer-based count and four FC-based automatic cell-counting methods, including absolute, based on beads, based on 7-amino actinomycin D, combining and associating beads and 7AAD. The recovery efficiency for each counting method was established considering the quality and quantity of total RNA isolated and the Q-PCR results in matched samples from 90 adults with CML. Results: Our analyses showed no consistent bias between the different types of measurements, with comparable number of WBCs counted for each type of measurement. Similarly, we observed a 100% concordance in the amount of RNA extracted and in the Q-PCR cycle threshold values for both BCR-ABL1 and ABL1 gene transcripts in matched counted specimens from all the investigated groups. Overall, we show that FC-based automatic absolute cell counting has comparable performance to manual measurements and allows accurate cell counts without the use of expensive beads or the addition of the time-consuming intercalator 7AAD. Conclusions: This automatic method can replace the more laborious manual workflow, especially when high-throughput isolations from blood of CML patients are needed.

1. Introduction

Chronic Myeloid Leukemia (CML) is a hematological disorder characterized by the neoplastic transformation of a hematopoietic stem cell carrying the Philadelphia (Ph) chromosome that juxtaposes the breakpoint cluster region (BCR) and the Abelson1 (ABL1) genes [1,2,3]. The ensuing Ph chromosome, at the molecular level, leads to the formation of the BCR-ABL1 fusion oncogene encoding for multi-domain BCR-ABL1 oncoproteins with constitutive tyrosine kinase activity that induces aberrant activation of several intracellular pathways driving malignant transformation [4,5,6].
Over the past 20 years, the development of BCR-ABL1 tyrosine kinase inhibitors (TKIs) has significantly improved the outcomes of most CML patients, generating unprecedent rates of complete hematological (CHR), cytogenetic (CCyR) and molecular (MR) responses [7,8,9,10]. Despite these excellent results, around 30–50% of CML patients failed to achieve an optimal response (OR) as defined by the current European Leukemia Net (ELN) recommendations [11,12]. In this context, the identification of a resistance mechanism becomes critical to defining the management of this group of individuals, eligible to switch to another TKI [13,14,15,16]. At the same time, patients with persistent deep molecular response, after TKIs discontinuation, may be considered for treatment free-remission (TFR) [17,18,19]. On the bases of this observation a workflow generating high quality molecular data is mandatory for therapeutic decision-making.
In the current clinical practice, the quantitative polymerase chain reaction (Q-PCR) is the “gold standard” for diagnostic BCR-ABL1 transcript monitoring [20,21,22,23]. Overall, the evaluation of BCR-ABL1 oncogene transcript should be performed every 3 months after TKI therapy initiation, then at least every 3–6 months. For valid Q-PCR data, standardization of each stage of the laboratory procedures is mandatory, including the amount of blood collected, the method for measuring total white blood cells (WBCs), and RNA isolations [24,25,26,27]. Particularly, the quantity of isolated WBCs and total RNA extracted are indispensable requisites for the accuracy and reproducibility of Q-PCR analyses. To this purpose, cell-counting measurement represents a critical step. Despite its common use, counting of cells with high accuracy and precision often remains an issue. An error in cell counting will propagate through subsequent procedures and will affect the overall quality and quantity of BCR-ABL1 and ABL1 gene transcripts.
The considerable burden of work for molecular laboratories necessitates the development of a high-throughput method for a fast, reproducible, and efficient counting assay. Traditionally, manual counting-chambers or automated methods are used for the detection and enumeration of cells. Although the traditional way of counting cells manually, by hemocytometer, is very simple and straightforward, it is often error-prone, time-consuming, and highly subjective. For example, a wrong dilution or wrong samples may result in inappropriate volumes and concentrations of cells. Therefore, an ideal cell counting method should be accurate as well as repeatable, with low variability attributed to operator error [28]. Due to the ability to analyze single cells or particles of different sizes, flow cytometry is particularly suited to cell counting. Common methods require the use of external calibrator beads of known concentration that are spiked into the sample. However, this counting measurement can lead to an over-estimation of the sample concentration. Moreover, counting beads are quite expensive and increase the cost of the assay, particularly when a large number of samples should be processed. Another counting method is based on the use of the fluorescent DNA binding agent, 7-amino actinomycin D (7AAD), able to define dead and live populations by flow cytometry.
The purpose of this study was to compare the traditional manual counting method to the automatic counting assay based on the CytoFLEX instrument for their ability to measure white blood cells from peripheral blood (PB) of CML patients. In the automatic method, we investigated four different types of measurements: absolute cell-counting, a measurement based on beads, cell counting with the use of 7AAD day, and a combined method including counting beads and 7AAD. Our analyses focused on both qualitative and quantitative parameters, including total amount of WBCs, RNA recovery efficiency, and quantification of BCR-ABL1 and ABL1 gene transcript levels from matched samples of CML patients.

2. Materials and Methods

2.1. Patient Selection

The research study was carried out at the “Center of Experimental Oncology and Hematology” of the A.O.U. Policlinico “G. Rodolico-San Marco” of Catania. Between May 2021 and December 2021, peripheral blood samples from 90 adults’ chronic phase CML (CP-CML) patients were collected and analyzed for molecular monitoring of CML in our Molecular Diagnostic laboratory. Blood samples collection was conducted in accordance with the Declaration of Helsinki. All patients gave written informed consent prior to participation.
All patients received a TKI (TKI: imatinib brand or generic, dasatinib, nilotinib or bosutinib) as first-line treatment. Treatment response was assessed according to the 2020 ELN criteria [12].

2.2. Blood Collection and White Blood Cell Isolation

Ninety CML patients provided 28 mL of PB within a single blood draw, collected in sterile 4 × 7 mL ethylene-diamin tetra-acetic acid (EDTA) tubes (BD Vacutainer®, Becton Dickinson, Franklin Lanes, NJ, USA), according to the manufacturer’s instructions. After blood draw, blood samples were stored at room temperature and further processed within 24 h. Total WBC were isolated using the Biomek i-5 Automated Workstations integrated with the CytoFLEX Flow Cytometer (Beckman Coulter, Milano, Italia), as previously described [26]. Briefly, EDTA tubes with an Identificatory (ID) patient number were first logged in a datasheet and then loaded into the Biomeck i-5 system. Next, the whole blood was transferred to 50 mL tubes by an arm linked to a span-8 Pod. Red cells were removed by three consecutive red cell lysis treatments (10 min, 10 min and 5 min), followed by a centrifugation step (7 min @ 1800 rpm). Then, the entire white blood cells were collected in phosphate buffered saline (PBS) and a count was carried out.

2.3. White Blood Cells Count

Two count methods were investigated: the manual (A) and the automatic (B–E) methods. In the manual methods, samples were diluted and counted using a hemocytometer counting-chamber with a microscope. Next, 1 × 10⁷ cells were lysed in RLT buffer (Qiagen, Hilden, Germany), according to the manufacturers’ instructions (Figure 1). RLT lysates were stored at −80 °C until further processing.
In the automatic method, cells were loaded in a 96-well plate and cell-count was carried out in the CytoFLEX Flow Cytometer by four different types of measurements. In the first measurement (B), absolute cell-counting was performed using 200 µL of re-suspended cells in PBS buffer, as previously described [26]. The other three measurements were obtained using: (C) counting beads, (D) 7AAD solution, or (E) either counting beads and 7AAD (Figure 1). In the beads method, 100 µL counting beads were added, in a known concentration, to 100 µL of samples, mixed well and counted in the flow cytometer together with white blood cells. The absolute count of blood cells was then calculated as the product of the cell-to-bead count ratio and the concentration of counting beads. In the 7AAD measurement, a total of 10 µL fluorescent intercalator 7-AAD solution was added to 200 µL cells re-suspended in PBS and mixed. The cells were stained for 10 min at room temperature while protected from light and then loaded into the CytoFLEX Flow Cytometer. In the combined measurement, a solution with 100 µL of cells plus 100 µL of counting beads was made. Then, 10 µL of 7-AAD was added to the solution, mixed gently and incubated for 10 min at room temperature in the dark before loading into the flow cytometer. Overall, a total of 10,000 events were counted and cells present in 1 mL of PBS were calculated by reporting the results as “cell lives events/µL (V) × 1 mL”. Finally, 1 × 10⁷ cells were lysed in RLT buffer, as mentioned above. RLT lysates were stored at −80 °C until further processing.

2.4. RNA Extraction and cDNA Synthesis

Total RNA from matched samples was extracted from 1 × 10⁷ WBC lysed in RLT buffer by QIAsymphoy® technology (Qiagen, Hilden, Germany), according to the manufacturers’ instructions, and RNA was eluted in Dnase/Rnase free water, as previously reported [29].
Purified total RNA was quantified with a BioSpectrometer (Eppendorf, Hamburg, Germany) at wavelengths of A230, A260 and A280 nanometer. RNA purity was calculated by A260/280 ratio (~1.9–2.0) and A260/230 ratio (~2.0–2.2). RNA integrity was then verified by electrophoresis running samples on 1.2% denaturing agarose gels. Total RNA samples were stored at −20 °C until further use.
Complementary DNA (cDNA) was synthetized from a total of 1 µg of purified RNA using random hexamer primers (Promega, Madison, WI, USA) and moloney murine leukemia virus reverse transcriptase (Thermo Fisher, Waltham, MA, USA) enzyme, as previously reported [30].

2.5. Quantification of BCR-ABL1 and ABL1 Transcripts

The BCR-ABL1 and ABL1 gene transcript levels from matched samples were quantified using real-time PCR (Q-PCR), at the Centre of Experimental Oncology and Hematology, as previously reported [31]. The BCR-ABL1/ABL1 determination was assessed according to the international scale (IS), and calculated by ratio of BCR-ABL1 and ABL1 transcript levels. This value was expressed as percentage on a log scale and using a conversion factor (CF) calculated every year, as previously described [32]. The Q-PCR determinations were considered of appropriate quality only in the presence of no less than 10,000 ABL1 copies [32,33,34]. Quantitative analysis of RNA isolated from matched samples was assessed comparing the cycle threshold (Ct) values achieved by Q-PCR for both BCR-ABL1 and ABL1 genes.

2.6. Software and Statistical Analyses

Cell count was performed using the CytoFLEX Flow Cytometer and the data analyzed employing CytExpert program (version 2.2.0.97—Beckman Coulter, Inc., Brea, CA, USA). The t-test was used to compare the difference between matched samples obtained with the five counting methods. Difference in number of white blood cells and Ct values (for BCR-ABL1 and ABL1 genes) were calculated and a p value below 0.05 was considered statistically significant. To evaluate the bias between the mean differences of the methods and to estimate an agreement interval within 95% interval, a Bland-Altman plot was used. For both t-test and Bland-Altman plot, Prism software v. 8.4 was employed.

3. Results

3.1. Patient Characteristics

Patient characteristics are summarized in Table 1. The median age of the accrued population was 63 years old (range 25–82) and median follow up was 60 months (range 5–105). Of total patients, 58.9% were male while 41.1% were female. The median leukocyte count was 9.85 × 10⁹/L (range 6.20–20.8) and the median of hemoglobin was 12.5 g/dL (range 10.8–14.5). Thirty-four patients showed an e13a2 (b2a2) BCR-ABL1 fusion transcript, 48 subjects showed an e14a2 (b3a2) BCR-ABL1 rearrangement and eight exhibited both e13a2 and e14a2 isoforms. According to BCR-ABL1IS transcript levels, we selected patients with a molecular response distributed in three groups of 30 subjects each: Group A (10% > BCR-ABL1/ABL1IS > 1%), Group B (1% ≥ BCR-ABL1/ABL1IS > 0.1%) and Group C (0.1% ≥ BCR-ABL1/ABL1IS > 0.01%).

3.2. Comparison of Count Efficiency and RNA Isolation by Five Different Measurement Methods

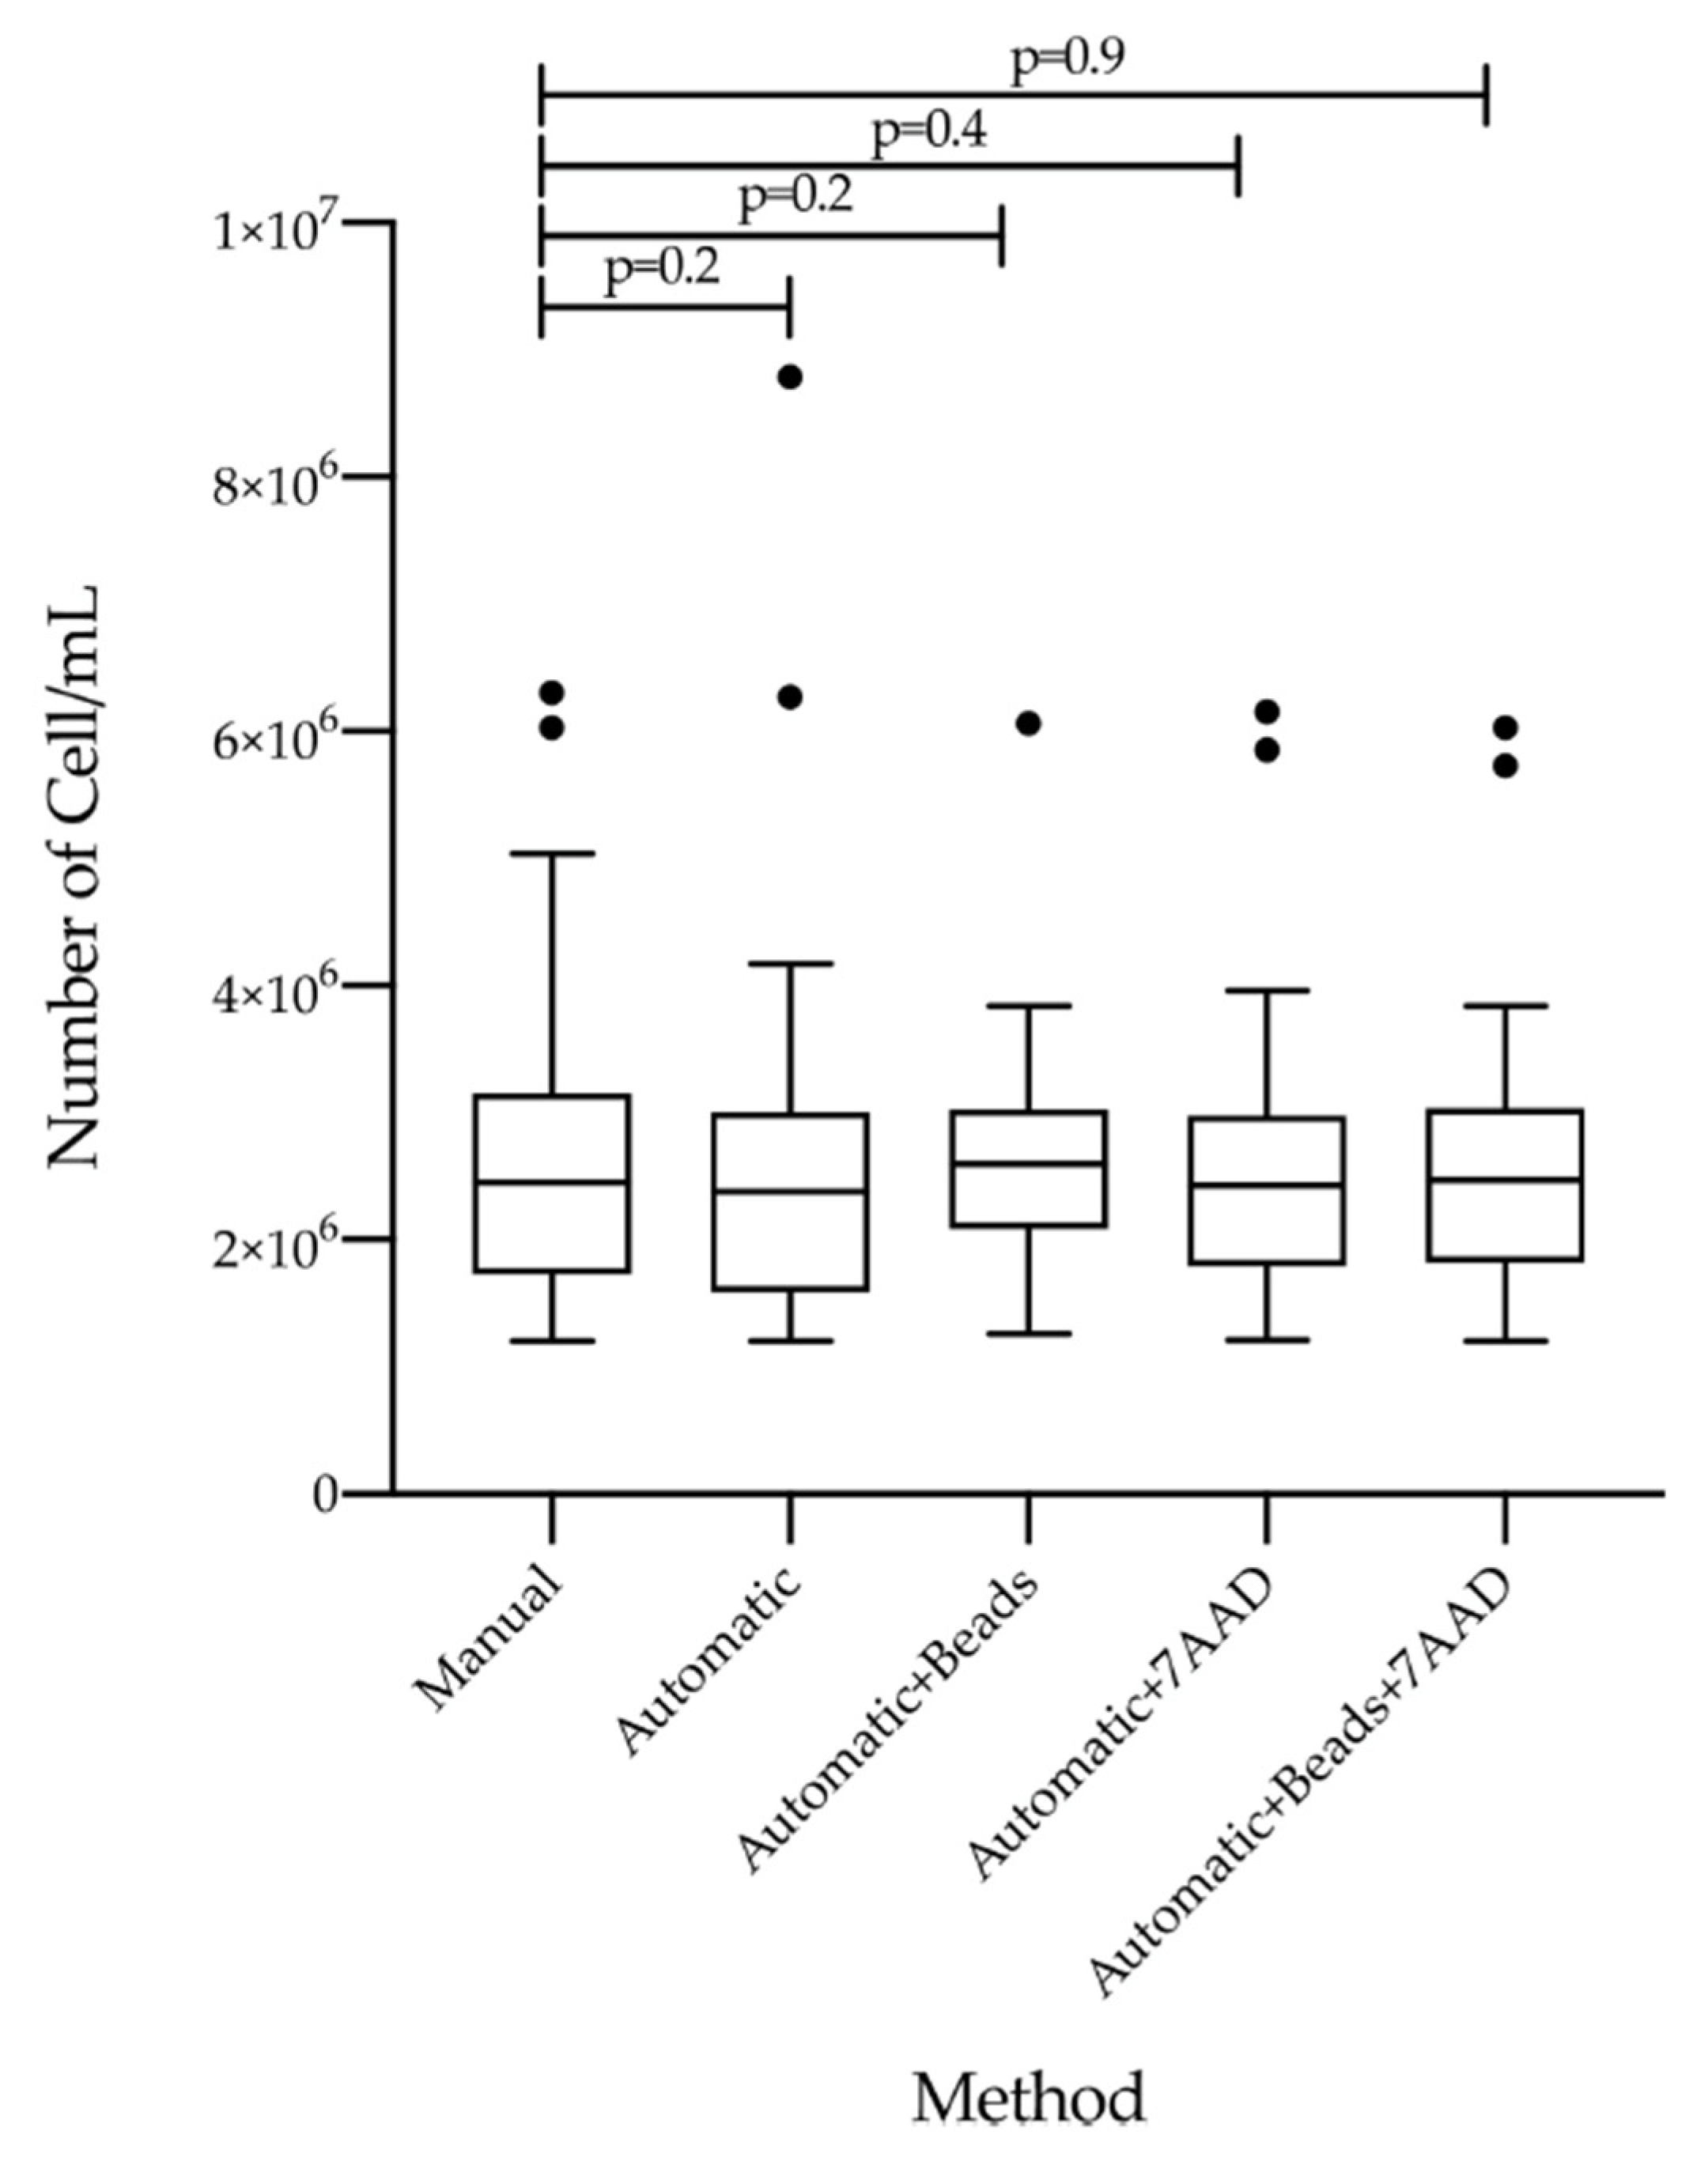
In order to compare the count methods efficiency of the five measurements, we evaluated the count of WBCs using Manual, Automatic, Automatic + Beads, Automatic + 7AAD and Automatic + Beads + 7AAD methods (Figure 2). We observed comparable count efficiency between the methods and, interestingly, no statistical differences were observed between the five counting assays (Figure 2). The median of counted cells was 2.46 × 10⁶ (range 1.20 × 10⁶–6.30 × 10⁶) with the Manual protocol, 2.46 × 10⁶ (range 1.20 × 10⁶–6.27 × 10⁶) with the Automatic method, 2.60 × 10⁶ (range 1.26 × 10⁶–6.06 × 10⁶) when we measured the cells with Automatic and Beads measurement, 2.43 × 10⁶ (range 1.22 × 10⁶–6.16 × 10⁶) when we used the fluorescent intercalator 7-AAD solution and, finally, 2.47 × 10⁶ (range 1.20 × 10⁶–6.04 × 10⁶) when we combined Automatic count plus Beads and 7AAD solution (Table 2, cell isolation).
Next, to evaluate the impact on the downstream analysis for molecular monitoring of CML patients, we compared the quantity and quality of RNA extracted from matched RLT samples provided by five different measurements. We observed that the median of RNA concentration was similar in all used methods (Table 2, RNA isolation). In detail, RNA concentration expressed as ng/μL was 123.00 (range 80–223.5) when we used the Manual method, 120.35 (range 75–256.4) in samples counted by automatic measurement, 118.12 (range 75–200.4) using the beads method, 126.00 (range 78–232.5) in the 7AAD assay and 116.65 (range 75–223.3) combining the beads with 7AAD solution. Overall, we obtained a good RNA quality from matched samples as measured by RNA spectrophotometric quantification at wavelengths of A260/280 (1.9 median value) and A260/230 (2.1 median value).

3.3. Concordance of Cycle Threshold Values for BCR-ABL1 and ABL1 Genes According to the Five Counting Methods

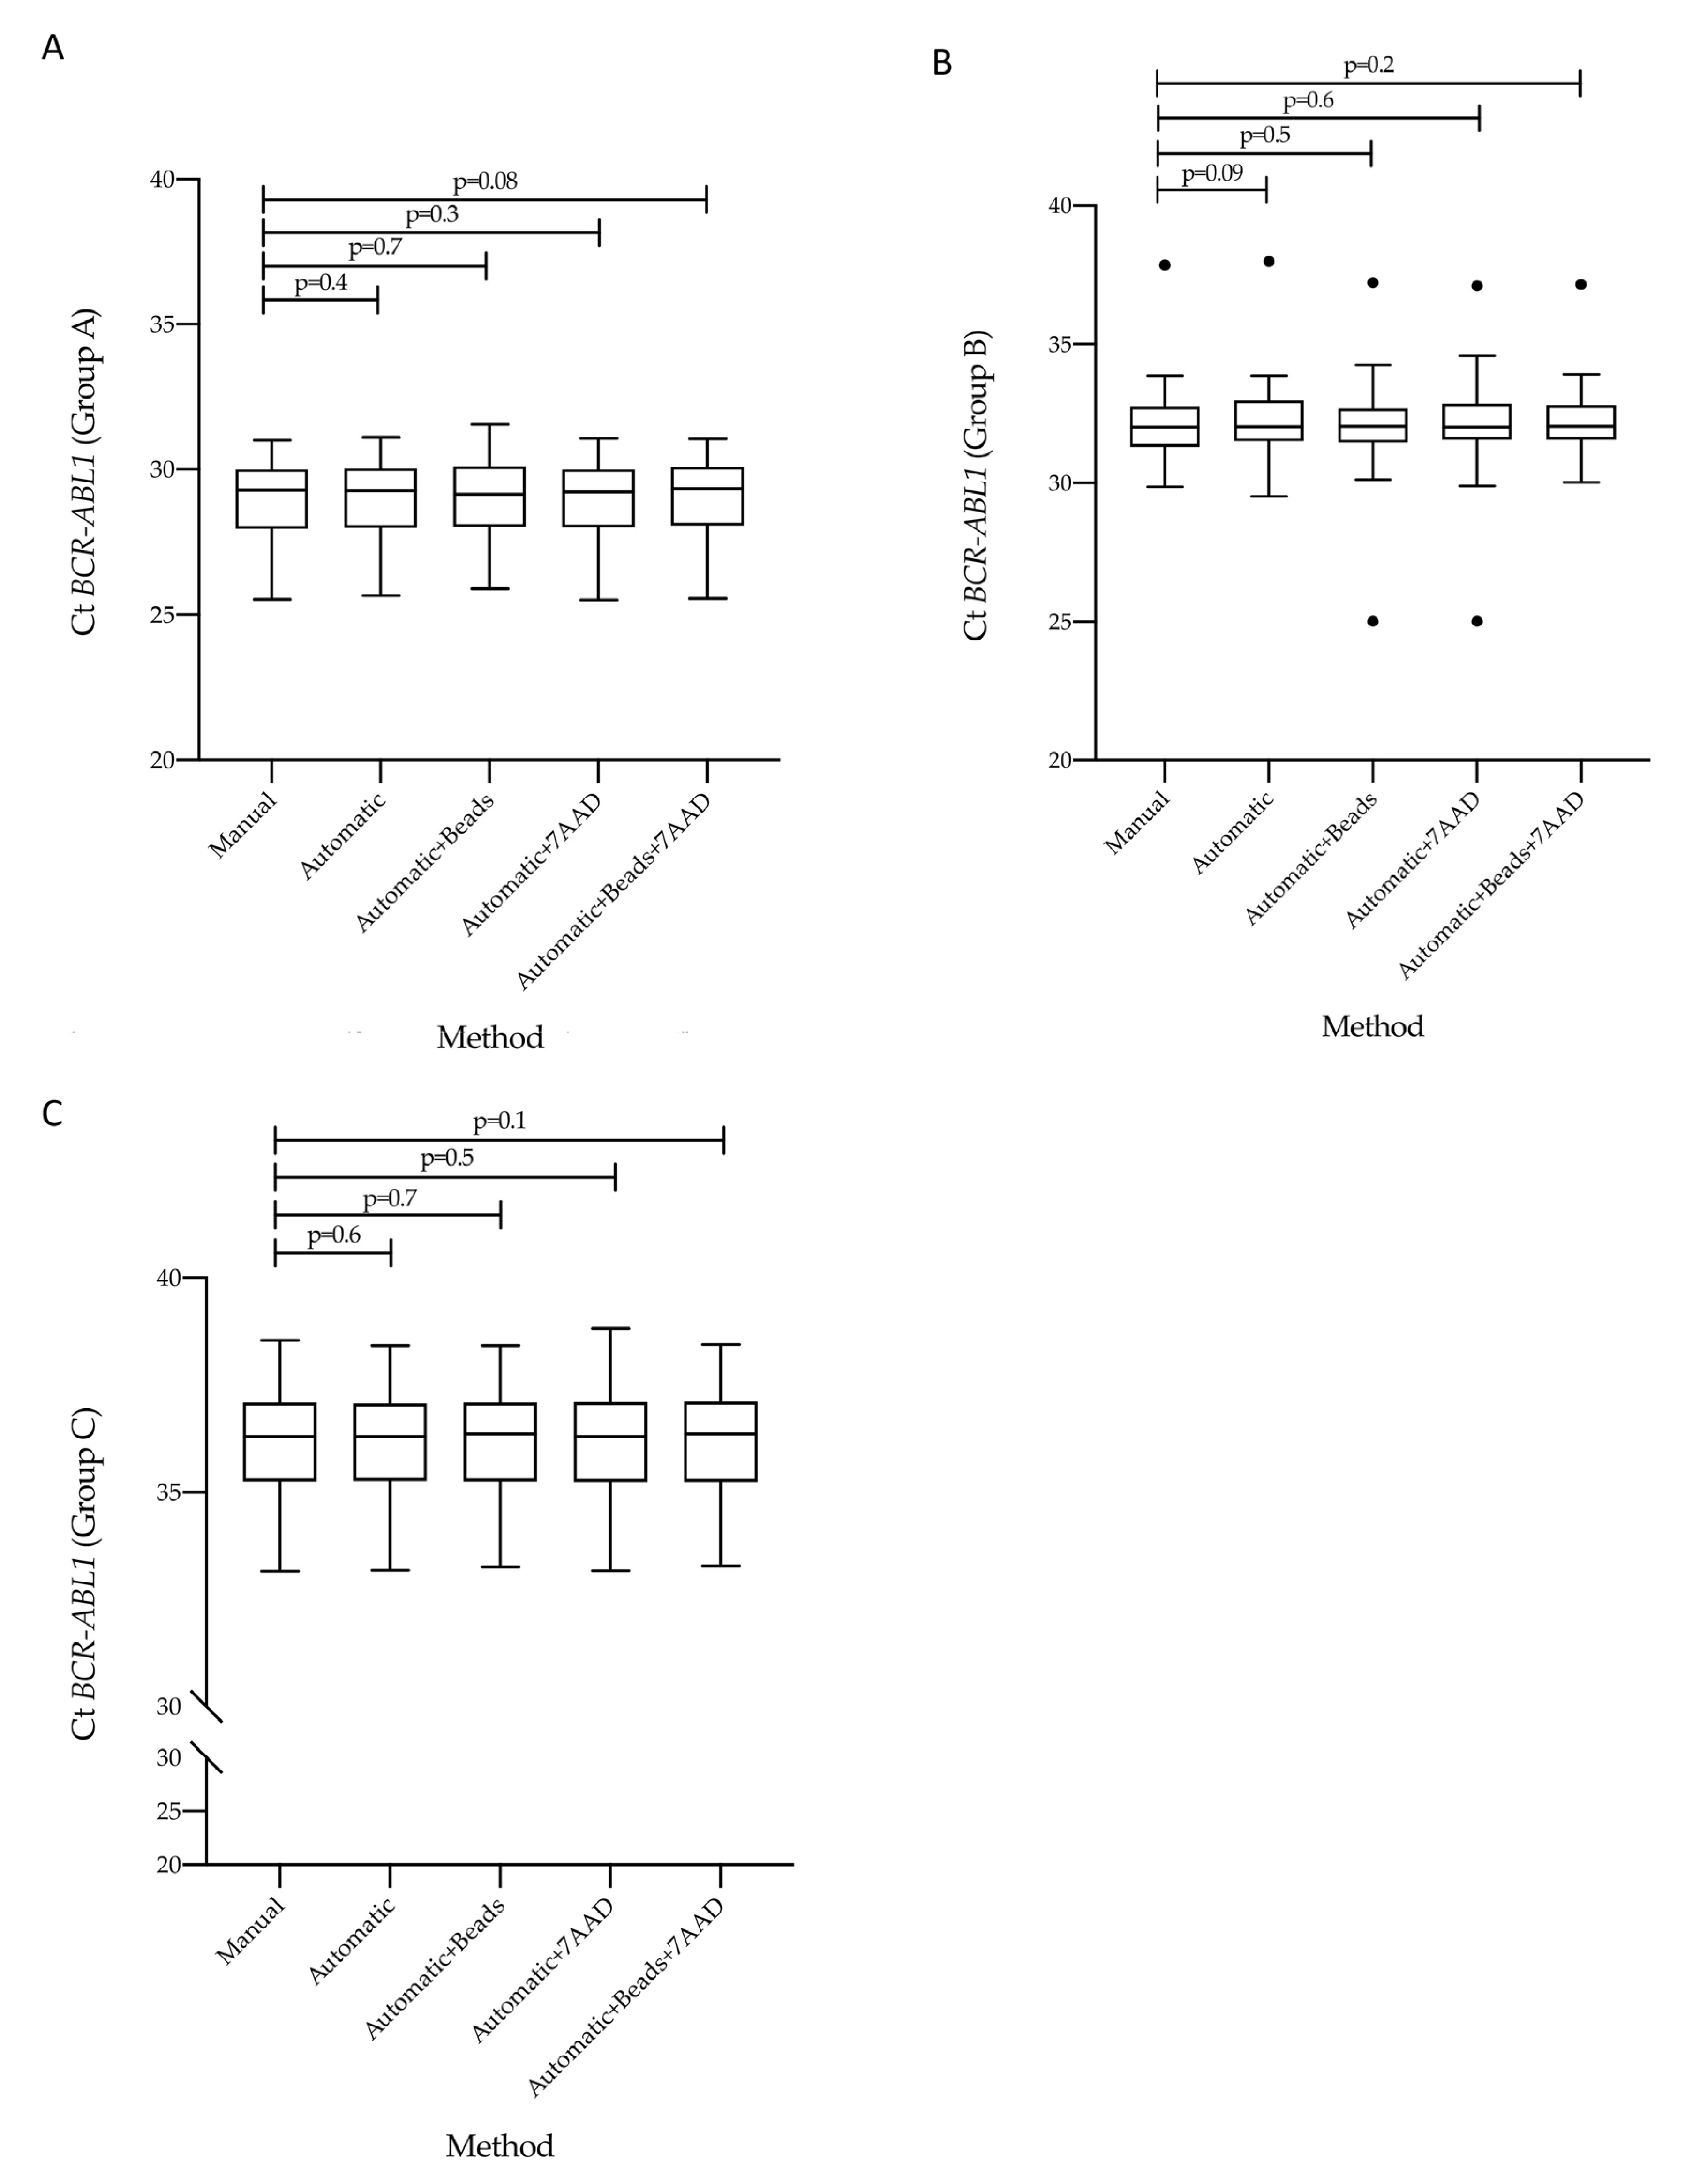
Previous evidence has established that the measurement of BCR-ABL1/ABL1IS transcript levels may be affected by the accuracy of the method used [21,24]. Variables of different procedures may result in different molecular response scoring for CML patients. The choose of counting method is crucial to obtain high-quality and reproducible data. To this purpose, we stratified the CML patients according to their BCR-ABL1/ABL1IS transcript level into three groups (Group A, B and C) and then we compared Ct value obtained from matched specimens counted by the five different methods. By considering the BCR-ABL1 Q-PCR data, we found similar Ct values in all investigated groups. Specifically, we observed that in Group A the Ct value median was 29.30 (range 25.52–31.01) for samples counted by hemocytometer counting-chamber, 29.28 (range 25.66–31.10) for the automatic method, 29.37 (range 25.89–31.55) using counting beads, 29.24 (range 25.50–31.08) adding only the intercalator 7AAD and 29.34 (range 25.56–31.06) combining the counting beads with 7AAD solution (Figure 3A). When we looked at Group B, we detected a Ct value median of 32.01 (range 29.85–37.85) in the manual method, 32.03 (range 29.53–37.99) in automatic measurement, 32.10 (range 30.12–37.22) in presence of counting beads, 32.04 (range 29.89–37.10) using 7AAD solution and 32.05 (range 30.02–37.15) in the combined assay (Figure 3B). In the last Group (C), we observed a Ct value median of 36.30 (range 33.16–38.55) by manual count, 36.31 (range 33.18–38.42) in the automatic method, 36.36 (range 33.26–38.42) with counting beads, 36.30 (range 33.17–38.82) in presence of 7AAD solution and 36.36 (range 33.28–38.44) using counting beads plus the intercalator 7AAD (Figure 3C).
The Bland-Altman plot showed no consistent bias between the manual and the automatic methods (Figure 4A–C). Moreover, no consistent bias was found when we repeated the analysis comparing the manual and the other three measurements (manual vs counting beads, manual vs intercalator 7AAD methods and manual vs the combination of beads with 7AAD solution measurements) (Supplemental Figure S1A–I).
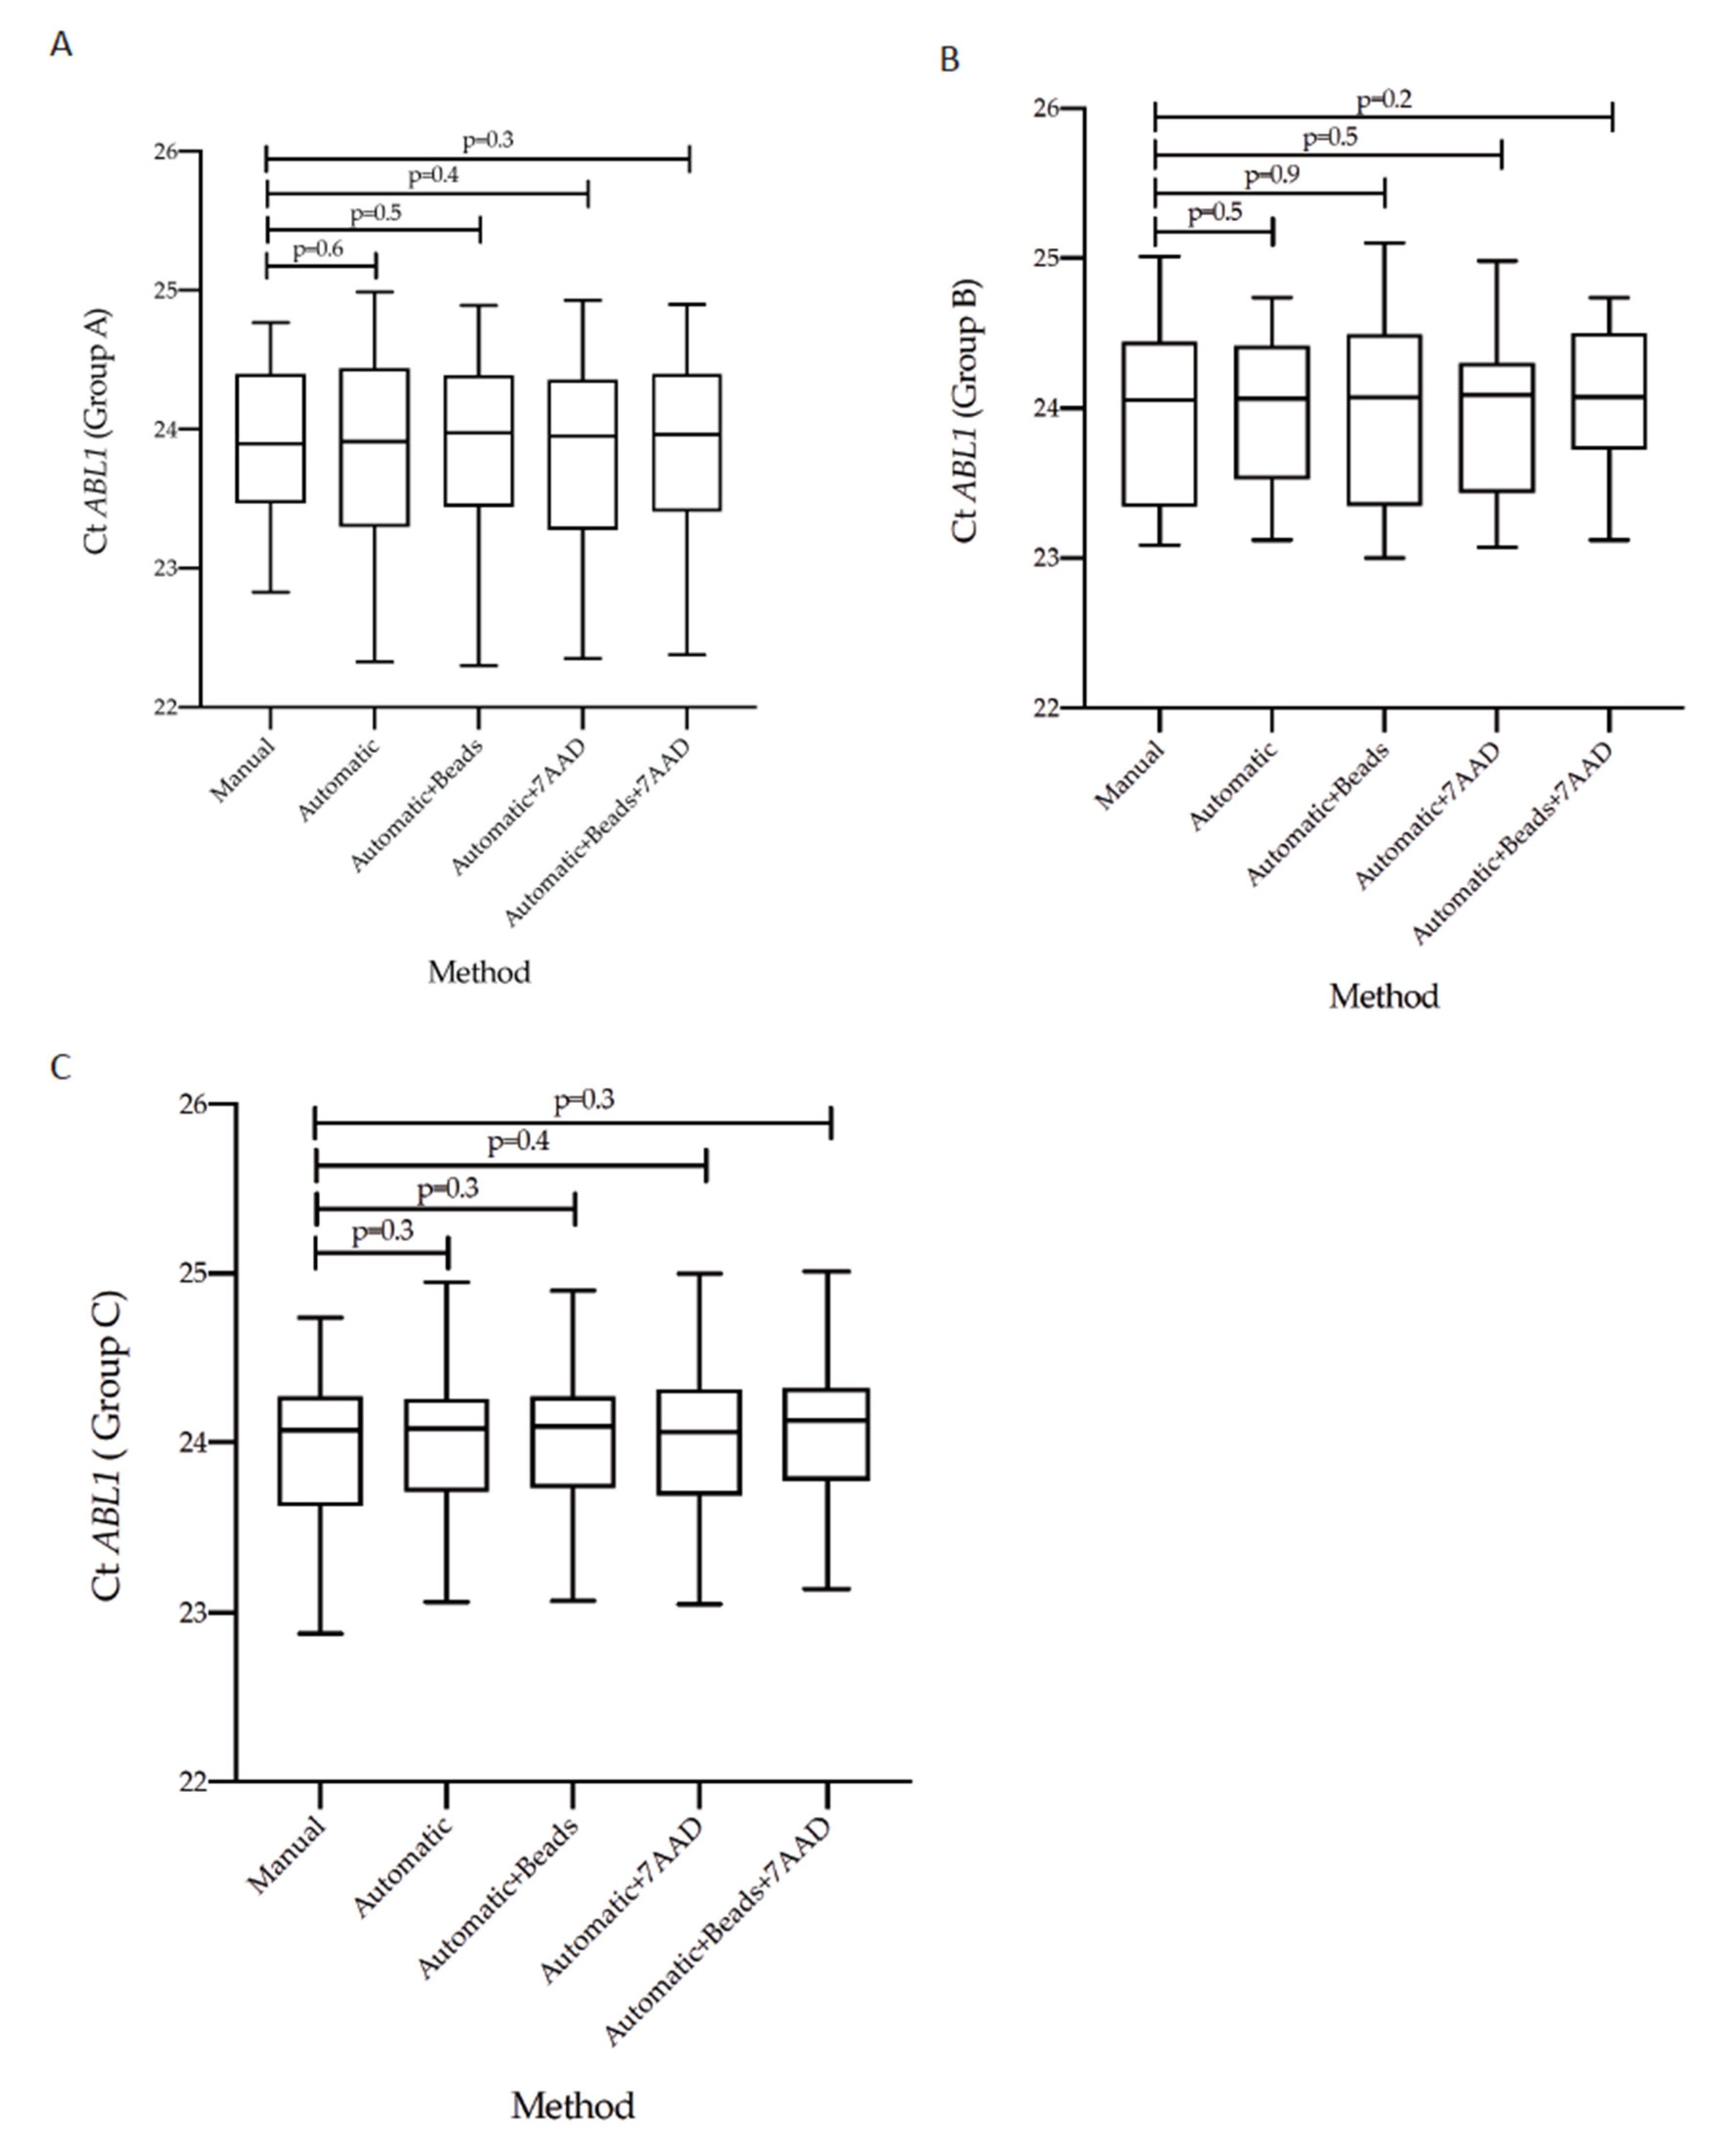
Next, we investigated the ABL1 Q-PCR data and did not observe statistically significant differences in the ABL1 gene Ct values of matched samples evaluated for the five counting methods (Figure 5A–C). Furthermore, evaluating the ABL1 reference gene copies we found that all measurement assay performed optimally with ABL1 gene copies measured >10.000 in the three groups (data not showed). Overall, we found a 100% concordance.
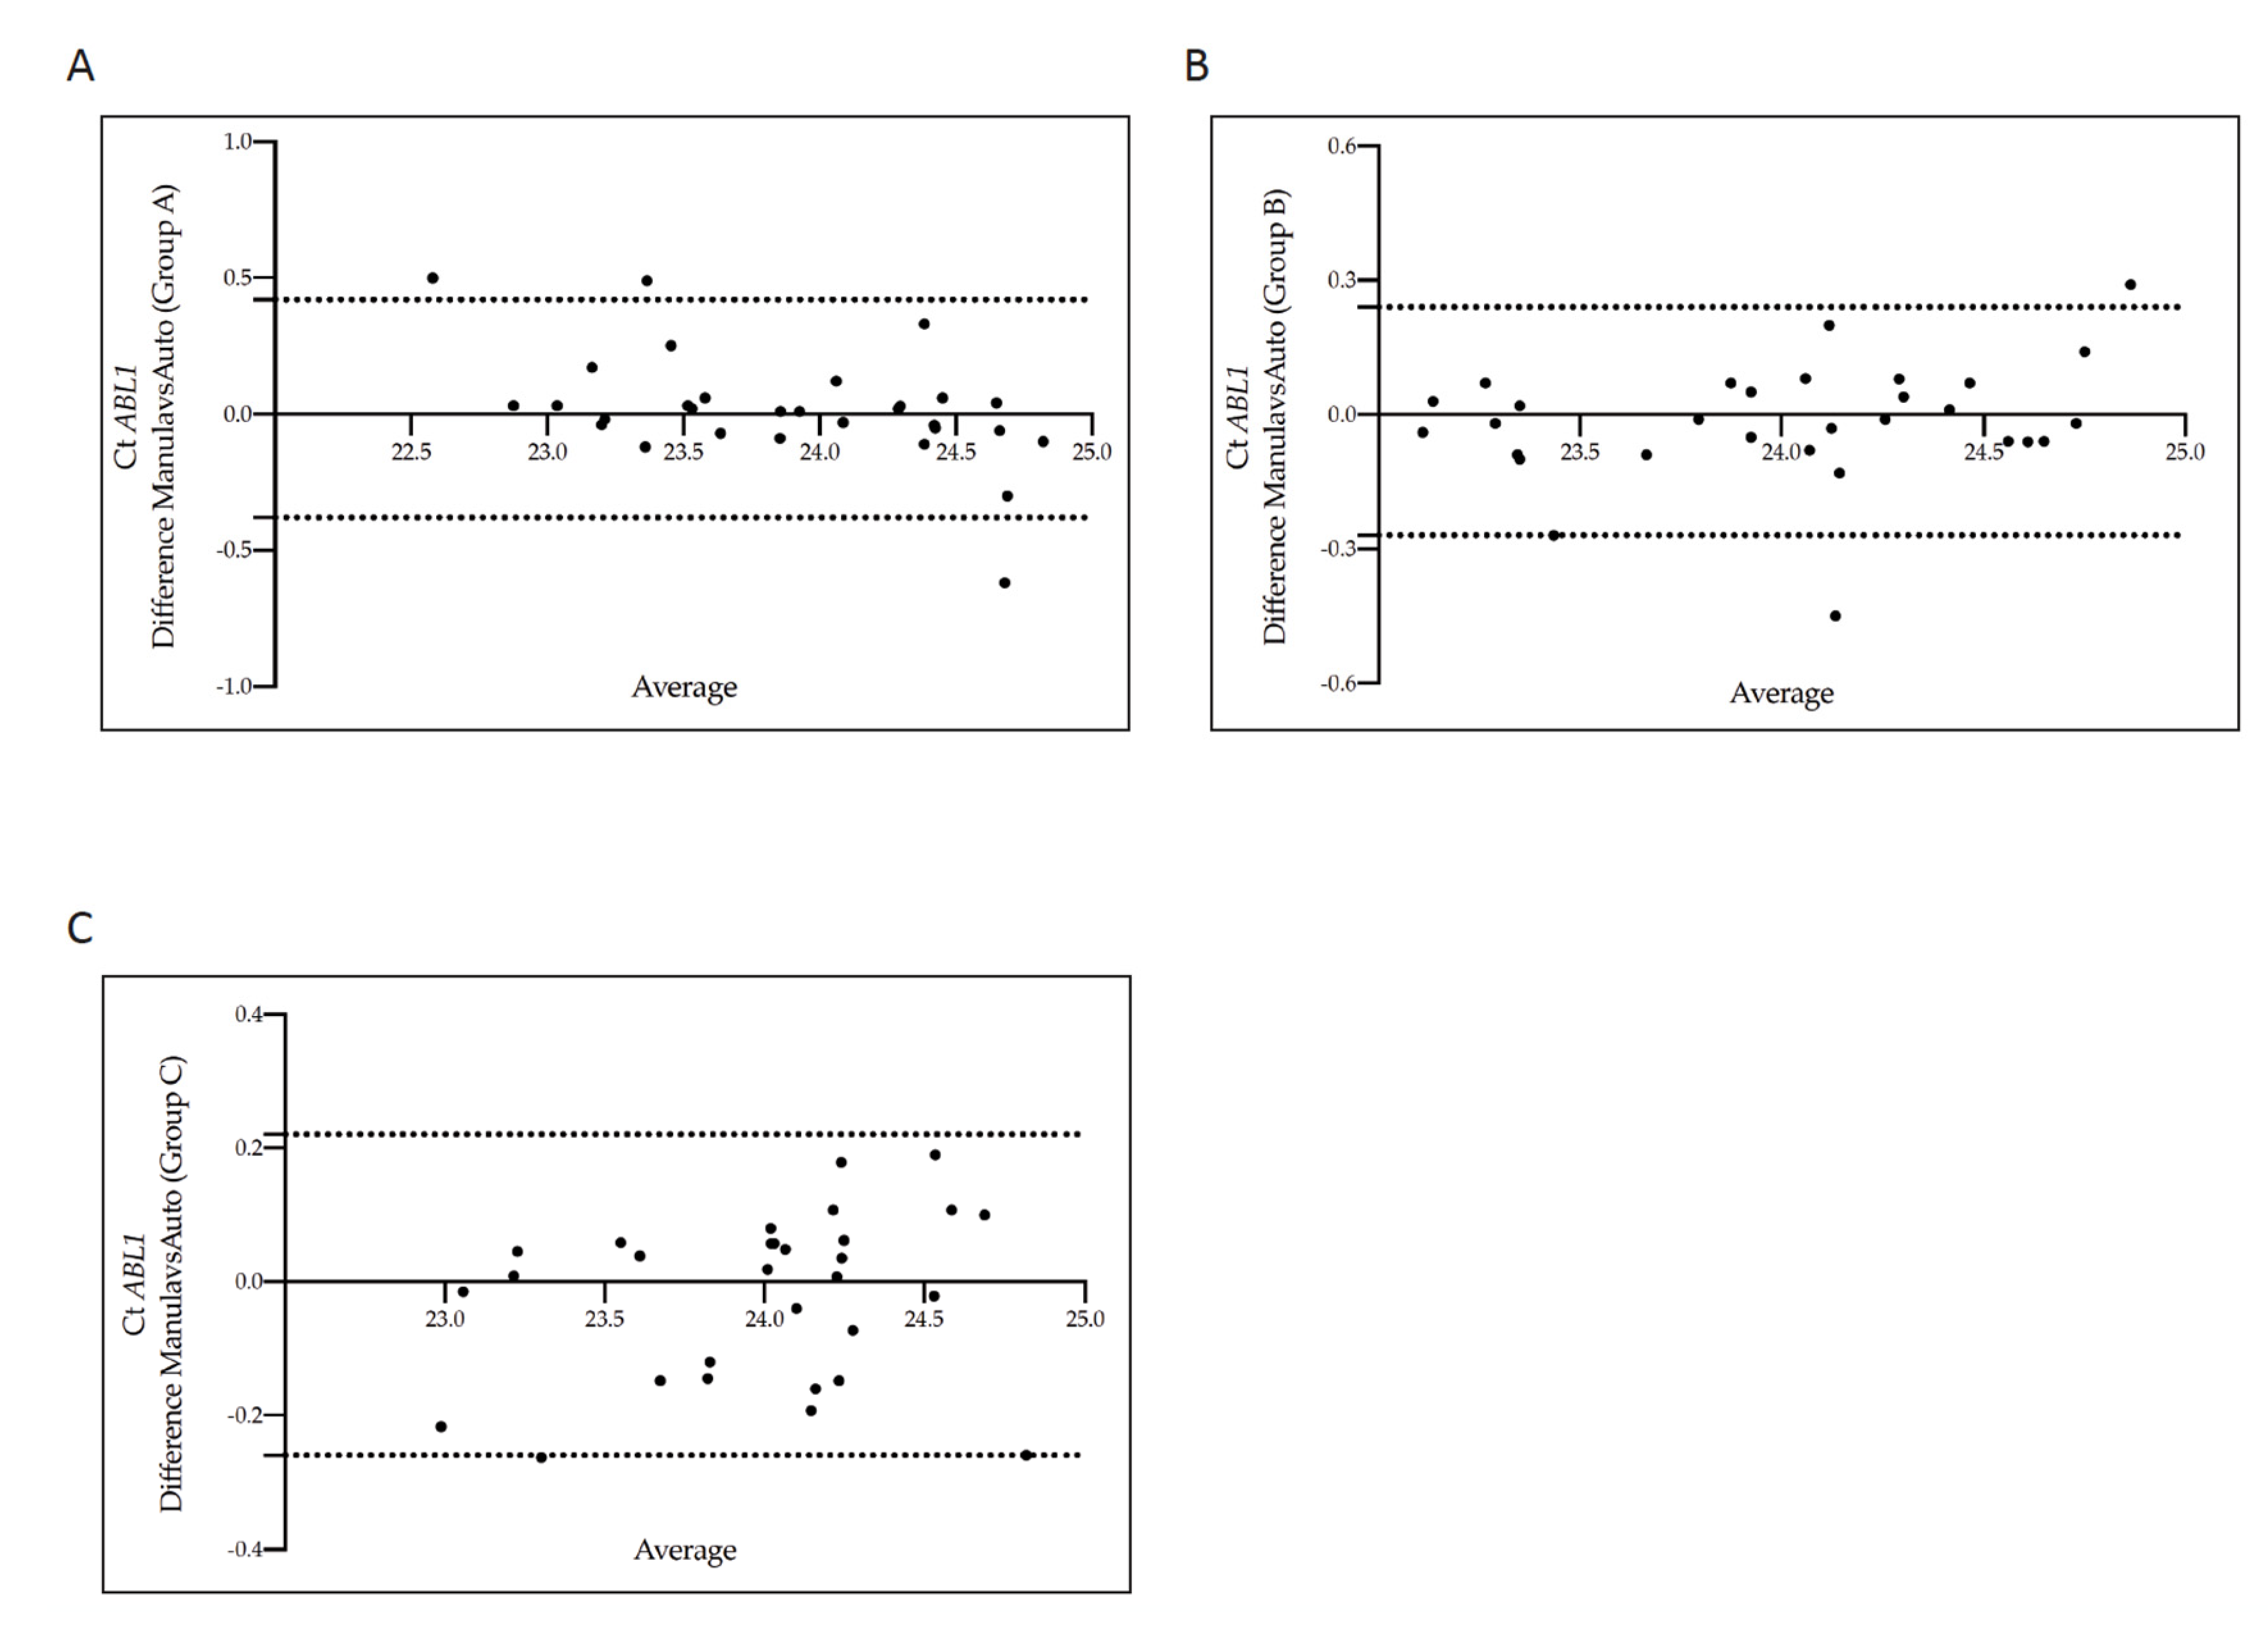
In this case also, the Bland-Altman plot showed no consistent bias between samples counted by the manual vs the other four methods (Figure 6A–C and Supplemental Figure S2A–I).

4. Discussion and Conclusions

The molecular monitoring of CML patients has become of pivotal importance to predict treatment response and relapse [22,27]. Quantitative PCR analyses of blood samples, assessing the level of the BCR-ABL1 oncogene relative to an internal control gene (usually ABL1), are the “gold standard” for monitoring the kinetics of disease burden variation. Moreover, molecular detection of BCR-ABL1 transcript by Q-PCR has the advantages of reliability, sensitivity and reproducibility of results.
Upon TKI therapy initiation, BCR-ABL1 molecular testing is generally recommended every 3 months as far as a stable deep molecular response is achieved. Currently, more frequent molecular testing is encouraged for CML individuals achieving persistent deep molecular response after TKI discontinuation (a condition defined as TFR) [18,35]. Moreover, a more strictly molecular monitoring ensuring a timely recognition of rising BCR-ABL1 values should trigger a thorough evaluation regarding compliance or possible relapse [36]. To achieve this effectively, standardization of the laboratory procedures is mandatory, including method for cell counting and isolation.
Nowadays, many cell counting assays enable the detection and enumeration of cells, either manually or via an automated process. In order to obtain reliable results, the entire cell counting process should be standardized, as variability of the measurements may introduce unintended error. Despite the easy procedure, the manual method is laborious can process a small number of samples at a time and is less suitable for large-scale studies or in diagnostic practice. Here, we present a comparison between a traditional counting method and our automated system based on the CytoFLEX Flow Cytometer integrated with the semiautomatic Biomek i-5 Workstation. Overall, the automatic counting system determined a hands-on time reduction allowing processing of a large number of samples concurrently (up to 20 specimens in only five minutes). Samples are loaded in a 96-well plate and then a peristaltic pump system permits recording of an unlimited number of patients, without any time delay or dilution influence. Furthermore, the opportunity to manipulate the live cell gate on the CytoFLEX software enabled a more reliable count.
Different studies have recommended the addition of counting beads, at a known concentration, to the cells before measurement in order to calculate cell densities through flow cytometry [37,38,39]. However, as beads tend to stick to the plastic tube, this method might overestimate the sample concentration. For this purpose, in our study we compared the automatic count in the presence or not of beads (absolute count). Among the tested methods, we did not observe consistent bias. Of note, the absolute count allows a decrease in the assay cost per run compareded to the expensive beads cost, without affecting the quality and quantity of RNA for downstream analyses.
Staining with the intercalator 7AAD dye has the advantage of discriminating dead from live cell population, even with the limitation of more time for staining. Therefore, we also compared the absolute count to the measurement based on 7AAD solution. Again, no differences were observed among the counting assays, suggesting that the 7AAD intercalator does not provide additional information, either used alone or in combination with counting beads.
Several reports have shown that the quality and quantity of the BCR-ABL1/ABL1 transcript level may influence the molecular outcome for CML patients [9,24]. Particularly, it is advised that a sample should have at least 10,000.00 ABL1 gene copies to pass minimum quality standards. Furthermore, the amount of the control gene is critical to define the kinetics of the disease burden reduction. In this context, we also compared the Ct values from matched counted samples obtained by Q-PCR assay on BCR-ABL1 and ABL1 genes and observed similar quantitative results as well as recovery efficiency. Likewise, matched samples were correctly classified into the same group of molecular response. These data underline the importance of taking into consideration the counting method used (manual or automatic) and readout (BCR-ABL1 and ABL1 transcript levels) when comparing results for diagnostic practice.
In conclusion, the automatic system based on absolute cell counting allows the obtaining of accurate cell counts without the use of expensive beads or the addition of the time-consuming intercalator 7AAD, and can streamline the entire procedure. Therefore, this measurement can replace the more laborious manual workflow, largely based on an interaction with the users, especially when high-throughput isolations from the blood of CML patients are needed.

Supplementary Materials

The following supporting information can be downloaded at: https://www.mdpi.com/article/10.3390/diagnostics12051051/s1, Figure S1: Bland–Altman showing the concordance of the BCR-ABL1 CT values measured in matched samples counted by the manual and three automatic cell-counting assays; Figure S2: Bland–Altman showing the concordance of the ABL1 CT values measured in matched samples counted by the manual and three automatic cell-counting assays.

Author Contributions

S.S. and S.R.V. designed the research, interpreted the results, analyzed the data and wrote original manuscript; S.S. supervised the study; F.S. recruited and followed the patients and performed critically reviewed the paper; M.M. analyzed the data, interpreted the results and performed critically reviewed the paper; A.P., C.T. and S.R.V. performed the experiment; M.S.P., E.T. and C.R. performed critically reviewed the paper; F.D.R., E.C., R.C. and L.M. supervised the study and performed critically reviewed the paper. All authors have read and agreed to the published version of the manuscript.

Funding

This research received no external funding.

Institutional Review Board Statement

In the Hematology Department directed by Francesco Di Raimondo, retrospective observational researches on human material are conducted according to a protocol approved by the local ethical committee (Comitato Etico Catania 1, Azienda Ospedaliero Universitaria Policlinico-Vittorio Emanuele, identification code #34/2013/VE).

Informed Consent Statement

Informed consent was obtained from all subjects involved in the study.

Data Availability Statement

Data is contained within the article or Supplementary Material.

Conflicts of Interest

The authors declare no conflict of interest.

References

  1. Quintas-Cardama, A.; Cortes, J. Molecular biology of bcr-abl1–positive chronic myeloid leukemia. Blood 2009, 113, 1619–1630. [Google Scholar] [CrossRef] [Green Version]
  2. Jabbour, E.; Kantarjian, H. Chronic myeloid leukemia: 2020 update on diagnosis, therapy and monitoring. Am. J. Hematol. 2020, 95, 691–709. [Google Scholar] [CrossRef]
  3. Apperley, J.F. Chronic myeloid leukaemia. Lancet 2015, 385, 1447–1459. [Google Scholar] [CrossRef]
  4. Ren, R. Mechanisms of BCR–ABL in the pathogenesis of chronic myelogenous leukaemia. Nat. Rev. Cancer 2005, 5, 172–183. [Google Scholar] [CrossRef]
  5. Ishii, Y.; Nhiayi, M.K.; Tse, E.; Cheng, J.; Massimino, M.; Durden, D.L.; Vigneri, P.; Wang, J.Y. Knockout Serum Replacement Promotes Cell Survival by Preventing BIM from Inducing Mitochondrial Cytochrome C Release. PLoS ONE 2015, 10, e0140585. [Google Scholar]
  6. Massimino, M.; Vigneri, P.; Stella, S.; Tirro, E.; Pennisi, M.S.; Parrinello, L.N.; Vetro, C.; Manzella, L.; Stagno, F.; Di Raimondo, F. Combined Inhibition of Bcl2 and Bcr-Abl1 Exercises Anti-Leukemia Activity but Does Not Eradicate the Primitive Leukemic Cells. J. Clin. Med. 2021, 10, 5606. [Google Scholar] [CrossRef]
  7. Hochhaus, A.; Larson, R.A.; Guilhot, F.; Radich, J.P.; Branford, S.; Hughes, T.P.; Baccarani, M.; Deininger, M.W.; Cervantes, F.; Fujihara, S.; et al. Long-Term Outcomes of Imatinib Treatment for Chronic Myeloid Leukemia. N. Engl. J. Med. 2017, 376, 917–927. [Google Scholar] [CrossRef]
  8. Leotta, S.; Markovic, U.; Pirosa, M.C.; Stella, S.; Tringali, S.; Martino, M.; Specchia, G.; Carluccio, P.; Risitano, A.M.; Grimaldi, F.; et al. The role of ponatinib in adult BCR-ABL1 positive acute lymphoblastic leukemia after allogeneic transplantation: A real-life retrospective multicenter study. Ann. Hematol. 2021, 100, 1743–1753. [Google Scholar] [CrossRef]
  9. Schafer, V.; White, H.E.; Gerrard, G.; Mobius, S.; Saussele, S.; Franke, G.N.; Mahon, F.X.; Talmaci, R.; Colomer, D.; Soverini, S.; et al. Assessment of individual molecular response in chronic myeloid leukemia patients with atypical BCR-ABL1 fusion transcripts: Recommendations by the EUTOS cooperative network. J. Cancer Res. Clin. Oncol. 2021, 147, 3081–3089. [Google Scholar] [CrossRef]
  10. Castagnetti, F.; Di Raimondo, F.; De Vivo, A.; Spitaleri, A.; Gugliotta, G.; Fabbiano, F.; Capodanno, I.; Mannina, D.; Salvucci, M.; Antolino, A.; et al. A population-based study of chronic myeloid leukemia patients treated with imatinib in first line. Am. J. Hematol. 2017, 92, 82–87. [Google Scholar] [CrossRef]
  11. Baccarani, M.; Deininger, M.W.; Rosti, G.; Hochhaus, A.; Soverini, S.; Apperley, J.F.; Cervantes, F.; Clark, R.E.; Cortes, J.E.; Guilhot, F.; et al. European LeukemiaNet recommendations for the management of chronic myeloid leukemia: 2013. Blood 2013, 122, 872–884. [Google Scholar] [CrossRef]
  12. Hochhaus, A.; Baccarani, M.; Silver, R.T.; Schiffer, C.; Apperley, J.F.; Cervantes, F.; Clark, R.E.; Cortes, J.E.; Deininger, M.W.; Guilhot, F.; et al. European LeukemiaNet 2020 recommendations for treating chronic myeloid leukemia. Leukemia 2020, 34, 966–984. [Google Scholar] [CrossRef] [Green Version]
  13. Rosti, G.; Castagnetti, F.; Gugliotta, G.; Baccarani, M. Tyrosine kinase inhibitors in chronic myeloid leukaemia: Which, when, for whom? Nat. Rev. Clin. Oncol. 2017, 14, 141–154. [Google Scholar] [CrossRef]
  14. Soverini, S.; Bavaro, L.; De Benedittis, C.; Martelli, M.; Iurlo, A.; Orofino, N.; Sica, S.; Sora, F.; Lunghi, F.; Ciceri, F.; et al. Prospective assessment of NGS-detectable mutations in CML patients with nonoptimal response: The NEXT-in-CML study. Blood 2020, 135, 534–541. [Google Scholar] [CrossRef]
  15. Massimino, M.; Stella, S.; Tirro, E.; Pennisi, M.S.; Vitale, S.R.; Puma, A.; Romano, C.; Di Gregorio, S.; Tomarchio, C.; Di Raimondo, F.; et al. ABL1-Directed Inhibitors for CML: Efficacy, Resistance and Future Perspectives. Anticancer Res. 2020, 40, 2457–2465. [Google Scholar] [CrossRef]
  16. Stella, S.; Zammit, V.; Vitale, S.R.; Pennisi, M.S.; Massimino, M.; Tirro, E.; Forte, S.; Spitaleri, A.; Antolino, A.; Siracusa, S.; et al. Clinical Implications of Discordant Early Molecular Responses in CML Patients Treated with Imatinib. Int. J. Mol. Sci. 2019, 20, 2226. [Google Scholar] [CrossRef] [Green Version]
  17. Mahon, F.X. Discontinuation of TKI therapy and ‘functional’ cure for CML. Best Pract. Res. Clin. Haematol. 2016, 29, 308–313. [Google Scholar] [CrossRef]
  18. Baccarani, M. Treatment-free remission in chronic myeloid leukemia: Floating between expectation and evidence. Leukemia 2017, 31, 1015–1016. [Google Scholar] [CrossRef]
  19. Saussele, S.; Richter, J.; Hochhaus, A.; Mahon, F.X. The concept of treatment-free remission in chronic myeloid leukemia. Leukemia 2016, 30, 1638–1647. [Google Scholar] [CrossRef]
  20. Cross, N.C.; Hochhaus, A.; Muller, M.C. Molecular monitoring of chronic myeloid leukemia: Principles and interlaboratory standardization. Ann. Hematol. 2015, 94, 219–225. [Google Scholar] [CrossRef]
  21. Foroni, L.; Wilson, G.; Gerrard, G.; Mason, J.; Grimwade, D.; White, H.E.; de Castro, D.G.; Austin, S.; Awan, A.; Burt, E.; et al. Guidelines for the measurement of BCR-ABL1 transcripts in chronic myeloid leukaemia. Br. J. Haematol. 2011, 153, 179–190. [Google Scholar] [CrossRef] [PubMed]
  22. Izzo, B.; Gottardi, E.M.; Errichiello, S.; Daraio, F.; Barate, C.; Galimberti, S. Monitoring Chronic Myeloid Leukemia: How Molecular Tools May Drive Therapeutic Approaches. Front. Oncol. 2019, 9, 833. [Google Scholar] [CrossRef] [PubMed] [Green Version]
  23. Muller, M.C.; Erben, P.; Saglio, G.; Gottardi, E.; Nyvold, C.G.; Schenk, T.; Ernst, T.; Lauber, S.; Kruth, J.; Hehlmann, R.; et al. Harmonization of BCR-ABL mRNA quantification using a uniform multifunctional control plasmid in 37 international laboratories. Leukemia 2008, 22, 96–102. [Google Scholar] [CrossRef] [Green Version]
  24. Hughes, T.; Deininger, M.; Hochhaus, A.; Branford, S.; Radich, J.; Kaeda, J.; Baccarani, M.; Cortes, J.; Cross, N.C.; Druker, B.J.; et al. Monitoring CML patients responding to treatment with tyrosine kinase inhibitors: Review and recommendations for harmonizing current methodology for detecting BCR-ABL transcripts and kinase domain mutations and for expressing results. Blood 2006, 108, 28–37. [Google Scholar] [CrossRef] [Green Version]
  25. Stella, S.; Gottardi, E.M.; Favout, V.; Barragan Gonzalez, E.; Errichiello, S.; Vitale, S.R.; Fava, C.; Luciano, L.; Stagno, F.; Grimaldi, F.; et al. The Q-LAMP Method Represents a Valid and Rapid Alternative for the Detection of the BCR-ABL1 Rearrangement in Philadelphia-Positive Leukemias. Int. J. Mol. Sci. 2019, 20, 6106. [Google Scholar] [CrossRef] [Green Version]
  26. Stella, S.; Vitale, S.R.; Massimino, M.; Puma, A.; Tomarchio, C.; Pennisi, M.S.; Tirro, E.; Romano, C.; Martorana, F.; Stagno, F.; et al. A Novel System for Semiautomatic Sample Processing in Chronic Myeloid Leukaemia: Increasing Throughput without Impacting on Molecular Monitoring at Time of SARS-CoV-2 Pandemic. Diagnostics 2021, 11, 1502. [Google Scholar] [CrossRef]
  27. Hughes, T.P.; Saglio, G.; Kantarjian, H.M.; Guilhot, F.; Niederwieser, D.; Rosti, G.; Nakaseko, C.; De Souza, C.A.; Kalaycio, M.E.; Meier, S.; et al. Early molecular response predicts outcomes in patients with chronic myeloid leukemia in chronic phase treated with frontline nilotinib or imatinib. Blood 2014, 123, 1353–1360. [Google Scholar] [CrossRef]
  28. Freund, M.; Carol, B. Factors Affecting Haemocytometer Counts of Sperm Concentration in Human Semen. J. Reprod. Fertil. 1964, 8, 149–155. [Google Scholar] [CrossRef]
  29. Massimino, M.; Tirro, E.; Stella, S.; Manzella, L.; Pennisi, M.S.; Romano, C.; Vitale, S.R.; Puma, A.; Tomarchio, C.; Di Gregorio, S.; et al. Impact of the Breakpoint Region on the Leukemogenic Potential and the TKI Responsiveness of Atypical BCR-ABL1 Transcripts. Front. Pharmacol. 2021, 12, 669469. [Google Scholar] [CrossRef]
  30. Pirosa, M.C.; Leotta, S.; Cupri, A.; Stella, S.; Martino, E.A.; Scalise, L.; Sapienza, G.; Calafiore, V.; Mauro, E.; Spadaro, A.; et al. Long-Term Molecular Remission Achieved by Antibody Anti-CD22 and Ponatinib in a Patient Affected by Ph’+ Acute Lymphoblastic Leukemia Relapsed after Second Allogeneic Hematopoietic Stem Cell Transplantation: A Case Report. Chemotherapy 2018, 63, 220–224. [Google Scholar] [CrossRef]
  31. Pennisi, M.S.; Stella, S.; Vitale, S.R.; Puma, A.; Di Gregorio, S.; Romano, C.; Tirro, E.; Massimino, M.; Antolino, A.; Siragusa, S.; et al. BCR-ABL1 Doubling-Times and Halving-Times May Predict CML Response to Tyrosine Kinase Inhibitors. Front. Oncol. 2019, 9, 764. [Google Scholar] [CrossRef] [PubMed] [Green Version]
  32. Vigneri, P.; Stagno, F.; Stella, S.; Cupri, A.; Forte, S.; Massimino, M.; Antolino, A.; Siragusa, S.; Mannina, D.; Impera, S.S.; et al. High BCR-ABL/GUS(IS) Levels at Diagnosis of Chronic Phase CML Are Associated with Unfavorable Responses to Standard-Dose Imatinib. Clin. Cancer Res. 2017, 23, 7189–7198. [Google Scholar] [CrossRef] [Green Version]
  33. Cross, N.C.; White, H.E.; Muller, M.C.; Saglio, G.; Hochhaus, A. Standardized definitions of molecular response in chronic myeloid leukemia. Leukemia 2012, 26, 2172–2175. [Google Scholar] [CrossRef] [Green Version]
  34. Cross, N.C.; White, H.E.; Colomer, D.; Ehrencrona, H.; Foroni, L.; Gottardi, E.; Lange, T.; Lion, T.; Machova Polakova, K.; Dulucq, S.; et al. Laboratory recommendations for scoring deep molecular responses following treatment for chronic myeloid leukemia. Leukemia 2015, 29, 999–1003. [Google Scholar] [CrossRef] [PubMed] [Green Version]
  35. Deininger, M.W. Molecular monitoring in CML and the prospects for treatment-free remissions. Hematol. Am. Soc. Hematol. Educ. Program 2015, 2015, 257–263. [Google Scholar] [CrossRef] [PubMed] [Green Version]
  36. Shanmuganathan, N.; Hughes, T.P. Molecular monitoring in CML: How deep? How often? How should it influence therapy? Blood 2018, 132, 2125–2133. [Google Scholar] [CrossRef] [Green Version]
  37. Cadena-Herrera, D.; Esparza-De Lara, J.E.; Ramirez-Ibanez, N.D.; Lopez-Morales, C.A.; Perez, N.O.; Flores-Ortiz, L.F.; Medina-Rivero, E. Validation of three viable-cell counting methods: Manual, semi-automated, and automated. Biotechnol. Rep. 2015, 7, 9–16. [Google Scholar] [CrossRef] [Green Version]
  38. Huang, L.C.; Lin, W.; Yagami, M.; Tseng, D.; Miyashita-Lin, E.; Singh, N.; Lin, A.; Shih, S.J. Validation of cell density and viability assays using Cedex automated cell counter. Biologicals 2010, 38, 393–400. [Google Scholar] [CrossRef]
  39. Camacho-Fernandez, C.; Hervas, D.; Rivas-Sendra, A.; Marin, M.P.; Segui-Simarro, J.M. Comparison of six different methods to calculate cell densities. Plant Methods 2018, 14, 30. [Google Scholar] [CrossRef] [Green Version]
Figure 1. Workflow of the study. A total of 28 mL of peripheral blood from CML patients was collected within a single blood draw, in sterile 4 × 7 mL EDTA tubes. Total white blood cells (WBC) were isolated using the Biomek i-5 Automated Workstations and re-suspended in phosphate buffered saline (PBS). Next, a count was carried out by the manual (A) and the automatic methods via the CytoFLEX instrument (BE). In the manual methods, samples were diluted and counted using the hemocytometer counting-chamber with a microscope. In the automatic method, four different measurements were tested: the automatic absolute protocol, the automatic assay using counting beads, the automatic protocol with 7-Aminoactinomycin Dye (7AAD) solution, and the automatic method based on the use of either counting beads and 7AAD. Next, 1 × 10⁷ of the collected cells were lysed in RLT buffer and total RNA was isolated from matched samples. Finally, quantitative polymerase chain reaction (Q-PCR) was used to measure BCR-ABL1 and ABL1 gene transcript levels. EDTA tube: EthylenDiaminoTetracetyc Acid tube; RNA: RiboNucleic Acid; Q-PCR: quantitative polymerase chain reaction; cDNA: complementary DeossiNucleic Acid.
Diagnostics 12 01051 g001
Figure 2. Comparison of five counting methods respect to the number of white blood cells. White blood cells were isolated from 28 mL peripheral blood samples of 90 patients with chronic myeloid leukemia (CML). Cells were enumerated using five different counting methods: the manual method, the automatic absolute measurement, the automatic assay using counting beads, the automatic protocol with 7-Aminoactinomycin D (7AAD) solution, and the automatic method based on the use of either counting beads and 7AAD. Cell counts, expressed as number of cells/mL solution, were investigated to determine the counting recovery efficiency. The number of cells was determined for each method and showed as Tukey-boxplots. Thick lines in each boxplot represent the median of number of cells/mL for each method. The dark dots indicate the outlier’s value. The student-paired t-test was used to test the difference between the five counting methods and p value below 0.05 was considered statistically significant.
Diagnostics 12 01051 g002
Figure 3. Measurement of BCR-ABL1 Cycle threshold value on matched samples counted by five different enumeration assays. Comparison of the Cycle Threshold (Ct) values of BCR-ABL1 gene transcript measured by Q-PCR in matched samples counted by five different protocols. BCR-ABL1 gene transcript was assessed in patients stratified into three groups, each consisting of 30 individuals, according to their BCR-ABL1/ABL1IS transcript: Group A (10% > BCR-ABL1/AB1LIS > 1%) (A), Group B (1% > BCR-ABL1/ABL1IS > 0.1%) (B), and Group C (0.1% > BCR-AB1L/ABL1IS > 0.01%) (C). The BCR-ABL1 Ct values were determined for each method and showed as Tukey-boxplots. Thick lines in each boxplot represent the median BCR-ABL1 Ct value for each counting method. The dark dots indicate the outlier’s values. The student-paired t-test was used to test the difference between the five counting methods and p value below 0.05 was considered statistically significant.
Diagnostics 12 01051 g003
Figure 4. Bland–Altman showing the concordance of the BCR-ABL1 Cycle threshold values measured in matched samples counted by the manual and the automatic absolute cell-counting assay. Paired measurements of BCR-ABL1 Ct value were combined for patients stratified into three groups, each consisting of 30 individuals: Group A (10% > BCR-ABL1/ABLIS > 1%) (A), Group B (1% > BCR-ABL1/ABL1IS > 0.1%) (B), and Group C (0.1% > BCR-ABL1/ABLIS > 0.01%) (C). The graph is plotted on the XY axis where X depicts the difference of the two measurements, and the Y-axis shows the mean of the two measurements. Horizontal lines are drawn at the mean difference between the two counting methods and the upper and lower limits of agreement. The 95% confidence intervals are shown for the mean and the upper and lower limits of agreement.
Diagnostics 12 01051 g004
Figure 5. Measurement of Cycle threshold ABL1 value on matched samples counted by five different enumeration assays. Comparison of the Cycle Threshold (Ct) values of ABL1 gene transcript measured by Q-PCR in matched samples counted by five different protocols. ABL1 gene transcript was assessed in patients stratified into three groups, each consisting of 30 individuals, according to their BCR-ABL1/ABL1IS transcript: Group A (10% > BCR-ABL1/ABL1IS > 1%) (A), Group B (1% > BCR-ABL1/ABL1IS > 0.1%) (B), and Group C (0.1% > BCR-ABL1/ABL1IS > 0.01%) (C). The ABL1 Ct values were determined for each method and showed as boxplots delimited by the 25th (lower) and 75th (upper) percentile. Horizontal lines above and below each boxplot indicate the 5th and 95th percentile, respectively. Thick lines in each boxplot represent the median ABL1 Ct value for each counting method. The student-paired t-test was used to test the difference between the five counting methods and p value below 0.05 was considered statistically significant.
Diagnostics 12 01051 g005
Figure 6. Bland–Altman showing the concordance of the ABL1 Cycle threshold values measured in matched samples counted by the manual and the automatic absolute cell-counting assays. Paired measurements of ABL1 Ct value were combined for patients stratified into three groups, each consisting of 30 individuals: Group A (10% > BCR-ABL1/ABL1IS > 1%) (A), Group B (1% > BCR-ABL1/ABL1IS > 0.1%) (B), and Group C (0.1% > BCR-ABL1/ABL1IS > 0.01%) (C). The graph is plotted on the XY axis where X depicts the difference of the two measurements, and the Y-axis shows the mean of the two measurements. Horizontal lines are drawn at the mean difference between the two counting methods and the upper and lower limits of agreement. The 95% confidence intervals are shown for the mean and the upper and lower limits of agreement.
Diagnostics 12 01051 g006
Table 1. Patient Characteristics (N = 90).
CharacteristicsN.
Age
Median63
Range25–82
Follow up
Median (mo.)60
Range5–105
Sex (pts n.)
Male53 (58.9%)
Female37 (41.1%)
Leukocyte count (×109/L)
Median9.85
Range6.20–20.8
Platelet count (×109/L)
Median350
Range80–758
Hemoglobin (g/dL)
Median12.5
Range10.8–14.5
Transcript Type
e13a2 (b2a2)34
e14a2 (b3a2)48
e13a2 and e14a28
Molecular response
GROUP A (10% > BCR-ABL1/ABL1IS > 1%)30
GROUP B (1% ≥ BCR-ABL1/ABL1IS > 0.1%)30
GROUP C (0.1% ≥ BCR-ABL1/ABL1IS > 0.01%)30
Table 2. Comparison of the amount of white blood cells and RNA isolated in matched samples by five different counting methods.
Cells IsolationRNA Isolation
ProtocolCells/mL
Median
Range
Total Cells
Median
Range
ng/µL
Median
Range
260/280
Median
Range
260/230
Median
Range
Manual2.46 × 106
(1.20 × 10⁶–6.30 × 10⁶)
1.23 × 10⁸
(6.00 × 10⁷–3.15 × 10⁸)
123.00
(80–223.5)
1.9
(1.9–2.0)
2.1
(2.0–2.2)
Automatic
(PBS with cells)
2.46 × 10⁶
(1.20 × 10⁶–6.27 × 10⁶)
1.23 × 10⁸
(6.00 × 10⁷–3.14 × 10⁸)
120.35
(75–256.4)
1.9
(1.90–2.0)
2.1
(2.0–2.2)
Automatic
+ beads
2.60 × 10⁶
(1.26 × 10⁶–6.06 × 10⁶)
1.30 × 10⁸
(6.30 × 10⁷–3.03 × 10⁸)
118.12
(75–200.4)
1.9
(1.90–2.0)
2.1
(2.0–2.2)
Automatic
+ 7AAD
2,43 × 10⁶
(1.22 × 10⁶–6.16 × 10⁶)
1.22 × 10⁸
(6.10 × 10⁷–3.08 × 10⁸)
126.00
(78–232.5)
1.9
(1.9–2.0)
2.1
(2.0–2.2)
Automatic
+ 7AAD
+ beads
2,47 × 10⁶
(1.20 × 10⁶–6.04 × 10⁶)
1.24 × 10⁸
(6.00 × 10⁷–3.02 × 10⁸)
116.65
(75–223.3)
1.9
(1.90–2.0)
2.1
(2.0–2.2)
Publisher’s Note: MDPI stays neutral with regard to jurisdictional claims in published maps and institutional affiliations.