
Oxidative Stress Markers in Cerebrospinal Fluid of Newly Diagnosed Multiple Sclerosis Patients and Their Link to Iron Deposition and Atrophy

 , , ,
, , ,
Abstract
:
1. Introduction
2. Materials and Methods
2.1. Study Participants
2.2. Imaging Protocol
2.3. Image Processing
2.4. CSF Assays
2.5. Statistical Analysis
3. Results
3.1. Comparison of MS Patients and HC MRI
3.2. Comparison of CSF Biochemical Markers in MS Patients and Controls
3.3. Correlations between CSF Biochemical Markers and MRI Parameters
4. Discussion
5. Conclusions
Author Contributions
Funding
Institutional Review Board Statement
Informed Consent Statement
Data Availability Statement
Conflicts of Interest
References
- Zhang, S.-Y.; Gui, L.-N.; Liu, Y.-Y.; Shi, S.; Cheng, Y. Oxidative Stress Marker Aberrations in Multiple Sclerosis: A Meta-Analysis Study. Front. Neurosci. 2020, 14, 823. [Google Scholar] [CrossRef] [PubMed]
- Haider, L.; Fischer, M.T.; Frischer, J.M.; Bauer, J.; Höftberger, R.; Botond, G.; Esterbauer, H.; Binder, C.J.; Witztum, J.L.; Lassmann, H. Oxidative damage in multiple sclerosis lesions. Brain 2011, 134, 1914–1924. [Google Scholar] [CrossRef] [PubMed] [Green Version]
- Siotto, M.; Filippi, M.M.; Simonelli, I.; Landi, D.; Ghazaryan, A.; Vollaro, S.; Ventriglia, M.; Pasqualetti, P.; Rongioletti, M.C.A.; Squitti, R.; et al. Oxidative Stress Related to Iron Metabolism in Relapsing Remitting Multiple Sclerosis Patients with Low Disability. Front. Neurosci. 2019, 13, 86. [Google Scholar] [CrossRef] [PubMed] [Green Version]
- Voigt, D.; Scheidt, U.; Derfuss, T.; Landi, D.; Ghazaryan, A.; Vollaro, S.; Ventriglia, M.; Pasqualetti, P.; Rongioletti, M.C.A.; Squitti, R.; et al. Expression of the Antioxidative Enzyme Peroxiredoxin 2 in Multiple Sclerosis Lesions in Relation to Inflammation. Int. J. Mol. Sci. 2017, 18, 760. [Google Scholar] [CrossRef] [PubMed] [Green Version]
- Mir, F.; Lee, D.; Ray, H.; Sadiq, S.A. CSF isoprostane levels are a biomarker of oxidative stress in multiple sclerosis. Neurol.-Neuroimmunol. Neuroinflamm. 2014, 1, e21. [Google Scholar] [CrossRef] [Green Version]
- Khajenobar, N.B.; Mahboob, S.; Nourazarian, A.; Shademan, B.; Laghousi, D.; Moayed, Z.B.; Hassanpour, M.; Nikanfar, M. Comparison between cerebrospinal fluid and serum levels of myelin-associated glycoprotein, total antioxidant capacity, and 8-hydroxy-2′-deoxyguanosine in patients with multiple sclerosis. Clin. Neurol. Neurosurg. 2021, 200, 106377. [Google Scholar] [CrossRef]
- Long, J.D.; Matson, W.R.; Juhl, A.R.; Leavitt, B.R.; Paulsen, J.S.; Wassink, T.; Cross, S.; Doucette, N.; Kimble, M.; Ryan, P.; et al. 8OHdG as a marker for Huntington disease progression. Neurobiol. Dis. 2012, 46, 625–634. [Google Scholar] [CrossRef] [Green Version]
- Nimer, F.A.; Elliott, C.; Bergman, J.; Khademi, M.; Dring, A.M.; Aeinehband, S.; Bergenheim, T.; Christensen, J.R.; Sellebjerg, F.; Svenningsson, A.; et al. Lipocalin-2 is increased in progressive multiple sclerosis and inhibits remyelination. Neurol.-Neuroimmunol. Neuroinflamm. 2016, 3, e191. [Google Scholar] [CrossRef] [Green Version]
- Hänninen, K.; Viitala, M.; Paavilainen, T.; Karhu, J.O.; Rinne, J.; Koikkalainen, J.; Lötjönen, J.; Soilu-Hänninen, M. Thalamic Atrophy Predicts 5-Year Disability Progression in Multiple Sclerosis. Front. Neurol. 2020, 11, 606. [Google Scholar] [CrossRef]
- Khalil, M.; Langkammer, C.; Pichler, A.; Pinter, D.; Gattringer, T.; Bachmaier, G.; Ropele, S.; Fuchs, S.; Enzinger, C.; Fazekas, F.; et al. Dynamics of brain iron levels in multiple sclerosis: A longitudinal 3T MRI study. Neurology 2015, 84, 2396–2402. [Google Scholar] [CrossRef]
- Langkammer, C.; Schweser, F.; Krebs, N.; Deistung, A.; Goessler, W.; Scheurer, E.; Sommer, K.; Reishofer, G.; Yen, K.; Fazekas, F.; et al. Quantitative susceptibility mapping (QSM) as a means to measure brain iron? A post mortem validation study. NeuroImage 2012, 62, 1593–1599. [Google Scholar] [CrossRef] [PubMed] [Green Version]
- Rudko, D.A.; Solovey, I.; Gati, J.S.; Kremenchutzky, M.; Menon, R.S. Multiple sclerosis: Improved identification of disease-relevant changes in gray and white matter by using susceptibility-based MR imaging. Radiology 2014, 272, 851–864. [Google Scholar] [CrossRef] [PubMed]
- Conrad, M.; Angeli, J.P.F.; Vandenabeele, P.; Stockwell, B.R. Regulated necrosis: Disease relevance and therapeutic opportunities. Nat. Rev. Drug Discov. 2016, 15, 348–366. [Google Scholar] [CrossRef] [PubMed]
- Thompson, A.J.; Banwell, B.L.; Barkhof, F.; Carroll, W.M.; Coetzee, T.; Comi, G.; Correale, J.; Fazekas, F.; Filippi, M.; Freedman, M.S.; et al. Diagnosis of multiple sclerosis: 2017 revisions of the McDonald criteria. Lancet Neurol. 2018, 17, 162–173. [Google Scholar] [CrossRef]
- Burgetova, R.; Dusek, P.; Burgetova, A.; Pudlac, A.; Vaneckova, M.; Horakova, D.; Krasensky, J.; Varga, Z.; Lambert, L. Age-related magnetic susceptibility changes in deep grey matter and cerebral cortex of normal young and middle-aged adults depicted by whole brain analysis. Quant. Imaging Med. Surg. 2021, 11, 3906. [Google Scholar] [CrossRef]
- Mori, S.; Wu, D.; Ceritoglu, C.; Li, Y.; Kolasny, A.; Vaillant, M.A.; Faria, A.V.; Oishi, K.; Miller, M.I. MRICloud: Delivering High-Throughput MRI Neuroinformatics as Cloud-Based Software as a Service. Comput. Sci. Eng. 2016, 18, 21–35. [Google Scholar] [CrossRef]
- Schmidt, P.; Gaser, C.; Arsic, M.; Buck, D.; Förschler, A.; Berthele, A.; Hoshi, M.; Ilg, R.; Schmid, V.J.; Zimmer, C.; et al. An automated tool for detection of FLAIR-hyperintense white-matter lesions in Multiple Sclerosis. NeuroImage 2012, 59, 3774–3783. [Google Scholar] [CrossRef]
- Tanaka, M.; Vécsei, L. Monitoring the Redox Status in Multiple Sclerosis. Biomedicines 2020, 8, 406. [Google Scholar] [CrossRef]
- Adamczyk, B.; Adamczyk-Sowa, M. New Insights into the Role of Oxidative Stress Mechanisms in the Pathophysiology and Treatment of Multiple Sclerosis. Oxidative Med. Cell. Longev. 2016, 2016, 1973834. [Google Scholar] [CrossRef] [Green Version]
- Knoops, B.; Argyropoulou, V.; Becker, S.; Ferté, L.; Kuznetsova, O. Multiple Roles of Peroxiredoxins in Inflammation. Mol. Cells 2016, 39, 60–64. [Google Scholar]
- Massaad, C.A.; Klann, E. Reactive Oxygen Species in the Regulation of Synaptic Plasticity and Memory. Antioxid. Redox Signal. 2011, 14, 2013–2054. [Google Scholar] [CrossRef] [PubMed] [Green Version]
- Uzawa, A.; Mori, M.; Masuda, H.; Ohtani, R.; Uchida, T.; Aoki, R.; Kuwabara, S. Peroxiredoxins are involved in the pathogenesis of multiple sclerosis and neuromyelitis optica spectrum disorder. Clin. Exp. Immunol. 2020, 202, 239–248. [Google Scholar] [CrossRef] [PubMed]
- Solomon, A.J.; Watts, R.; Dewey, B.E.; Reich, D.S. MRI evaluation of thalamic volume differentiates MS from common mimics. Neurol.-Neuroimmunol. Neuroinflamm. 2017, 4, e387. [Google Scholar] [CrossRef] [Green Version]
- Gmitterová, K.; Heinemann, U.; Gawinecka, J.; Varges, D.; Ciesielczyk, B.; Valkovic, P.; Benetin, J.; Zerr, I. 8-OHdG in cerebrospinal fluid as a marker of oxidative stress in various neurodegenerative diseases. Neurodegener. Dis. 2009, 6, 263–269. [Google Scholar] [CrossRef] [PubMed]
- Tasset, I.; Agüera, E.; Sánchez-López, F.; Feijóo, M.; Giraldo, A.I.; Cruz, A.H.; Gascón, F.; Túnez, I. Peripheral oxidative stress in relapsing–remitting multiple sclerosis. Clin. Biochem. 2012, 45, 440–444. [Google Scholar] [CrossRef] [PubMed]
- Miller, E.; Morel, A.; Saso, L.; Feijóo, M.; Giraldo, A.I.; Cruz, A.H.; Gascón, F.; Túnez, I. Isoprostanes and Neuroprostanes as Biomarkers of Oxidative Stress in Neurodegenerative Diseases. Oxidative Med. Cell. Longev. 2014, 2014, e572491. [Google Scholar] [CrossRef]
- Lam, M.A.; Maghzal, G.J.; Khademi, M.; Piehl, F.; Ratzer, R.; Christensen, J.R.; Sellebjerg, F.T.; Olsson, T.; Stocker, R. Absence of systemic oxidative stress and increased CSF prostaglandin F2α in progressive MS. Neurol.-Neuroimmunol. Neuroinflamm. 2016, 3, e256. [Google Scholar] [CrossRef] [Green Version]
- Meyerhoff, N.; Rohn, K.; Carlson, R.; Tipold, A. Measurement of Neutrophil Gelatinase-Associated Lipocalin Concentration in Canine Cerebrospinal Fluid and Serum and Its Involvement in Neuroinflammation. Front. Vet. Sci. 2019, 315. [Google Scholar] [CrossRef]
- Khalil, M.; Renner, A.; Langkammer, C.; Enzinger, C.; Ropele, S.; Stojakovic, T.; Scharnagl, H.; Bachmaier, G.; Pichler, A.; Archelos, J.; et al. Cerebrospinal fluid lipocalin 2 in patients with clinically isolated syndromes and early multiple sclerosis. Mult. Scler. J. 2016, 22, 1560–1568. [Google Scholar] [CrossRef]
- Burgetova, A.; Dusek, P.; Vaneckova, M.; Horakova, D.; Langkammer, C.; Krasensky, J.; Sobisek, L.; Matras, P.; Masek, M.; Seidl, Z. Thalamic Iron Differentiates Primary-Progressive and Relapsing-Remitting Multiple Sclerosis. Am. J. Neuroradiol. 2017, 38, 1079–1086. [Google Scholar] [CrossRef] [Green Version]
- Burgetova, A.; Seidl, Z.; Krasensky, J.; Horakova, D.; Vaneckova, M. Multiple sclerosis and the accumulation of iron in the Basal Ganglia: Quantitative assessment of brain iron using MRI t(2) relaxometry. Eur. Neurol. 2010, 63, 136–143. [Google Scholar] [CrossRef] [PubMed]
- Burgetova, A.; Dusek, P.; Pudlac, A.; Nytrova, P.; Vaneckova, M.; Horakova, D.; Krasensky, J.; Lambert, L. Deep grey matter iron content in neuromyelitis optica and multiple sclerosis. BioMed Res. Int. 2020, 2020, 6492786. [Google Scholar]
- Ayala, A.; Muñoz, M.F.; Argüelles, S. Lipid Peroxidation: Production, Metabolism, and Signaling Mechanisms of Malondialdehyde and 4-Hydroxy-2-Nonenal. Oxidative Med. Cell. Longev. 2014, 2014, 360438. [Google Scholar] [CrossRef] [PubMed]
- Maciejczyk, M.; Żebrowska, E.; Zalewska, A.; Chabowski, A. Redox Balance, Antioxidant Defense, and Oxidative Damage in the Hypothalamus and Cerebral Cortex of Rats with High Fat Diet-Induced Insulin Resistance. Oxidative Med. Cell. Longev. 2018, 2018, 6940515. [Google Scholar] [CrossRef] [Green Version]
- Andravizou, A.; Dardiotis, E.; Artemiadis, A.; Sokratous, M.; Siokas, V.; Tsouris, Z.; Aloizou, A.-M.; Nikolaidis, I.; Bakirtzis, C.; Tsivgoulis, G.; et al. Brain atrophy in multiple sclerosis: Mechanisms, clinical relevance and treatment options. Autoimmun. Highlights 2019, 10, 7. [Google Scholar] [CrossRef] [Green Version]


| MS (n = 103) | MRI Controls (n = 99) | ||||
|---|---|---|---|---|---|
| Mean | Std. Deviation | Mean | Std. Deviation | p-Value | |
| Sex (male/female) | 28/75 | 38/61 | 0.090 | ||
| Age (years) | 32.5 | 8.0 | 33.7 | 8.3 | 0.305 |
| EDSS (median, IQR) | 2 | 1.5–2.5 | - | - | - |
| Lesion load (cm3) | 2.7 | 5.3 | - | - | - |
| Lesion count (median, IQR) | 7 | 4–20 | - | - | - |
| Brain parenchymal fraction (%) | 80.3 | 3.4 | 81.5 | 2.8 | 0.001 |
| DGM Volumes (cm3) | |||||
| caudate | 8.0 | 0.7 | 8.1 | 0.6 | 0.240 |
| GPI | 1.1 | 0.1 | 1.1 | 0.1 | 0.230 |
| GPE | 3.1 | 0.3 | 3.2 | 0.3 | 0.528 |
| putamen | 8.7 | 0.7 | 9.0 | 0.8 | 0.002 |
| thalamus | 9.6 | 0.6 | 9.9 | 0.6 | <0.001 |
| pulvinar | 2.3 | 0.3 | 2.5 | 0.3 | <0.001 |
| subthalamic nucleus | 0.3 | 0.1 | 0.4 | 0.1 | 0.310 |
| substantia nigra | 1.3 | 0.1 | 1.4 | 0.2 | 0.163 |
| red nucleus | 0.6 | 0.1 | 0.6 | 0.1 | 0.710 |
| dentate | 1.8 | 0.4 | 1.8 | 0.3 | 0.711 |
| DGM Susceptibilities (ppb) | |||||
| Caudate | 24.5 | 5.8 | 23.0 | 4.7 | 0.041 |
| GPI | 53.1 | 6.4 | 50.9 | 5.7 | 0.015 |
| GPE | 62.8 | 7.7 | 62.2 | 6.8 | 0.594 |
| Putamen | 23.6 | 6.7 | 23.6 | 6.1 | 0.977 |
| Thalamus | 0.9 | 2.3 | 1.0 | 2.0 | 0.728 |
| Pulvinar | 17.9 | 5.2 | 18.3 | 5.2 | 0.582 |
| subthalamic nucleus | 41.9 | 7.3 | 43.2 | 6.9 | 0.214 |
| substantia nigra | 53.4 | 7.3 | 52.2 | 6.6 | 0.099 |
| red nucleus | 39.2 | 7.8 | 39.7 | 8.1 | 0.639 |
| Dentate | 37.4 | 8.6 | 36.9 | 9.8 | 0.693 |
| MS (n = 62) | CSF Controls (n = 45) | ||||
|---|---|---|---|---|---|
| Mean | Std. Deviation | Mean | Std. Deviation | p-Value | |
| Sex (male/female) | 19/43 | 20/25 | 0.143 | ||
| Age (years) | 33.3 | 8.6 | 40.2 | 11.6 | <0.001 |
| CSF sampling to MRI interval (months) | 1.1 | 3.9 | n.d | n.d. | n.d. |
| Cerebrospinal Fluid Analysis | |||||
| 8-OHdG (ng/mL) | 0.112 (median = 0) | 0.310 (IQR = 0 to 0) | 0.026 (median = 0) | 0.122 (IQR = 0 to 0) | 0.0411 |
| 8-isoPG (ng/L) | 44.319 | 13.611 | 41.071 | 9.679 | 0.447 |
| NGAL (ng/mL) | 4.366 | 2.085 | 4.968 | 2.226 | 0.473 |
| PRDX2 (ng/mL) | 10.966 | 2.961 | 9.437 | 3.945 | 0.015 |
| MDA + HAE (µmol/L) | 0.605 2 | 0.264 2 | 0.448 | 0.153 | 0.003 |
| Structure | 8-OHdG | 8-isoPG | NGAL | PRDX2 | MDA + HAE | |||||
|---|---|---|---|---|---|---|---|---|---|---|
| r | p | r | p | r | p | r | p | r | p | |
| Volume | ||||||||||
| caudate | 0.017 | 0.899 | −0.147 | 0.271 | −0.170 | 0.195 | −0.236 | 0.069 | −0.328 | 0.055 |
| globus pallidus int. | 0.175 | 0.181 | −0.020 | 0.879 | 0.039 | 0.765 | −0.005 | 0.971 | −0.459 | 0.006 |
| globus pallidus ext. | 0.195 | 0.136 | −0.199 | 0.134 | −0.081 | 0.539 | −0.083 | 0.529 | −0.433 | 0.009 |
| putamen | 0.115 | 0.380 | 0.022 | 0.869 | −0.137 | 0.297 | −0.069 | 0.602 | −0.008 | 0.963 |
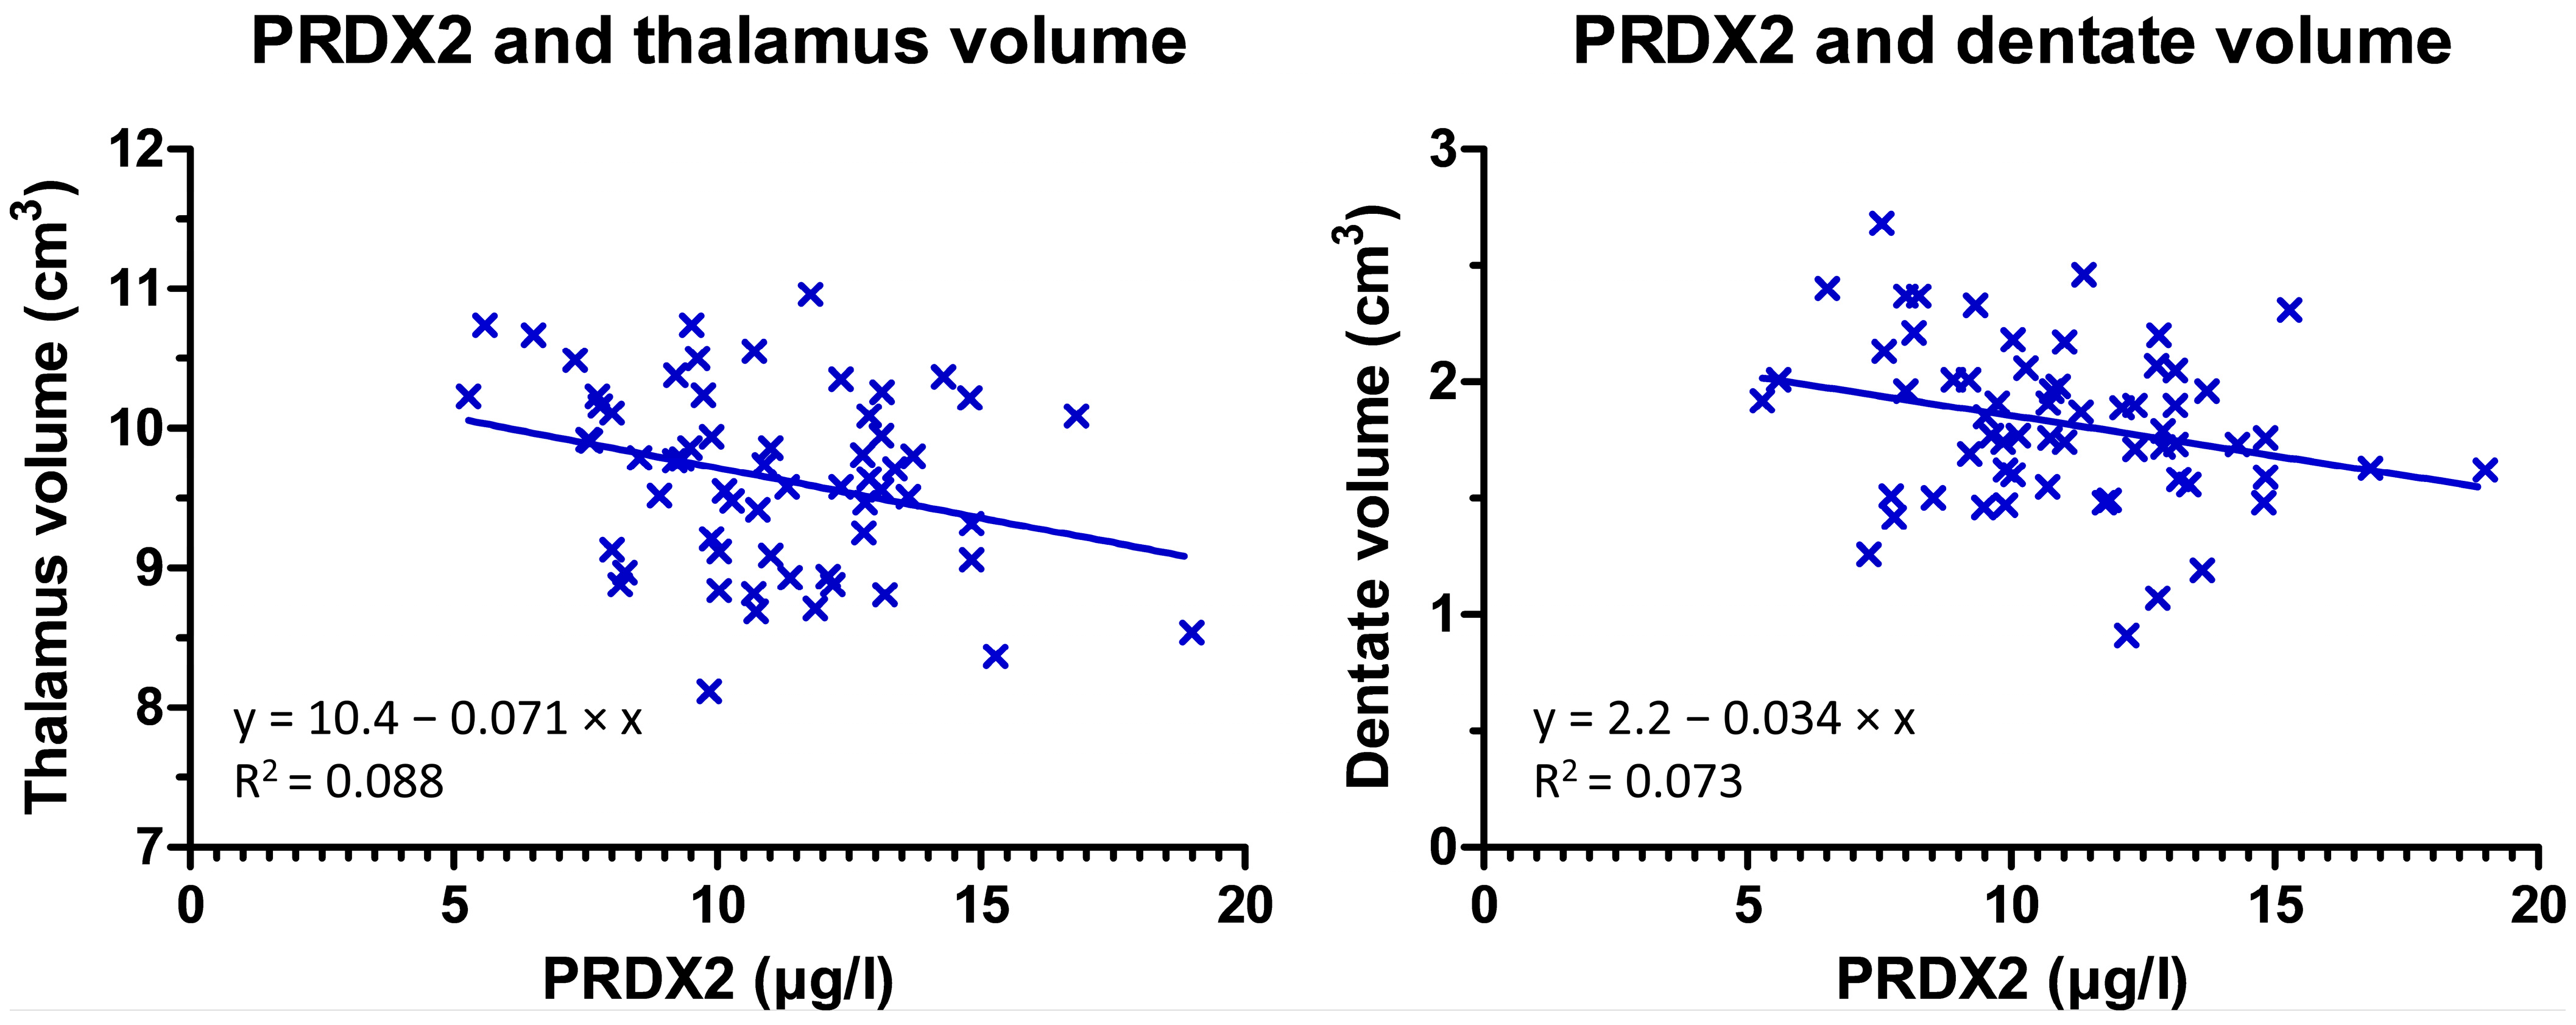
| thalamus | 0.074 | 0.575 | −0.028 | 0.833 | −0.045 | 0.733 | −0.341 | 0.008 | 0.025 | 0.886 |
| pulvinar thalami | 0.129 | 0.328 | 0.036 | 0.786 | −0.067 | 0.613 | −0.240 | 0.064 | 0.020 | 0.909 |
| subthalamic nucleus | 0.032 | 0.806 | −0.189 | 0.155 | 0.008 | 0.950 | 0.011 | 0.934 | −0.374 | 0.027 |
| substantia nigra | 0.002 | 0.990 | −0.115 | 0.391 | −0.145 | 0.268 | −0.112 | 0.393 | −0.229 | 0.187 |
| red nucleus | 0.046 | 0.724 | −0.152 | 0.256 | −0.036 | 0.786 | −0.034 | 0.795 | −0.299 | 0.081 |
| dentate | −0.014 | 0.916 | −0.097 | 0.471 | −0.292 | 0.023 | −0.291 | 0.024 | −0.261 | 0.130 |
| Susceptibility | ||||||||||
| caudate | −0.283 | 0.026 | −0.098 | 0.450 | 0.009 | 0.942 | −0.042 | 0.747 | 0.200 | 0.234 |
| globus pallidus int | 0.029 | 0.821 | −0.141 | 0.276 | 0.120 | 0.352 | 0.124 | 0.339 | 0.207 | 0.220 |
| globus pallidus ext | −0.037 | 0.777 | −0.276 | 0.030 | 0.017 | 0.894 | 0.097 | 0.452 | 0.283 | 0.089 |
| putamen | −0.396 | 0.001 | −0.095 | 0.462 | 0.031 | 0.808 | −0.058 | 0.654 | 0.213 | 0.205 |
| thalamus | 0.139 | 0.280 | 0.103 | 0.426 | −0.055 | 0.669 | −0.099 | 0.446 | −0.088 | 0.603 |
| pulvinar thalami | −0.172 | 0.181 | −0.016 | 0.900 | −0.129 | 0.317 | −0.245 | 0.055 | 0.024 | 0.888 |
| subthalamic nucleus | −0.141 | 0.275 | −0.215 | 0.093 | 0.016 | 0.899 | 0.092 | 0.476 | 0.285 | 0.088 |
| substantia nigra | −0.101 | 0.433 | −0.107 | 0.407 | 0.052 | 0.686 | 0.190 | 0.139 | 0.296 | 0.076 |
| red nucleus | −0.309 | 0.015 | −0.075 | 0.561 | 0.016 | 0.904 | −0.010 | 0.941 | 0.295 | 0.077 |
| dentate | −0.067 | 0.604 | −0.154 | 0.231 | −0.314 | 0.013 | −0.293 | 0.021 | 0.011 | 0.947 |
Publisher’s Note: MDPI stays neutral with regard to jurisdictional claims in published maps and institutional affiliations. |
© 2022 by the authors. Licensee MDPI, Basel, Switzerland. This article is an open access article distributed under the terms and conditions of the Creative Commons Attribution (CC BY) license (https://creativecommons.org/licenses/by/4.0/).
Share and Cite
Burgetova, A.; Dusek, P.; Uher, T.; Vaneckova, M.; Vejrazka, M.; Burgetova, R.; Horakova, D.; Srpova, B.; Krasensky, J.; Lambert, L. Oxidative Stress Markers in Cerebrospinal Fluid of Newly Diagnosed Multiple Sclerosis Patients and Their Link to Iron Deposition and Atrophy. Diagnostics 2022, 12, 1365. https://doi.org/10.3390/diagnostics12061365
Burgetova A, Dusek P, Uher T, Vaneckova M, Vejrazka M, Burgetova R, Horakova D, Srpova B, Krasensky J, Lambert L. Oxidative Stress Markers in Cerebrospinal Fluid of Newly Diagnosed Multiple Sclerosis Patients and Their Link to Iron Deposition and Atrophy. Diagnostics. 2022; 12(6):1365. https://doi.org/10.3390/diagnostics12061365
Chicago/Turabian StyleBurgetova, Andrea, Petr Dusek, Tomas Uher, Manuela Vaneckova, Martin Vejrazka, Romana Burgetova, Dana Horakova, Barbora Srpova, Jan Krasensky, and Lukas Lambert. 2022. "Oxidative Stress Markers in Cerebrospinal Fluid of Newly Diagnosed Multiple Sclerosis Patients and Their Link to Iron Deposition and Atrophy" Diagnostics 12, no. 6: 1365. https://doi.org/10.3390/diagnostics12061365
APA StyleBurgetova, A., Dusek, P., Uher, T., Vaneckova, M., Vejrazka, M., Burgetova, R., Horakova, D., Srpova, B., Krasensky, J., & Lambert, L. (2022). Oxidative Stress Markers in Cerebrospinal Fluid of Newly Diagnosed Multiple Sclerosis Patients and Their Link to Iron Deposition and Atrophy. Diagnostics, 12(6), 1365. https://doi.org/10.3390/diagnostics12061365