
Comparison of Rapid Diagnostic Test, Microscopy, and Polymerase Chain Reaction for the Detection of Plasmodium falciparum Malaria in a Low-Transmission Area, Jazan Region, Southwestern Saudi Arabia


Abstract
:1. Introduction
2. Materials and Methods
2.1. Study Design
2.2. Study Settings
2.3. Blood Sampling
2.4. Microscopy
2.5. AllTest Malaria p.f./p.v. Rapid Test Cassette
2.6. Molecular Analysis
2.7. Data Analysis
3. Results
4. Discussion
5. Conclusions
Author Contributions
Funding
Institutional Review Board Statement
Informed Consent Statement
Data Availability Statement
Acknowledgments
Conflicts of Interest
References
- GBD 2019 Diseases and Injuries Collaborators. Global burden of 369 diseases and injuries in 204 countries and territories, 1990–2019: A systematic analysis for the Global Burden of Disease Study 2019. Lancet 2020, 396, 1204–1222. [Google Scholar] [CrossRef]
- WHO. World Malaria Report 2021; World Health Organization: Geneva, Switzerland, 2021; Available online: https://www.who.int/publications/i/item/9789240040496 (accessed on 13 March 2022).
- WHO. Global Technical Strategy for Malaria 2016–2030; World Health Organization: Geneva, Switzerland, 2016; Available online: https://www.who.int/docs/default-source/documents/global-technical-strategy-for-malaria-2016-2030.pdf (accessed on 15 March 2022).
- Singh, B.; Kim Sung, L.; Matusop, A.; Radhakrishnan, A.; Shamsul, S.S.; Cox-Singh, J.; Thomas, A.; Conway, D.J. A large focus of naturally acquired Plasmodium knowlesi infections in human beings. Lancet 2004, 363, 1017–1024. [Google Scholar] [CrossRef]
- Li, M.I.; Mailepessov, D.; Vythilingam, I.; Lee, V.; Lam, P.; Ng, L.C.; Tan, C.H. Prevalence of simian malaria parasites in macaques of Singapore. PLoS Negl. Trop. Dis. 2021, 15, e0009110. [Google Scholar] [CrossRef]
- Landier, J.; Parker, D.M.; Thu, A.M.; Carrara, V.I.; Lwin, K.M.; Bonnington, C.A.; Pukrittayakamee, S.; Delmas, G.; Nosten, F.H. The role of early detection and treatment in malaria elimination. Malar. J. 2016, 15, 363. [Google Scholar] [CrossRef] [Green Version]
- Oyegoke, O.O.; Maharaj, L.; Akoniyon, O.P.; Kwoji, I.; Roux, A.T.; Adewumi, T.S.; Maharaj, R.; Oyebola, B.T.; Adeleke, M.A.; Okpeku, M. Malaria diagnostic methods with the elimination goal in view. Parasitol. Res. 2022, 121, 1867–1885. [Google Scholar] [CrossRef]
- WHO. Disease Surveillance for Malaria Control; World Health Organization: Geneva, Switzerland, 2012; Available online: https://apps.who.int/iris/bitstream/handle/10665/44851/9789241503341_eng.pdf?sequence=1 (accessed on 3 March 2022).
- Bell, D.; Wongsrichanalai, C.; Barnwell, J.W. Ensuring quality and access for malaria diagnosis: How can it be achieved? Nat. Rev. Microbiol. 2006, 4, S7–S20. [Google Scholar] [CrossRef]
- Kotepui, M.; Kotepui, K.U.; De Jesus Milanez, G.; Masangkay, F.R. Summary of discordant results between rapid diagnosis tests, microscopy, and polymerase chain reaction for detecting Plasmodium mixed infection: A systematic review and meta-analysis. Sci. Rep. 2020, 10, 12765. [Google Scholar] [CrossRef]
- Yimam, Y.; Mohebali, M.; Abbaszadeh Afshar, M.J. Comparison of diagnostic performance between conventional and ultrasensitive rapid diagnostic tests for diagnosis of malaria: A systematic review and meta-analysis. PLoS ONE 2022, 17, e0263770. [Google Scholar] [CrossRef]
- WHO. Malaria Rapid Diagnostic Test Performance: Results of WHO Product Testing of Malaria RDTs: Round 8 (2016–2018); World Health Organization: Geneva, Switzerland, 2018; Available online: https://apps.who.int/iris/bitstream/handle/10665/276190/9789241514965-eng.pdf (accessed on 30 March 2022).
- Shiff, C.J.; Premji, Z.; Minjas, J.N. The rapid manual ParaSight-F test. A new diagnostic tool for Plasmodium falciparum infection. Trans. R. Soc. Trop. Med. Hyg. 1993, 87, 646–648. [Google Scholar] [CrossRef]
- Nderu, D.; Kimani, F.; Thiong’o, K.; Karanja, E.; Akinyi, M.; Too, E.; Chege, W.; Nambati, E.; Meyer, C.G.; Velavan, T.P. Plasmodium falciparum histidine-rich protein (PfHRP2 and 3) diversity in Western and Coastal Kenya. Sci. Rep. 2019, 9, 1709. [Google Scholar] [CrossRef] [Green Version]
- Slater, L.; Ashraf, S.; Zahid, O.; Ali, Q.; Oneeb, M.; Akbar, M.H.; Riaz, M.I.; Afshan, K.; Sargison, N.; Chaudhry, U. Current methods for the detection of Plasmodium parasite species infecting humans. Curr. Res. Parasitol. Vector. Borne Dis. 2022, 2, 100086. [Google Scholar] [CrossRef]
- WHO. Master Protocol for Surveillance of pfhrp2/3 Deletions and Biobanking to Support Future Research; World Health Organization: Geneva, Switzerland, 2020; Available online: https://apps.who.int/iris/bitstream/handle/10665/331197/9789240002050-eng.pdf (accessed on 28 February 2022).
- Feleke, S.M.; Reichert, E.N.; Mohammed, H.; Brhane, B.G.; Mekete, K.; Mamo, H.; Petros, B.; Solomon, H.; Abate, E.; Hennelly, C.; et al. Plasmodium falciparum is evolving to escape malaria rapid diagnostic tests in Ethiopia. Nat. Microbiol. 2021, 6, 1289–1299. [Google Scholar] [CrossRef]
- Kojom Foko, L.P.; Pande, V.; Singh, V. Field performances of rapid diagnostic tests detecting human Plasmodium species: A systematic review and meta-analysis in India, 1990–2020. Diagnostics 2021, 11, 590. [Google Scholar] [CrossRef]
- Moody, A. Rapid diagnostic test for malaria parasites. Clin. Microbiol. 2002, 15, 66–78. [Google Scholar] [CrossRef] [Green Version]
- Berzosa, P.; de Lucio, A.; Romay-Barja, M.; Herrador, Z.; González, V.; García, L.; Fernández-Martínez, A.; Santana-Morales, M.; Ncogo, P.; Valladares, B.; et al. Comparison of three diagnostic methods (microscopy, RDT, and PCR) for the detection of malaria parasites in representative samples from Equatorial Guinea. Malar. J. 2018, 17, 333. [Google Scholar] [CrossRef]
- Hawkes, M.; Kain, K.C. Advances in malaria diagnosis. Expert Rev. Anti Infect. Ther. 2007, 5, 485–495. [Google Scholar] [CrossRef]
- Ahmad, A.; Soni, P.; Kumar, L.; Singh, M.P.; Verma, A.K.; Sharma, A.; Das, A.; Bharti, P.K. Comparison of polymerase chain reaction, microscopy, and rapid diagnostic test in malaria detection in a high burden state (Odisha) of India. Pathog. Glob. Health 2021, 115, 267–272. [Google Scholar] [CrossRef]
- Coleman, M.; Al-Zahrani, M.H.; Coleman, M.; Hemingway, J.; Omar, A.; Stanton, M.C.; Thomsen, E.K.; Alsheikh, A.A.; Alhakeem, R.F.; McCall, P.J.; et al. A country on the verge of malaria elimination-the Kingdom of Saudi Arabia. PLoS ONE 2014, 9, e105980. [Google Scholar] [CrossRef] [Green Version]
- MOH. Statistical Yearbook 2018. Riyadh: Ministry of Health. 2020. Available online: https://www.moh.gov.sa/en/Ministry/Statistics/book/Pages/default.aspx (accessed on 15 April 2021).
- Al-Mekhlafi, H.M.; Madkhali, A.M.; Ghailan, K.Y.; Abdulhaq, A.A.; Ghzwani, A.H.; Zain, K.A.; Atroosh, W.M.; Alshabi, A.; Khadashi, H.A.; Darraj, M.A.; et al. Residual malaria in Jazan region, southwestern Saudi Arabia: The situation, challenges and climatic drivers of autochthonous malaria. Malar. J. 2021, 20, 315. [Google Scholar] [CrossRef]
- GASTAT. Riyadh: General Authority for Statistics, Kingdom of Saudi Arabia. Census 2010. Available online: https://www.stats.gov.sa/en/13 (accessed on 25 November 2020).
- Patlakas, P.; Stathopoulos, C.; Flocas, H.; Kalogeri, C.; Kallos, G. Regional climatic features of the Arabian Peninsula. Atmosphere 2019, 10, 220. [Google Scholar] [CrossRef] [Green Version]
- Alahmed, A.M.; Al Kuriji, M.A.; Kheir, S.M.; Al Haqawi, H.M.; Sultan, E.A.A. Mosquito (Diptera: Culicidae) and their seasonal activity in Jazan Region, Saudi Arabia. J. Saudi Soc. Agric. Sci. 2010, 9, 136–138. [Google Scholar]
- MOH. National Malaria Drug Policy. Riyadh: Ministry of Health. 2018. Available online: https://www.moh.gov.sa/Ministry/About/Health%20Policies/029.pdf (accessed on 30 January 2022).
- WHO. Microscopy for the Detection, Identification and Quantification of Malaria Parasites on Stained Thick and Thin Blood Films in Research Settings; World Health Organization: Geneva, Switzerland, 2015; Available online: https://apps.who.int/iris/handle/10665/163782 (accessed on 30 April 2022).
- Fransisca, L.; Kusnanto, J.H.; Satoto, T.B.; Sebayang, B.; Supriyanto; Andriyan, E.; Bangs, M.J. Comparison of rapid diagnostic test Plasmotec Malaria-3, microscopy, and quantitative real-time PCR for diagnoses of Plasmodium falciparum and Plasmodium vivax infections in Mimika Regency, Papua, Indonesia. Malar. J. 2015, 14, 103. [Google Scholar] [CrossRef] [PubMed] [Green Version]
- Singh, B.; Bobogare, A.; Cox-Singh, J.; Snounou, G.; Abdullah, M.S.; Rahman, H.A. A genus- and species-specific nested polymerase chain reaction malaria detection assay for epidemiological studies. Am. J. Trop. Med. Hyg. 1999, 60, 687–692. [Google Scholar] [CrossRef]
- Kozycki, C.T.; Umulisa, N.; Rulisa, S.; Mwikarago, E.I.; Musabyimana, J.P.; Habimana, J.P.; Karema, C.; Krogstad, D.J. False-negative malaria rapid diagnostic tests in Rwanda: Impact of Plasmodium falciparum isolates lacking HRP2 and declining malaria transmission. Malar. J. 2017, 16, 123. [Google Scholar] [CrossRef] [Green Version]
- Abdalla, Z.A.; Rahma, N.A.; Hassan, E.E.; Abdallah, T.M.; Hamad, H.E.; Omer, S.A.; Adam, I. The diagnostic performance of rapid diagnostic tests and microscopy for malaria diagnosis in eastern Sudan using a nested polymerase chain reaction assay as a reference standard. Trans. R. Soc. Trop. Med. Hyg. 2019, 113, 701–705. [Google Scholar] [CrossRef]
- Mfuh, K.O.; Achonduh-Atijegbe, O.A.; Bekindaka, O.N.; Esemu, L.F.; Mbakop, C.D.; Gandhi, K.; Leke, R.; Taylor, D.W.; Nerurkar, V.R. A comparison of thick-film microscopy, rapid diagnostic test, and polymerase chain reaction for accurate diagnosis of Plasmodium falciparum malaria. Malar. J. 2019, 18, 73. [Google Scholar] [CrossRef] [Green Version]
- Belachew, M.; Wolde, M.; Nega, D.; Gidey, B.; Negash, L.; Assefa, A.; Tasew, G.; Woyessa, A.; Abera, A. Evaluating performance of multiplex real time PCR for the diagnosis of malaria at elimination targeted low transmission settings of Ethiopia. Malar. J. 2022, 21, 9. [Google Scholar] [CrossRef]
- Hawash, Y.; Ismail, K.; Alsharif, K.; Alsanie, W. Malaria prevalence in a low transmission area, Jazan district of southwestern Saudi Arabia. Korean J. Parasitol. 2019, 57, 233–242. [Google Scholar] [CrossRef] [Green Version]
- Singh, N.; Bharti, P.K.; Singh, M.P.; Mishra, S.; Shukla, M.M.; Sharma, R.K.; Singh, R.K. Comparative evaluation of bivalent malaria rapid diagnostic tests versus traditional methods in field with special reference to heat stability testing in Central India. PLoS ONE 2013, 8, e58080. [Google Scholar] [CrossRef] [Green Version]
- Ali, I.M.; Nji, A.M.; Bonkum, J.C.; Moyeh, M.N.; Carole, G.K.; Efon, A.; Dabou, S.; Tchuenkam, V.; Tah, C.; Kengne, J.C.; et al. Diagnostic accuracy of CareStart™ malaria HRP2 and SD Bioline Pf/PAN for malaria in febrile outpatients in varying malaria transmission settings in Cameroon. Diagnostics 2021, 11, 1556. [Google Scholar] [CrossRef]
- Kavanaugh, M.J.; Azzam, S.E.; Rockabrand, D.M. Malaria rapid diagnostic tests: Literary review and recommendation for a quality assurance, quality control algorithm. Diagnostics 2021, 11, 768. [Google Scholar] [CrossRef]
- Shakely, D.; Elfving, K.; Aydin-Schmidt, B.; Msellem, M.I.; Morris, U.; Omar, R.; Weiping, X.; Petzold, M.; Greenhouse, B.; Baltzell, K.A.; et al. The usefulness of rapid diagnostic tests in the new context of low malaria transmission in Zanzibar. PLoS ONE 2013, 8, e72912. [Google Scholar] [CrossRef] [Green Version]
- Onken, A.; Haanshuus, C.G.; Miraji, M.K.; Marijani, M.; Kibwana, K.O.; Abeid, K.A.; Mørch, K.; Reimers, M.; Langeland, N.; Müller, F.; et al. Malaria prevalence and performance of diagnostic tests among patients hospitalized with acute undifferentiated fever in Zanzibar. Malar. J. 2022, 21, 54. [Google Scholar] [CrossRef]
- Ngasala, B.; Mutemi, D.D.; Mwaiswelo, R.O. Diagnostic performance of malaria rapid diagnostic test and microscopy compared with PCR for detection of Plasmodium falciparum infections among primary schoolchildren in Kibiti District, Eastern Tanzania: An area with moderate malaria transmission. Am. J. Trop. Med. Hyg. 2019, 101, 809–811. [Google Scholar] [CrossRef]
- Diallo, M.A.; Diongue, K.; Ndiaye, M.; Gaye, A.; Deme, A.; Badiane, A.S.; Ndiaye, D. Evaluation of CareStart™ Malaria HRP2/pLDH (Pf/pan) combo test in a malaria low transmission region of Senegal. Malar. J. 2017, 16, 328. [Google Scholar] [CrossRef] [Green Version]
- Rogier, E.; Hamre, K.; Joseph, V.; Plucinski, M.M.; Presume, J.; Romilus, I.; Mondelus, G.; Elisme, T.; van den Hoogen, L.; Lemoine, J.F.; et al. Conventional and high-sensitivity malaria rapid diagnostic test performance in 2 transmission settings: Haiti 2017. J. Infect. Dis. 2020, 221, 786–795. [Google Scholar] [CrossRef]
- Moyeh, M.N.; Ali, I.M.; Njimoh, D.L.; Nji, A.M.; Netongo, P.M.; Evehe, M.S.; Atogho-Tiedeu, B.; Ghogomu, S.M.; Mbacham, W.F. Comparison of the accuracy of four malaria diagnostic methods in a high transmission setting in Coastal Cameroon. J. Parasitol. Res. 2019, 2019, 1417967. [Google Scholar] [CrossRef] [Green Version]
- Alareqi, L.M.; Mahdy, M.A.; Lau, Y.L.; Fong, M.Y.; Abdul-Ghani, R.; Ali, A.A.; Cheong, F.W.; Tawfek, R.; Mahmud, R. Field evaluation of a PfHRP-2/pLDH rapid diagnostic test and light microscopy for diagnosis and screening of falciparum malaria during the peak seasonal transmission in an endemic area in Yemen. Malar. J. 2016, 15, 49. [Google Scholar] [CrossRef] [Green Version]
- Zaki, W.M.; Madkhali, A.M. Accuracy of immunochromatography diagnostic test versus microscopy in the diagnosis of malaria among clinically suspected patients in Jazan area, KSA. Parasitol. United J. 2016, 9, 95. [Google Scholar] [CrossRef]
- Sharew, B.; Legesse, M.; Animut, A.; Jima, D.; Medhin, G.; Erko, B. Evaluation of the performance of CareStart Malaria Pf/Pv combo and Paracheck Pf tests for the diagnosis of malaria in Wondo Genet, southern Ethiopia. Acta Trop. 2009, 111, 321–324. [Google Scholar] [CrossRef]
- Wardhani, P.; Butarbutar, T.V.; Adiatmaja, C.O.; Betaubun, A.M.; Hamidah, N.; Aryati. Performance comparison of two malaria rapid diagnostic test with real time polymerase chain reaction and gold standard of microscopy detection method. Infect. Dis. Rep. 2020, 12, 8731. [Google Scholar] [CrossRef]
- Atroosh, W.M.; Al-Mekhlafi, H.M.; Al-Jasari, A.; Sady, H.; Al-Delaimy, A.K.; Nasr, N.A.; Dawaki, S.; Abdulsalam, A.M.; Ithoi, I.; Lau, Y.L.; et al. Genetic variation of pfhrp2 in Plasmodium falciparum isolates from Yemen and the performance of HRP2-based malaria rapid diagnostic test. Parasit. Vectors 2015, 8, 388. [Google Scholar] [CrossRef] [Green Version]
- Nguyen, T.N.; von Seidlein, L.; Nguyen, T.V.; Truong, P.N.; Hung, S.D.; Pham, H.T.; Nguyen, T.U.; Le, T.D.; Dao, V.H.; Mukaka, M.; et al. The persistence and oscillations of submicroscopic Plasmodium falciparum and Plasmodium vivax infections over time in Vietnam: An open cohort study. Lancet Infect. Dis 2018, 18, 565–572. [Google Scholar] [CrossRef] [Green Version]
- Kumari, M.S.; Sharma, S.; Bhardwaj, N.; Kumar, S.; Ahmed, M.Z.; Pande, V.; Anvikar, A.R. Pfhrp2/3 gene deletion and genetic variation in PfHRP2-based RDTs with P. falciparum positive samples from India and its implication on malaria control. Infect. Genet. Evol. 2022, 99, 105232. [Google Scholar] [CrossRef]
- Grandesso, F.; Nabasumba, C.; Nyehangane, D.; Page, A.L.; Bastard, M.; De Smet, M.; Boum, Y.; Etard, J.F. Performance and time to become negative after treatment of three malaria rapid diagnostic tests in low and high malaria transmission settings. Malar. J. 2016, 15, 496. [Google Scholar] [CrossRef] [Green Version]
- Gatton, M.L.; Ciketic, S.; Barnwell, J.W.; Cheng, Q.; Chiodini, P.L.; Incardona, S.; Bell, D.; Cunningham, J.; González, I.J. An assessment of false positive rates for malaria rapid diagnostic tests caused by non-Plasmodium infectious agents and immunological factors. PLoS ONE 2018, 13, e0197395. [Google Scholar] [CrossRef] [Green Version]
- Okell, L.C.; Ghani, A.C.; Lyons, E.; Drakeley, C.J. Submicroscopic infection in Plasmodium falciparum-endemic populations: A systematic review and meta-analysis. J. Infect. Dis. 2009, 200, 1509–1517. [Google Scholar] [CrossRef] [Green Version]
- Wu, L.; van den Hoogen, L.L.; Slater, H.; Walker, P.G.; Ghani, A.C.; Drakeley, C.J.; Okell, L.C. Comparison of diagnostics for the detection of asymptomatic Plasmodium falciparum infections to inform control and elimination strategies. Nature 2015, 528, S86–S93. [Google Scholar] [CrossRef] [Green Version]
- Niang, M.; Thiam, L.G.; Sane, R.; Diagne, N.; Talla, C.; Doucoure, S.; Faye, J.; Diop, F.; Badiane, A.; Diouf, B.; et al. Substantial asymptomatic submicroscopic Plasmodium carriage during dry season in low transmission areas in Senegal: Implications for malaria control and elimination. PLoS ONE 2017, 12, e0182189. [Google Scholar] [CrossRef]
- WHO Malaria Policy Advisory Committee and Secretariat. Malaria policy advisory committee to the WHO: Conclusions and recommendations of September 2013 meeting. Malar. J. 2013, 12, 456. [Google Scholar] [CrossRef] [Green Version]
- Baeyens, J.P.; Serrien, B.; Goossens, M.; Clijsen, R. Questioning the “SPIN and SNOUT” rule in clinical testing. Arch. Physiother. 2019, 9, 4. [Google Scholar] [CrossRef] [Green Version]
- Jaeschke, R.; Guyatt, G.; Sackett, D. Users’ Guide to the Medical Literature. III. How to use an article about a diagnostic test. B. What are the results and will they help me in caring for my patients? The evidence-based medicine working group. J. Am. Med. Assoc. 1994, 271, 703–707. [Google Scholar] [CrossRef]
- Laurent, A.; Schellenberg, J.; Shirima, K.; Ketende, S.C.; Alonso, P.L.; Mshinda, H.; Tanner, M.; Schellenberg, D. Performance of HRP-2 based rapid diagnostic test for malaria and its variation with age in an area of intense malaria transmission in southern Tanzania. Malar. J. 2010, 9, 294. [Google Scholar] [CrossRef] [PubMed] [Green Version]
- Fryauff, D.J.; Gomez-Saladin, E.; Purnomo; Sumawinata, I.; Sutamihardja, M.A.; Tuti, S.; Subianto, B.; Richie, T.L. Comparative performance of the ParaSight F test for detection of Plasmodium falciparum in malaria-immune and nonimmune populations in Irian Jaya, Indonesia. Bull. World Health Organ. 1997, 75, 547–552. [Google Scholar] [PubMed]
- Kosack, C.S.; Naing, W.T.; Piriou, E.; Shanks, L. Routine parallel diagnosis of malaria using microscopy and the malaria rapid diagnostic test SD 05FK60: The experience of Médecins Sans Frontières in Myanmar. Malar. J. 2013, 12, 167. [Google Scholar] [CrossRef] [Green Version]


| Characteristic | PCR + ve RDT + ve | PCR + ve RDT − ve | PCR − ve RDT + ve | PCR − ve RDT − ve | PCR + ve LM + ve | PCR + ve LM − ve | PCR − ve LM + ve | PCR − ve LM − ve |
|---|---|---|---|---|---|---|---|---|
| Overall | 45 (11.2) | 12 (3.0) | 3 (0.8) | 340 (85.0) | 41 (10.2) | 16 (4.0) | 1 (0.3) | 342 (85.5) |
| Age group (year) | ||||||||
| <18 | 8 (17.8) | 1 (8.4) | 0 (0.0) | 39 (11.5) | 8 (19.5) | 1 (6.2) | 0 | 39 (11.4) |
| 18–30 | 20 (44.4) | 4 (33.3) | 1 (33.3) | 146 (42.9) | 18 (43.9) | 6 (37.5) | 0 | 147 (43.0) |
| 31–40 | 11 (24.4) | 3 (25.0) | 1 (33.3) | 94 (27.7) | 9 (22.0) | 5 (31.3) | 0 | 95 (27.8) |
| >40 | 6 (13.4) | 4 (33.3) | 1 (33.3) | 61 (17.9) | 6 (14.6) | 4 (25.0) | 1 (100) | 61 (17.8) |
| Sex | ||||||||
| Women | 10 (22.2) | 3 (25.0) | 0 (0.0) | 101 (29.7) | 10 (24.4) | 3 (18.7) | 0 | 101 (29.5) |
| Men | 35 (77.8) | 9 (75.5) | 3 (100) | 239 (70.3) | 31 (75.6) | 13 (81.3) | 1 (100) | 241 (70.5) |
| Residence | ||||||||
| Urban | 16 (35.6) | 5 (41.7) | 1 (33.3) | 130 (38.2) | 14 (34.1) | 7 (43.7) | 0 | 131 (38.3) |
| Rural | 29 (64.4) | 7 (58.3) | 2 (66.7) | 210 (61.8) | 27 (65.9) | 9 (56.3) | 1 (100) | 211 (61.7) |
| Nationality | ||||||||
| Saudi | 9 (20.0) | 4 (33.3) | 0 (0.0) | 121 (35.6) | 8 (19.5) | 5 (31.3) | 0 | 121 (35.4) |
| Non-Saudi | 36 (80.0) | 8 (66.7) | 3 (100) | 219 (64.4) | 33 (80.5) | 11 (68.7) | 1 (100) | 221 (64.6) |
| Test Characteristic | PCR as Reference Method | Microscopy as Reference Method | ||
|---|---|---|---|---|
| RDT | Microscopy | RDT | PCR | |
| True positive | 45 | 41 | 35 | 41 |
| False positive | 3 | 1 | 13 | 16 |
| True negative | 340 | 342 | 345 | 342 |
| False negative | 12 | 16 | 7 | 1 |
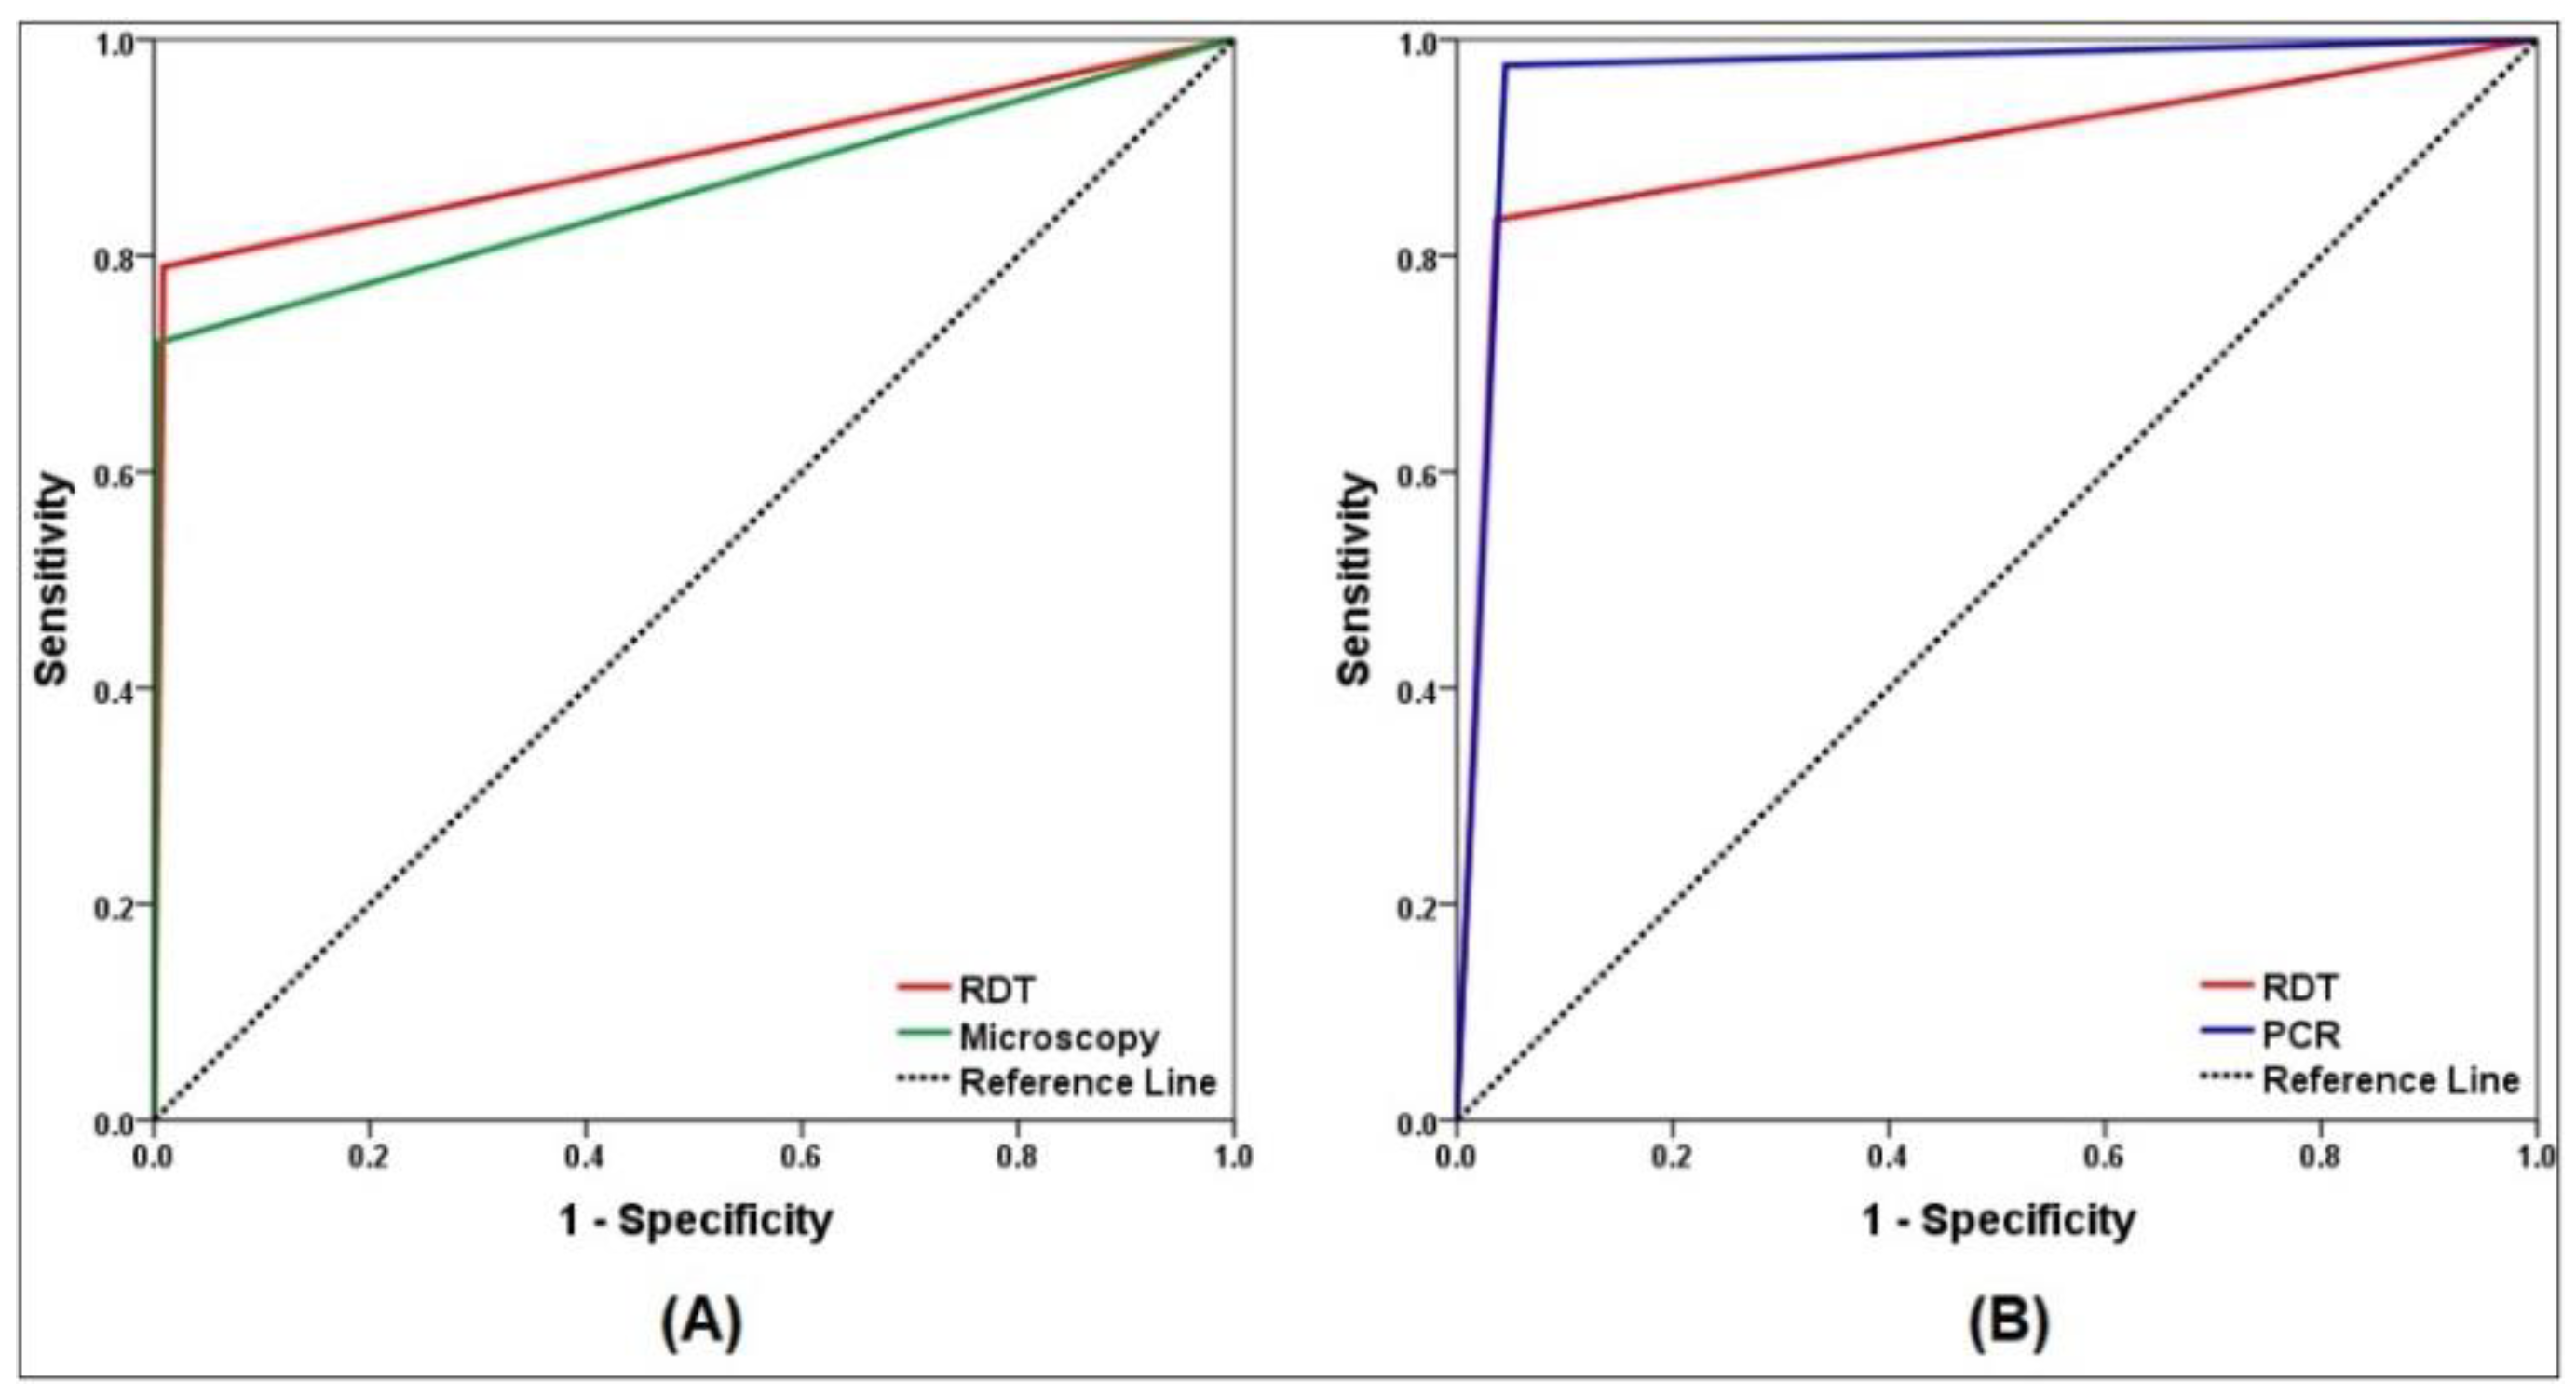
| Sensitivity | 79.0 (66.1–88.6) | 71.9 (58.5–83.0) | 83.3 (68.6–93.0) | 97.6 (87.4–99.9) |
| Specificity | 99.1 (97.5–99.8) | 99.7 (98.4–100) | 96.4 (93.9–98.1) | 95.5 (92.8–97.4) |
| PPV | 93.8 (82.8–97.9) | 97.6 (85.2–99.7) | 72.9 (60.8–82.4) | 71.9 (61.3–80.6) |
| NPV | 96.6 (94.5–97.9) | 95.5 (93.4–97.0) | 98.0 (96.2–99.0) | 99.7 (98.0–99.9) |
| PLR | 90.1 (29.0–280.7) | 239.7 (34.6-1214.3) | 22.9 (13.2–49.8) | 21.7 (13.8–34.9) |
| NLR | 0.20 (0.13–0.35) | 0.27 (0.19–0.43) | 0.17 (0.09–0.34) | 0.03 (0.0–0.18) |
| Accuracy | 96.3 (93.9–97.9) | 95.8 (93.3–97.5) | 95.0 (92.4–96.9) | 95.8 (93.3–97.5) |
| Kappa value | 0.84 (0.76–0.92) | 0.80 (0.71–0.90) | 0.75 (0.65–0.85) | 0.80 (0.71–0.90) |
| Method/Age Group | Sensitivity | Specificity | PPV | NPV | Kappa |
|---|---|---|---|---|---|
| RDT | |||||
| <18 (n = 48) | 88.9 (51.8–99.7) | 100.0 (91.0–100) | 100.0 | 97.5 (86.0–99.6) | 0.93 (0.77–1.00) |
| 18–30 (n = 171) | 83.3 (62.6–95.3) | 99.3 (96.3–100) | 95.0 (73.8-99.3) | 97.3 (93.7–98.9) | 0.87 (0.76–0.98) |
| 31–40 (n = 109) | 74.6 (49.2–95.3) | 98.9 (94.3–99.9) | 91.7 (60.6–98.8) | 96.9 (92.0–98.8) | 0.83 (0.66–0.99) |
| >40 (n = 72) | 60.0 (26.2–87.8) | 98.4 (91.3–99.9) | 85.7 (44.6–97.8) | 93.8 (87.7–97.0) | 0.67 (0.40–0.94) |
| Microscopy | |||||
| <18 (n = 48) | 88.9 (51.8–99.7) | 100.0 (91.0–100) | 100.0 | 97.5 (86.0–99.6) | 0.93 (0.77–1.00) |
| 18–30 (n = 171) | 75.0 (53.3–90.2) | 100.0 (97.5–100) | 100.0 | 96.1 (92.5–98.0) | 0.84 (0.72–0.97) |
| 31–40 (n = 109) | 64.3 (35.1–87.2) | 100.0 (96.2–100) | 100.0 | 95.0 (90.4–97.5) | 0.76 (0.56–0.96) |
| >40 (n = 72) | 60.0 (26.2–87.8) | 98.4 (91.2–99.9) | 85.7 (44.6–97.8) | 93.9 (87.7–97.0) | 0.67 (0.40–0.94) |
| Characteristic | Method | Sensitivity | Specificity | PPV | NPV | Kappa |
|---|---|---|---|---|---|---|
| Sex | ||||||
| Women (n = 114) | RDT | 79.9 (46.2–95.0) | 100.0 (96.4–100) | 100.0 | 97.1 (92.6–98.9) | 0.86 (0.69–1.00) |
| Microscopy | 76.9 (46.2–94.9) | 100.0 (96.4–100) | 100.0 | 97.1 (92.9–98.9) | 0.86 (0.69–0.99) | |
| Men (n = 286) | RDT | 79.6 (64.7–90.2) | 98.8 (96.4–99.7) | 92.1 (78.9–97.3) | 96.4 (93.7–97.9) | 0.83 (0.73–0.92) |
| Microscopy | 70.5 (54.8–83.2) | 99.6 (97.7–100) | 96.9 (81.3–99.6) | 94.9 (92.1–96.7) | 0.79 (0.52–0.95) | |
| Residence | ||||||
| Urban (n = 152) | RDT | 76.2 (52.8–91.8) | 99.2 (95.8–100) | 94.1 (69.1–99.1) | 96.3 (92.4–98.2) | 0.82 (0.68–0.96) |
| Microscopy | 66.7 (43.0–85.4) | 100.0 (97.2–100) | 100.0 | 94.9 (91.1–97.1) | 0.78 (0.62–0.93) | |
| Rural (n = 248) | RDT | 80.6 (64.0–91.8) | 99.1 (96.6–99.9) | 93.6 (78.3–98.3) | 96.8 (93.9–98.3) | 0.84 (0.74–0.94) |
| Microscopy | 75.0 (57.8–87.9) | 99.5 (97.4–100) | 96.4 (79.1–99.5) | 95.9 (93.0–97.6) | 0.82 (0.72–0.93) | |
| Nationality | ||||||
| Saudi (n = 134) | RDT | 69.2 (38.6–90.9) | 100.0 (97.0–100) | 100.0 | 96.8 (93.1–98.6) | 0.80 (0.62–0.99) |
| Microscopy | 61.5 (31.6–86.1) | 100.0 (97.0–100) | 100.0 | 96.0 (91.5–96.6) | 0.74 (0.53–0.96) | |
| Non-Saudi (n = 266) | RDT | 81.8 (67.3–91.8) | 98.7 (96.1–99.7) | 92.3 (79.5–97.4) | 96.5 (93.6–98.1) | 0.84 (0.75–0.93) |
| Microscopy | 75.0 (59.7–86.8) | 99.6 (97.5–100) | 97.1 (82.3–99.6) | 95.3 (92.3–97.1) | 0.82 (0.72–0.92) |
| RDT Brand | Manufacturer | Target Antigen | Country | Ref. Method | Sen. | Sp. | PPV | NPV | Ref. |
|---|---|---|---|---|---|---|---|---|---|
| Low-Transmission Settings | |||||||||
| CareStart | Unlisted | Pf-HRP2/Pan-pLDH | Ethiopia | RT-PCR | 67.0 | 98.5 | 96.7 | 86.2 | [36] |
| Paramax-3 | Zephyr Biomedicals, India | Pf-HRP2/Pv-pLDH aldolase | Saudi Arabia | Nested PCR | 83.3 | 94.2 | 64.1 | 97.8 | [37] |
| Paracheck | Orchid Biomed Systems, India | Pf-HRP2 | Zanzibar | RT-PCR | 76.5 | 99.9 | 96.7 | 99.0 | [41] |
| First Response | Premier Medical, India | Pf-HRP2/Pan-pLDH | Zanzibar | RT-PCR | 64 | 98.0 | 72.0 | 97.0 | [42] |
| CareStar | Access Bio, USA | Pf-HRP2/Pv-pLDH | Senegal | PIET-PCR | 97.3 | 94.1 | 97.3 | 94.1 | [44] |
| Binax Now | Alere Scarborough, USA | Pf-HRP2/Pan-aldolase | Saudi Arabia | Microscopy | 96.7 | 78.0 | 92.5 | 98.0 | [48] |
| Paracheck | Orchid Biomed Systems, India | Pf-HRP2 | Ethiopia | Microscopy | 99.4 | 96.8 | 91.3 | 99.8 | [49] |
| CareStar | Access Bio, USA | Pf-HRP2/Pv-pLDH | Ethiopia | Microscopy | 99.4 | 98.0 | 94.4 | 99.8 | [49] |
| First Response | Premier Medical, India | Pf-HRP2/Pan-pLDH | Rwanda | Microscopy | 80.2 | 94.3 | NA | NA | [33] |
| Moderate-to-high transmission settings | |||||||||
| SD Bioline | Bio Standard Diagnostic, India | Pf-HRP2/Pv-pLDH | India | Nested PCR | 82.9 | 81.5 | 89.4 | 71.7 | [22] |
| SD Bioline | Standard Diag., Korea | Pf-HRP2 | Sudan | Nested PCR | 80.7 | 89.3 | 69.2 | 94.0 | [34] |
| SD Bioline | Standard Diag., Korea | Pf-HRP2/Pan-pLDH | Cameroon | Nested PCR | 78 | 94.0 | 94.0 | 78.0 | [35] |
| SD Bioline | Standard Diag., Korea | Pf-HRP2/Pan-pLDH | Tanzania | RT-PCR | 75.9 | 96.9 | 84.6 | 94.7 | [43] |
| SD Bioline | Unlisted | Pf-HRP2/Pan-pLDH | Cameroon | Nested PCR | 95.3 | 94.3 | 97.1 | 90.9 | [46] |
| SD Bioline | Standard Diag., Korea | Pf-HRP2/Pan-pLDH | Yemen | Nested PCR | 96 | 56.0 | 76.3 | 90.4 | [47] |
| ScreenPlus | Unlisted | Pf-HRP2/Pan-pLDH | Indonesia | RT-PCR | 75.3 | 100 | 100 | 64.0 | [50] |
| RightSign | Unlisted | Pf-HRP2/Pv-pLDH | Indonesia | Microscopy | 100 | 98.0 | 98.2 | 100 | [50] |
| CareStar | Access Bio, USA | Pf-HRP2 | Yemen | Microscopy | 90.5 | 96.1 | 91.0 | 95.9 | [51] |
Publisher’s Note: MDPI stays neutral with regard to jurisdictional claims in published maps and institutional affiliations. |
© 2022 by the authors. Licensee MDPI, Basel, Switzerland. This article is an open access article distributed under the terms and conditions of the Creative Commons Attribution (CC BY) license (https://creativecommons.org/licenses/by/4.0/).
Share and Cite
Madkhali, A.M.; Ghzwani, A.H.; Al-Mekhlafi, H.M. Comparison of Rapid Diagnostic Test, Microscopy, and Polymerase Chain Reaction for the Detection of Plasmodium falciparum Malaria in a Low-Transmission Area, Jazan Region, Southwestern Saudi Arabia. Diagnostics 2022, 12, 1485. https://doi.org/10.3390/diagnostics12061485
Madkhali AM, Ghzwani AH, Al-Mekhlafi HM. Comparison of Rapid Diagnostic Test, Microscopy, and Polymerase Chain Reaction for the Detection of Plasmodium falciparum Malaria in a Low-Transmission Area, Jazan Region, Southwestern Saudi Arabia. Diagnostics. 2022; 12(6):1485. https://doi.org/10.3390/diagnostics12061485
Chicago/Turabian StyleMadkhali, Aymen M., Ahmad Hassn Ghzwani, and Hesham M. Al-Mekhlafi. 2022. "Comparison of Rapid Diagnostic Test, Microscopy, and Polymerase Chain Reaction for the Detection of Plasmodium falciparum Malaria in a Low-Transmission Area, Jazan Region, Southwestern Saudi Arabia" Diagnostics 12, no. 6: 1485. https://doi.org/10.3390/diagnostics12061485