Abstract
CD44 expressed in monocytes and lymphocytes seems to play a crucial role in gastrointestinal inflammation, such as the one occurring in the context of inflammatory bowel diseases. Differentially methylated genes are distinctly expressed across monocyte subpopulations related to the state of Crohn’s disease. Hence, the aim of this study was to detect CD44 expression in leukocyte subpopulations in relation to the type of IBD, therapy, and disease duration. Monocyte subpopulations CD14++CD16−, CD14++CD16++, and CD14+CD16+ as well as other leukocytes were analyzed for their CD44 expression using flow cytometry in 46 patients with IBD and 48 healthy controls. Patients with Crohn’s disease treated with non-biological therapy (NBT) exhibited a lower percentage of anti-inflammatory CD14+CD16++ monocytes, whereas NBT-treated patients with ulcerative colitis had lower expression of CD44 on CD14+CD44+ lymphocytes in comparison to controls, respectively. Conversely, patients with Crohn’s disease treated with biological therapy had a higher percentage of CD44+ granulocytes but lower expression of CD44 on anti-inflammatory monocytes compared to controls. Median fluorescence intensity (MFI) of CD44 on CD44+CD14+ lymphocytes was higher in ulcerative colitis patients treated with biological therapy compared to NBT. The percentage of classical CD14++CD16− monocytes was lower in the <9 years of IBD duration subgroup compared with the longer disease duration subgroup. The present study addresses the putative role of differentiation and regulation of leukocytes in tailoring IBD therapeutic regimes.
1. Introduction
Inflammatory bowel disease (IBD) is a group of chronic inflammatory diseases of the gastrointestinal tract, including ulcerative colitis and Crohn’s disease, with unknown etiology [1]. The pathophysiologic pathways underlying these complex clinical entities still remain elusive [2,3]. However, impaired regulation of the epithelial barrier seems to be associated with the development of IBD. It is considered that intestinal disorders result from dysfunctional epithelial, genetic structure, and abnormal innate and adaptive immune response to environmental factors [4]. Infiltration of lymphocytes and leukocytes into the lamina propria contributes to the development of intestinal inflammation, thus developing and maintaining intestinal inflammation [5].
The crucial role in gastrointestinal inflammation is attributed to CD44 expressed in monocytes and lymphocytes [6]. Flow cytometric phenotyping has identified three different monocyte subpopulations: major classical monocytes CD14++CD16−, minor non-classical CD14+CD16++, and intermediate CD14++CD16+ monocytes [7]. Their diversity can indicate pathogenesis of inflammation, whereas an increased proportion of the specific population may co-exist as a biomarker of the disease [8]. Intermediate peripheral blood monocyte population is enhanced significantly in patients with active Crohn’s disease but not ulcerative colitis [9]. After exiting from the blood and passing the endothelial barrier, leukocyte CD44 interacts with hyaluronate in the extracellular matrix [10,11,12]. Hyaluronate further participates in the organization of the extracellular matrix and is increased during inflammation.
IBD treatment is currently based on controlling the excessive immune response in the intestinal mucosa and inflammation [13]. Therapy is focused upon maintaining remission and achieving long-term better outcomes of the disease itself [14]. Non-biological therapy is still the main form of IBD treatment, especially in the inactive and mild state of the disease [15]. The strengths of NBT are safety and tolerability, maintaining remission, and low treatment costs in comparison to biological therapy treatment. On the other hand, the clinical benefits of biologic therapy are faster mucosal healing, fewer hospital interventions, and a better quality of life, while the negative aspect is the risk of serious infections and higher risk of malignancy [16].
Recently, Li Yim et al. described 12 differentially methylated promoter regions of inflammatory genes, comparing Crohn’s disease patients with active disease and those in remission [17]. A comparison of their observations with gene expression data on classical, non-classical, and intermediate monocytes indicates that seven differentially methylated genes are differentially expressed across the three monocyte subsets. Due to the relation of those genes’ expression to the state of disease, we found worthy to investigate monocyte subpopulations in differently treated IBD. The possible finding of inflammatory and anti-inflammatory monocyte profiles in relation to the therapy treatment and the state of disease could be helpful in further therapy and prognosis.
2. Materials and Methods
2.1. Study Design
The present study was organized as a cross-sectional observational study. It was conducted at the Department of Gastroenterology, University Hospital of Split and Departments of Pathophysiology and Medical Chemistry and Biochemistry, University of Split School of Medicine and the Department of Medical Laboratory Diagnostic, University Department of Health Studies, University of Split over a period from December 2017 until March 2018.
2.2. Subjects
The present study included 46 patients with IBD, 28 of which had Crohn’s disease and 18 ulcerative colitis. In addition, the patients were compared with a control group consisting of 48 healthy subjects. Patients with IBD were divided into two subgroups: one group treated with biological therapy and the other group treated with NBT. All 94 participants were 18 years of age or older, and each of them underwent the full study protocol except fecal calprotectin assessment, which was measured only in the patient groups. The age distribution of IBD was 40.97 ± 12.65, for ulcerative colitis 42 ± 12.3, and Crohn’s 40.32 ± 13.04 (presented as mean ± standard deviation). The patients with IBD were recruited from the outpatient clinic of the Department of Gastroenterology, University Hospital of Split. At first, 100 patients were included in the study. Among 52 patients, two were excluded due to sudden worsening of the disease, two due to inability to schedule an appointment, and finally, two due to refusal of further procedures. Subsequently, 46 patients and 48 control subjects were found to be eligible for inclusion in the study (Supplementary Table S1).
IBD diagnosis was performed in accordance with the latest guidelines of the European Crohn’s and Colitis Organization and the European Society of Gastrointestinal and Abdominal Radiology [18]. Inclusion criteria were IBD diagnosis with stable disease activity in the last 3 months and disease duration in the last 1 year. Chronic inflammatory conditions other than IBD such as chronic kidney disease, liver disease, and pulmonary disease; history of heart failure; history of cardiovascular or cerebrovascular conditions; diabetes mellitus; malignant disease; and the use of local/systemic corticosteroids in the last 3 months were exclusion criteria. Healthy blood donors from the health care centers and volunteers were included in this study. Healthy subjects were screened for the presence of the Rome IV criteria for inflammatory bowel syndrome as well as any other type of gastrointestinal symptoms.
2.3. Clinical Assessment and Anthropometric Measurements
All subjects underwent a detailed physical examination and anthropometric data assessment. A calibrated medical scale with an altitude meter (Seca, Birmingham, UK) was used to measure body mass and height. Body mass index (BMI) was calculated by dividing the value of body mass (kg) with the squared value of height (m2). Anamnestic data and tobacco consumption information were taken for all participants.
2.4. Assessment of Disease Severity
Disease activity in patients with IBD was assessed by two experienced gastroenterology specialists independently, using well-established clinical and endoscopic scoring systems. Disease activity was assessed using the ulcerative colitis endoscopic index of severity (UCEIS) and Mayo endoscopic score (MES) [19,20,21]. Crohn’s disease patients were assessed using the endoscopic score (SES-CD) as those with mild, moderate, or severe endoscopic form of the disease [22]. We stratified patients using only endoscopic index scores; clinical index scores were descriptively reported. We stratified different categories of ulcerative colitis and Crohn’s disease groups based on their endoscopic disease activity score.
2.5. Flow Cytometry
Blood samples needed for flow cytometry and biochemical analysis were collected from all participants in the morning period, after at least a 10 h fast. All samples were analyzed in a single laboratory by an experienced biochemist following the same standard procedure. The biochemist was blinded for the participant’s assignment to Crohn’s disease or ulcerative colitis group. Blood was drawn from a polyethylene catheter inserted into the antecubital vein. One hundred microliters of the whole blood was pre-treated with an Fc receptor-blocking reagent (Miltenyi Biotec GmbH, Bergisch Gladbach, Germany) to prevent nonspecific binding and was incubated for 20 min in the dark at 25 °C with 4 µL of anti-human-CD14s PerCP-Cy5.5-conjugated antibodies (eBioscience, San Diego, CA, USA), 4 µL of phycoerythrin-conjugated antibodies reactive to human CD16 (eBioscience, San Diego, CA, USA), and 10 µL of mouse antibodies reactive to human CD44 conjugated with FITC (BD Pharmingen, San Diego, CA, USA). Following the red blood cell lysis with lysis solution (Miltenyi Biotec GmbH, Bergisch Gladbach, Germany), cells were analyzed by flow cytometry (BD Accuri C6, BD Biosciences, Aalst, Belgium). Unstained cell samples were measured and processed as negative controls to set the appropriate regions. Cell acquisition was stopped at 106 cells.
2.6. Biochemical Analysis
Fecal calprotectin concentrations were measured by turbidimetric method (Beckman Coulter AU 680), while plasma high-sensitivity C-reactive protein (hs-CRP) levels were determined using a latex turbidimetric method (Abbott Laboratories, Chicago, IL, USA). Other biochemical analyses were measured by standard laboratory methods.
2.7. Data Analysis
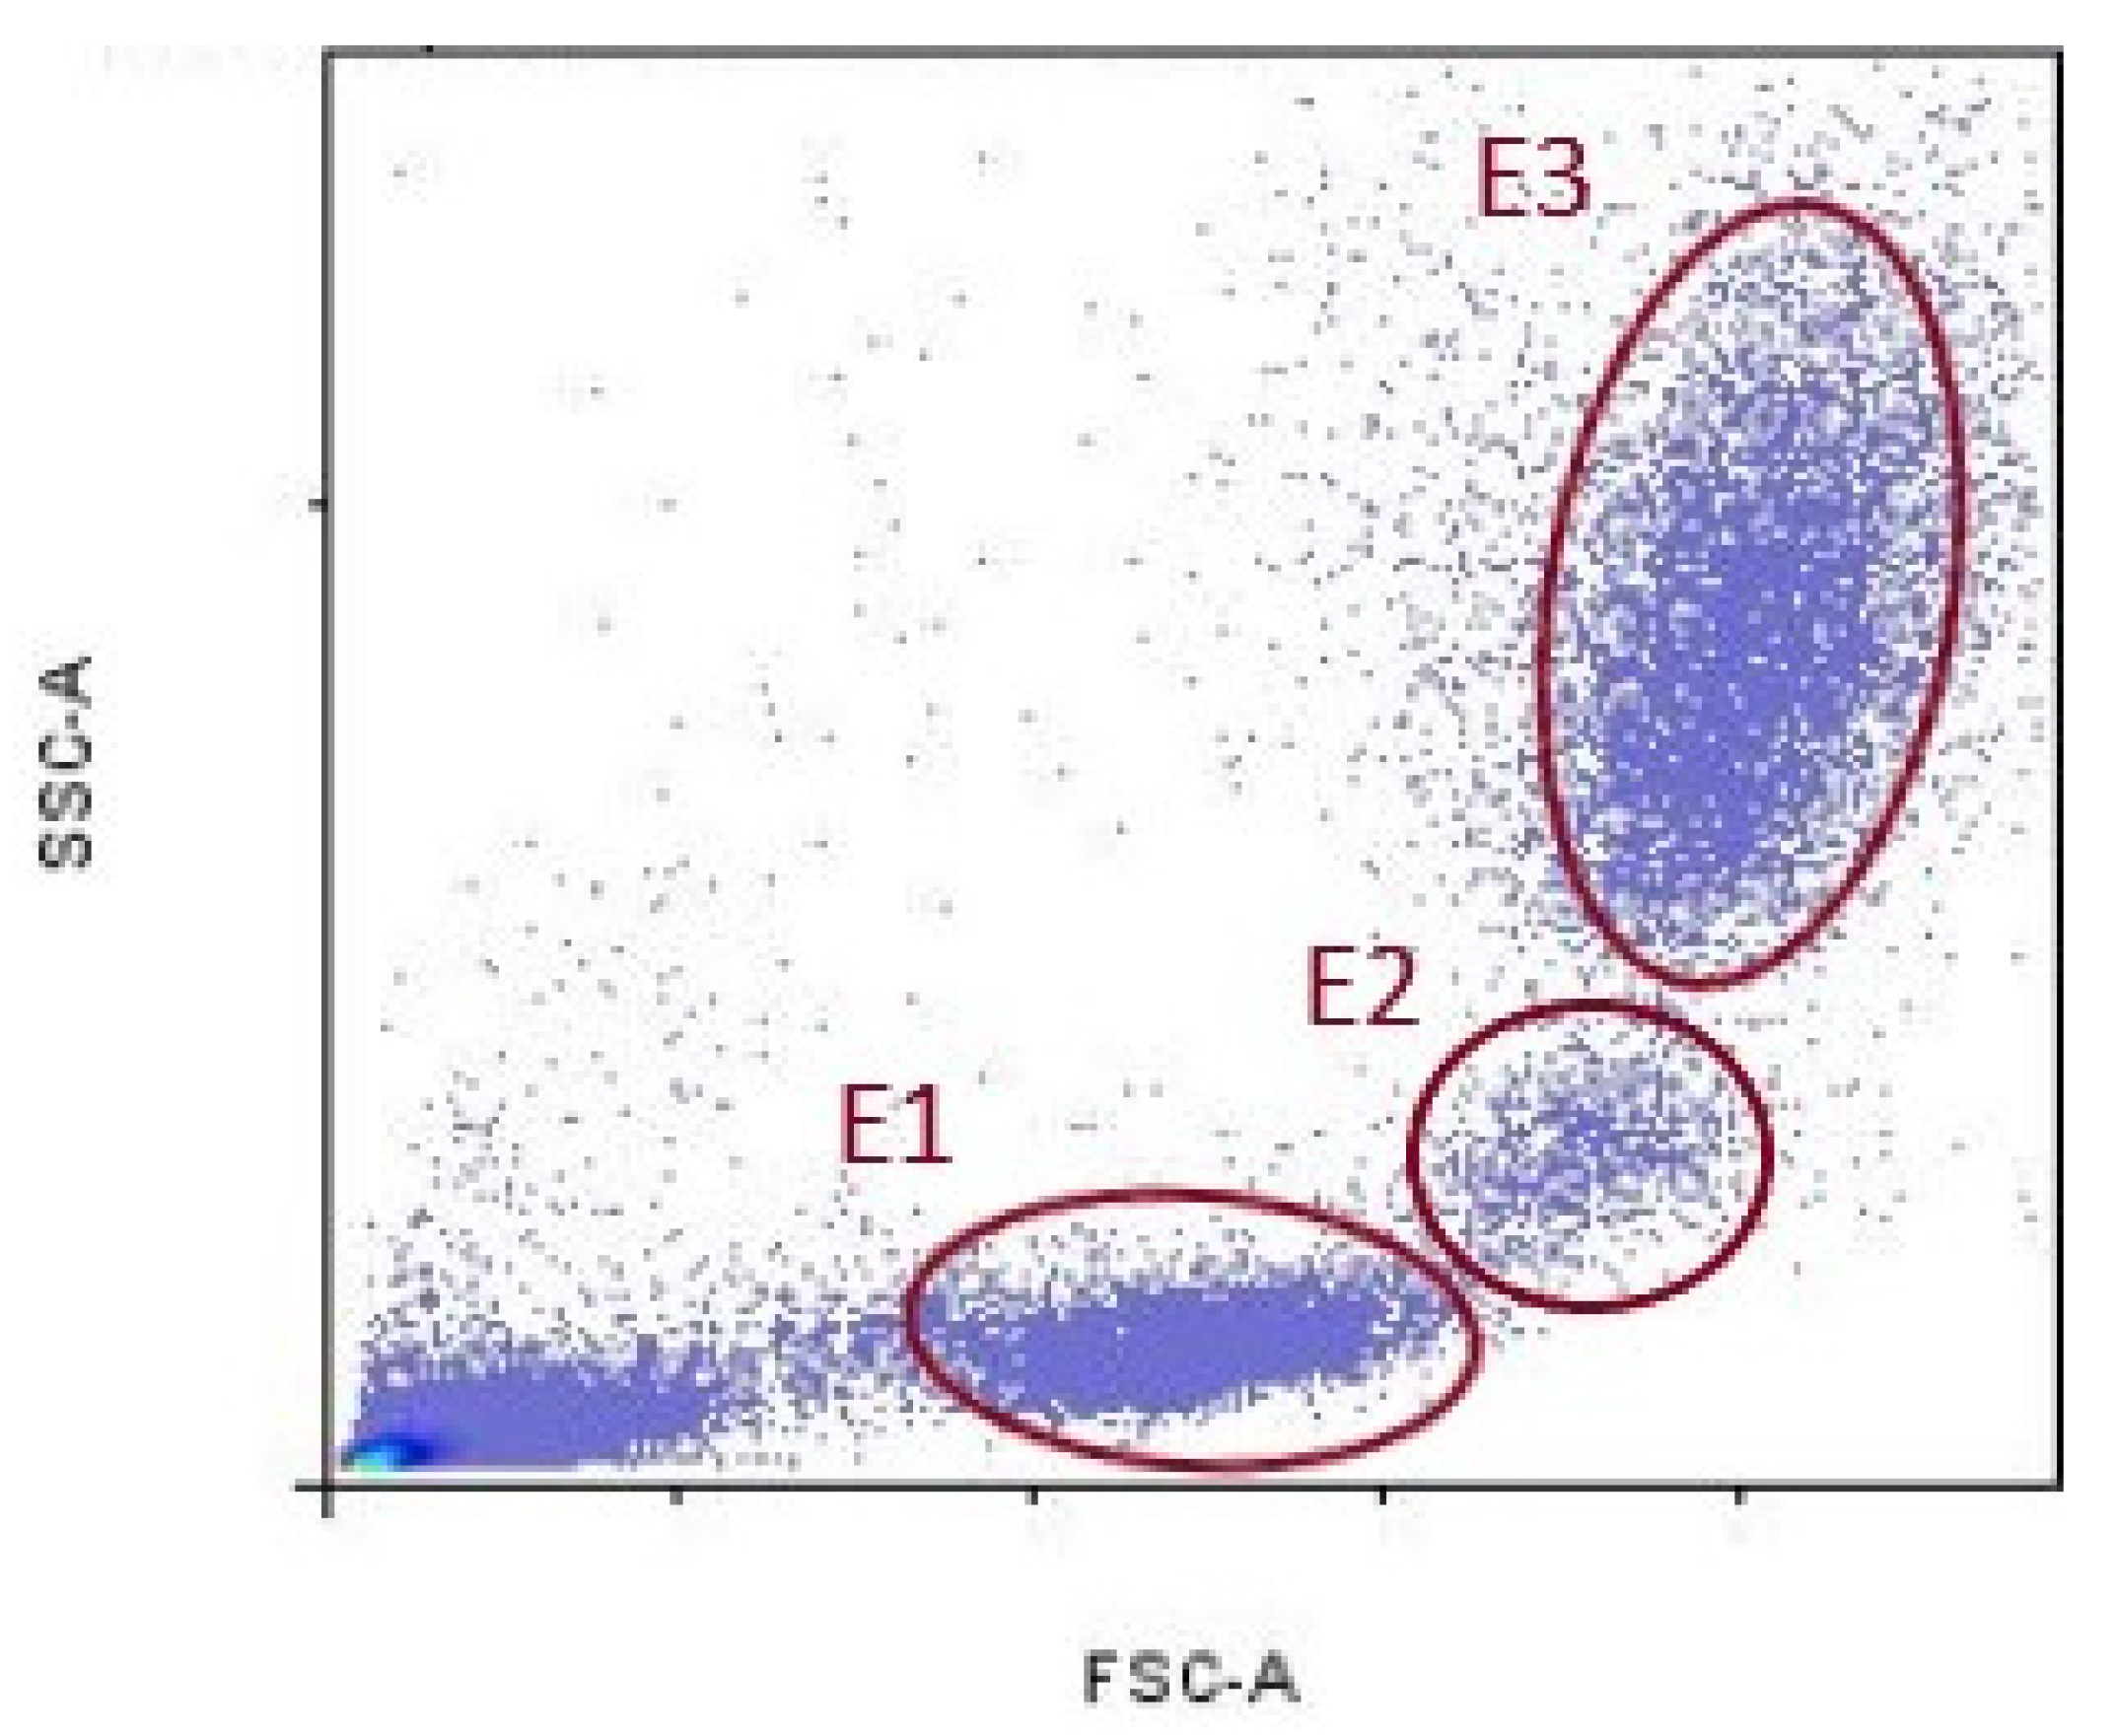
Data acquired by cytometer were analyzed using the FlowLogic Software (Inivai Technologies, Mentone Victoria, Australia). Leukocyte fluorescence is shown in the forward scatter/side scatter (FSC/SSC) dot plots. FSC parameter indicates cell diameter, and SSC indicates cell granularity. Lymphocytes population was delineated with ellipse (E1), monocyte population with (E2), and granulocytes population with (E3), respectively (Figure 1).
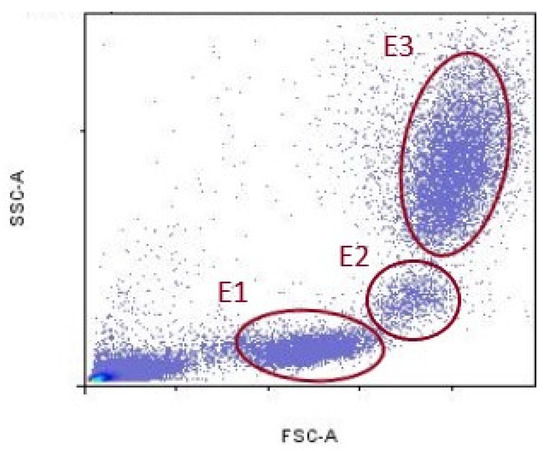
Figure 1.
Representative gates for lymphocytes (E1), monocytes (E2), and granulocytes (E3).
2.8. Statistical Analysis
We assessed the normality of data distribution using the Kolmogorov–Smirnov test. Data were expressed as mean ± standard deviation for continuous parametric variables, median (interquartile range) for continuous nonparametric variables, and as whole numbers and percentages for categorical variables. The Student’s t-test was used for the comparison of parametric continuous data and Mann–Whitney U test for the comparison of parametric continuous data. The chi-square test was used for the comparison of categorical data between groups. ANOVA Dunn’s post hoc nonparametric test was used for multiple comparisons tests.
All statistical analysis was performed using Past 3. X software (version 3.14, University of Oslo, Oslo, Norway) with the significance set at p < 0.05 [23].
3. Results
3.1. Basic Characteristics of the IBD and Control Group
There was no significant difference in gender, age, body weight, BMI, and smoking consumption between IBD and control group except in body height, which was lower in the IBD group (Supplementary Table S1). There was a difference in one variable, the percentage of CD14++CD16− monocytes, which was lower in the <9 years IBD duration subgroup compared with the longer disease duration subgroup (26.82 vs. 37.09 median, p = 0.025) (Table 1).

Table 1.
Comparison of selected parameters between IBD subgroups according to median of disease duration.
Basic characteristics of two IBD, namely Chron’s disease vs. ulcerative colitis, were without statistically significant difference. There was 2-fold higher % of CD14++CD16+ monocytes in a moderate endoscopic score (p = 0.002) (Table 2).

Table 2.
Comparison of selected parameters between different disease activity categories in Crohn’s disease patients.
Furthermore, ulcerative colitis patients had a mild-to-moderate endoscopic form of disease (UCEIS; MES) without any difference in selected variables (Table 3).

Table 3.
Comparison of selected parameters between different disease activity categories in ulcerative colitis patients.
3.2. Comparison of Basic Anthropometric, Disease, and Laboratory Characteristics between Ulcerative Colitis and Crohn’s Disease
Selected characteristics showed no significant difference between ulcerative colitis and Crohn’s disease patients except in percentages of active smoking consumption, which was 12-fold lower (p = 0.006) in the ulcerative colitis group (Supplementary Tables S2 and S3).
3.3. Basic Anthropometric and Selected Disease Characteristics between Crohn’s Disease Subgroups Regarding to Biologic Therapy
There was no significant difference in anthropometric, disease-related, and laboratory parameters between Crohn’s disease subgroups regarding to biologic therapy except erythrocyte sedimentation rate and fecal calprotectin, which were 2.4 (p = 0.038) and 6.1-fold lower (p = 0.005) in the biological therapy group, respectively (Supplementary Tables S4 and S5).
3.4. Basic Anthropometric and Selected Disease Characteristics between Ulcerative Colitis Subgroups Regarding to Biologic Therapy
There was no significant difference in anthropometric, disease-related, and laboratory parameters between ulcerative colitis subgroups in regards to biologic therapy except white blood cells, which were lower in the NBT group (Supplementary Tables S6 and S7).
3.5. Monocyte Subsets (CD14++CD16−, CD14+CD16++, and CD14++CD16+) Display Distinct Percentages in Differently Treated Crohn’s Disease Patients
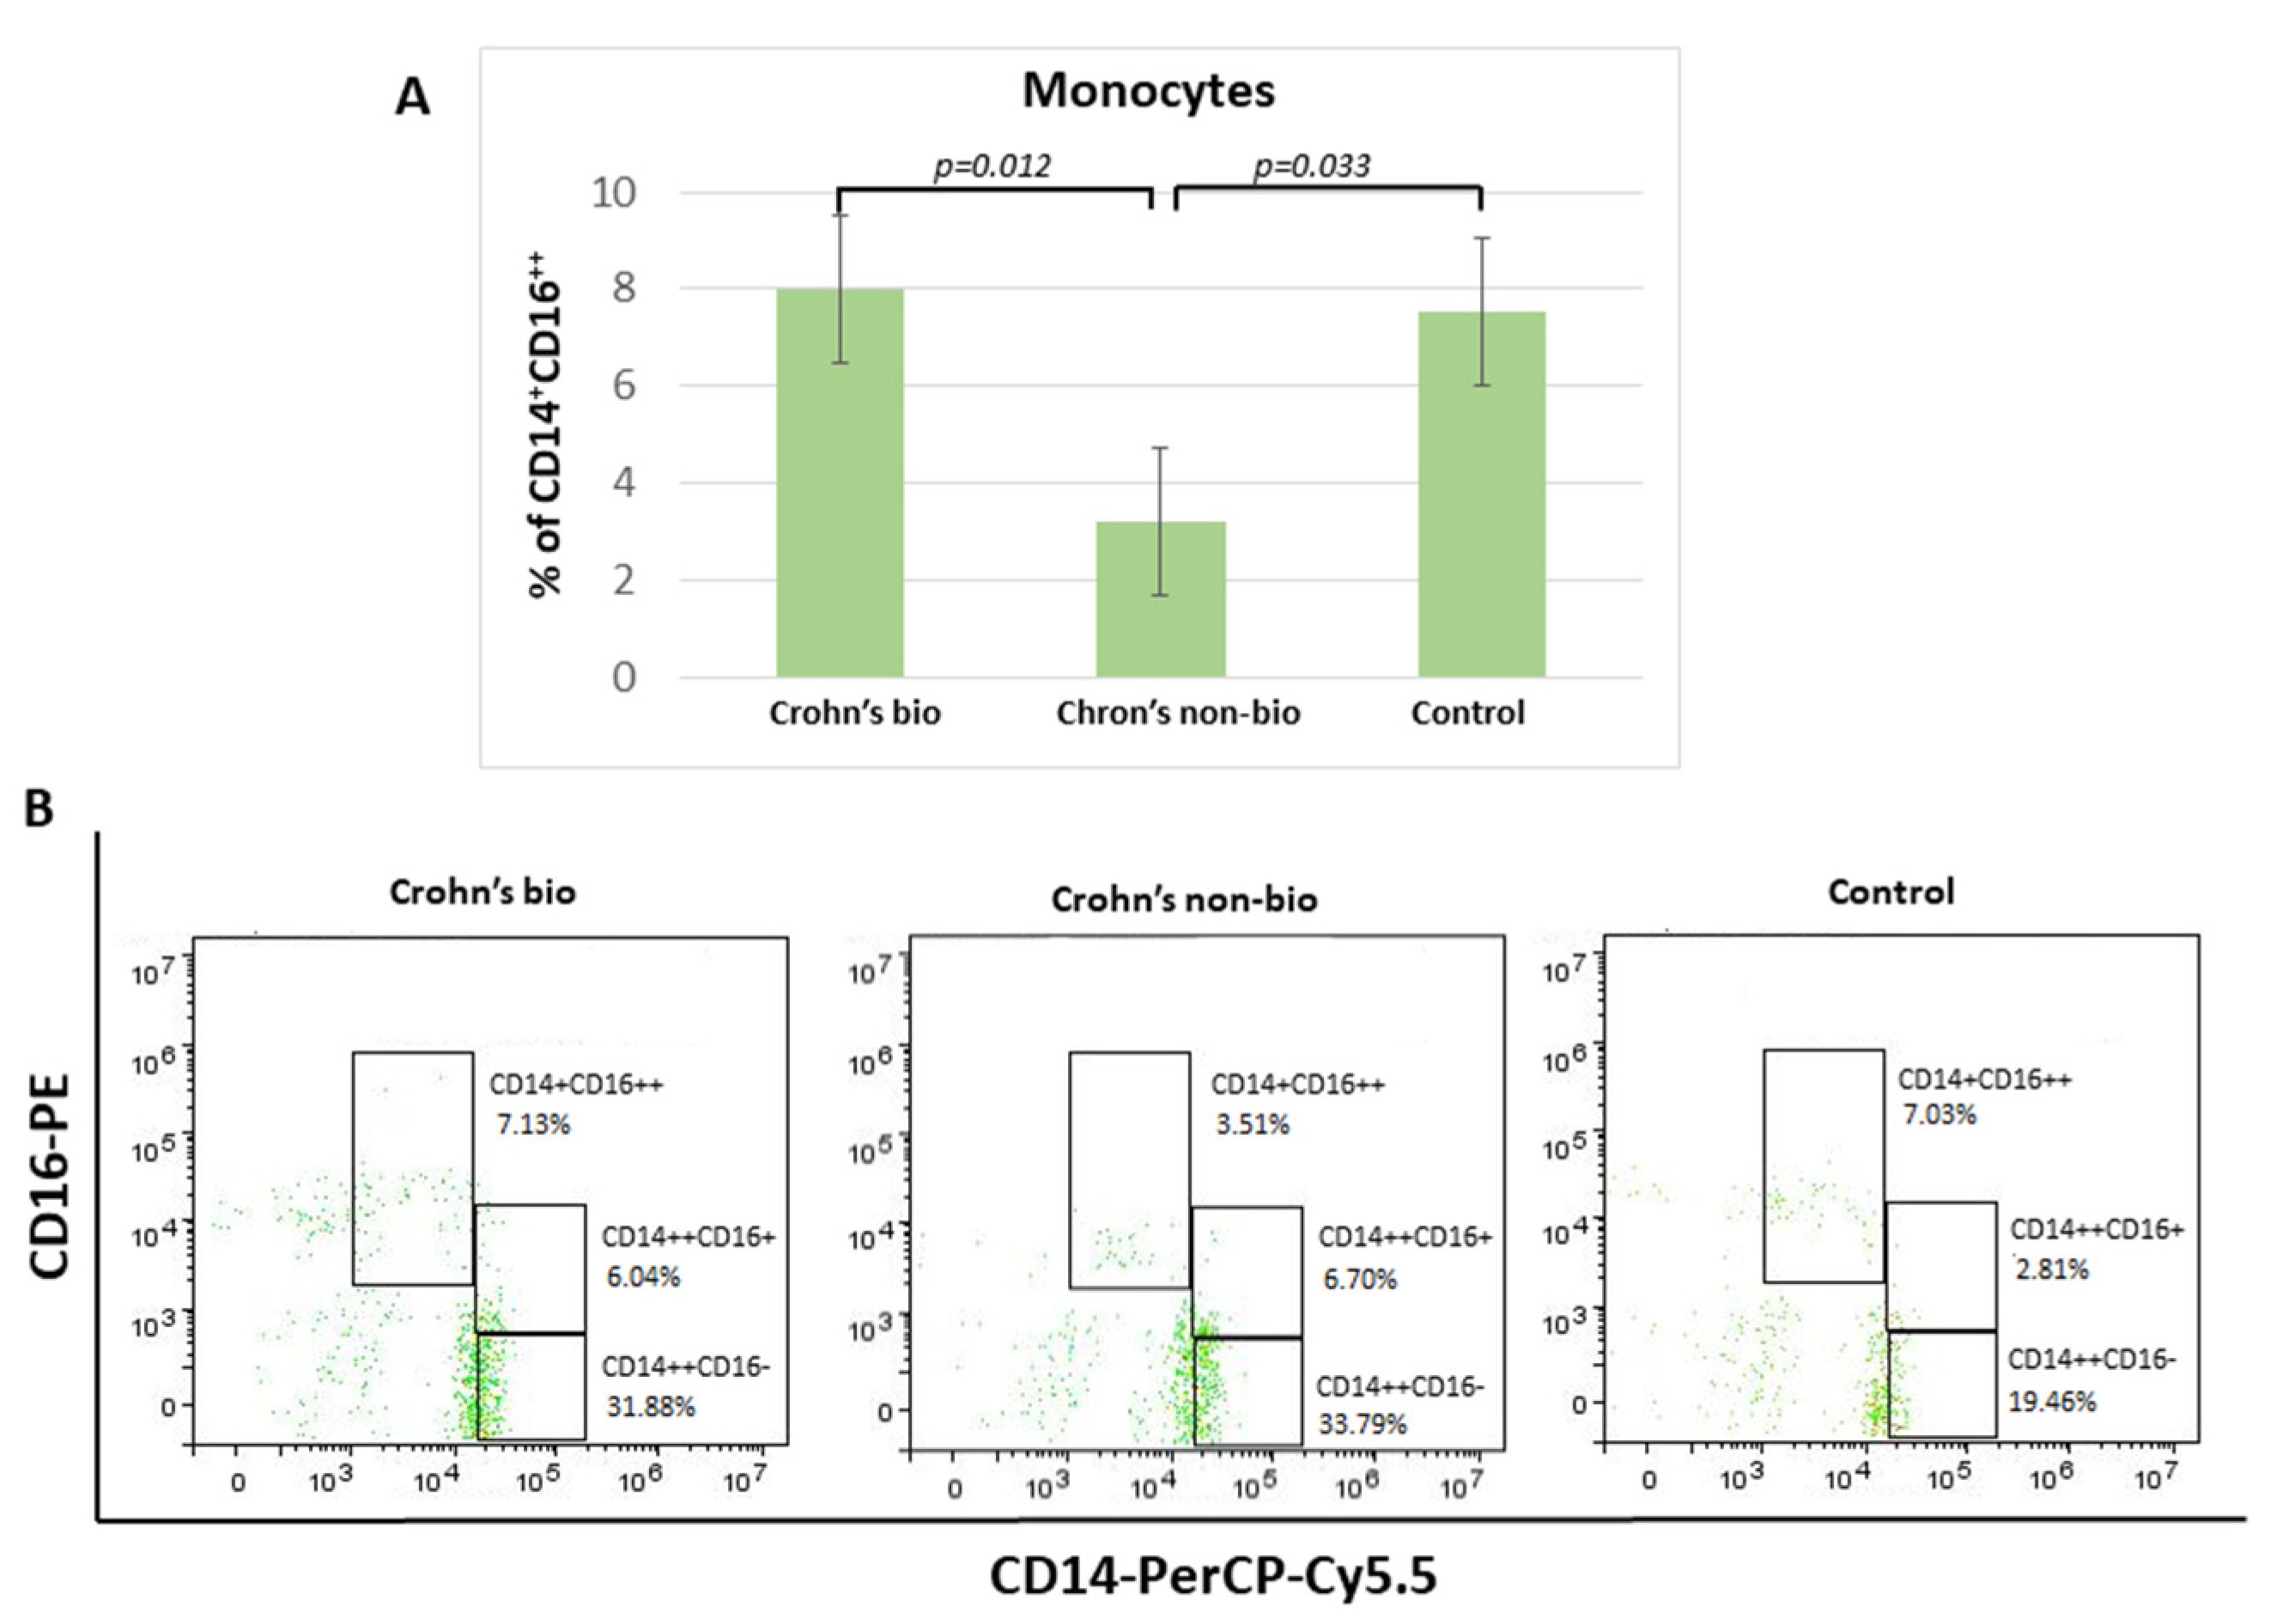
Crohn′s disease patients treated with the non-biological treatment exhibited 2.3-fold decreased percentage of non-classical CD14+CD16++ monocytes in comparison to patients treated with biological therapy. There was no significant difference in the percentage of non-classical CD14+CD16++ monocytes and the control group (Figure 2).
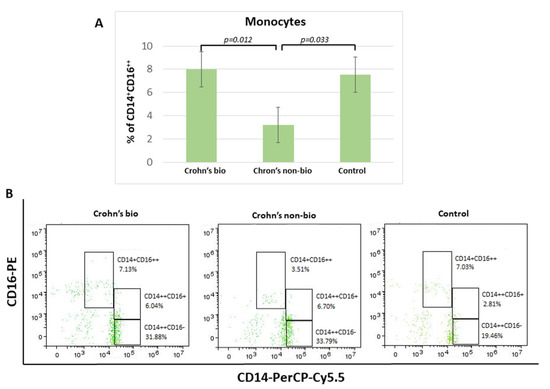
Figure 2.
Percentage of monocyte subpopulations (CD14++CD16−, CD14+CD16++, and CD14++CD16+) in patients with IBD. Statistical histograms (A) and representative dot plots (B) of patients treated with biological and non-biological therapy as well as of control subjects. p < 0.05.
There were no significant differences concerning the influence of patient treatment upon monocyte subset percentages in the ulcerative colitis patients. Median values (with interquartile ranges) for percentages of non-classical CD14+CD16++ monocytes, which were decreased in the Crohn’s non-bio group (Figure 2A), in each group were: ulcerative colitis bio, 8.545 (7.34–13.39); ulcerative colitis non-bio, 8.16 (5.39–8.9); and control 7.54 (6.15–9.27).
3.6. Expression of CD44 on CD14+CD16++ Monocytes in IBD
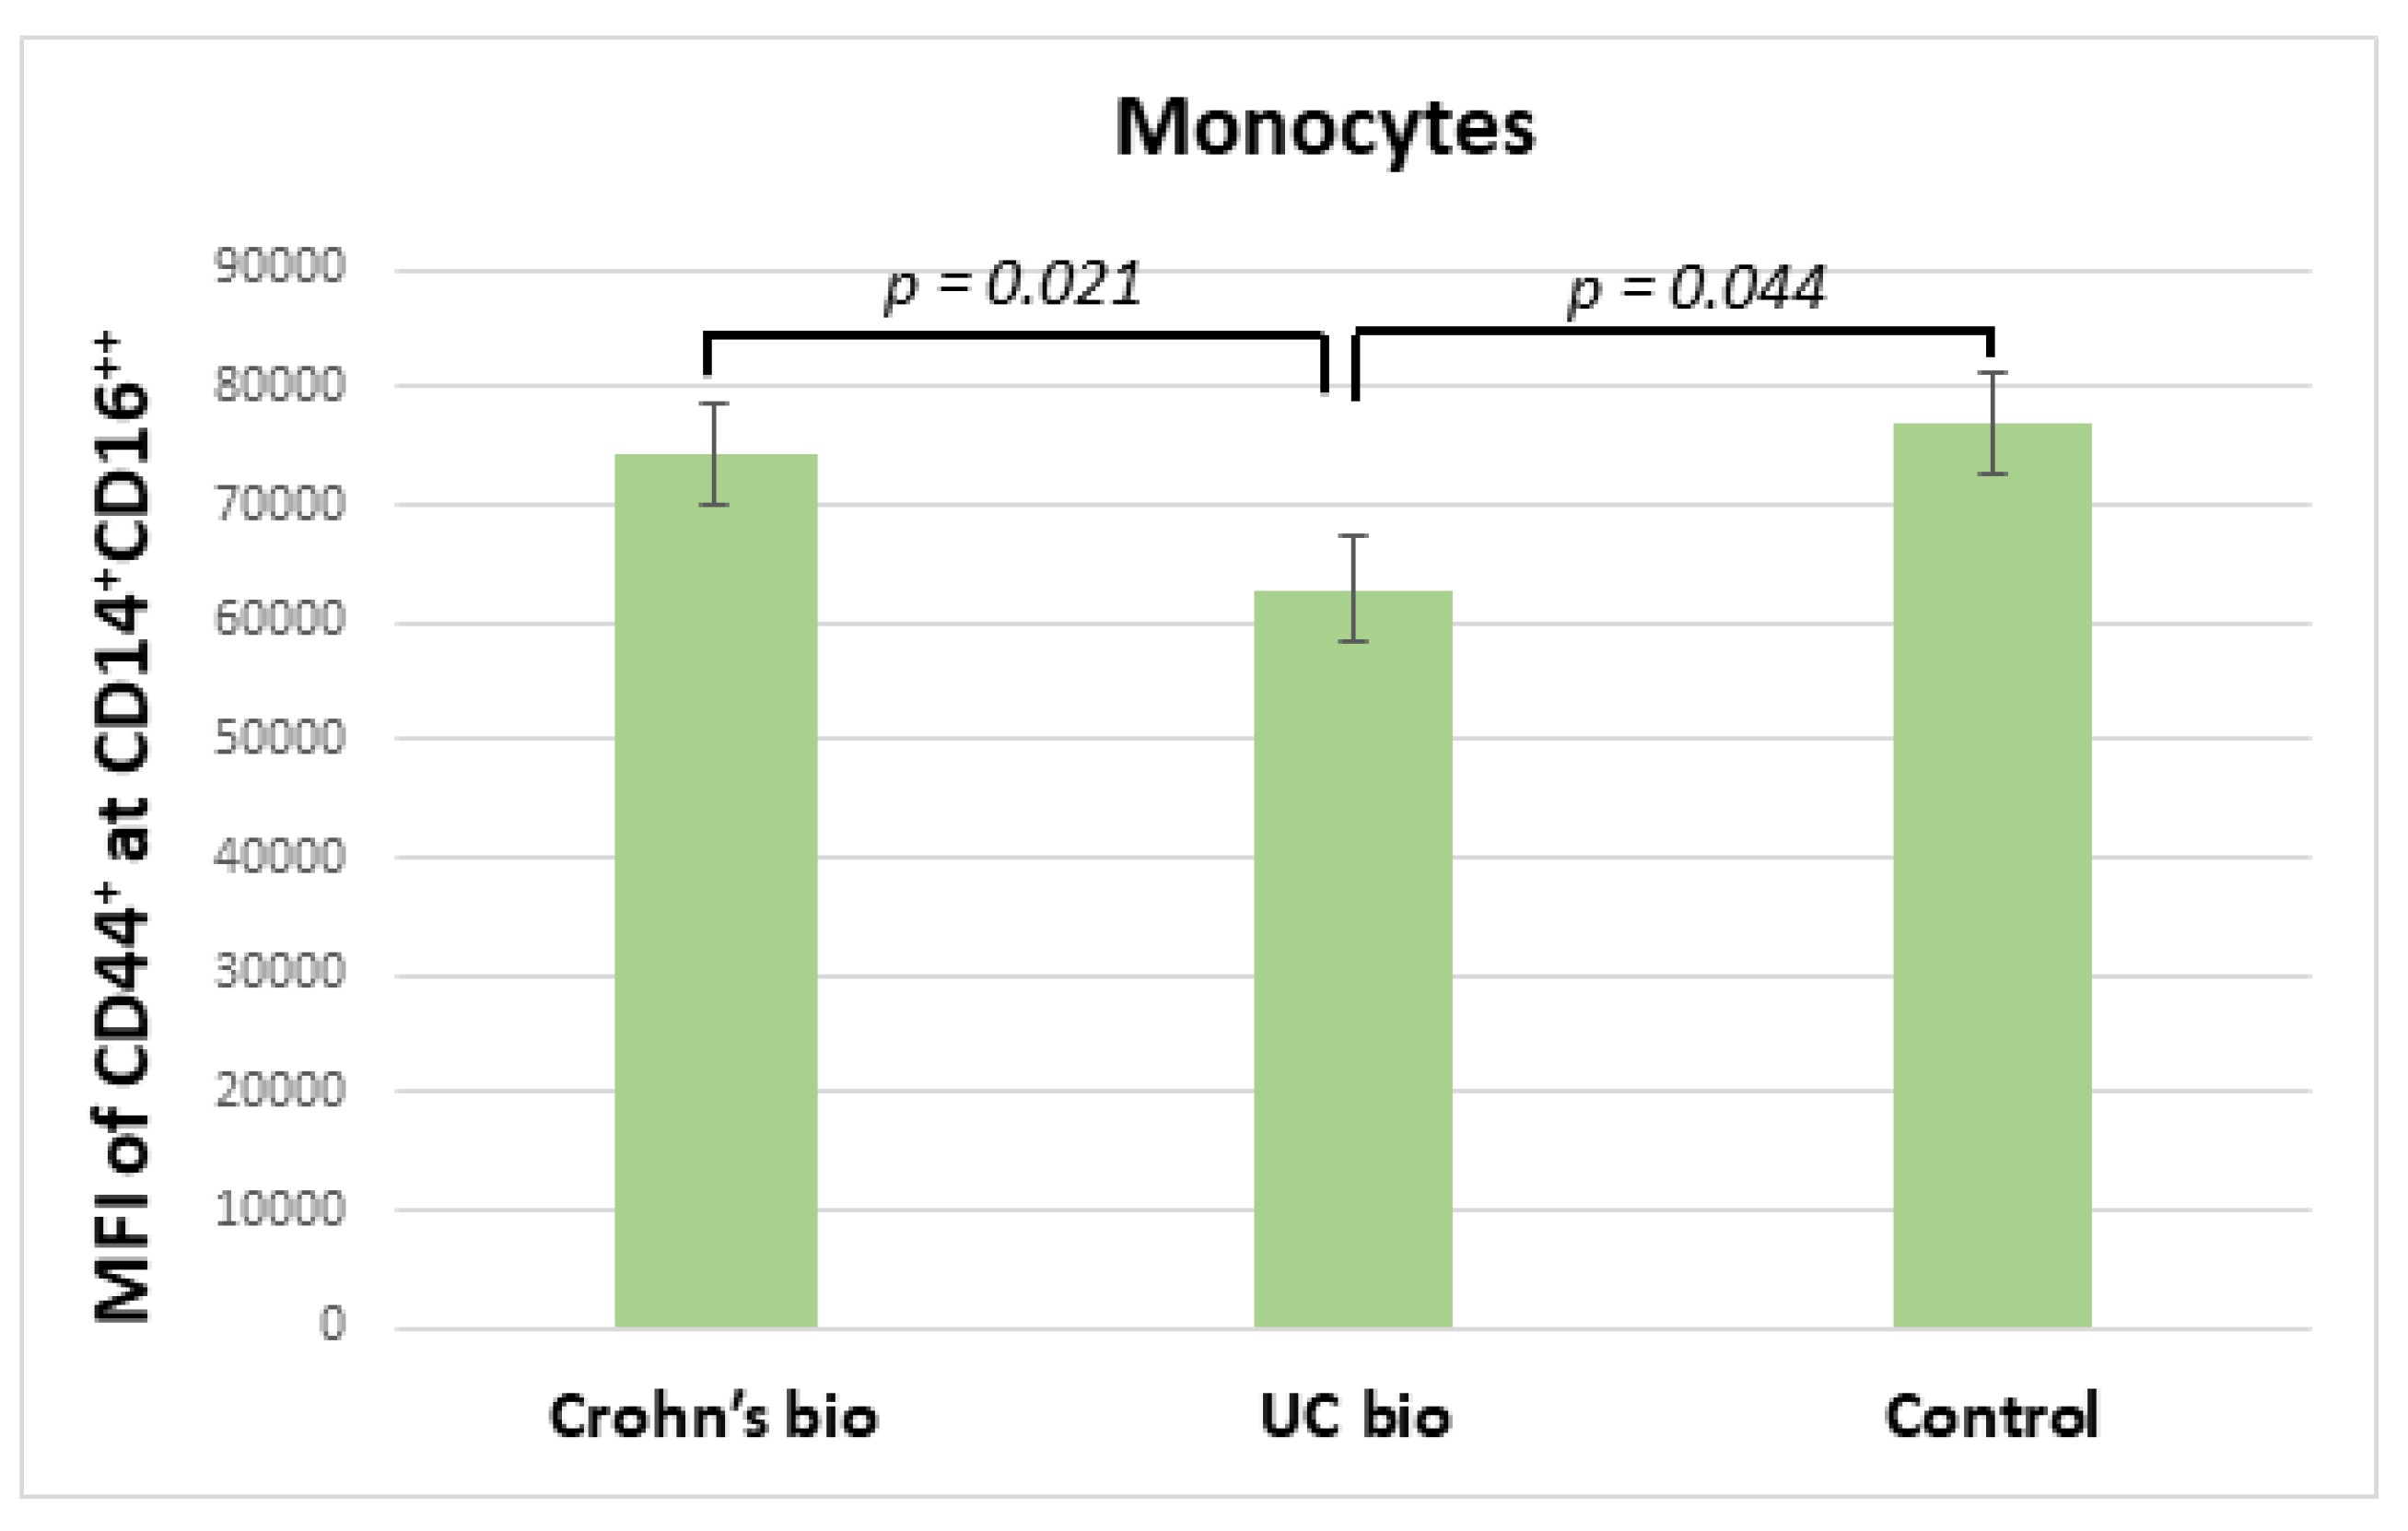
Ulcerative colitis patients treated with the biological treatment had significantly decreased median fluorescence intensity of CD44 on CD14+CD16++ monocytes in comparison to CD patients treated with biological therapy, which exhibited no significant difference in this parameter from the control group (Figure 3).
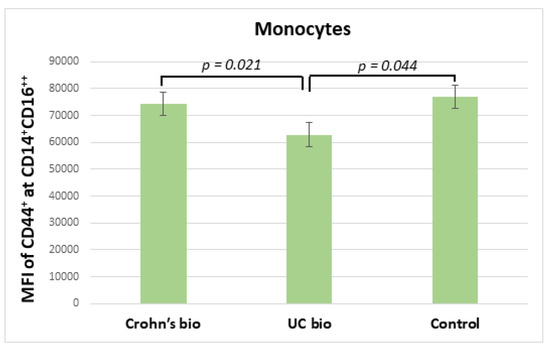
Figure 3.
MFI of CD44 on CD14+CD16++ monocytes in IBD biological therapy treated patients and control subjects. MFI, median fluorescence intensity; UC, ulcerative colitis.
3.7. Expression of CD44 on CD44+CD14+ Lymphocytes in Differently Treated Ulcerative Colitis Patients
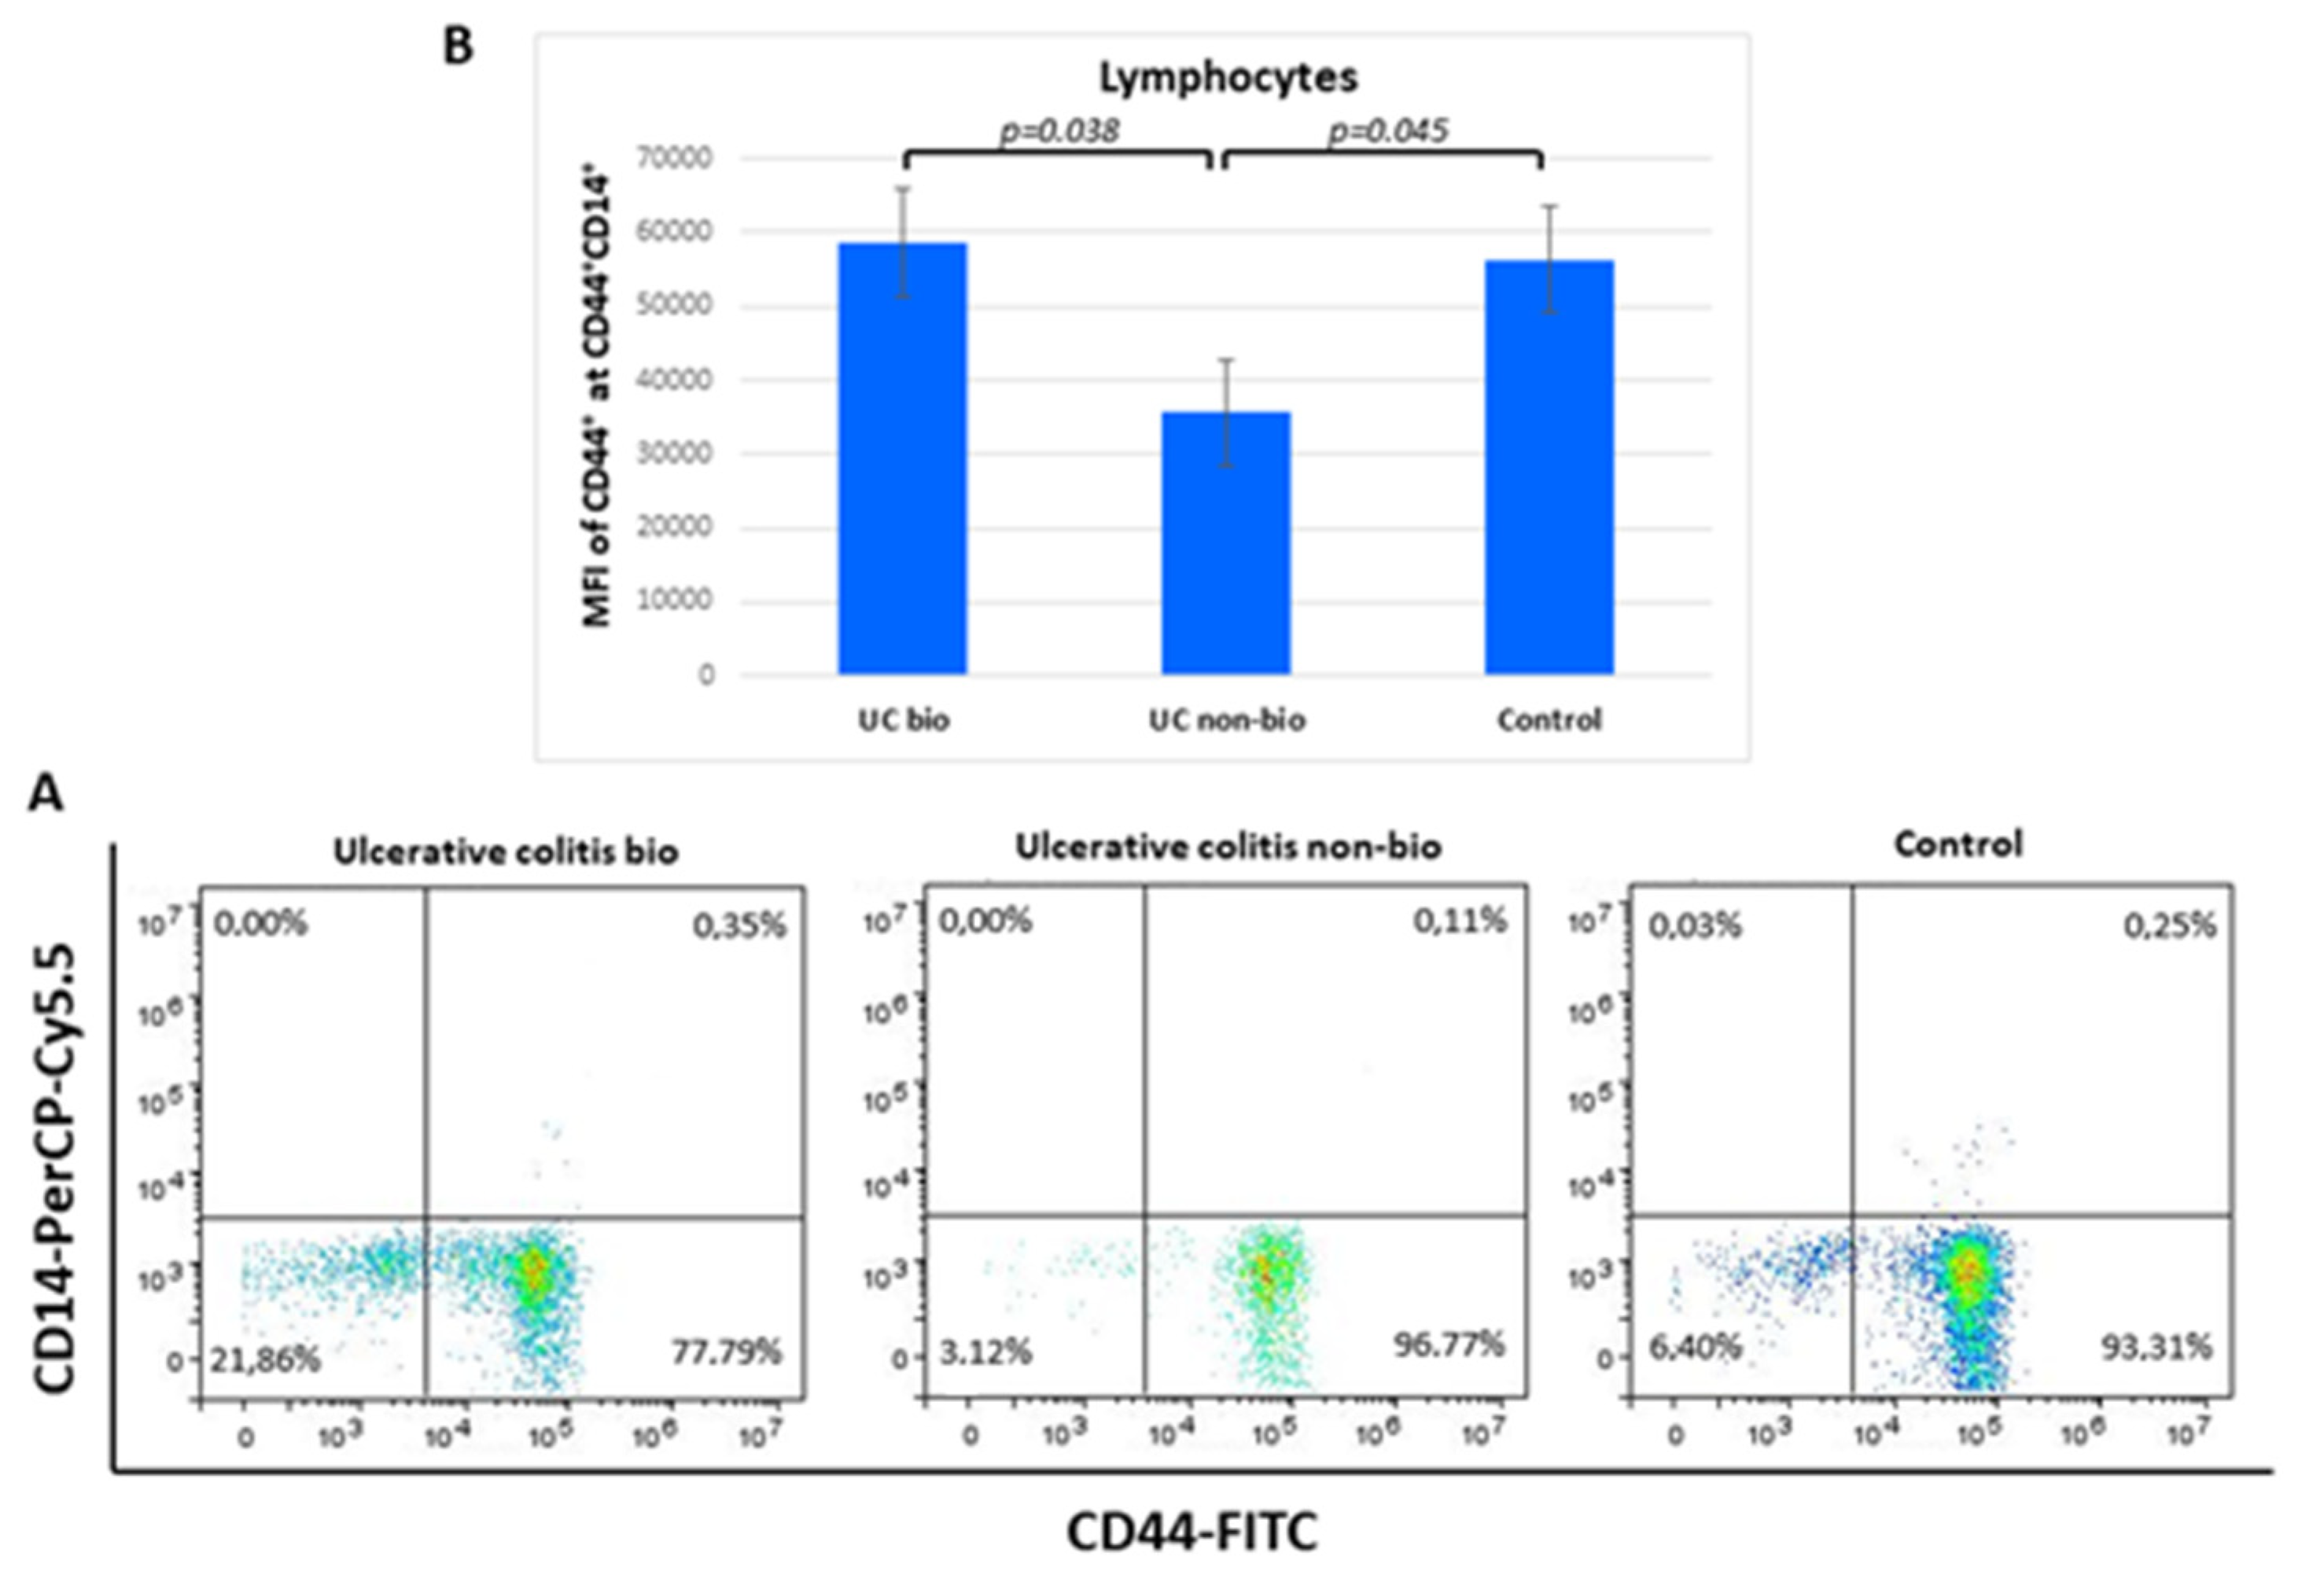
The median fluorescence intensity of CD44 on CD44+CD14+ lymphocytes was nearly 2-fold higher in ulcerative colitis patients treated with biological therapy in comparison to the NBT group. Lymphocyte percentages of the CD44+CD14+ showed no differences between the groups (Figure 4).
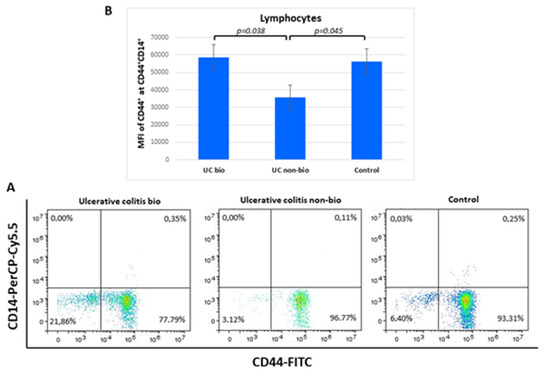
Figure 4.
Percentage of CD44+CD14+ lymphocytes (A) and their CD44 median fluorescence intensity (B) in ulcerative colitis patients. MFI, median fluorescence intensity.
3.8. Percentage of CD44+ Granulocytes in Crohn’s Disease Patients
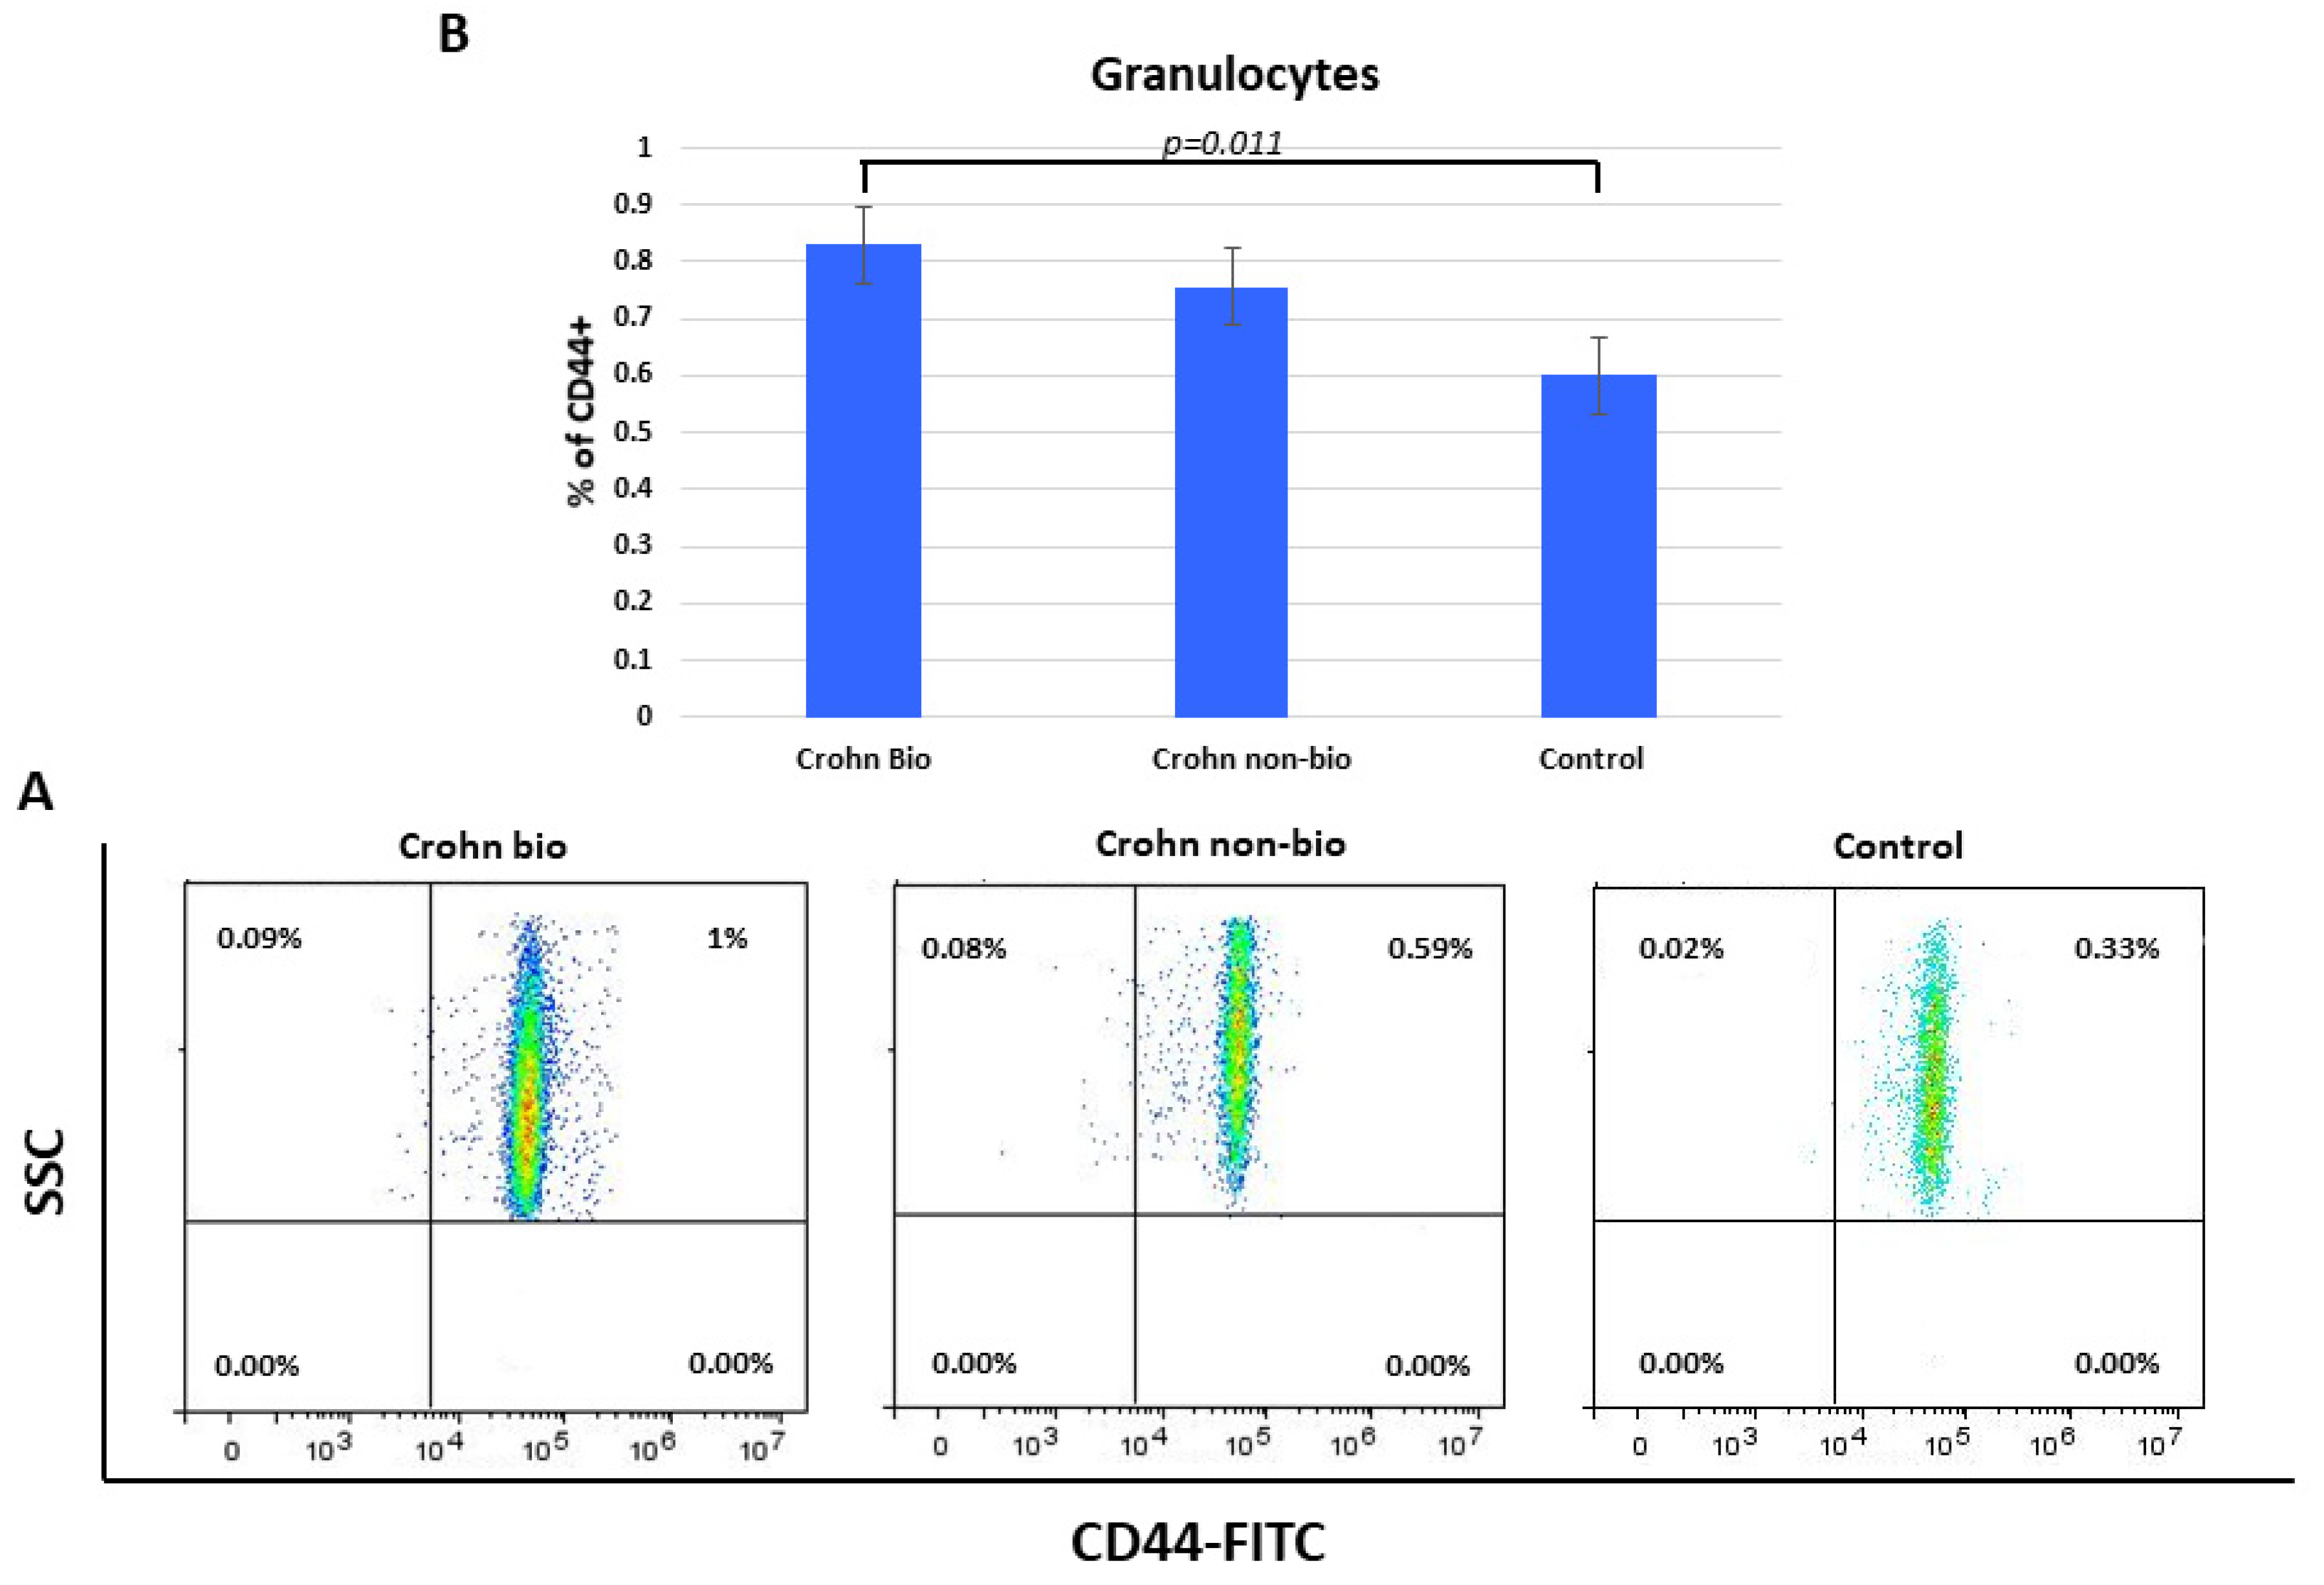
Percentages of CD44+ granulocytes were elevated in Crohn’s disease compared to control subjects (median = 0.6) and specifically in biologically treated patients (median = 8.3, p = 0.011) (Figure 5).
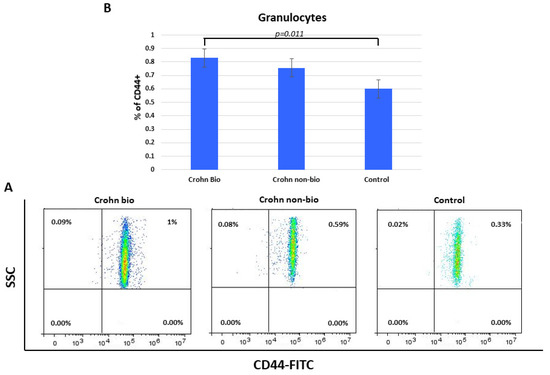
Figure 5.
Percentage of CD44+ granulocytes in patients with Crohn’s disease. Representative dot plots (A) and statistical histogram (B) of patients treated with biological and non-biological therapy as well as of control subjects.
4. Discussion
Our investigation was focused on analyses of CD14, CD16, and CD44 expression in monocyte and lymphocyte subsets as well as granulocyte CD44 in patients with IBD treated with biological or NBT. Crohn′s disease patients treated with NBT showed decreased percentage of non-classical CD14+CD16++ monocytes, whereas patients with biological therapy remained at the control level. After biological treatment, decreased CD44 expression was detected in non-classical monocytes of ulcerative colitis patients, while Crohn’s disease patients’ monocytes were not affected. The percentage of classical CD14++CD16− monocytes was lower in the <9 years of IBD duration subgroup compared with the longer disease duration subgroup. Patients treated with NBT of ulcerative colitis showed lower expression of CD44 in CD44+CD14+ lymphocytes, whereas for the patients treated with biological therapy, there was no difference in comparison to the healthy control group. The percentage of CD44+ granulocytes was elevated in biologically treated patients with Crohn’s disease compared to control subjects.
While we found no difference between biologically treated Crohn’s disease and healthy controls, Nazareth et al. observed a small infliximab-dependent increase in the frequency of circulating non-classical monocytes but without change compared to non-treated Crohn’s disease patients [24]. Non-classical monocytes have the highest expression of CD16 [25]. The CD16 receptor contributes to the cell activation by IgG immune complexes [26]. Consequently, non-classical monocytes are associated with adhesion, complement, and Fc gamma-mediated phagocytosis [27,28]. During IBD, the epithelial barriers of the intestines are damaged, which allows the entry of microbes into the tissue [9]. Homing of non-classical monocytes via α4β7 integrin to the gut mediates macrophage-dependent intestinal wound healing [29]. These macrophages are upregulated in the proliferative phase of wound healing but decreased following vedolizumab, an anti-α4β7 integrin antibody routinely used in IBD treatment [30,31]. According to Nazareth et al. [18], infliximab corrects the defective TNF production of Crohn’s disease macrophages, which seemed to depend upon the enrichment of CD16+ circulating monocytes (including non-classical CD14+CD16++ subset).
Therapies interfering with gut homing have an impact on monocyte subset homing. Classical monocytes preferentially home to inflamed sites in contrast to the non-classical monocytes that home to non-inflamed tissues [32]. In peripheral tissues, monocytes may develop into macrophages and monocyte-derived dendritic cells [33]. The presence of cytokines and microbial compounds can give rise to various types of macrophages: proinflammatory, which secrete cytokines such as TNF-α, IL-12, or IL-23, and anti-inflammatory, which produce cytokines such as IL-10 or TGF-β [34]. The general perception is that non-classical monocytes are biased towards wound-healing macrophages [29]. Decreased percentage of anti-inflammatory non-classical CD14+CD16++ monocytes in non-biologically treated Crohn’s disease and their unchanged level after biological therapy indicate the higher potential of intestinal wound healing in biologically treated patients. In non-biologically treated ulcerative colitis, percentage of non-classical monocytes remained as in the control group. Different production of non-classical CD14+CD16++ monocytes between two IBD could be the consequence of different interplay between leukocytes and tissue cells. Ulcerative colitis and Crohn’s disease differ concerning the IL-18 involvement. IL-18 induces only Crohn’s disease, but not in all patients [35], enhancing NK cell cytotoxicity and stimulating Th1 responses [36,37].
Biological treatment decreased CD44 expression on non-classical monocytes of ulcerative colitis patients, while monocytes in patients with Crohn’s disease were not affected. Total monocyte CD44 isoforms are more precisely designated as CD44s, containing variant exons (CD44v and CD44v7) in human-activated monocytes and different T-cell subpopulations [38]. In addition to hyaluronan [10,11,12], partner ligand molecules of CD44 receptor include laminin, hepatocyte growth factor, vascular endothelial growth factor, and osteopontin [38,39]. Inflammation is initiated by elevated IL-6 secretion from monocytes induced after interaction between osteopontin and CD44v7 [36]. In CD44v7 knock-out mice, IL-6 levels are 30 times lower compared to wild-type mice, leading to reduced colonic inflammation. Expression of CD44 gene was higher in patient biopsies taken from inflamed than from non-inflamed regions [39]. CD44 binds to hyaluronan, laminin, and osteopontin within the extracellular matrix after monocyte extravasation [38,39]. Prior to the extravasation, monocyte ligand α4β7 has to bind to the sMAdCAM-1 receptor on endothelial cell [40]. A phase II study of fully human antibody towards MAdCAM-1 showed induction of remission and mucosal healing after 12 weeks in patients with ulcerative colitis but not with Crohn’s disease, probably due to an inflammatory change that extends through the entire bowel wall [40]. We can assume the same for the unaffected CD44 expression on non-classical monocytes in Crohn’s disease patients in this study.
Classical CD14++CD16− monocytes are inflammatory [41]. Elevated secretion or dysregulation of IL-6 and its signaling pathway may play a major role in the pathogenesis of IBD [39,40,42]. With longer disease duration, inflamed colonic mucosa exhibits increasing chromosomal instability and hypermethylation, marking the colon at risk for further carcinogenesis and indicating the important role of inflammation in this setting [43,44]. Increased risk for colorectal cancer is related to the effect of colon mucosal inflammation, especially after 8 to 10 years [45]. In the present study, percentage of CD14++CD16− monocytes was lower in the <9 years of IBD duration subgroup compared with the longer disease duration subgroup, indicating better control of the disease in the first period.
In parallel to the monocyte analyses, CD14, CD16, and CD44 surface molecules were also analyzed in lymphocytes [46]. Lymphocytes exhibit low levels of CD14 staining. Among 21 different lymphocyte subpopulations, Kalina et al. detected CD14 only at naive B tonsil cells [47]. Naive B cells continuously recirculate throughout the body [48]. Upon extravasation from the peripheral circulation through endothelial vesicles found in the lymphoepithelium into the secondary lymphoid tissue, such as the tonsils, B cells remain there for a few days and then re-enter the circulation unless they encounter cognate antigen [28]. In this study, we detected higher CD44 expression in minor CD44+CD14+ lymphocyte subpopulation in biologically treated ulcerative colitis compared to NBT. NBT resulted in lower CD44 expression compared to the control group, while the biologically treated and control group had similar CD44 expression. In ulcerative colitis, blood lymphocytes include circulating naive and memory T and B lymphocytes as well as primed effector cells that are en route to the inflamed gut mucosa [49]. Naive cells constitute more than half of the blood B cells in healthy adults. Patients with ulcerative colitis and those with Crohn’s disease show increased percentages of CD23+ B cells, which are recognized as being naive B cells [50]. However, in ulcerative colitis, gut inflammation and activation of T cells appear to be a hallmark of the disease. In Crohn’s disease, arrested B-cell activation beyond the naive stage seems to be a characteristic sign [44]. Colonic mucosa samples from patients with ulcerative colitis lack naive B cells that are present in samples from patients with active Crohn’s disease [50]. We can speculate that lower CD44 expression in CD44+CD14+ lymphocyte in blood after NBT, found in ulcerative colitis but not in Crohn’s disease, can be due to the higher naive B-cell count in ulcerative colitis. Excessive production of IL-1, IL-6, IL12/23, and TNFα mediate distinct abnormal T-cell responses resulting in tissue fibrosis [51].
The expression of CD44 per one granulocyte was unaffected in both IBD groups of our study, but the percentage of CD44+ granulocytes was elevated in Crohn’s disease compared to control and specifically in biologically treated patients with Crohn’s disease. Lampinen et al. described a significantly larger percentage of CD44high eosinophils in patients with active Crohn’s disease and ulcerative colitis compared with control subjects [52]. CD44high eosinophils from collagenous colitis intestinal biopsy samples have higher CD66b expression in activated state. Budesonide treatment restores the normal activation of eosinophils [53]. The role of neutrophils in the gut differs between Crohn’s disease and ulcerative colitis [29]. In ulcerative colitis, unrestricted neutrophil activation cause tissue damage, whereas in Crohn’s disease, defective neutrophils are not able to limit invasion by microorganisms, leading to uncontrolled inflammatory reaction [54,55,56].
Biological therapy lowered erythrocyte sedimentation rate (ESR) and fecal calprotectin in ulcerative colitis in comparison to control, while these parameters were unchanged in patients with Crohn’s disease. Furthermore, elevated fecal calprotectin was positively associated with inflammatory biomarkers, namely ESR and CRP [51]. Higher fecal calprotectin and the presence of mucus in diarrhea are known as significant predictors of the development of Crohn’s disease and disease activity [57,58,59]. In the multivariate analyses, only monocyte count and fecal calprotectin were associated with relapse [60]. NBT lowered white blood cells in patients with ulcerative colitis in our study, rendering them more vulnerable to infections.
Biological therapy represents a significant improvement in the treatment of IBD, as it can inhibit the inflammatory cascade in chronic inflammatory disease and thus change the course and stop the progression of the disease. However, the possible side effects are numerous and can affect almost any organ system, some of which can be very serious, such as the development of serious infections, pulmonary embolism of systemic and respiratory hypersensitivity, gastrointestinal fistulas, and malignant and lymphoproliferative diseases.
Understanding the fundamental differentiation and regulation of leukocyte cells will dictate future therapeutic effects, reducing their effect when they are harmful and amplifying their effect when they are useful. This study has several limitations. The design of the present study was cross-sectional, which impedes the establishment of a true causal relationship. Second, this study had a relatively small number of participants. The IBD group from our study mostly was heterogenous in disease activity, which additionally decreases the sample size by stratification and impedes the generalization of the findings to the entire IBD population. IBD is a repeating disease, and the pattern of excreted markers is not constant, so one measurement is not enough to determine a causal relationship. In the preparation of the study, we used only the parameter hs-CRP; other inflammatory parameters that play an important role in the results in the preparation of study were not measured.
5. Conclusions
We describe distinct anti-inflammatory and inflammatory CD44+ monocyte profiles in relation to the types of IBD and their therapies. CD44+CD14+ lymphocytes and CD44+ granulocytes were affected as well. Due to CD44 interactions with extracellular matrix, its optimal expression can be crucial in intestinal wound healing. Nevertheless, future experiments are needed to distinguish between circulating naive and memory T and B lymphocytes, particularly in ulcerative colitis. Independently of the therapy and type of IBD, the percentage of inflammatory monocytes was dependent upon disease duration. This finding emphasizes the importance of inflammatory monocyte monitoring.
Supplementary Materials
The following supporting information can be downloaded at: https://www.mdpi.com/article/10.3390/diagnostics12082014/s1, Table S1: Basic characteristics of IBD and control group; Table S2: Comparison of basic anthropometric and disease characteristics between ulcerative colitis and Crohn’s disease; Table S3: Comparison of selected laboratory characteristics of ulcerative colitis and Crohn’s disease; Table S4: Comparison of selected disease characteristics between Crohn’s disease subgroups according to biologic therapy; Table S5: Comparison of selected laboratory characteristics of Crohn’s disease subgroups according to biologic therapy; Table S6: Comparison of selected disease characteristics between ulcerative colitis subgroups according to biologic therapy; Table S7: Comparison of selected laboratory characteristics of ulcerative colitis subgroups according to biologic therapy.
Author Contributions
Conceptualization, A.M. and J.B.; formal analysis, I.F., N.R.-M. and D.R.; investigation, I.F., N.R.-M. and P.M.Ž.; methodology, I.F., N.R.-M. and M.V.; resources, P.M.Ž. and M.V.; software, A.M.; supervision, A.M. and J.B.; validation, A.M. and J.B.; writing—original draft, I.F., N.R.-M. and A.M.; writing—review and editing, D.R. and J.B. All authors have read and agreed to the published version of the manuscript.
Funding
Data shown resulted from Institutional science financing (supported by University Department of Health Studies, University of Split, Croatia; and Ministry of Science and Education, Republic of Croatia).
Institutional Review Board Statement
Research: The study protocol was approved by Ethics Committee of University of Split School of Medicine (Class: 003-08/17-03/0001; Registration number: 2181-198-03-04-17-0061; 27 November 2017) and Ethics Committee of the University Hospital of Split (Class: 500-03/17-01/86; Registration number: 2181-147-01/06/M.S.-17-2; 23 November 2017), who also confirmed that the study was in full accordance with the ethical principles of the World Medical Association Declaration of Helsinki.
Informed Consent Statement
All participants were introduced to the background and the aim of the study and gave their informed consent in writing before inclusion in the investigation.
Data Availability Statement
Further information regarding the resources and data availability should be directed to the corresponding author.
Conflicts of Interest
The authors declare no conflict of interest.
References
- Sairenji, T.; Collins, K.L.; Evans, D.V. An Update on Inflammatory Bowel Disease. Prim. Care 2017, 44, 673–692. [Google Scholar] [CrossRef] [PubMed]
- Seyedian, S.S.; Nokhostin, F.; Malamir, M.D. A review of the diagnosis, prevention, and treatment methods of inflammatory bowel disease. J. Med. Life 2019, 12, 113–122. [Google Scholar] [PubMed]
- Zivkovic, P.M.; Matetic, A.; Hadjina, I.T.; Rusic, D.; Vilovic, M.; Supe-Domic, D.; Borovac, J.A.; Mudnic, I.; Tonkic, A.; Bozic, J. Serum Catestatin Levels and Arterial Stiffness Parameters Are Increased in Patients with Inflammatory Bowel Disease. J. Clin. Med. 2020, 9, 628. [Google Scholar] [CrossRef] [Green Version]
- Rubin, D.C.; Shaker, A.; Levin, M.S. Chronic intestinal inflammation: Inflammatory bowel disease and colitis-associated colon cancer. Front. Immunol. 2012, 3, 107. [Google Scholar] [CrossRef] [Green Version]
- Na, Y.R.; Stakenborg, M.; Seok, S.H.; Matteoli, G. Macrophages in intestinal inflammation and resolution: A potential therapeutic target in IBD. Nat. Rev. Gastroenterol. Hepatol. 2019, 16, 531–543. [Google Scholar] [CrossRef]
- Palamides, P.; Jodeleit, H.; Fohlinger, M.; Beigel, F.; Herbach, N.; Mueller, T.; Wolf, E.; Siebeck, M.; Gropp, R. A mouse model for ulcerative colitis based on NOD-scid IL2R gammanull mice reconstituted with peripheral blood mononuclear cells from affected individuals. Dis. Model Mech. 2016, 9, 985–997. [Google Scholar] [PubMed] [Green Version]
- Marimuthu, R.; Francis, H.; Dervish, S.; Li, S.C.H.; Medbury, H.; Williams, H. Characterization of Human Monocyte Subsets by Whole Blood Flow Cytometry Analysis. J. Vis. Exp. 2018, 57941. [Google Scholar] [CrossRef] [Green Version]
- Ozanska, A.; Szymczak, D.; Rybka, J. Pattern of human monocyte subpopulations in health and disease. Scand. J. Immunol. 2020, 92, e12883. [Google Scholar] [CrossRef]
- Kapellos, T.S.; Bonaguro, L.; Gemund, I.; Reusch, N.; Saglam, A.; Hinkley, E.R.; Schultze, J.L. Human Monocyte Subsets and Phenotypes in Major Chronic Inflammatory Diseases. Front. Immunol. 2019, 10, 2035. [Google Scholar] [CrossRef] [Green Version]
- Petrey, A.C.; de la Motte, C.A. Hyaluronan, a crucial regulator of inflammation. Front. Immunol. 2014, 5, 101. [Google Scholar] [CrossRef] [Green Version]
- Aruffo, A.; Stamenkovic, I.; Melnick, M.; Underhill, C.B.; Seed, B. CD44 is the principal cell surface receptor for hyaluronate. Cell 1990, 61, 1303–1313. [Google Scholar] [CrossRef]
- McDonald, B.; Kubes, P. Interactions between CD44 and Hyaluronan in Leukocyte Trafficking. Front. Immunol. 2015, 6, 68. [Google Scholar] [CrossRef] [PubMed] [Green Version]
- Ahluwalia, B.; Moraes, L.; Magnusson, M.K.; Ohman, L. Immunopathogenesis of inflammatory bowel disease and mechanisms of biological therapies. Scand. J. Gastroenterol. 2018, 53, 379–389. [Google Scholar] [CrossRef]
- Mezzina, N.; Campbell Davies, S.E.; Ardizzone, S. Nonbiological therapeutic management of ulcerative colitis. Expert Opin. Pharmacother. 2018, 19, 1747–1757. [Google Scholar] [CrossRef] [PubMed]
- Ng, S.C.; Chan, F.K.; Sung, J.J. Review article: The role of non-biological drugs in refractory inflammatory bowel disease. Aliment. Pharmacol. Ther. 2011, 33, 417–427. [Google Scholar] [CrossRef] [PubMed]
- Fredericks, E.; Watermeyer, G. De-escalation of biological therapy in inflammatory bowel disease: Benefits and risks. S. Afr. Med. J. 2019, 109, 745–749. [Google Scholar] [CrossRef]
- Li Yim, A.Y.F.; Duijvis, N.W.; Ghiboub, M.; Sharp, C.; Ferrero, E.; Mannens, M.M.A.M.; D’Haens, G.R.; de Jonge, W.J.; te Velde, A.A.; Henneman, P. Whole-Genome DNA Methylation Profiling of CD14+ Monocytes Reveals Disease Status and Activity Differences in Crohn’s Disease Patients. J. Clin. Med. 2020, 9, 1055. [Google Scholar] [CrossRef] [Green Version]
- Maaser, C.; Sturm, A.; Vavricka, S.R.; Kucharzik, T.; Fiorino, G.; Annese, V.; Calabrese, E.; Baumgart, D.C.; Bettenworth, D.; Nunes, P.B.; et al. ECCO-ESGAR Guideline for Diagnostic Assessment in IBD Part 1: Initial diagnosis, monitoring of known IBD, detection of complications. J. Crohns Colitis 2019, 13, 144–164. [Google Scholar] [CrossRef] [Green Version]
- Travis, S.P.; Schnell, D.; Krzeski, P.; Abreu, M.T.; Altman, D.G.; Colombel, J.F.; Feagan, B.G.; Hanauer, S.B.; Lichtenstein, G.R.; Marteau, P.R.; et al. Reliability and initial validation of the ulcerative colitis endoscopic index of severity. Gastroenterology 2013, 145, 987–995. [Google Scholar] [CrossRef] [Green Version]
- Xie, T.; Zhang, T.; Ding, C.; Dai, X.; Li, Y.; Guo, Z.; Wei, Y.; Gong, J.; Zhu, W.; Li, J. Ulcerative Colitis Endoscopic Index of Severity (UCEIS) versus Mayo Endoscopic Score (MES) in guiding the need for colectomy in patients with acute severe colitis. Gastroenterol. Rep. 2018, 6, 38–44. [Google Scholar] [CrossRef]
- Lewis, J.D.; Chuai, S.; Nessel, L.; Lichtenstein, G.R.; Aberra, F.N.; Ellenberg, J.H. Use of the noninvasive components of the Mayo score to assess clinical response in ulcerative colitis. Inflamm. Bowel Dis. 2008, 14, 1660–1666. [Google Scholar] [CrossRef] [PubMed] [Green Version]
- Daperno, M.; D’Haens, G.; Van Assche, G.; Baert, F.; Bulois, P.; Maunoury, V.; Sostegni, R.; Rocca, R.; Pera, A.; Gevers, A.; et al. Development and validation of a new, simplified endoscopic activity score for Crohn’s disease: The SES-CD. Gastrointest. Endosc. 2004, 60, 505–512. [Google Scholar]
- Hammer, Ø.; Harper, D.A.T.; Ryan, P.D. PAST: Paleontological statistics software package for education and data analysis. Palaeontol. Electron. 2001, 4, 9. [Google Scholar]
- Nazareth, N.; Magro, F.; Silva, J.; Duro, M.; Gracio, D.; Coelho, R.; Appelberg, R.; Macedo, G.; Sarmento, A. Infliximab therapy increases the frequency of circulating CD16 (+) monocytes and modifies macrophage cytokine response to bacterial infection. Clin. Exp. Immunol. 2014, 177, 703–711. [Google Scholar] [CrossRef] [PubMed]
- Ziegler-Heitbrock, L.; Hofer, T.P. Toward a refined definition of monocyte subsets. Front. Immunol. 2013, 4, 23. [Google Scholar]
- Galon, J.; Gauchat, J.F.; Mazieres, N.; Spagnoli, R.; Storkus, W.; Lotze, M.; Bonnefoy, J.Y.; Fridman, W.H. Soluble Fcgamma receptor type III (FcgammaRIII, CD16) triggers cell activation through interaction with complement receptors. J. Immunol. 1996, 157, 1184–1192. [Google Scholar]
- Gren, S.T.; Rasmussen, T.B.; Janciauskiene, S.; Hakansson, K.; Gerwien, J.G.; Grip, O. A Single-Cell Gene-Expression Profile Reveals Inter-Cellular Heterogeneity within Human Monocyte Subsets. PLoS ONE 2015, 10, e0144351. [Google Scholar]
- Wong, K.L.; Tai, J.J.; Wong, W.C.; Han, H.; Sem, X.; Yeap, W.H.; Kourilsky, P.; Wong, S.-C. Gene expression profiling reveals the defining features of the classical, intermediate, and nonclassical human monocyte subsets. Blood 2011, 118, e16–e31. [Google Scholar]
- Prame Kumar, K.; Nicholls, A.J.; Wong, C.H.Y. Partners in crime: Neutrophils and monocytes/macrophages in inflammation and disease. Cell Tissue Res. 2018, 371, 551–565. [Google Scholar]
- Schleier, L.; Wiendl, M.; Heidbreder, K.; Binder, M.T.; Atreya, R.; Rath, T.; Becker, E.; Schulz-Kuhnt, A.; Stahl, A.; Schulze, L.L.; et al. Non-classical monocyte homing to the gut via alpha4beta7 integrin mediates macrophage-dependent intestinal wound healing. Gut 2020, 69, 252–263. [Google Scholar] [CrossRef]
- Sandborn, W.J.; Feagan, B.G.; Rutgeerts, P.; Hanauer, S.; Colombel, J.F.; Sands, B.E.; Lukas, M.; Fedorak, R.N.; Lee, S.; Bressler, B.; et al. Vedolizumab as induction and maintenance therapy for Crohn’s disease. N. Engl. J. Med. 2013, 369, 711–721. [Google Scholar] [CrossRef] [PubMed] [Green Version]
- Geissmann, F.; Jung, S.; Littman, D.R. Blood monocytes consist of two principal subsets with distinct migratory properties. Immunity 2003, 19, 71–82. [Google Scholar] [CrossRef] [Green Version]
- Kuhl, A.A.; Erben, U.; Kredel, L.I.; Siegmund, B. Diversity of Intestinal Macrophages in Inflammatory Bowel Diseases. Front. Immunol. 2015, 6, 613. [Google Scholar] [CrossRef] [Green Version]
- Murray, P.J.; Wynn, T.A. Protective and pathogenic functions of macrophage subsets. Nat. Rev. Immunol. 2011, 11, 723–737. [Google Scholar] [CrossRef] [PubMed]
- Sanchez-Munoz, F.; Dominguez-Lopez, A.; Yamamoto-Furusho, J.K. Role of cytokines in inflammatory bowel disease. World J. Gastroenterol. 2008, 14, 4280–4288. [Google Scholar] [CrossRef] [PubMed]
- Corbaz, A.; ten Hove, T.; Herren, S.; Graber, P.; Schwartsburd, B.; Belzer, I.; Harrison, J.; Plitz, T.; Kosco-Vilbois, M.H.; Kim, S.-H.; et al. IL-18-binding protein expression by endothelial cells and macrophages is up-regulated during active Crohn’s disease. J. Immunol. 2002, 168, 3608–3616. [Google Scholar] [CrossRef] [PubMed] [Green Version]
- Puren, A.J.; Fantuzzi, G.; Gu, Y.; Su, M.S.; Dinarello, C.A. Interleukin-18 (IFNgamma-inducing factor) induces IL-8 and IL–1beta via TNFalpha production from non-CD14+ human blood mononuclear cells. J. Clin. Investig. 1998, 101, 711–721. [Google Scholar] [CrossRef] [Green Version]
- Johnson, P.; Ruffell, B. CD44 and its role in inflammation and inflammatory diseases. Inflamm. Allergy Drug Targets 2009, 8, 208–220. [Google Scholar] [CrossRef]
- Jordan, A.R.; Racine, R.R.; Hennig, M.J.; Lokeshwar, V.B. The Role of CD44 in Disease Pathophysiology and Targeted Treatment. Front. Immunol. 2015, 6, 182. [Google Scholar] [CrossRef]
- Allocca, M.; Gilardi, D.; Fiorino, G.; Furfaro, F.; Argollo, M.; Peyrin-Biroulet, L.; Danese, S. PF-00547659 for the treatment of Crohn’s disease and ulcerative colitis. Expert Opin. Investig. Drugs 2018, 27, 623–629. [Google Scholar] [CrossRef]
- Belge, K.U.; Dayyani, F.; Horelt, A.; Siedlar, M.; Frankenberger, M.; Frankenberger, B.; Espevik, T.; Ziegler-Heitbrock, L. The proinflammatory CD14+ CD16+ DR++ monocytes are a major source of TNF. J. Immunol. 2002, 168, 3536–3542. [Google Scholar] [CrossRef] [PubMed] [Green Version]
- Kusugami, K.; Youngman, K.R.; West, G.A.; Fiocchi, C. Intestinal immune reactivity to interleukin 2 differs among Crohn’s disease, ulcerative colitis, and controls. Gastroenterology 1989, 97, 1–9. [Google Scholar] [CrossRef]
- Reinisch, W.; Gasche, C.; Tillinger, W.; Wyatt, J.; Lichtenberger, C.; Willheim, M.; Dejaco, C.; Waldhör, T.; Bakos, S.; Vogelsang, H.; et al. Clinical relevance of serum interleukin-6 in Crohn’s disease: Single point measurements, therapy monitoring, and prediction of clinical relapse. Am. J. Gastroenterol. 1999, 94, 2156–2164. [Google Scholar] [CrossRef] [PubMed]
- Labbe, C.; Boucher, G.; Foisy, S.; Alikashani, A.; Nkwimi, H.; David, G.; Beaudoin, M.; Goyette, P.; Charron, G.; Xavier, R.J.; et al. Genome-wide expression profiling implicates a MAST3-regulated gene set in colonic mucosal inflammation of ulcerative colitis patients. Inflamm. Bowel Dis. 2012, 18, 1072–1080. [Google Scholar] [CrossRef] [PubMed]
- Clarke, W.T.; Feuerstein, J.D. Colorectal cancer surveillance in inflammatory bowel disease: Practice guidelines and recent developments. World J. Gastroenterol. 2019, 25, 4148–4157. [Google Scholar] [CrossRef]
- Loken, M.R.; Brosnan, J.M.; Bach, B.A.; Ault, K.A. Establishing optimal lymphocyte gates for immunophenotyping by flow cytometry. Cytometry 1990, 11, 453–459. [Google Scholar] [CrossRef]
- Kalina, T.; Fiser, K.; Perez–Andres, M.; Kuzilkova, D.; Cuenca, M.; Bartol, S.J.W.; Blanco, E.; Engel, P.; Van Zelm, M.C. CD Maps-Dynamic Profiling of CD1-CD100 Surface Expression on Human Leukocyte and Lymphocyte Subsets. Front. Immunol. 2019, 10, 2434. [Google Scholar] [CrossRef] [Green Version]
- Thorley-Lawson, D.A. EBV Persistence––Introducing the Virus. Curr. Top. Microbiol. Immunol. 2015, 390, 151–209. [Google Scholar]
- Rabe, H.; Malmquist, M.; Barkman, C.; Ostman, S.; Gjertsson, I.; Saalman, R.; Wold, A.E. Distinct patterns of naive, activated and memory T and B cells in blood of patients with ulcerative colitis or Crohn’s disease. Clin. Exp. Immunol. 2019, 197, 111–129. [Google Scholar] [CrossRef] [Green Version]
- Klein, U.; Rajewsky, K.; Kuppers, R. Human immunoglobulin (Ig)M+ IgD+ peripheral blood B cells expressing the CD27 cell surface antigen carry somatically mutated variable region genes: CD27 as a general marker for somatically mutated (memory). B cells. J. Exp. Med. 1998, 188, 1679–1689. [Google Scholar] [CrossRef] [Green Version]
- Karin, M.; Clevers, H. Reparative inflammation takes charge of tissue regeneration. Nature 2016, 529, 307–315. [Google Scholar] [CrossRef]
- Lampinen, M.; Ronnblom, A.; Amin, K.; Kristjansson, G.; Rorsman, F.; Sangfelt, P.; Säfsten, B.; Wagner, M.; Wanders, A.; Winqvist, O.; et al. Eosinophil granulocytes are activated during the remission phase of ulcerative colitis. Gut 2005, 54, 1714–1720. [Google Scholar] [CrossRef] [PubMed]
- Wagner, M.; Lampinen, M.; Sangfelt, P.; Agnarsdottir, M.; Carlson, M. Budesonide treatment of patients with collagenous colitis restores normal eosinophil and T-cell activity in the colon. Inflamm. Bowel Dis. 2010, 16, 1118–1126. [Google Scholar] [CrossRef] [PubMed]
- Harbord, M.W.; Marks, D.J.; Forbes, A.; Bloom, S.L.; Day, R.M.; Segal, A.W. Impaired neutrophil chemotaxis in Crohn’s disease relates to reduced production of chemokines and can be augmented by granulocyte-colony stimulating factor. Aliment Pharmacol. Ther. 2006, 24, 651–660. [Google Scholar] [CrossRef] [PubMed] [Green Version]
- Marks, D.J.; Harbord, M.W.; MacAllister, R.; Rahman, F.Z.; Young, J.; Al-Lazikani, B.; Lees, W.; Novelli, M.; Bloom, S.; Segal, A.W. Defective acute inflammation in Crohn’s disease: A clinical investigation. Lancet 2006, 367, 668–678. [Google Scholar] [CrossRef]
- Wera, O.; Lancellotti, P.; Oury, C. The Dual Role of Neutrophils in Inflammatory Bowel Diseases. J. Clin. Med. 2016, 5, 118. [Google Scholar] [CrossRef]
- Soleymani, S.; Moradkhani, A.; Eftekhari, M.; Rahmanian, F.; Moosavy, S.H. Correlation between Clinical Symptoms and Lab Tests with Endoscopic Severity Indexes in Patients with Inflammatory Bowel Diseases. Middle East J. Dig. Dis. 2020, 12, 162–170. [Google Scholar] [CrossRef]
- Klingberg, E.; Strid, H.; Stahl, A.; Deminger, A.; Carlsten, H.; Ohman, L.; Forsblad-D’Elia, H. A longitudinal study of fecal calprotectin and the development of inflammatory bowel disease in ankylosing spondylitis. Arthritis Res. Ther. 2017, 19, 21. [Google Scholar] [CrossRef] [Green Version]
- Krzesiek, E. Fecal Calprotectin as an Activity Marker of Inflammatory Bowel Disease in Children. Adv. Clin. Exp. Med. 2015, 24, 815–822. [Google Scholar] [CrossRef] [Green Version]
- Ferreiro Iglesias, R.; Barreiro-de Acosta, M.; Lopez, J.; Baston Rey, I.; Dominguez-Munoz, J.E. Usefulness of Peripheral Blood Monocyte Count to Predict Relapse in Patients with Inflammatory Bowel Disease: A Prospective Longitudinal Cohort Study. Rev. Esp. Enferm. Dig. 2021, 114, 10–15. [Google Scholar] [CrossRef]
Publisher’s Note: MDPI stays neutral with regard to jurisdictional claims in published maps and institutional affiliations. |
© 2022 by the authors. Licensee MDPI, Basel, Switzerland. This article is an open access article distributed under the terms and conditions of the Creative Commons Attribution (CC BY) license (https://creativecommons.org/licenses/by/4.0/).

