Errors occurred in the number of patients in the posterior circulation ischemic stroke (PCIS) group and non-PCIS group described in the original publication [1]. A correction of the data has been made to the Abstract, Results (Section 3.1, first paragraph), Table 1 and Figure 1.
Text Correction
In Abstract, the sentence “They were assigned to the posterior circulation stroke (49 patients) and non-posterior circulation stroke group (159 patients) based on clinical presentation and diffusion-weighted imaging (DWI)” should be replaced with “They were assigned to the posterior circulation stroke (59 patients) and non-posterior circulation stroke group (149 patients) based on clinical presentation and diffusion-weighted imaging (DWI)”.
In Section 3.1. Clinicopathologic Characteristics of Enrolled Patients with Posterior ICAS, the sentence “A total of 152 (73.1%) were male patients; there were 159 patients in non-posterior circulation ischemic stroke (non-PCIS) group and 49 patients in PCIS group” should be replaced with “A total of 152 (73.1%) were male patients; there were 149 patients in non-posterior circulation ischemic stroke (non-PCIS) group and 59 patients in PCIS group”.
Table Correction
In the first lines of Table 1, for the non-stroke group (n = 159) should be corrected to (n = 149) and for the stroke group (n = 49) should be corrected to (n = 59). The correct Table 1 is as below:

Table 1.
Clinical and intracranial plaque characteristics of study population and comparison between stroke and non-stroke patients.
Table 1.
Clinical and intracranial plaque characteristics of study population and comparison between stroke and non-stroke patients.
| Variables | All Patients (n = 208) | Non-Stroke Group (n = 149) | Stroke Group (n = 59) | p-Value |
|---|---|---|---|---|
| Age (year) | 61.00 [54.00, 68.00] | 62.00 [54.00, 68.00] | 59.00 [53.00, 66.50] | 0.174 |
| Gender | 0.575 | |||
| Female (%) | 56 (26.9) | 38 (25.5) | 18 (30.5) | |
| Male (%) | 152 (73.1) | 111 (74.5) | 41 (69.5) | |
| BMI (kg/m2) | 25.39 [23.25, 27.14] | 24.98 [23.01, 26.45] | 25.95 [24.38, 27.59] | 0.012 |
| SBP (mmHg) | 146.0 [131.00, 157.25] | 145.00 [130.00, 153.00] | 151.00 [138.50, 168.00] | 0.003 |
| DBP (mmHg) | 84.00 [75.00, 95.00] | 81.00 [73.00, 93.00] | 87.00 [80.00, 98.00] | 0.009 |
| MAP (mmHg) | 104.00 [94.67, 115.67] | 102.67 [93.33, 113.33] | 107.67 [100.67, 121.17] | 0.003 |
| Comorbidities, n (%) | ||||
| Hypertension | 174 (83.7) | 121 (81.2) | 53 (89.8) | 0.191 |
| Diabetes | 79 (38.0) | 56 (37.6) | 23 (39.0) | 0.977 |
| Dyslipidemia | 66 (31.7) | 53 (35.6) | 13 (22.0) | 0.084 |
| Coronary heart disease | 28 (13.5) | 18 (12.1) | 10 (16.9) | 0.483 |
| Previous stroke history | 64 (30.8) | 50 (33.6) | 14 (23.7) | 0.223 |
| Smoking | 92 (44.2) | 67 (45.0) | 25 (42.4) | 0.854 |
| Plaque characteristics | ||||
| Luminal stenosis (%) | 0.41 [0.14, 0.65] | 0.32 [0.10, 0.56] | 0.56 [0.34, 0.88] | <0.001 |
| Plaque burden (%) | 0.80 [0.71, 0.88] | 0.78 [0.69, 0.85] | 0.87 [0.79, 0.96] | <0.001 |
| Remodeling index (%) | 1.10 [0.98, 1.21] | 1.09 [0.97, 1.23] | 1.10 [0.99, 1.17] | 0.729 |
| The type of remodeling (%) | 0.655 | |||
| Negative remodeling | 40 (19.2) | 30 (20.1) | 10 (16.9) | |
| Intermediate remodeling | 35 (16.8) | 23 (15.4) | 12 (20.3) | |
| Positive remodeling; | 133 (63.9) | 96 (64.4) | 37 (62.7) | |
| Distribution patterns (%) | 0.006 | |||
| Diffuse | 126 (60.6) | 81 (54.4) | 45 (76.3) | |
| Focal | 82 (39.4) | 68 (45.6) | 14 (23.7) | |
| Quadrant Location (%) | ||||
| Ventral | 151 (72.6) | 103 (69.1) | 48 (81.4) | 0.107 |
| Dorsal | 139 (66.8) | 92 (61.7) | 47 (79.7) | 0.021 |
| Left | 166 (79.8) | 114 (76.5) | 52 (88.1) | 0.091 |
| Right | 144 (69.2) | 96 (64.4) | 48 (81.4) | 0.027 |
| Maximum wall thickness (mm) | 1.46 [1.09, 2.01] | 1.37 [1.02, 1.91] | 1.58 [1.28, 2.11] | 0.017 |
| Maximum plaque length (mm) | 5.56 [3.77, 10.57] | 5.47 [3.99, 9.88] | 6.45 [3.32, 11.30] | 0.802 |
| Ratio of maximum length to thickness | 3.87 [2.50, 6.56] | 4.17 [2.56, 6.68] | 3.45 [2.26, 6.32] | 0.18 |
| Plaque enhancement (%) | <0.001 * | |||
| NO enhancement | 15 (7.2) | 14 (9.4) | 1 (1.7) | |
| Mild enhancement | 132 (63.5) | 109 (73.2) | 23 (39.0) | |
| Marked enhancement | 61 (29.3) | 26 (17.4) | 35 (59.3) | |
| Plaque surface (%) | <0.001 | |||
| Regular | 73 (35.1) | 65 (43.6) | 8 (13.6) | |
| Irregular | 135 (64.9) | 84 (56.4) | 51 (86.4) | |
| Geometry of the vertebrobasilar (%) | 0.669 | |||
| Walking | 55 (26.4) | 41 (27.5) | 14 (23.7) | |
| Tuning Fork | 59 (28.4) | 44 (29.5) | 15 (25.4) | |
| Lambda | 61 (29.3) | 43 (28.9) | 18 (30.5) | |
| No Confluence | 33 (15.9) | 21 (14.1) | 12 (20.3) | |
| Plaque location (%) | <0.001 | |||
| Right vertebral artery | 64 (30.8) | 48 (32.2) | 16 (27.1) | |
| Left vertebral artery | 83 (39.9) | 69 (46.3) | 14 (23.7) | |
| Basal artery | 61 (29.3) | 32 (21.5) | 29 (49.2) | |
| Laboratory findings | ||||
| WBC (×1012/L) | 6.80 [5.50, 7.91] | 6.50 [5.40, 7.73] | 7.20 [6.14, 8.50] | 0.005 |
| RBC (×109/L) | 4.44 [4.14, 4.76] | 4.40 [4.12, 4.71] | 4.63 [4.20, 4.89] | 0.028 |
| HGB (g/L) | 136.00 [125.00, 144.93] | 135.00 [125.00, 144.00] | 138.00 [127.65, 148.50] | 0.17 |
| Platelets (×109/L) | 211.00 [169.75, 260.75] | 203.00 [167.00, 256.00] | 236.00 [181.00, 271.50] | 0.142 |
| NLR (%) | 2.45 [1.88, 3.22] | 2.36 [1.88, 3.07] | 2.68 [1.91, 3.98] | 0.085 |
| PLR (%) | 126.81 [100.51, 166.94] | 125.27 [100.22, 169.61] | 131.09 [107.95, 155.00] | 0.657 |
| HCT (%) | 40.80 [37.88, 43.52] | 40.60 [37.50, 43.30] | 41.00 [38.20, 44.10] | 0.205 |
| MCV (fL) | 91.95 [89.27, 94.53] | 92.40 [89.60, 94.80] | 91.20 [88.30, 93.50] | 0.12 |
| MCH (pg) | 30.80 [29.78, 31.80] | 31.00 [30.00, 31.90] | 30.50 [29.40, 31.35] | 0.051 |
| ALT (U/L) | 19.00 [12.75, 27.00] | 18.00 [12.00, 26.00] | 20.00 [13.00, 27.50] | 0.884 |
| AST (U/L) | 19.00 [16.00, 23.00] | 19.00 [16.00, 23.00] | 19.00 [16.00, 23.00] | 0.84 |
| TBIL (μmol/L) | 12.35 [9.70, 16.20] | 12.40 [9.70, 16.00] | 11.70 [9.70, 16.65] | 0.511 |
| ALB (g/L) | 39.00 [36.80, 41.00] | 38.80 [36.50, 41.10] | 39.30 [37.20, 40.50] | 0.836 |
| Glucose (mmol/L) | 5.24 [4.69, 6.80] | 5.24 [4.69, 6.81] | 5.24 [4.70, 6.60] | 0.939 |
| BUN (mmol/L) | 5.25 [4.40, 6.52] | 5.00 [4.41, 6.46] | 5.76 [4.40, 6.86] | 0.157 |
| Creatinine (μmol/L) | 71.30 [59.98, 84.38] | 72.20 [61.20, 84.90] | 67.70 [57.95, 83.40] | 0.405 |
| Uric acid (μmol/L) | 324.40 [275.40, 413.98] | 326.00 [276.90, 402.20] | 319.60 [271.90, 426.65] | 0.862 |
| CHOL (mmol/L) | 4.06 [3.36, 4.93] | 3.97 [3.26, 4.73] | 4.40 [3.61, 5.19] | 0.037 |
| TG (mmol/L) | 1.47 [1.09, 1.95] | 1.41 [1.02, 1.77] | 1.60 [1.27, 2.25] | 0.012 |
| HDL (mmol/L) | 1.00 [0.88, 1.13] | 1.02 [0.90, 1.14] | 0.94 [0.82, 1.07] | 0.04 |
| LDL (mmol/L) | 2.40 [1.85, 3.02] | 2.32 [1.82, 2.95] | 2.72 [2.07, 3.49] | 0.026 |
| LDa (mg/L) | 167.60 [75.42, 320.48] | 167.70 [75.50, 336.00] | 167.50 [81.70, 269.05] | 0.673 |
| HCY (umol/L) | 14.20 [12.28, 16.40] | 14.10 [12.40, 16.30] | 14.30 [11.85, 16.80] | 0.716 |
| Fibrinogen (g/L) | 328.50 [270.75, 380.00] | 324.00 [267.00, 369.00] | 347.00 [279.50, 392.50] | 0.126 |
| D-dimer (ng/mL) | 94.00 [53.00, 164.25] | 93.00 [46.00, 148.00] | 107.00 [61.50, 207.50] | 0.072 |
[ ] for IQR: interquartile range. ALB, albumin; ALT, alanine transaminase; AST, aspartate aminotransferase; BUN, blood urea nitrogen; BMI, body mass index; CHOL, total cholesterol; DBP, diastolic blood pressure; HDL, high density lipoprotein; HGB, hemoglobin; HCT, hematocrit; HCY, homocysteine; LDa, lipoprotein a; LDL, low density lipoprotein; MAP, mean arterial pressure; MCV, mean corpuscular volume; MCH, mean corpuscular hemoglobin; NLR, neutrophil-to-lymphocyte ratio; PLR, platelet-to-lymphocyte ratio; RBC, red blood cell; SBP, systolic blood pressure; TBIL, total bilirubin; TG, triglyceride; WBC, white blood cell. * Calculated with Fisher’s exact test.
Figure Correction
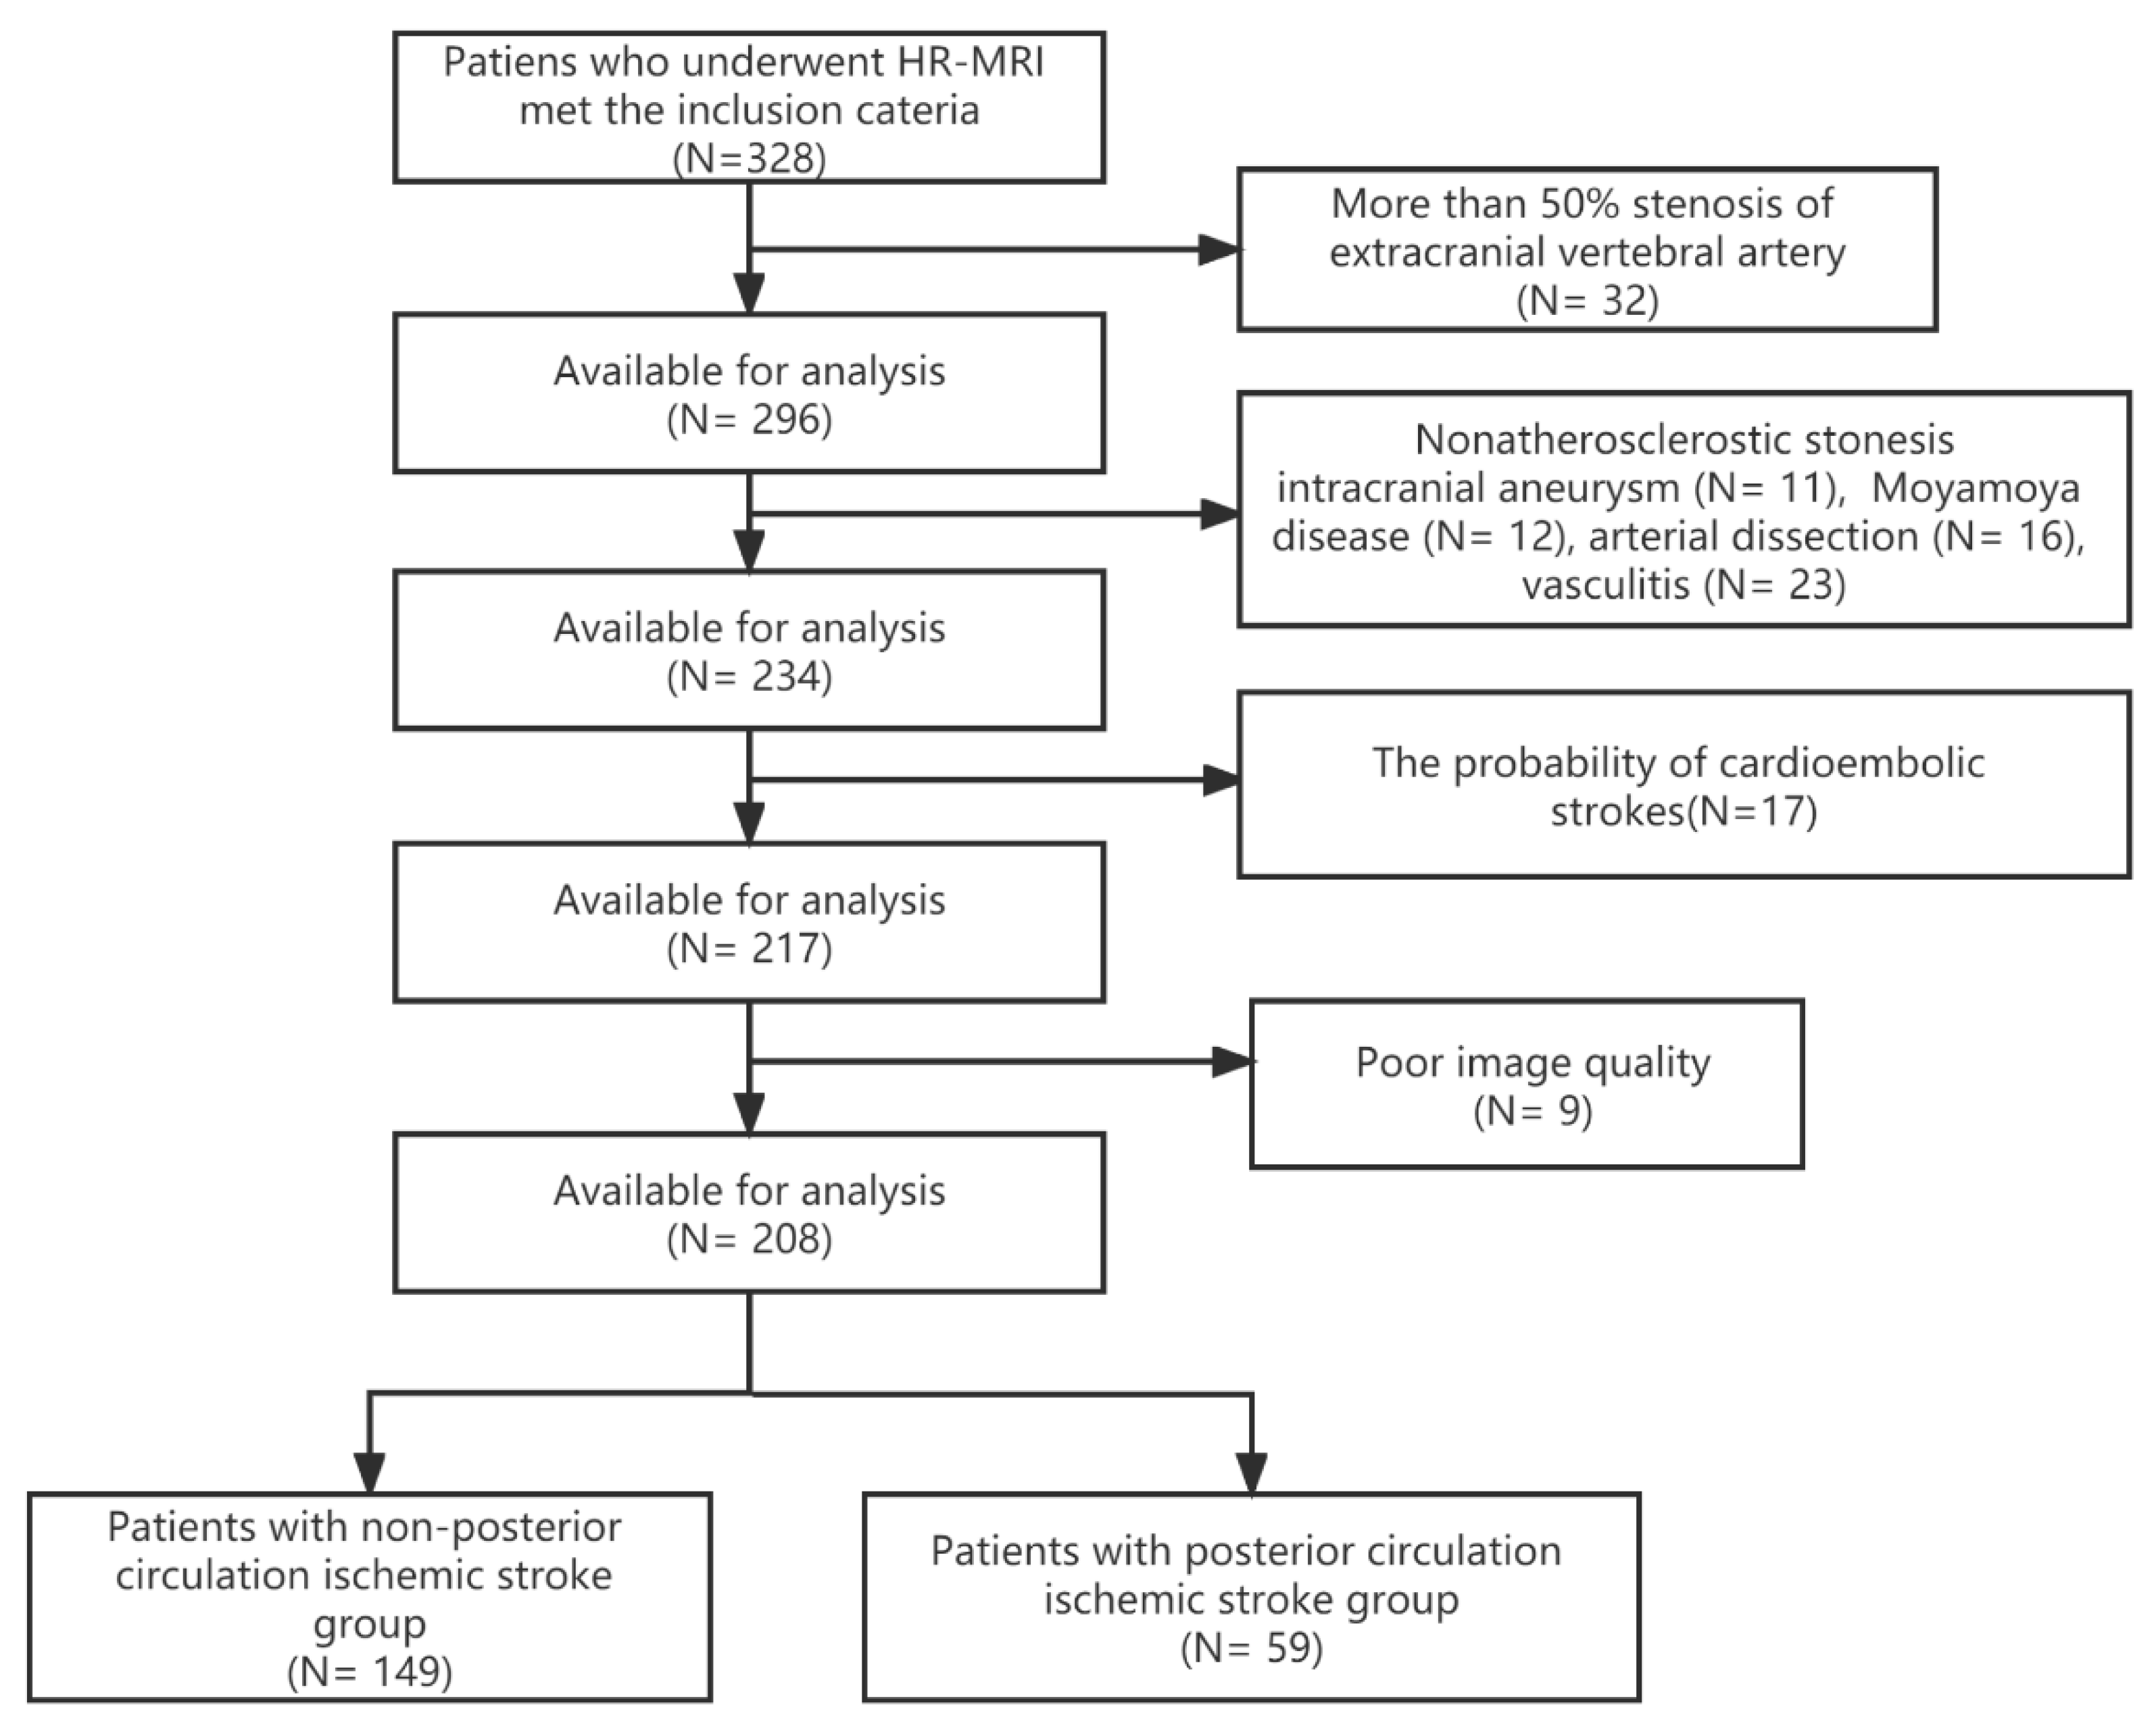
In the last lines of Figure 1, for the group of the patiens with non-posterior circulation ischemic stroke, (n = 159) should be corrected to (n = 149), and for the group of patiens with posterior circulation ischemic stroke, (n = 49) should be corrected to (n = 59). The correct Figure 1 is as below:
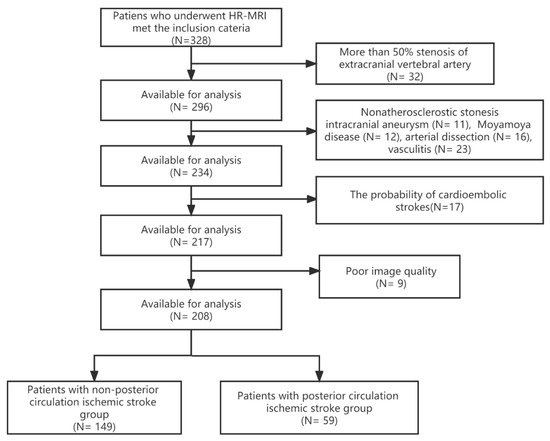
Figure 1.
The flow chart for the inclusion of patients. HR-MRI, high-resolution magnetic resonance imaging.
Figure 1.
The flow chart for the inclusion of patients. HR-MRI, high-resolution magnetic resonance imaging.
The authors apologize for any inconvenience caused and state that the scientific conclusions are unaffected. This correction was approved by the Academic Editor. The original publication has also been updated.
Reference
- Liu, Z.; Zhong, F.; Xie, Y.; Lu, X.; Hou, B.; Ouyang, K.; Fang, J.; Liao, M.; Liu, Y. A predictive model for the risk of posterior circulation stroke in patients with intracranial atherosclerosis based on high resolution MRI. Diagnostics 2022, 12, 812. [Google Scholar] [CrossRef] [PubMed]
Publisher’s Note: MDPI stays neutral with regard to jurisdictional claims in published maps and institutional affiliations. |
© 2022 by the authors. Licensee MDPI, Basel, Switzerland. This article is an open access article distributed under the terms and conditions of the Creative Commons Attribution (CC BY) license (https://creativecommons.org/licenses/by/4.0/).