
Differentiating Enchondromas and Atypical Cartilaginous Tumors in Long Bones with Computed Tomography and Magnetic Resonance Imaging
 , , , ,
Abstract
:1. Introduction
2. Material and Methods
2.1. Patient Collective
2.2. Image Acquisition
2.3. Evaluation Criteria
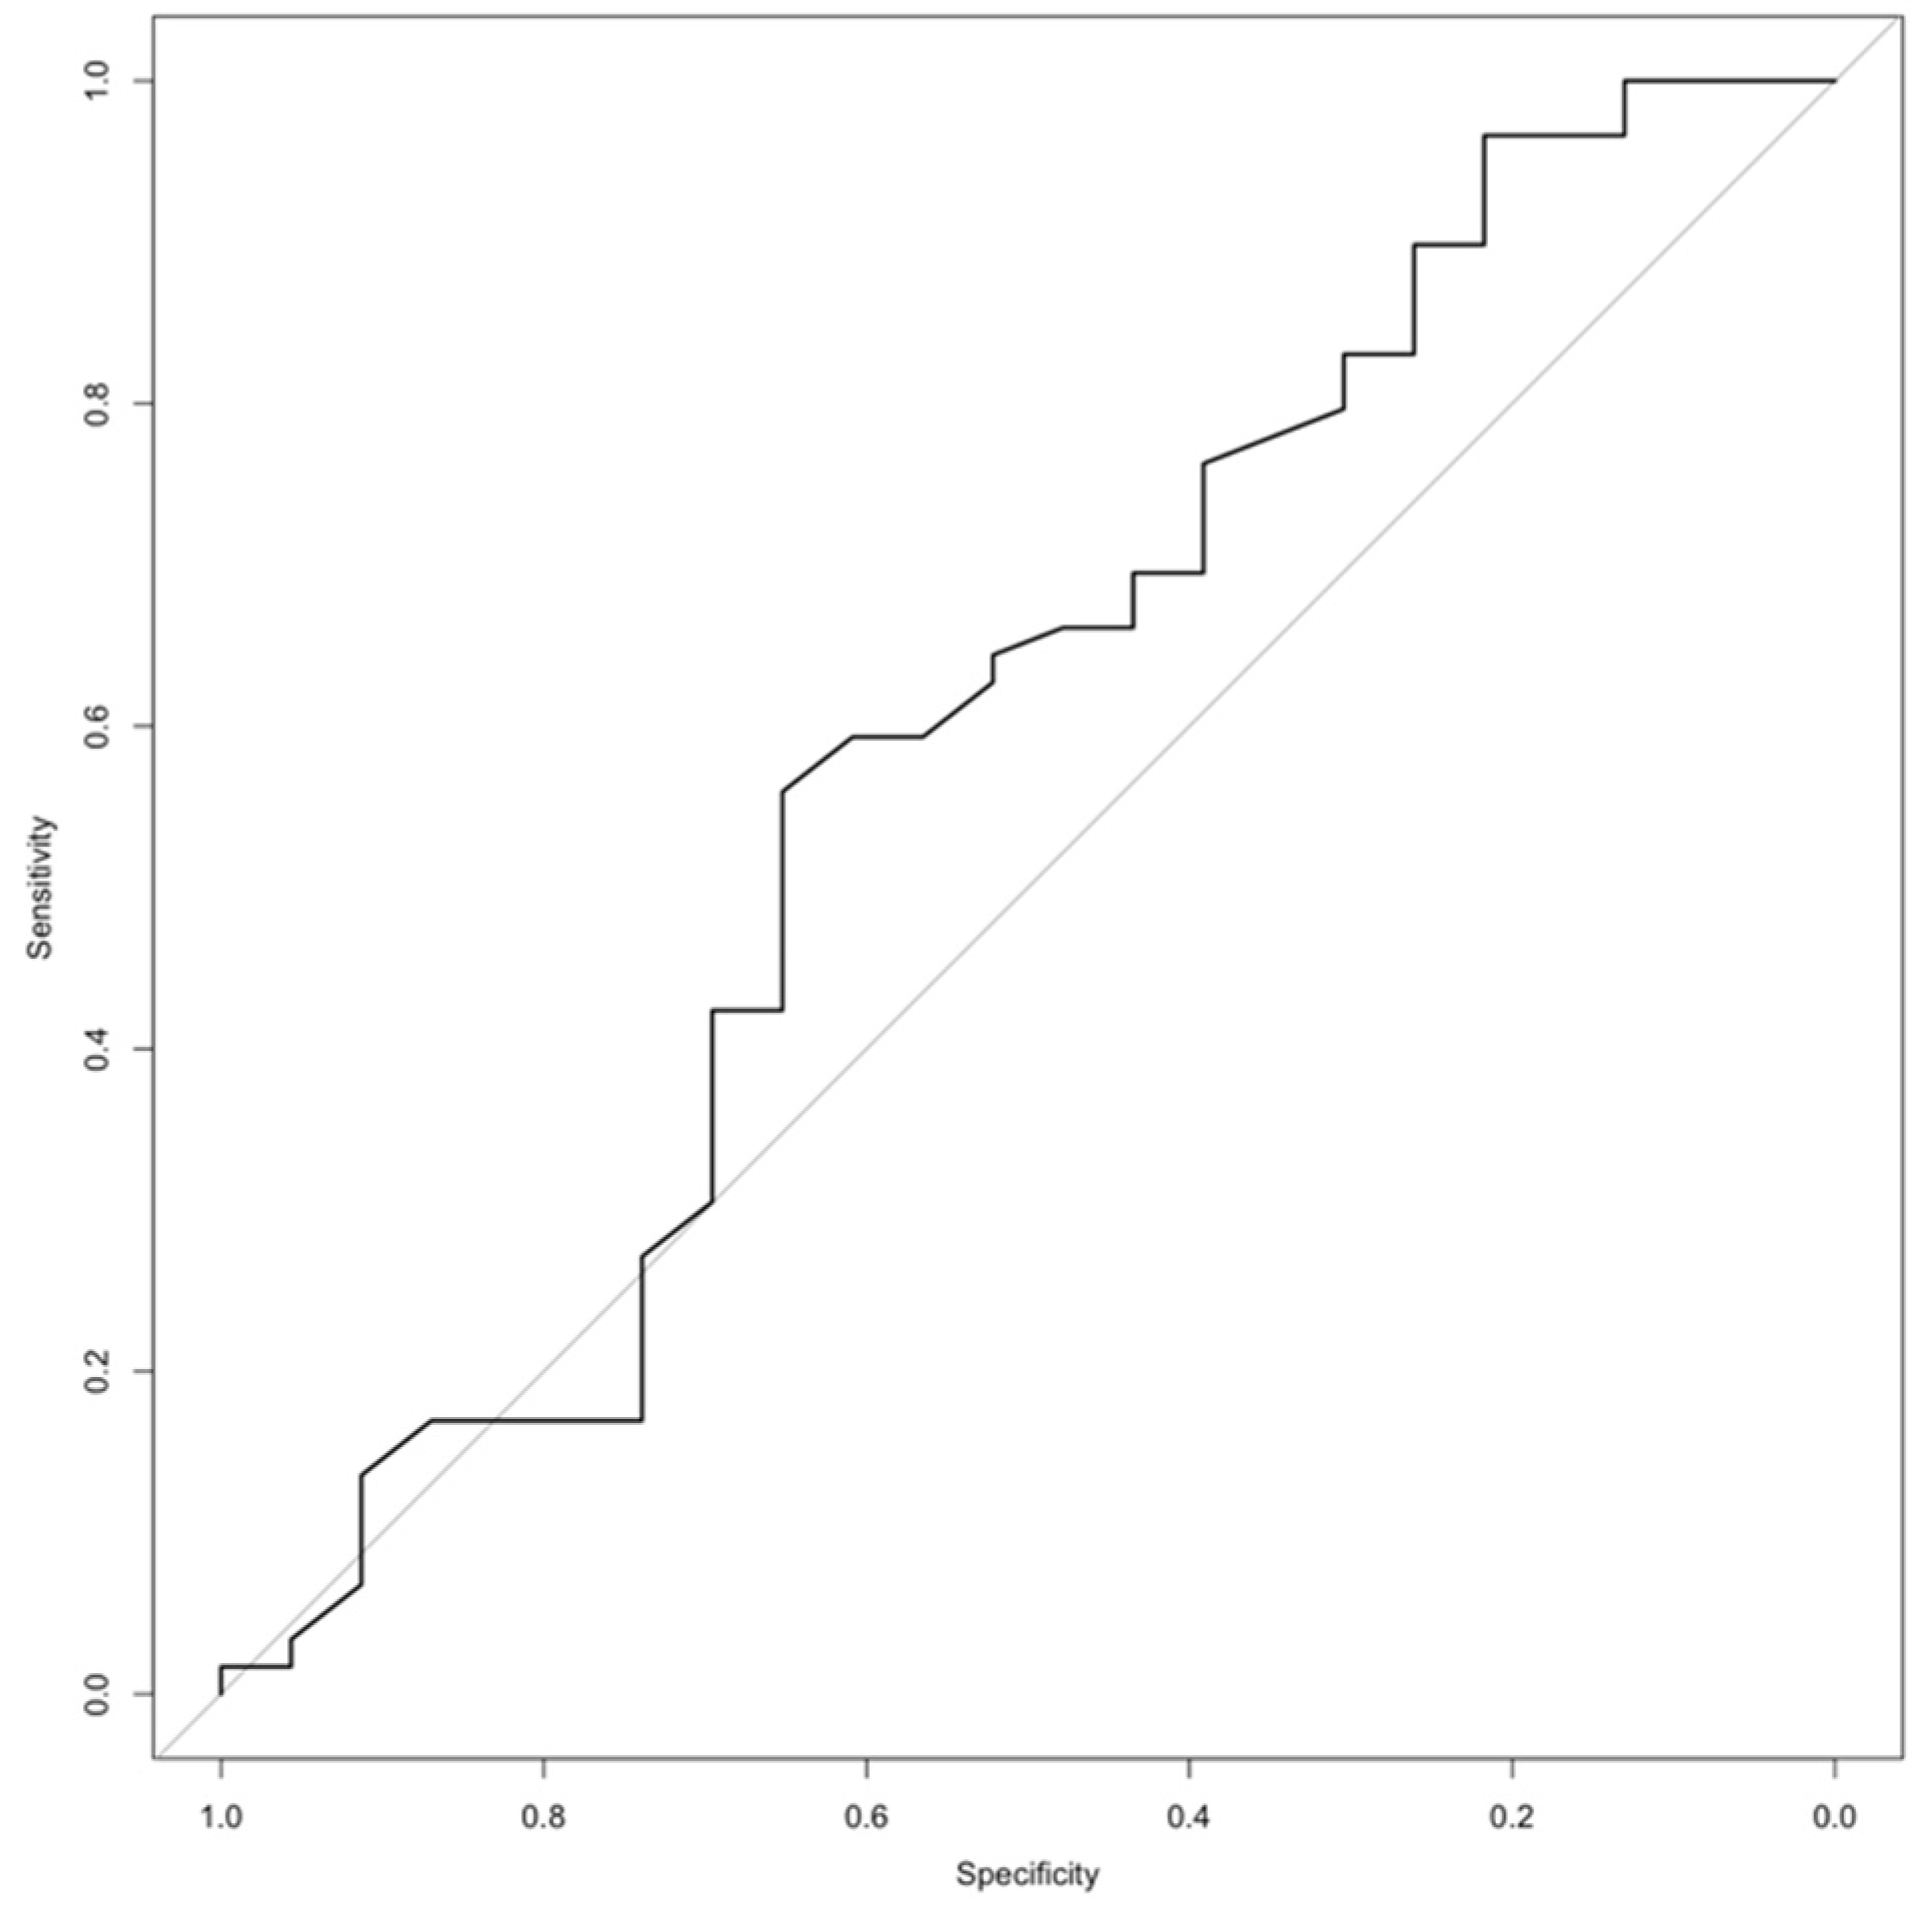
2.4. Statistical Analysis
3. Results
3.1. Patient Characteristics
3.2. CT and MR Image Quality
3.3. Tumor Localization and Size
3.4. CT and MR Imaging Criteria
4. Discussion
Supplementary Materials
Author Contributions
Funding
Institutional Review Board Statement
Informed Consent Statement
Data Availability Statement
Conflicts of Interest
Abbreviations
| ACT | Atypical cartilaginous tumor |
| AUC | Area under the curve |
| CI | Confidence interval |
| CT | Computed tomography |
| FS | Fat saturation |
| GD | Gadolinium |
| IM | Intermediate-weighted |
| MR | Magnetic resonance |
| NPV | Negative predictive value |
| OR | Odds ratio |
| PACS | Picture archiving and communication system |
| PPV | Positive predictive value |
| ROC | Receiver operating characteristic |
| STIR | Short tau inversion recovery |
| TSE | Turbo spin echo |
References
- Thorkildsen, J.; Taksdal, I.; Bjerkehagen, B.; Haugland, H.K.; Børge Johannesen, T.; Viset, T.; Norum, O.J.; Bruland, Ø.; Zaikova, O. Chondrosarcoma in Norway 1990–2013; an epidemiological and prognostic observational study of a complete national cohort. Acta Oncol. 2019, 58, 273–282. [Google Scholar] [CrossRef] [PubMed]
- Van Praag Veroniek, V.M.; Rueten-Budde, A.J.; Ho, V.; Dijkstra, P.D.S.; Fiocco, M.; van de Sande, M.A.J. Incidence, outcomes and prognostic factors during 25 years of treatment of chondrosarcomas. Surg. Oncol. 2018, 27, 402–408. [Google Scholar] [CrossRef] [PubMed]
- WHO Classification of Tumours Editorial Board (Ed.) World Health Organization Classification of Soft Tissue and Bone Tumours, 5th ed.; IARC Press: Lyon, France, 2020. [Google Scholar]
- Deckers, C.; Steyvers, M.J.; Hannink, G.; Schreuder, H.W.B.; de Rooy, J.W.J.; Van Der Geest, I.C.M. Can MRI differentiate between atypical cartilaginous tumors and high-grade chondrosarcoma? A systematic review. Acta Orthop. 2020, 91, 471–478. [Google Scholar] [CrossRef] [PubMed]
- Jo, V.Y.; Fletcher, C.D. WHO classification of soft tissue tumours: An update based on the 2013 (4th) edition. Pathology 2014, 46, 95–104. [Google Scholar] [CrossRef]
- Dierselhuis, E.F.; Gerbers, J.G.; Ploegmakers, J.J.; Stevens, M.; Suurmeijer, A.J.; Jutte, P.C. Local Treatment with Adjuvant Therapy for Central Atypical Cartilaginous Tumors in the Long Bones: Analysis of Outcome and Complications in One Hundred and Eight Patients with a Minimum Follow-up of Two Years. J. Bone Jt. Surg. Am. Vol. 2016, 98, 303–313. [Google Scholar] [CrossRef]
- Laitinen, M.K.; Stevenson, J.D.; Parry, M.C.; Sumathi, V.; Grimer, R.J.; Jeys, L.M. The role of grade in local recurrence and the disease-specific survival in chondrosarcomas. Bone Jt. J. 2018, 100, 662–666. [Google Scholar] [CrossRef]
- Lalam, R.; Bloem, J.L.; Noebauer-Huhmann, I.M.; Wörtler, K.; Tagliafico, A.; Vanhoenacker, F.; Nikodinovska, V.V.; Sanal, H.T.; Woude, H.V.; Papakonstantinou, O.; et al. ESSR Consensus Document for Detection, Characterization, and Referral Pathway for Tumors and Tumorlike Lesions of Bone. Semin. Musculoskelet. Radiol. 2017, 21, 630–647. [Google Scholar] [CrossRef]
- Deckers, C.; Schreuder, B.H.; Hannink, G.; de Rooy, J.W.; van der Geest, I.C. Radiologic follow-up of untreated enchondroma and atypical cartilaginous tumors in the long bones. J. Surg. Oncol. 2016, 114, 987–991. [Google Scholar] [CrossRef]
- Geirnaerdt, M.J.; Hermans, J.; Bloem, J.L.; Kroon, H.M.; Pope, T.L.; Taminiau, A.H.; Hogendoorn, P.C. Usefulness of radiography in differentiating enchondroma from central grade 1 chondrosarcoma. AJR Am. J. Roentgenol. 1997, 169, 1097–1104. [Google Scholar] [CrossRef]
- Choi, B.B.; Jee, W.H.; Sunwoo, H.J.; Cho, J.H.; Kim, J.Y.; Chun, K.A.; Hong, S.J.; Chung, H.W.; Sung, M.S.; Lee, Y.S.; et al. MR differentiation of low-grade chondrosarcoma from enchondroma. Clin. Imaging 2013, 37, 542–547. [Google Scholar] [CrossRef]
- Kendell, S.D.; Collins, M.S.; Adkins, M.C.; Sundaram, M.; Unni, K.K. Radiographic differentiation of enchondroma from low-grade chondrosarcoma in the fibula. Skelet. Radiol. 2004, 33, 458–466. [Google Scholar] [CrossRef] [PubMed]
- Nascimento, D.; Suchard, G.; Hatem, M.; de Abreu, A. The role of magnetic resonance imaging in the evaluation of bone tumours and tumour-like lesions. Insights Imaging 2014, 5, 419–440. [Google Scholar] [CrossRef] [PubMed]
- Higuchi, T.; Taki, J.; Sumiya, H.; Kinuya, S.; Nakajima, K.; Namura, M.; Tonami, N. Characterization of cartilaginous tumors with 201Tl scintigraphy. Ann. Nucl. Med. 2005, 19, 95–99. [Google Scholar] [CrossRef]
- Kaya, G.C.; Demir, Y.; Ozkal, S.; Sengoz, T.; Manisali, M.; Baran, O.; Koc, M.; Tuna, B.; Ozaksoy, D.; Havitcioglu, H. Tumor grade-related thallium-201 uptake in chondrosarcomas. Ann. Nucl. Med. 2010, 24, 279–286. [Google Scholar] [CrossRef] [PubMed]
- Deckers, C.; de Leijer, E.M.; Flucke, U.; de Rooy, J.W.J.; Schreuder, H.W.B.; Dierselhuis, E.F.; van der Geest, I.C.M. Curettage and cryosurgery for enchondroma and atypical cartilaginous tumors of the long bones: Oncological results of a large series. J. Surg. Oncol. 2021, 123, 1821–1827. [Google Scholar] [CrossRef] [PubMed]
- Crim, J.; Schmidt, R.; Layfield, L.; Hanrahan, C.; Manaster, B.J. Can imaging criteria distinguish enchondroma from grade 1 chondrosarcoma? Eur. J. Radiol. 2015, 84, 2222–2230. [Google Scholar] [CrossRef]
- Douis, H.; Parry, M.; Vaiyapuri, S.; Davies, A.M. What are the differentiating clinical and MRI-features of enchondromas from low-grade chondrosarcomas? Eur. Radiol. 2018, 28, 398–409. [Google Scholar] [CrossRef]
- Lee, S.; Yoon, M.A. Assessment of central cartilaginous tumor of the appendicular bone: Inter-observer and intermodality agreement and comparison of diagnostic performance of CT and MRI. Acta Radiol. 2022, 63, 376–386. [Google Scholar] [CrossRef]
- Vanel, D.; Kreshak, J.; Larousserie, F.; Alberghini, M.; Mirra, J.; De Paolis, M.; Picci, P. Enchondroma vs. chondrosarcoma: A simple, easy-to-use, new magnetic resonance sign. Eur. J. Radiol. 2013, 82, 2154–2160. [Google Scholar] [CrossRef]
- Murphey, M.D.; Flemming, D.J.; Boyea, S.R.; Bojescul, J.A.; Sweet, D.E.; Temple, H.T. Enchondroma versus chondrosarcoma in the appendicular skeleton: Differentiating features. Radiographics 1998, 18, 1213–1237, quiz 1244–1215. [Google Scholar] [CrossRef] [Green Version]
- Flemming, D.J.; Murphey, M.D. Enchondroma and chondrosarcoma. Semin. Musculoskelet. Radiol. 2000, 4, 59–71. [Google Scholar] [CrossRef] [PubMed]
- Errani, C.; Tsukamoto, S.; Ciani, G.; Akahane, M.; Cevolani, L.; Tanzi, P.; Kido, A.; Honoki, K.; Tanaka, Y.; Donati, D.M. Risk factors for local recurrence from atypical cartilaginous tumour and enchondroma of the long bones. Eur. J. Orthop. Surg. Traumatol. 2017, 27, 805–811. [Google Scholar] [CrossRef] [PubMed]
- Delling, G.; Jobke, B.; Burisch, S.; Werner, M. Cartilage tumors. Classification, conditions for biopsy and histologic characteristics. Orthopade 2005, 34, 1267–1281, quiz 1281–1262. [Google Scholar] [CrossRef] [PubMed]
- Engel, H.; Herget, G.W.; Füllgraf, H.; Sutter, R.; Benndorf, M.; Bamberg, F.; Jungmann, P.M. Chondrogenic Bone Tumors: The Importance of Imaging Characteristics. In RöFo-Fortschritte auf dem Gebiet der Röntgenstrahlen und der Bildgebenden Verfahren; Georg Thieme Verlag KG: New York, NY, USA, 2020. [Google Scholar] [CrossRef]
- Manaster, B.J.; Dalinka, M.K.; Alazraki, N.; Berquist, T.H.; Daffner, R.H.; DeSmet, A.A.; el-Khoury, G.Y.; Goergen, T.G.; Keats, T.E.; Newberg, A.; et al. Follow-up examinations for bone tumors, soft tissue tumors, and suspected metastasis post therapy. American College of Radiology. ACR Appropriateness Criteria. Radiology 2000, 215, 379–387. [Google Scholar]
- Csutak, C.; Ștefan, P.A.; Lenghel, L.M.; Moroșanu, C.O.; Lupean, R.A.; Șimonca, L.; Mihu, C.M.; Lebovici, A. Differentiating High-Grade Gliomas from Brain Metastases at Magnetic Resonance: The Role of Texture Analysis of the Peritumoral Zone. Brain Sci. 2020, 10, 638. [Google Scholar] [CrossRef]
- Lisson, C.S.; Lisson, C.G.; Flosdorf, K.; Mayer-Steinacker, R.; Schultheiss, M.; von Baer, A.; Barth, T.F.E.; Beer, A.J.; Baumhauer, M.; Meier, R.; et al. Diagnostic value of MRI-based 3D texture analysis for tissue characterisation and discrimination of low-grade chondrosarcoma from enchondroma: A pilot study. Eur. Radiol. 2018, 28, 468–477. [Google Scholar] [CrossRef]
- Fritz, B.; Müller, D.A.; Sutter, R.; Wurnig, M.C.; Wagner, M.W.; Pfirrmann, C.W.A.; Fischer, M.A. Magnetic Resonance Imaging-Based Grading of Cartilaginous Bone Tumors: Added Value of Quantitative Texture Analysis. Investig. Radiol. 2018, 53, 663–672. [Google Scholar] [CrossRef] [Green Version]


| Variable | ACT | Ench. | Odds Ratio (95% CI) | p-Value | Sensitivity | Specificity | PPV | NPV | |
|---|---|---|---|---|---|---|---|---|---|
| Location in bone | excentric | 6 | 10 | 1.91 (0.56–6.19) | 0.343 | 0.286 | 0.828 | 0.375 | 0.762 |
| central | 15 | 48 | |||||||
| Diameter | >Average | 9 | 17 | 1.58 (0.56–4.38) | 0.432 | 0.391 | 0.712 | 0.346 | 0.75 |
| <Average | 14 | 42 | |||||||
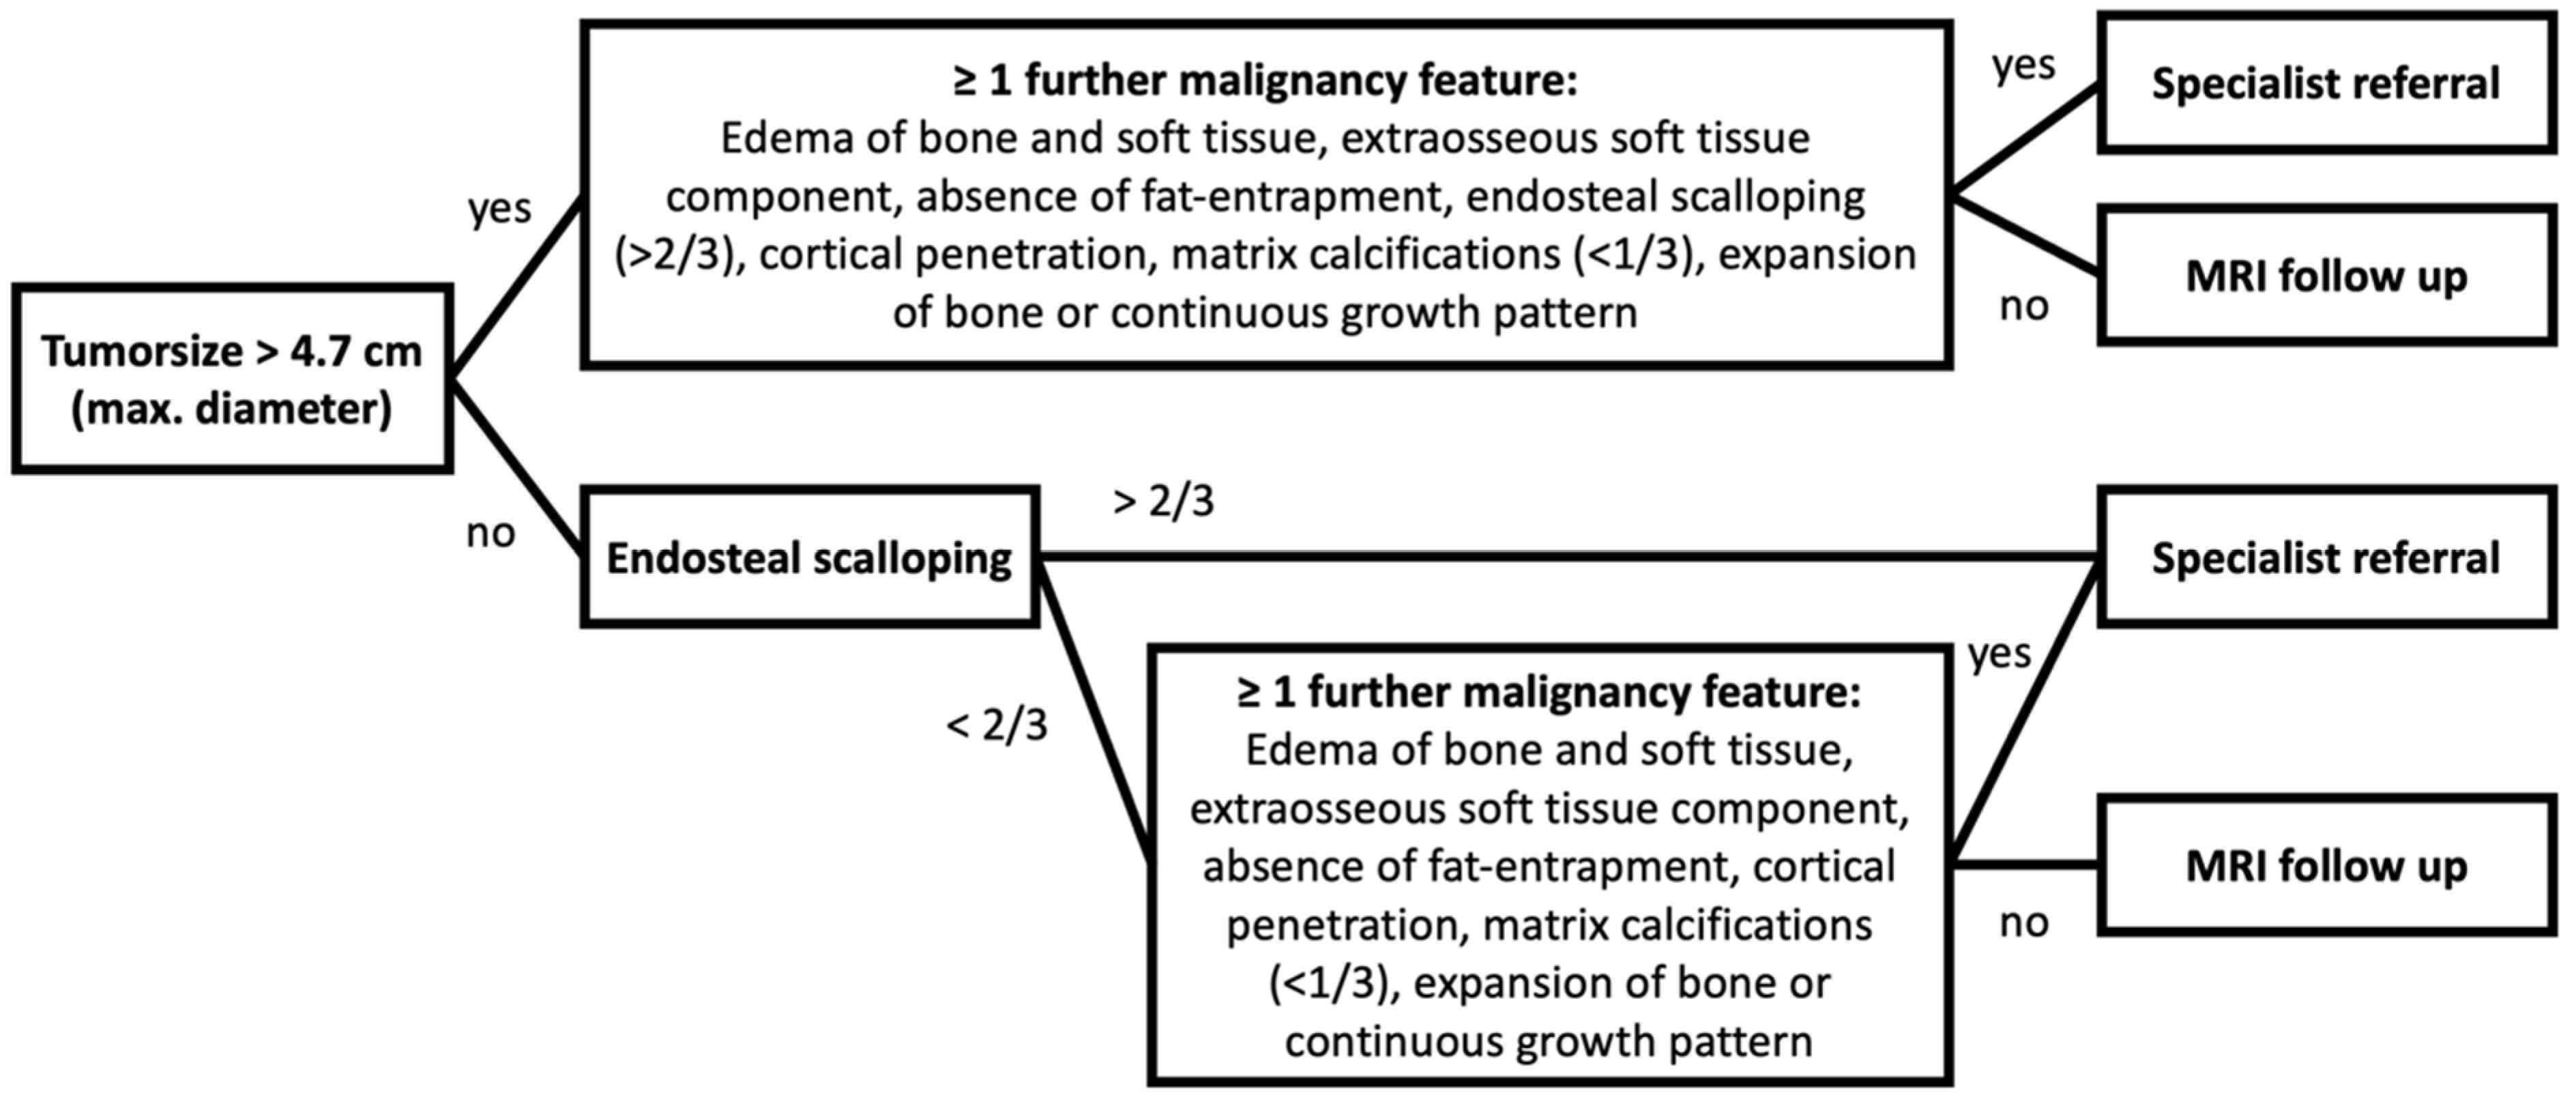
| Diameter (optim) | >4.7 cm | 15 | 26 | 2.34 (0.87–6.71) | 0.139 | 0.652 | 0.559 | 0.366 | 0.805 |
| <4.7 cm | 8 | 33 | |||||||
| Growth pattern | Continuous | 15 | 15 | 6.06 | <0.001 | 0.682 | 0.746 | 0.5 | 0.863 |
| Discontinuous | 7 | 44 | |||||||
| T2 Signal | Homogenous | 6 | 13 | 1.18 (0.34–3.76) | 0.774 | 0.316 | 0.717 | 0.316 | 0.717 |
| Inhomogenous | 13 | 33 | |||||||
| Lobulation | Yes | 23 | 58 | 1.21 (0.05–30.66) | 0.91 | 1 | 0.017 | 0.284 | 1 |
| No | 0 | 1 | |||||||
| Fat-entrapment | Yes | 12 | 47 | 0.29 (0.10–0.83) | 0.027 | 0.522 | 0.203 | 0.203 | 0.522 |
| No | 11 | 12 | |||||||
| Matrix calcifications | No | 1 | 2 | 1.37 (0.04–17.71) | 1 | 0.044 | 0.966 | 0.333 | 0.722 |
| Yes (any) | 22 | 57 | |||||||
| Matrix calcifications | <1/3 | 14 | 17 | 3.75 (1.38–10.77) | 0.011 | 0.609 | 0.712 | 0.452 | 0.824 |
| >1/3 | 9 | 42 | |||||||
| Matrix calcifications | <2/3 | 20 | 54 | 0.61 (0.13–3.41) | 0.68 | 0.870 | 0.085 | 0.27 | 0.625 |
| >2/3 | 3 | 5 | |||||||
| Periosteal reaction | Yes | 8 | 2 | 13.87 (3.01–109.46) | <0.001 | 0.348 | 0.966 | 0.8 | 0.792 |
| No | 15 | 57 | |||||||
| Expansion | Yes | 10 | 11 | 3.29 (1.13–9.73) | 0.027 | 0.435 | 0.814 | 0.476 | 0.787 |
| No | 13 | 48 | |||||||
| Endosteal scalloping | Yes (any) | 22 | 44 | 6.25 (1.19–166.18) | 0.0327 | 0.957 | 0.254 | 0.333 | 0.938 |
| No | 1 | 15 | |||||||
| Endosteal scalloping | >2/3 | 15 | 6 | 15.48 (4.86–56.7) | <0.001 | 0.652 | 0.898 | 0.714 | 0.869 |
| <2/3 | 8 | 53 | |||||||
| Endosteal scalloping | Penetration | 6 | 1 | 17.68 (2.66–480.45) | 0.002 | 0.261 | 0.983 | 0.857 | 0.773 |
| No Penetration | 17 | 58 | |||||||
| Extraosseous soft tissue component | Yes | 3 | 0 | 20.32 (1.01–410.31) | 0.0495 | 0.13 | 1 | 1 | 0.747 |
| No | 20 | 59 | |||||||
| Edema bone | Yes | 4 | 0 | 27.46 (1.41–533.26) | 0.029 | 0.174 | 1 | 1 | 0.756 |
| No | 19 | 59 | |||||||
| Edema soft tissue | Yes | 6 | 1 | 17.68 (2.66–480.45) | 0.002 | 0.261 | 0.983 | 0.857 | 0.773 |
| No | 17 | 58 |
Publisher’s Note: MDPI stays neutral with regard to jurisdictional claims in published maps and institutional affiliations. |
© 2022 by the authors. Licensee MDPI, Basel, Switzerland. This article is an open access article distributed under the terms and conditions of the Creative Commons Attribution (CC BY) license (https://creativecommons.org/licenses/by/4.0/).
Share and Cite
Gassert, F.G.; Breden, S.; Neumann, J.; Gassert, F.T.; Bollwein, C.; Knebel, C.; Lenze, U.; von Eisenhart-Rothe, R.; Mogler, C.; Makowski, M.R.; et al. Differentiating Enchondromas and Atypical Cartilaginous Tumors in Long Bones with Computed Tomography and Magnetic Resonance Imaging. Diagnostics 2022, 12, 2186. https://doi.org/10.3390/diagnostics12092186
Gassert FG, Breden S, Neumann J, Gassert FT, Bollwein C, Knebel C, Lenze U, von Eisenhart-Rothe R, Mogler C, Makowski MR, et al. Differentiating Enchondromas and Atypical Cartilaginous Tumors in Long Bones with Computed Tomography and Magnetic Resonance Imaging. Diagnostics. 2022; 12(9):2186. https://doi.org/10.3390/diagnostics12092186
Chicago/Turabian StyleGassert, Felix G., Sebastian Breden, Jan Neumann, Florian T. Gassert, Christine Bollwein, Carolin Knebel, Ulrich Lenze, Rüdiger von Eisenhart-Rothe, Carolin Mogler, Marcus R. Makowski, and et al. 2022. "Differentiating Enchondromas and Atypical Cartilaginous Tumors in Long Bones with Computed Tomography and Magnetic Resonance Imaging" Diagnostics 12, no. 9: 2186. https://doi.org/10.3390/diagnostics12092186