
Area-Detector Computed Tomography for Pulmonary Functional Imaging

 , , and
Abstract
:1. Introduction
2. New Reconstruction Methods Used for Radiation Dose Reduction for Functional ADCT
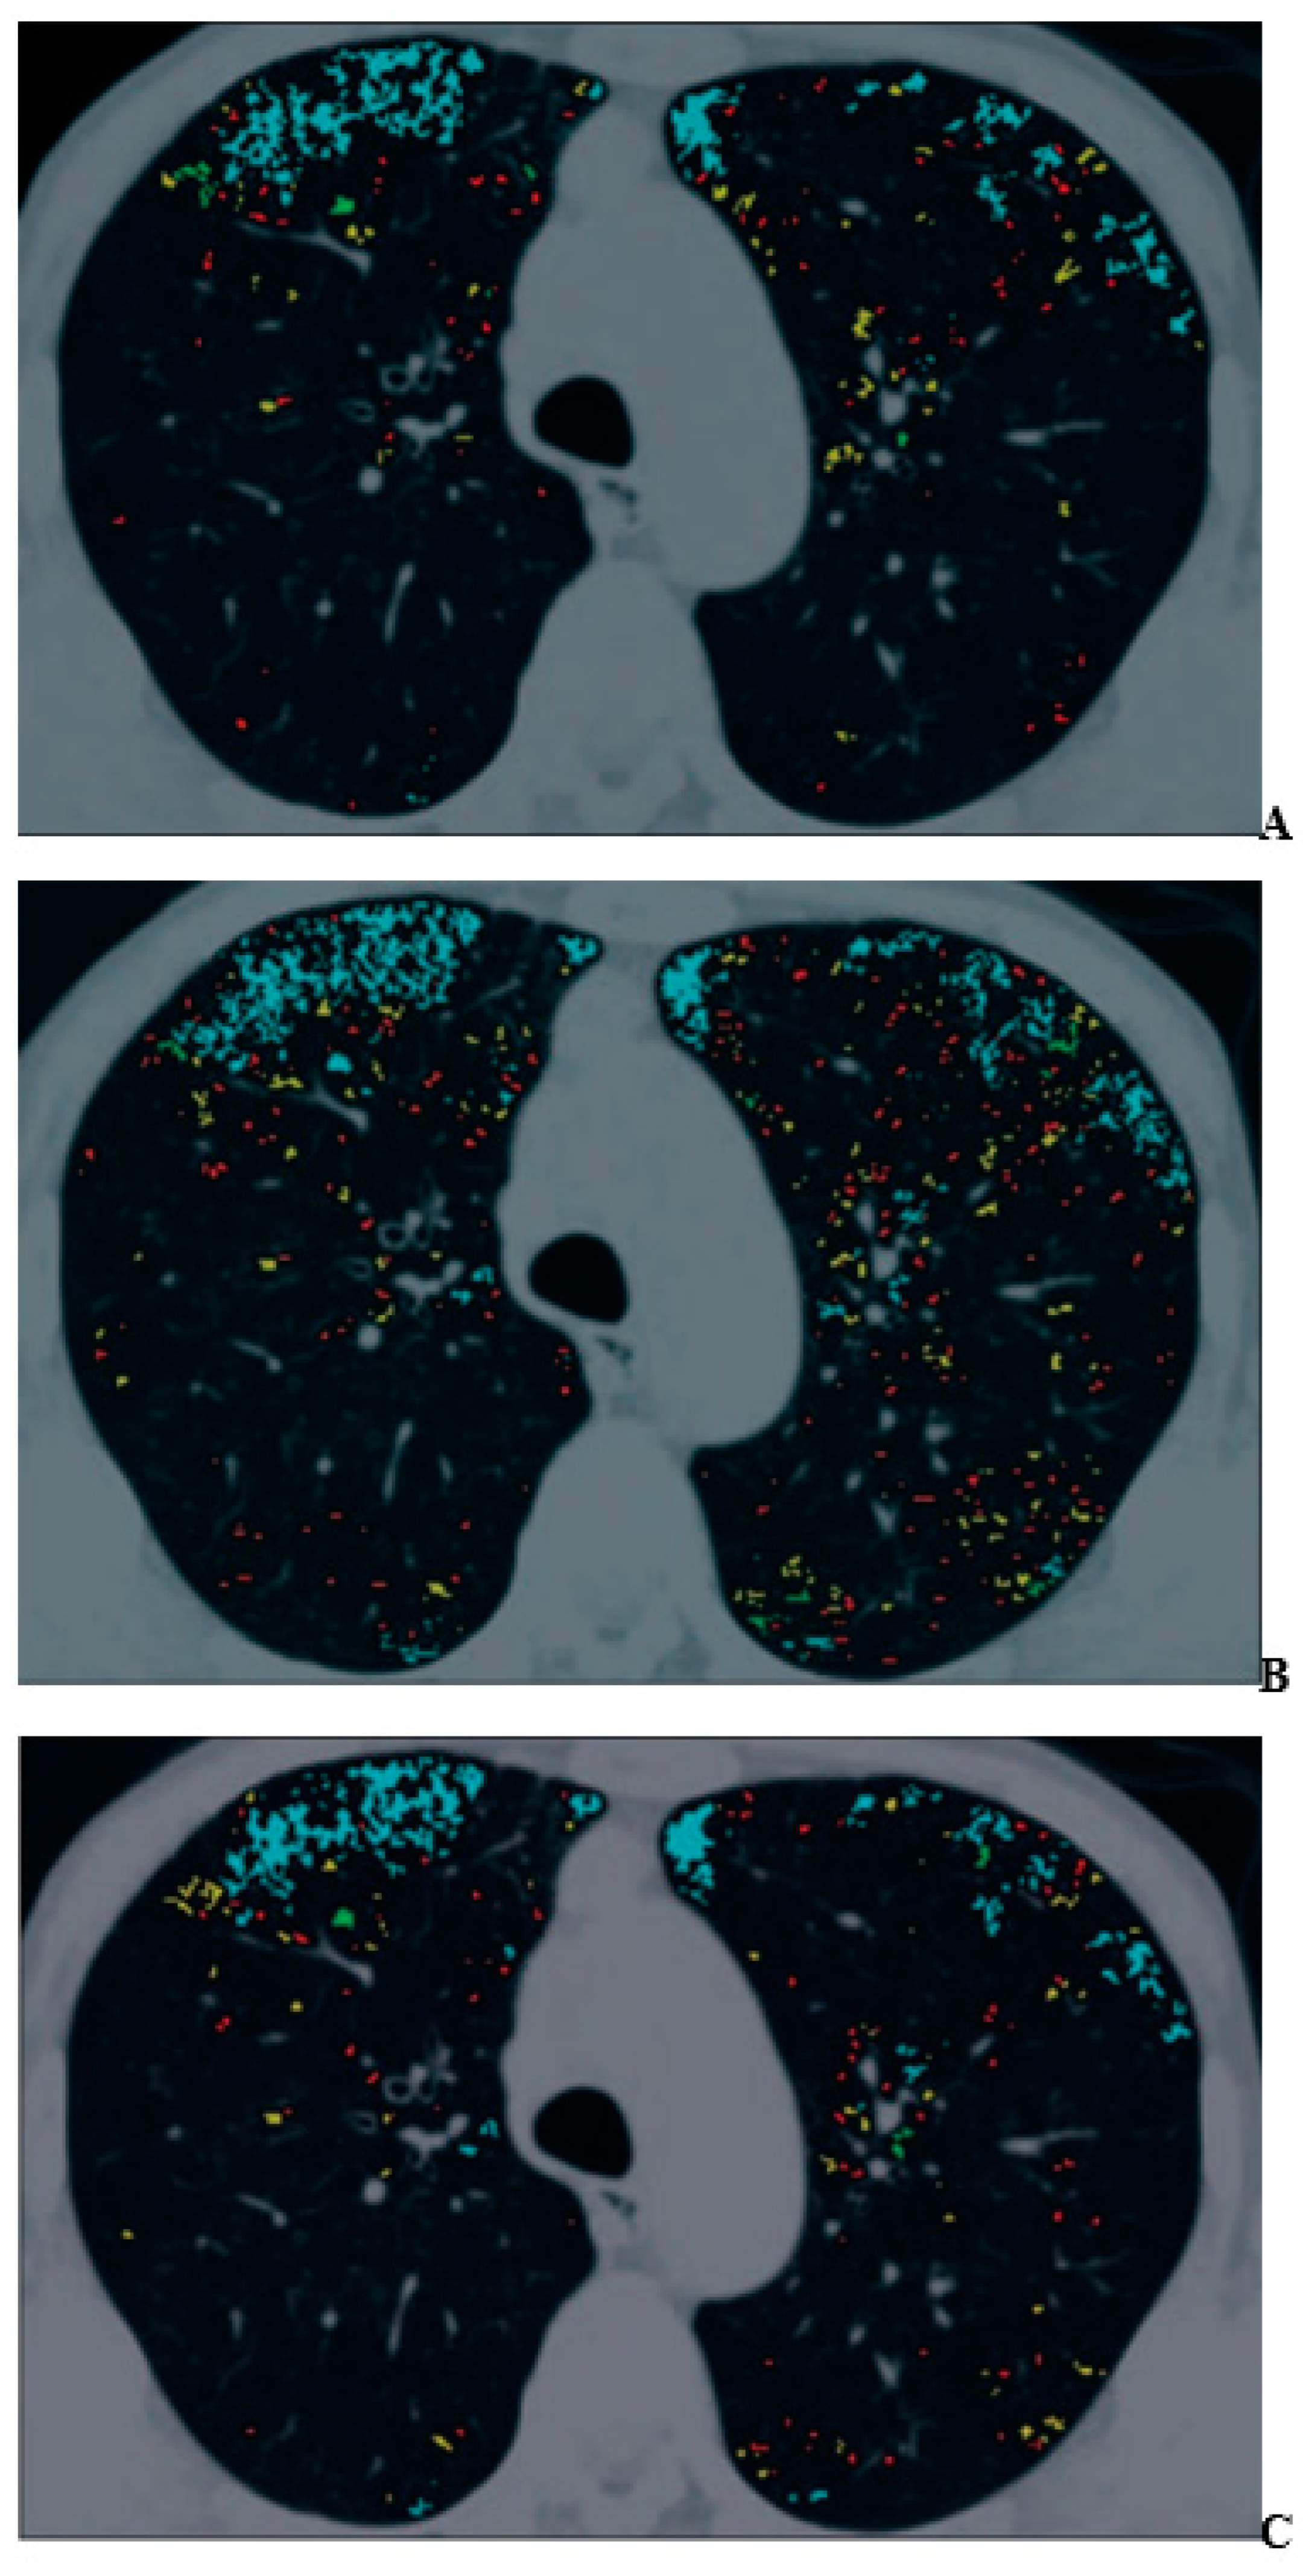
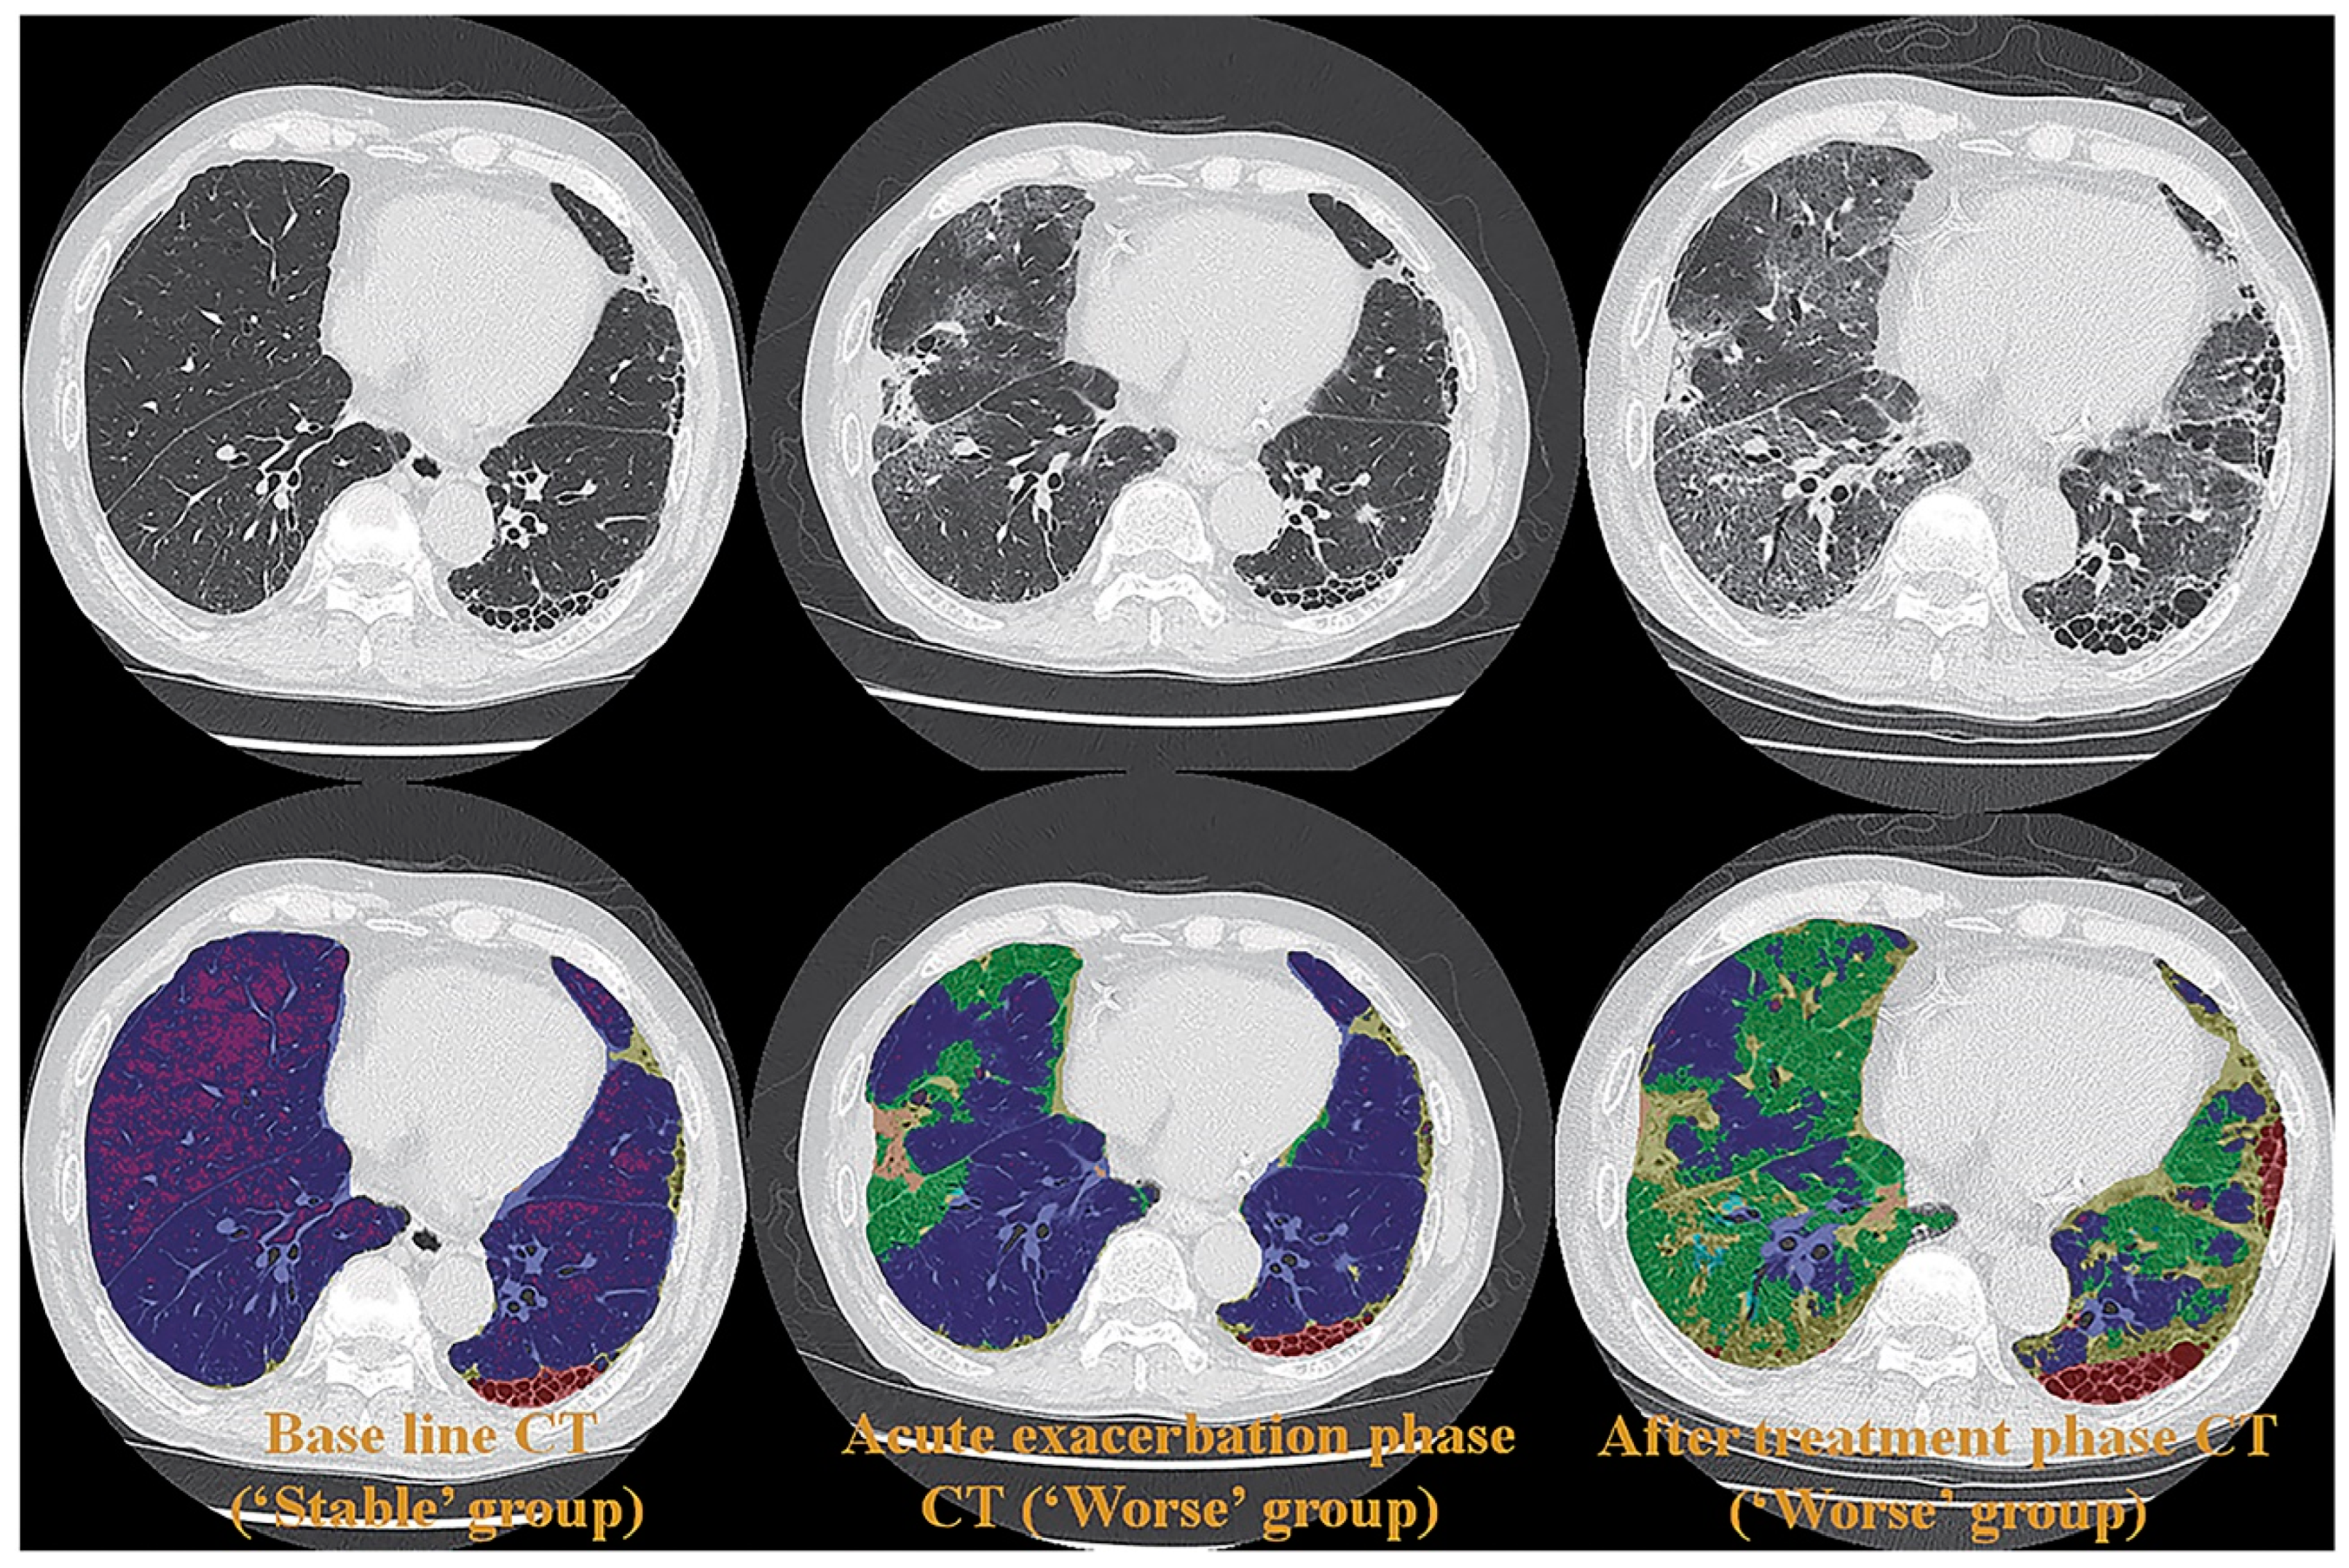
3. Morphology-Based Pulmonary Functional Imaging
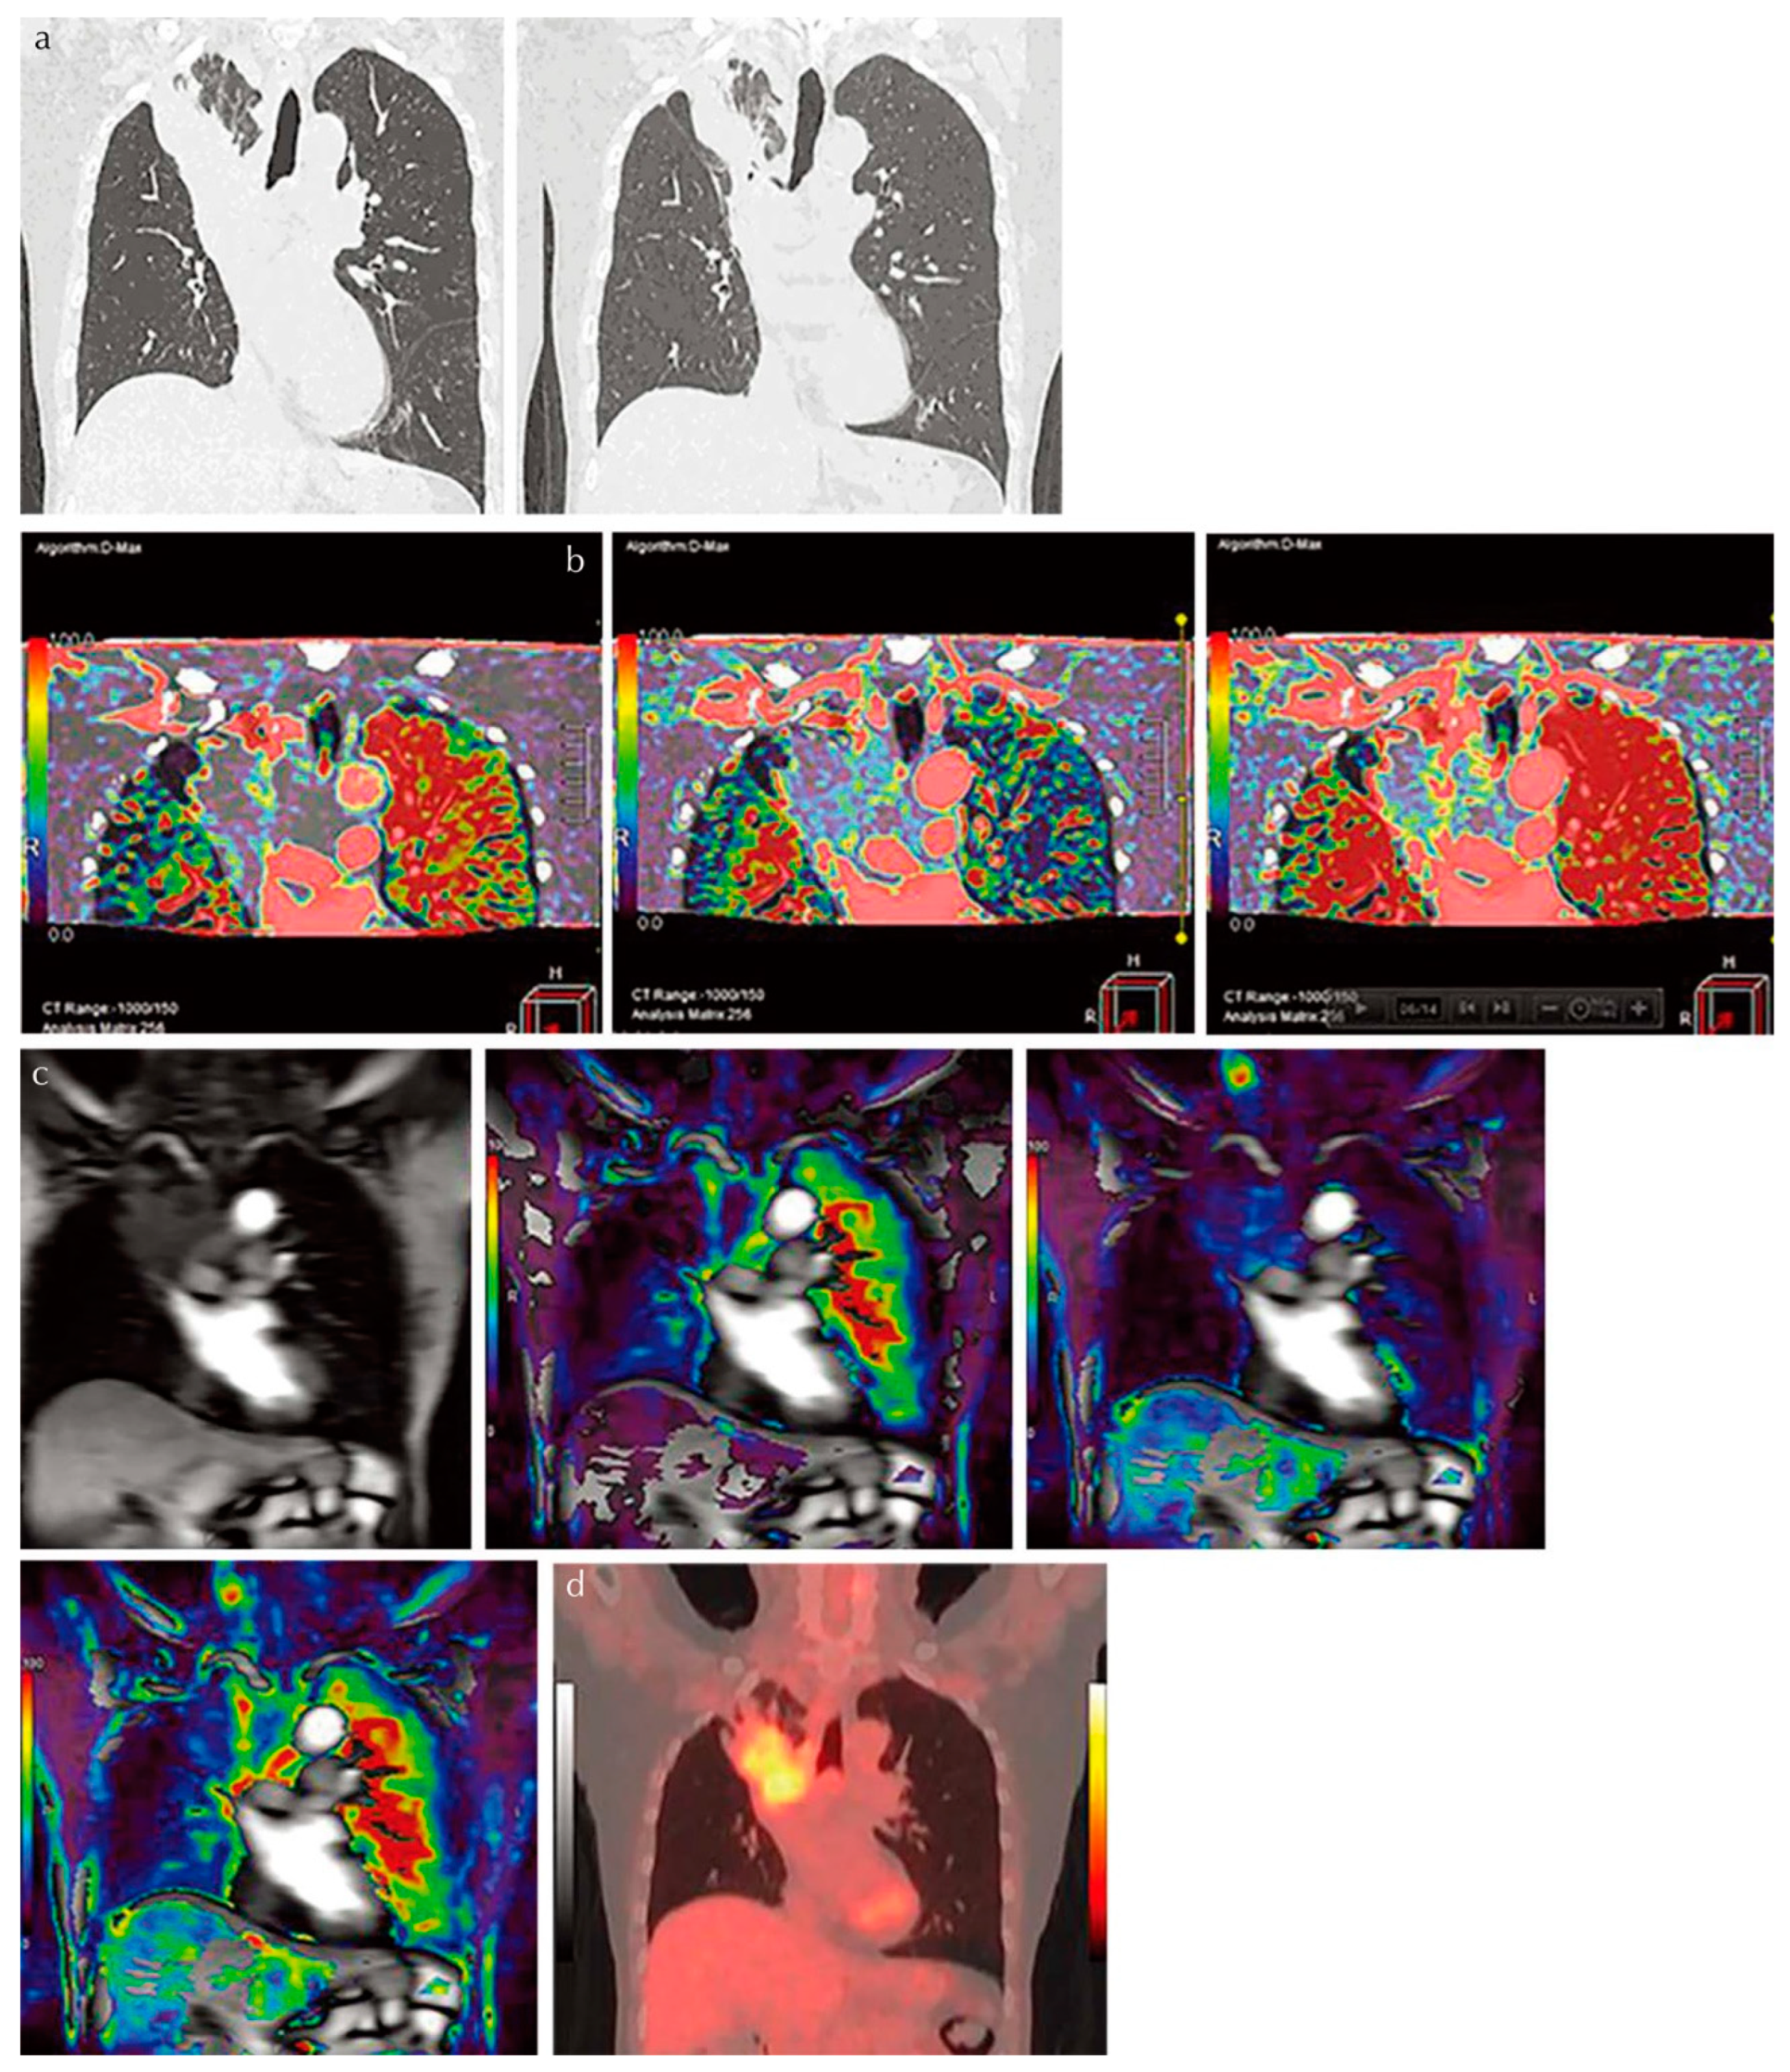
4. Pulmonary Perfusion Evaluation
4.1. Dual-Energy CT with ADCT System
4.2. Subtraction ADCT
4.3. Dynamic First-Pass CE-Perfusion ADCT
4.4. Ventilation Assessment
4.5. Biomechanical Evaluation
5. Conclusions
Funding
Institutional Review Board Statement
Informed Consent Statement
Data Availability Statement
Conflicts of Interest
References
- Hu, H. Multi-slice helical CT: Scan and reconstruction. Med. Phys. 1999, 26, 5–18. [Google Scholar] [CrossRef] [PubMed]
- Funabashi, N.; Yoshida, K.; Tadokoro, H.; Nakagawa, K.; Komiyama, N.; Odaka, K.; Tsunoo, T.; Mori, S.; Tanada, S.; Endo, M.; et al. Cardiovascular Circulation and Hepatic Perfusion of Pigs in 4-Dimensional Films Evaluated by 256-Slice Cone-Beam Computed Tomography. Circ. J. 2005, 69, 585–589. [Google Scholar] [CrossRef] [PubMed] [Green Version]
- Kandel, S.; Kloeters, C.; Meyer, H.; Hein, P.; Hilbig, A.; Rogalla, P. Whole-organ perfusion of the pancreas using dynamic volume CT in patients with primary pancreas carcinoma: Acquisition technique, post-processing and initial results. Eur. Radiol. 2009, 19, 2641–2646. [Google Scholar] [CrossRef]
- Kanda, T.; Yoshikawa, T.; Ohno, Y.; Kanata, N.; Koyama, H.; Nogami, M.; Takenaka, D.; Sugimura, K. Hepatic computed tomography perfusion: Comparison of maximum slope and dual-input single-compartment methods. Jpn. J. Radiol. 2010, 28, 714–719. [Google Scholar] [CrossRef]
- Ohno, Y.; Koyama, H.; Matsumoto, K.; Onishi, Y.; Takenaka, D.; Fujisawa, Y.; Yoshikawa, T.; Konishi, M.; Maniwa, Y.; Nishimura, Y.; et al. Differentiation of Malignant and Benign Pulmonary Nodules with Quantitative First-Pass 320–Detector Row Perfusion CT versus FDG PET/CT. Radiology 2011, 258, 599–609. [Google Scholar] [CrossRef]
- Vavere, A.L.; Simon, G.G.; George, R.T.; Rochitte, C.E.; Arai, A.; Miller, J.M.; Di Carli, M.; Arbab-Zadeh, A.; Dewey, M.; Niinuma, H.; et al. Diagnostic performance of combined noninvasive coronary angiography and myocardial perfusion imaging using 320 row detector computed tomography: Design and implementation of the CORE320 multicenter, multinational diagnostic study. J. Cardiovasc. Comput. Tomogr. 2011, 5, 370–381. [Google Scholar] [CrossRef]
- Kanda, T.; Yoshikawa, T.; Ohno, Y.; Kanata, N.; Koyama, H.; Takenaka, D.; Sugimura, K. CT hepatic perfusion measurement: Comparison of three analytic methods. Eur. J. Radiol. 2012, 81, 2075–2079. [Google Scholar] [CrossRef]
- Kanda, T.; Yoshikawa, T.; Ohno, Y.; Fujisawa, Y.; Kanata, N.; Yamaguchi, M.; Seo, Y.; Yano, Y.; Koyama, H.; Kitajima, K.; et al. Perfusion measurement of the whole upper abdomen of patients with and without liver diseases: Initial experience with 320-detector row CT. Eur. J. Radiol. 2012, 81, 2470–2475. [Google Scholar] [CrossRef]
- Negi, N.; Yoshikawa, T.; Ohno, Y.; Somiya, Y.; Sekitani, T.; Sugihara, N.; Koyama, H.; Kanda, T.; Kanata, N.; Murakami, T.; et al. Hepatic CT perfusion measurements: A feasibility study for radiation dose reduction using new image reconstruction method. Eur. J. Radiol. 2012, 81, 3048–3054. [Google Scholar] [CrossRef]
- Cerci, R.J.; Arbab-Zadeh, A.; George, R.T.; Miller, J.M.; Vavere, A.L.; Mehra, V.; Yoneyama, K.; Texter, J.; Foster, C.; Guo, W.; et al. Aligning Coronary Anatomy and Myocardial Perfusion Territories: An algorithm for the CORE320 multicenter study. Circ. Cardiovasc. Imaging 2012, 5, 587–595. [Google Scholar] [CrossRef] [Green Version]
- Nasis, A.; Ko, B.S.; Leung, M.C.; Antonis, P.R.; Nandurkar, D.; Wong, D.T.; Kyi, L.; Cameron, J.D.; Troupis, J.M.; Meredith, I.T.; et al. Diagnostic accuracy of combined coronary angiography and adenosine stress myocardial perfusion imaging using 320-detector computed tomography: Pilot study. Eur. Radiol. 2013, 23, 1812–1821. [Google Scholar] [CrossRef] [PubMed]
- Ohno, Y.; Nishio, M.; Koyama, H.; Fujisawa, Y.; Yoshikawa, T.; Matsumoto, S.; Sugimura, K. Comparison of Quantitatively Analyzed Dynamic Area-Detector CT Using Various Mathematic Methods With FDG PET/CT in Management of Solitary Pulmonary Nodules. AJR Am. J. Roentgenol. 2013, 200, W593–W602. [Google Scholar] [CrossRef]
- Rochitte, C.E.; George, R.T.; Chen, M.Y.; Arbab-Zadeh, A.; Dewey, M.; Miller, J.M.; Niinuma, H.; Yoshioka, K.; Kitagawa, K.; Nakamori, S.; et al. Computed tomography angiography and perfusion to assess coronary artery stenosis causing perfusion defects by single photon emission computed tomography: The CORE320 study. Eur. Hear. J. 2013, 35, 1120–1130. [Google Scholar] [CrossRef] [Green Version]
- Ohno, Y.; Nishio, M.; Koyama, H.; Miura, S.; Yoshikawa, T.; Matsumoto, S.; Sugimura, K. Dynamic Contrast-Enhanced CT and MRI for Pulmonary Nodule Assessment. Am. J. Roentgenol. 2014, 202, 515–529. [Google Scholar] [CrossRef] [PubMed]
- Ohno, Y.; Nishio, M.; Koyama, H.; Seki, S.; Tsubakimoto, M.; Fujisawa, Y.; Yoshikawa, T.; Matsumoto, S.; Sugimura, K. Solitary Pulmonary Nodules: Comparison of Dynamic First-Pass Contrast-enhanced Perfusion Area-Detector CT, Dynamic First-Pass Contrast-enhanced MR Imaging, and FDG PET/CT. Radiology 2015, 274, 563–575. [Google Scholar] [CrossRef] [PubMed]
- Ohno, Y.; Koyama, H.; Fujisawa, Y.; Yoshikawa, T.; Inokawa, H.; Sugihara, N.; Seki, S.; Sugimura, K. Hybrid Type iterative reconstruction method vs. filter back projection method: Capability for radiation dose reduction and perfusion assessment on dynamic first-pass contrast-enhanced perfusion chest area-detector CT. Eur. J. Radiol. 2016, 85, 164–175. [Google Scholar] [CrossRef] [Green Version]
- Ohno, Y.; Koyama, H.; Fujisawa, Y.; Yoshikawa, T.; Seki, S.; Sugihara, N.; Sugimura, K. Dynamic contrast-enhanced perfusion area detector CT for non-small cell lung cancer patients: Influence of mathematical models on early prediction capabilities for treatment response and recurrence after chemoradiotherapy. Eur. J. Radiol. 2016, 85, 176–186. [Google Scholar] [CrossRef] [PubMed] [Green Version]
- Ohno, Y.; Koyama, H.; Lee, H.Y.; Miura, S.; Yoshikawa, T.; Sugimura, K. Contrast-enhanced CT- and MRI-based perfusion assessment for pulmonary diseases: Basics and clinical applications. Diagn. Interv. Radiol. 2016, 22, 407–421. [Google Scholar] [CrossRef] [Green Version]
- Ohno, Y.; Fujisawa, Y.; Koyama, H.; Kishida, Y.; Seki, S.; Sugihara, N.; Yoshikawa, T. Dynamic contrast-enhanced perfusion area-detector CT assessed with various mathematical models: Its capability for therapeutic outcome prediction for non-small cell lung cancer patients with chemoradiotherapy as compared with that of FDG-PET/CT. Eur. J. Radiol. 2017, 86, 83–91. [Google Scholar] [CrossRef] [PubMed] [Green Version]
- Ohno, Y.; Fujisawa, Y.; Sugihara, N.; Kishida, Y.; Seki, S.; Koyama, H.; Yoshikawa, T. Dynamic Contrast-Enhanced Perfusion Area-Detector CT: Preliminary Comparison of Diagnostic Performance for N Stage Assessment With FDG PET/CT in Non–Small Cell Lung Cancer. AJR Am. J. Roentgenol. 2017, 209, W253–W262. [Google Scholar] [CrossRef]
- Ohno, Y.; Fujisawa, Y.; Yui, M.; Takenaka, D.; Koyama, H.; Sugihara, N.; Yoshikawa, T. Solitary pulmonary nodule: Comparison of quantitative capability for differentiation and management among dynamic CE-perfusion MRI at 3 T system, dynamic CE-perfusion ADCT and FDG-PET/CT. Eur. J. Radiol. 2019, 115, 22–30. [Google Scholar] [CrossRef]
- Seki, S.; Fujisawa, Y.; Yui, M.; Kishida, Y.; Koyama, H.; Ohyu, S.; Sugihara, N.; Yoshikawa, T.; Ohno, Y. Dynamic Contrast-enhanced Area-detector CT vs Dynamic Contrast-enhanced Perfusion MRI vs FDG-PET/CT: Comparison of Utility for Quantitative Therapeutic Outcome Prediction for NSCLC Patients Undergoing Chemoradiotherapy. Magn. Reson. Med. Sci. 2020, 19, 29–39. [Google Scholar] [CrossRef] [Green Version]
- Murayama, K.; Smit, E.J.; Prokop, M.; Ikeda, Y.; Fujii, K.; Nakahara, I.; Hanamatsu, S.; Katada, K.; Ohno, Y.; Toyama, H. A Bayesian estimation method for cerebral blood flow measurement by area-detector CT perfusion imaging. Neuroradiology 2022, 65, 65–75. [Google Scholar] [CrossRef]
- Kubo, T.; Lin, P.-J.P.; Stiller, W.; Takahashi, M.; Kauczor, H.-U.; Ohno, Y.; Hatabu, H. Radiation Dose Reduction in Chest CT: A Review. AJR Am. J. Roentgenol. 2008, 190, 335–343. [Google Scholar] [CrossRef] [PubMed]
- Kubo, T.; Ohno, Y.; Gautam, S.; Lin, P.-J.P.; Kauczor, H.-U.; Hatabu, H.; iLEAD Study Group. Use of 3D Adaptive Raw-Data Filter in CT of the Lung: Effect on Radiation Dose Reduction. Am. J. Roentgenol. 2008, 191, 1071. [Google Scholar] [CrossRef] [PubMed]
- Matsumoto, K.; Ohno, Y.; Koyama, H.; Kono, A.; Inokawa, H.; Onishi, Y.; Nogami, M.; Takenaka, D.; Araki, T.; Sugimura, K. 3D automatic exposure control for 64-detector row CT: Radiation dose reduction in chest phantom study. Eur. J. Radiol. 2011, 77, 522–527. [Google Scholar] [CrossRef] [PubMed]
- Ohno, Y.; Takenaka, D.; Kanda, T.; Yoshikawa, T.; Matsumoto, S.; Sugihara, N.; Sugimura, K. Adaptive Iterative Dose Reduction Using 3D Processing for Reduced- and Low-Dose Pulmonary CT: Comparison With Standard-Dose CT for Image Noise Reduction and Radiological Findings. AJR Am. J. Roentgenol. 2012, 199, W477–W485. [Google Scholar] [CrossRef]
- Kubo, T.; Ohno, Y.; Kauczor, H.U.; Hatabu, H. Radiation dose reduction in chest CT—Review of available options. Eur. J. Radiol. 2014, 83, 1953–1961. [Google Scholar] [CrossRef] [PubMed]
- Kubo, T.; Ohno, Y.; Seo, J.B.; Yamashiro, T.; Kalender, W.A.; Lee, C.H.; Lynch, D.A.; Kauczor, H.-U.; Hatabu, H. Securing safe and informative thoracic CT examinations—Progress of radiation dose reduction techniques. Eur. J. Radiol. 2017, 86, 313–319. [Google Scholar] [CrossRef]
- Ohno, Y.; Koyama, H.; Seki, S.; Kishida, Y.; Yoshikawa, T. Radiation dose reduction techniques for chest CT: Principles and clinical results. Eur. J. Radiol. 2019, 111, 93–103. [Google Scholar] [CrossRef]
- Ohno, Y.; Yaguchi, A.; Okazaki, T.; Aoyagi, K.; Yamagata, H.; Sugihara, N.; Koyama, H.; Yoshikawa, T.; Sugimura, K. Comparative evaluation of newly developed model-based and commercially available hybrid-type iterative reconstruction methods and filter back projection method in terms of accuracy of computer-aided volumetry (CADv) for low-dose CT protocols in phantom study. Eur. J. Radiol. 2016, 85, 1375–1382. [Google Scholar] [CrossRef] [PubMed]
- Wu, D.; Kim, K.; El Fakhri, G.; Li, Q. Iterative Low-Dose CT Reconstruction With Priors Trained by Artificial Neural Network. IEEE Trans. Med. Imaging 2017, 36, 2479–2486. [Google Scholar] [CrossRef] [PubMed]
- Yang, Q.; Yan, P.; Zhang, Y.; Yu, H.; Shi, Y.; Mou, X.; Kalra, M.K.; Zhang, Y.; Sun, L.; Wang, G. Low-Dose CT Image Denoising Using a Generative Adversarial Network With Wasserstein Distance and Perceptual Loss. IEEE Trans. Med. Imaging 2018, 37, 1348–1357. [Google Scholar] [CrossRef]
- Higaki, T.; Nakamura, Y.; Tatsugami, F.; Nakaura, T.; Awai, K. Improvement of image quality at CT and MRI using deep learning. Jpn. J. Radiol. 2019, 37, 73–80. [Google Scholar] [CrossRef] [PubMed]
- Bao, P.; Sun, H.; Wang, Z.; Zhang, Y.; Xia, W.; Yang, K.; Chen, W.; Chen, M.; Xi, Y.; Niu, S.; et al. Convolutional Sparse Coding for Compressed Sensing CT Reconstruction. IEEE Trans. Med. Imaging 2019, 38, 2607–2619. [Google Scholar] [CrossRef] [PubMed] [Green Version]
- Matsukiyo, R.; Ohno, Y.; Matsuyama, T.; Nagata, H.; Kimata, H.; Ito, Y.; Ogawa, Y.; Murayama, K.; Kato, R.; Toyama, H. Deep learning-based and hybrid-type iterative reconstructions for CT: Comparison of capability for quantitative and qualitative image quality improvements and small vessel evaluation at dynamic CE-abdominal CT with ultra-high and standard resolutions. Jpn. J. Radiol. 2021, 39, 186–197. [Google Scholar] [CrossRef]
- Koetzier, L.R.; Mastrodicasa, D.; Szczykutowicz, T.P.; van der Werf, N.R.; Wang, A.S.; Sandfort, V.; van der Molen, A.J.; Fleischmann, D.; Willemink, M.J. Deep Learning Image Reconstruction for CT: Technical Principles and Clinical Prospects. Radiology 2023, 306, e221257. [Google Scholar] [CrossRef]
- Yamashiro, T.; Miyara, T.; Honda, O.; Kamiya, H.; Murata, K.; Ohno, Y.; Tomiyama, N.; Moriya, H.; Koyama, M.; Noma, S.; et al. Adaptive Iterative Dose Reduction Using Three Dimensional Processing (AIDR3D) Improves Chest CT Image Quality and Reduces Radiation Exposure. PLoS ONE 2014, 9, e105735. [Google Scholar] [CrossRef] [Green Version]
- Nagatani, Y.; Takahashi, M.; Murata, K.; Ikeda, M.; Yamashiro, T.; Miyara, T.; Koyama, H.; Koyama, M.; Sato, Y.; Moriya, H.; et al. Lung nodule detection performance in five observers on computed tomography (CT) with adaptive iterative dose reduction using three-dimensional processing (AIDR 3D) in a Japanese multicenter study: Comparison between ultra-low-dose CT and low-dose CT by receiver-operating characteristic analysis. Eur. J. Radiol. 2015, 84, 1401–1412. [Google Scholar] [CrossRef] [Green Version]
- Nagatani, Y.; Takahashi, M.; Ikeda, M.; Yamashiro, T.; Koyama, H.; Koyama, M.; Moriya, H.; Noma, S.; Tomiyama, N.; Ohno, Y.; et al. Sub-solid Nodule Detection Performance on Reduced-dose Computed Tomography with Iterative Reduction. Acad. Radiol. 2017, 24, 995–1007. [Google Scholar] [CrossRef]
- Chen-Mayer, H.H.; Fuld, M.K.; Hoppel, B.; Judy, P.F.; Sieren, J.P.; Guo, J.; Lynch, D.A.; Possolo, A.; Fain, S.B. Standardizing CT lung density measure across scanner manufacturers. Med. Phys. 2017, 44, 974–985. [Google Scholar] [CrossRef] [PubMed]
- Ohno, Y.; Fujisawa, Y.; Fujii, K.; Sugihara, N.; Kishida, Y.; Seki, S.; Yoshikawa, T. Effects of acquisition method and reconstruction algorithm for CT number measurement on standard-dose CT and reduced-dose CT: A QIBA phantom study. Jpn. J. Radiol. 2019, 37, 399–411. [Google Scholar] [CrossRef] [PubMed]
- Ohno, Y.; Akino, N.; Fujisawa, Y.; Kimata, H.; Ito, Y.; Fujii, K.; Kataoka, Y.; Ida, Y.; Oshima, Y.; Hamabuchi, N.; et al. Comparison of lung CT number and airway dimension evaluation capabilities of ultra-high-resolution CT, using different scan modes and reconstruction methods including deep learning reconstruction, with those of multi-detector CT in a QIBA phantom study. Eur. Radiol. 2023, 33, 368–379. [Google Scholar] [CrossRef] [PubMed]
- Nishio, M.; Matsumoto, S.; Ohno, Y.; Sugihara, N.; Inokawa, H.; Yoshikawa, T.; Sugimura, K. Emphysema Quantification by Low-Dose CT: Potential Impact of Adaptive Iterative Dose Reduction Using 3D Processing. AJR Am. J. Roentgenol. 2012, 199, 595–601. [Google Scholar] [CrossRef]
- Nishio, M.; Matsumoto, S.; Seki, S.; Koyama, H.; Ohno, Y.; Fujisawa, Y.; Sugihara, N.; Yoshikawa, T.; Sugimura, K. Emphysema quantification on low-dose CT using percentage of low-attenuation volume and size distribution of low-attenuation lung regions: Effects of adaptive iterative dose reduction using 3D processing. Eur. J. Radiol. 2014, 83, 2268–2276. [Google Scholar] [CrossRef]
- Nishio, M.; Koyama, H.; Ohno, Y.; Negi, N.; Seki, S.; Yoshikawa, T.; Sugimura, K. Emphysema Quantification Using Ultralow-Dose CT With Iterative Reconstruction and Filtered Back Projection. AJR Am. J. Roentgenol. 2016, 206, 1184–1192. [Google Scholar] [CrossRef]
- Ohno, Y.; Aoyagi, K.; Chen, Q.; Sugihara, N.; Iwasawa, T.; Okada, F.; Aoki, T. Comparison of computer-aided detection (CADe) capability for pulmonary nodules among standard-, reduced- and ultra-low-dose CTs with and without hybrid type iterative reconstruction technique. Eur. J. Radiol. 2018, 100, 49–57. [Google Scholar] [CrossRef]
- McDonough, J.E.; Yuan, R.; Suzuki, M.; Seyednejad, N.; Elliott, W.M.; Sanchez, P.G.; Wright, A.C.; Gefter, W.B.; Litzky, L.; Coxson, H.O.; et al. Small-Airway Obstruction and Emphysema in Chronic Obstructive Pulmonary Disease. N. Engl. J. Med. 2011, 365, 1567–1575. [Google Scholar] [CrossRef] [Green Version]
- Hackx, M.; Bankier, A.A.; Gevenois, P.A. Chronic Obstructive Pulmonary Disease: CT Quantification of Airways Disease. Radiology 2012, 265, 34–48. [Google Scholar] [CrossRef]
- Lynch, D.A.; Al-Qaisi, M.A. Quantitative Computed Tomography in Chronic Obstructive Pulmonary Disease. J. Thorac. Imaging 2013, 28, 284–290. [Google Scholar] [CrossRef] [Green Version]
- Kim, S.S.; Seo, J.B.; Lee, H.Y.; Nevrekar, D.V.; Forssen, A.V.; Crapo, J.D.; Schroeder, J.D.; Lynch, D.A.; Moore, C.M.; Wilson, C.; et al. Chronic Obstructive Pulmonary Disease: Lobe-based Visual Assessment of Volumetric CT by Using Standard Images—Comparison with Quantitative CT and Pulmonary Function Test in the COPDGene Study. Radiology 2013, 266, 626–635. [Google Scholar] [CrossRef] [PubMed] [Green Version]
- Hague, C.J.; Krowchuk, N.; Alhassan, D.; Ho, K.; Leipsic, J.; Sin, D.D.; Mayo, J.R.; Coxson, H.O. Qualitative and Quantitative Assessment of Smoking-related Lung Disease: Effect of iterative reconstruction on low-dose computed tomographic examinations. J. Thorac. Imaging 2014, 29, 350–356. [Google Scholar] [CrossRef] [PubMed]
- Nambu, A.; Zach, J.; Schroeder, J.; Jin, G.; Kim, S.S.; Kim, Y.-I.; Schnell, C.; Bowler, R.; Lynch, D.A. Quantitative computed tomography measurements to evaluate airway disease in chronic obstructive pulmonary disease: Relationship to physiological measurements, clinical index and visual assessment of airway disease. Eur. J. Radiol. 2016, 85, 2144–2151. [Google Scholar] [CrossRef] [PubMed] [Green Version]
- Hoffman, E.A.; Lynch, D.A.; Barr, R.G.; van Beek, E.J.; Parraga, G.; IWPFI Investigators. Pulmonary CT and MRI phenotypes that help explain chronic pulmonary obstruction disease pathophysiology and outcomes. J. Magn. Reson. Imaging 2015, 43, 544–557. [Google Scholar] [CrossRef] [PubMed] [Green Version]
- Kauczor, H.-U.; Wielpütz, M.O.; Jobst, B.J.; Weinheimer, O.; Gompelmann, D.; Herth, F.J.; Heussel, C.P. Computed Tomography Imaging for Novel Therapies of Chronic Obstructive Pulmonary Disease. J. Thorac. Imaging 2019, 34, 202–213. [Google Scholar] [CrossRef] [PubMed]
- Petousi, N.; Talbot, N.P.; Pavord, I.; A Robbins, P. Measuring lung function in airways diseases: Current and emerging techniques. Thorax 2019, 74, 797–805. [Google Scholar] [CrossRef]
- Goldin, J.G. The Emerging Role of Quantification of Imaging for Assessing the Severity and Disease Activity of Emphysema, Airway Disease, and Interstitial Lung Disease. Respiration 2021, 100, 277–290. [Google Scholar] [CrossRef]
- Koyama, H.; Ohno, Y.; Yamazaki, Y.; Onishi, Y.; Takenaka, D.; Yoshikawa, T.; Nishio, M.; Matsumoto, S.; Murase, K.; Nishimura, Y.; et al. Quantitative bronchial luminal volumetric assessment of pulmonary function loss by thin-section MDCT in pulmonary emphysema patients. Eur. J. Radiol. 2012, 81, 384–388. [Google Scholar] [CrossRef]
- Koyama, H.; Ohno, Y.; Nishio, M.; Matsumoto, S.; Sugihara, N.; Yoshikawa, T.; Seki, S.; Sugimura, K. Iterative reconstruction technique vs filter back projection: Utility for quantitative bronchial assessment on low-dose thin-section MDCT in patients with/without chronic obstructive pulmonary disease. Eur. Radiol. 2014, 24, 1860–1867. [Google Scholar] [CrossRef]
- Yamashiro, T.; Miyara, T.; Honda, O.; Tomiyama, N.; Ohno, Y.; Noma, S.; Murayama, S. Iterative reconstruction for quantitative computed tomography analysis of emphysema: Consistent results using different tube currents. Int. J. Chronic Obstr. Pulm. Dis. 2015, 10, 321–327. [Google Scholar] [CrossRef] [Green Version]
- Ohno, Y.; Aoyagi, K.; Takenaka, D.; Yoshikawa, T.; Ikezaki, A.; Fujisawa, Y.; Murayama, K.; Hattori, H.; Toyama, H. Machine learning for lung CT texture analysis: Improvement of inter-observer agreement for radiological finding classification in patients with pulmonary diseases. Eur. J. Radiol. 2021, 134, 109410. [Google Scholar] [CrossRef] [PubMed]
- Ohno, Y.; Aoyagi, K.; Arakita, K.; Doi, Y.; Kondo, M.; Banno, S.; Kasahara, K.; Ogawa, T.; Kato, H.; Hase, R.; et al. Newly developed artificial intelligence algorithm for COVID-19 pneumonia: Utility of quantitative CT texture analysis for prediction of favipiravir treatment effect. Jpn. J. Radiol. 2022, 40, 800–813. [Google Scholar] [CrossRef] [PubMed]
- Ohno, Y.; Aoyagi, K.; Takenaka, D.; Yoshikawa, T.; Fujisawa, Y.; Sugihara, N.; Hamabuchi, N.; Hanamatsu, S.; Obama, Y.; Ueda, T.; et al. Machine learning for lung texture analysis on thin-section CT: Capability for assessments of disease severity and therapeutic effect for connective tissue disease patients in comparison with expert panel evaluations. Acta Radiol. 2022, 63, 1363–1373. [Google Scholar] [CrossRef]
- Uematsu, H.; Ohno, Y.; Hatabu, H. Recent Advances in Magnetic Resonance Perfusion Imaging of the Lung. Top. Magn. Reson. Imaging 2003, 14, 245–251. [Google Scholar] [CrossRef]
- Matsuoka, S.; Hunsaker, A.R.; Gill, R.R.; Jacobson, F.L.; Ohno, Y.; Patz, S.; Hatabu, H. Functional MR Imaging of the Lung. Magn. Reson. Imaging Clin. North Am. 2008, 16, 275–289. [Google Scholar] [CrossRef] [PubMed]
- Ohno, Y.; Koyama, H.; Yoshikawa, T.; Nishio, M.; Matsumoto, S.; Iwasawa, T.; Sugimura, K. Pulmonary Magnetic Resonance Imaging for Airway Diseases. J. Thorac. Imaging 2011, 26, 301–316. [Google Scholar] [CrossRef]
- Ohno, Y.; Seo, J.B.; Parraga, G.; Lee, K.S.; Gefter, W.B.; Fain, S.B.; Schiebler, M.L.; Hatabu, H. Pulmonary Functional Imaging: Part 1—State-of-the-Art Technical and Physiologic Underpinnings. Radiology 2021, 299, 508–523. [Google Scholar] [CrossRef]
- Gefter, W.B.; Lee, K.S.; Schiebler, M.L.; Parraga, G.; Seo, J.B.; Ohno, Y.; Hatabu, H. Pulmonary Functional Imaging: Part 2—State-of-the-Art Clinical Applications and Opportunities for Improved Patient Care. Radiology 2021, 299, 524–538. [Google Scholar] [CrossRef]
- Tanaka, Y.; Ohno, Y.; Hanamatsu, S.; Obama, Y.; Ueda, T.; Ikeda, H.; Iwase, A.; Fukuba, T.; Hattori, H.; Murayama, K.; et al. State-of-the-art MR Imaging for Thoracic Diseases. Magn. Reson. Med. Sci. 2022, 21, 212–234. [Google Scholar] [CrossRef]
- Ohno, Y.; Hanamatsu, S.; Obama, Y.; Ueda, T.; Ikeda, H.; Hattori, H.; Murayama, K.; Toyama, H. Overview of MRI for pulmonary functional imaging. Br. J. Radiol. 2022, 95, 20201053. [Google Scholar] [CrossRef]
- Thieme, S.F.; Johnson, T.R.; Reiser, M.F.; Nikolaou, K. Dual-Energy Lung Perfusion Computed Tomography: A Novel Pulmonary Functional Imaging Method. Semin. Ultrasound, CT MRI 2010, 31, 301–308. [Google Scholar] [CrossRef]
- Chae, E.J.; Song, J.-W.; Krauss, B.; Song, K.-S.; Lee, C.W.; Lee, H.J.; Seo, J.B. Dual-energy Computed Tomography Characterization of Solitary Pulmonary Nodules. J. Thorac. Imaging 2010, 25, 301–310. [Google Scholar] [CrossRef] [PubMed]
- Faivre, J.-B.; Pontana, F.; Molinari, F.; Tacelli, N.; Remy, J.; Remy-Jardin, M. Thoracic Applications of Dual Energy. Semin. Respir. Crit. Care Med. 2014, 35, 064–073. [Google Scholar] [CrossRef] [PubMed]
- De Santis, D.; Eid, M.; De Cecco, C.N.; Jacobs, B.E.; Albrecht, M.H.; Varga-Szemes, A.; Tesche, C.; Caruso, D.; Laghi, A.; Schoepf, U.J. Dual-Energy Computed Tomography in Cardiothoracic Vascular Imaging. Radiol. Clin. North Am. 2018, 56, 521–534. [Google Scholar] [CrossRef]
- Vlahos, I.; Jacobsen, M.C.; Godoy, M.C.; Stefanidis, K.; Layman, R.R. Dual-energy CT in pulmonary vascular disease. Br. J. Radiol. 2022, 95, 20210699. [Google Scholar] [CrossRef] [PubMed]
- Vulasala, S.S.R.; Wynn, G.C.; Hernandez, M.; Kadambi, I.; Gopireddy, D.R.; Bhosale, P.; Virarkar, M.K. Dual-Energy Imaging of the Chest. Semin. Ultrasound, CT MRI 2022, 43, 311–319. [Google Scholar] [CrossRef]
- Rapp, J.B.; Biko, D.M.; Siegel, M.J. Dual-Energy CT for Pediatric Thoracic Imaging: A Review. AJR Am. J. Roentgenol. 2023; Online ahead of print. [Google Scholar] [CrossRef]
- Piper, J.; Ikeda, Y.; Fujisawa, Y.; Ohno, Y.; Yoshikawa, T.; O’neil, A.; Poole, I. Objective evaluation of the correction by non-rigid registration of abdominal organ motion in low-dose 4D dynamic contrast-enhanced CT. Phys. Med. Biol. 2012, 57, 1701–1715. [Google Scholar] [CrossRef]
- Grob, D.; Oostveen, L.; Rühaak, J.; Heldmann, S.; Mohr, B.; Michielsen, K.; Dorn, S.; Prokop, M.; Kachelrieβ, M.; Brink, M.; et al. Accuracy of registration algorithms in subtraction CT of the lungs: A digital phantom study. Med. Phys. 2019, 46, 2264–2274. [Google Scholar] [CrossRef] [Green Version]
- Baerends, E.; Oostveen, L.J.; Smit, C.T.; Das, M.; Sechopoulos, I.; Brink, M.; de Lange, F.; Prokop, M. Comparing dual energy CT and subtraction CT on a phantom: Which one provides the best contrast in iodine maps for sub-centimetre details? Eur. Radiol. 2018, 28, 5051–5059. [Google Scholar] [CrossRef] [Green Version]
- Grob, D.; Oostveen, L.J.; Prokop, M.; Schaefer-Prokop, C.M.; Sechopoulos, I.; Brink, M. Imaging of pulmonary perfusion using subtraction CT angiography is feasible in clinical practice. Eur. Radiol. 2019, 29, 1408–1414. [Google Scholar] [CrossRef] [PubMed] [Green Version]
- Tamura, M.; Yamada, Y.; Kawakami, T.; Kataoka, M.; Iwabuchi, Y.; Sugiura, H.; Hashimoto, M.; Nakahara, T.; Okuda, S.; Nakatsuka, S.; et al. Diagnostic accuracy of lung subtraction iodine mapping CT for the evaluation of pulmonary perfusion in patients with chronic thromboembolic pulmonary hypertension: Correlation with perfusion SPECT/CT. Int. J. Cardiol. 2017, 243, 538–543. [Google Scholar] [CrossRef]
- Dissaux, B.; Le Floch, P.-Y.; Robin, P.; Bourhis, D.; Couturaud, F.; Salaun, P.-Y.; Nonent, M.; Le Roux, P.-Y. Pulmonary perfusion by iodine subtraction maps CT angiography in acute pulmonary embolism: Comparison with pulmonary perfusion SPECT (PASEP trial). Eur. Radiol. 2020, 30, 4857–4864. [Google Scholar] [CrossRef] [PubMed]
- Grob, D.; Oostveen, L.J.; Jacobs, C.; Scholten, E.; Prokop, M.; Schaefer-Prokop, C.M.; Sechopoulos, I.; Brink, M. Pulmonary nodule enhancement in subtraction CT and dual-energy CT: A comparison study. Eur. J. Radiol. 2021, 134, 109443. [Google Scholar] [CrossRef] [PubMed]
- Schoepf, U.J.; Bruening, R.; Konschitzky, H.; Becker, C.R.; Knez, A.; Weber, J.; Muehling, O.; Herzog, P.; Huber, A.; Haberl, R.; et al. Pulmonary Embolism: Comprehensive Diagnosis by Using Electron-Beam CT for Detection of Emboli and Assessment of Pulmonary Blood Flow. Radiology 2000, 217, 693–700. [Google Scholar] [CrossRef]
- Herzog, P.; Wildberger, J.E.; Niethammer, M.; Schaller, S.; Schoepf, U. CT perfusion imaging of the lung in pulmonary embolism1. Acad. Radiol. 2003, 10, 1132–1146. [Google Scholar] [CrossRef]
- Hoffman, E.A. Computed Tomography Studies of Lung Ventilation and Perfusion. Proc. Am. Thorac. Soc. 2005, 2, 492–498. [Google Scholar] [CrossRef] [PubMed] [Green Version]
- Ng, Q.-S.; Goh, V.; Fichte, H.; Klotz, E.; Fernie, P.; Saunders, M.I.; Hoskin, P.J.; Padhani, A.R. Lung Cancer Perfusion at Multi–Detector Row CT: Reproducibility of Whole Tumor Quantitative Measurements. Radiology 2006, 239, 547–553. [Google Scholar] [CrossRef]
- Ng, Q.S.; Goh, V.J.; Klotz, E.; Fichte, H.; Saunders, M.I.; Hoskin, P.J.; Padhani, A.R. Quantitative Assessment of Lung Cancer Perfusion Using MDCT: Does Measurement Reproducibility Improve with Greater Tumor Volume Coverage? AJR Am. J. Roentgenol. 2006, 187, 1079–1084. [Google Scholar] [CrossRef]
- Sitartchouk, I.; Roberts, H.C.; Pereira, A.M.; Bayanati, H.; Waddell, T.; Roberts, T.P. Computed Tomography Perfusion Using First Pass Methods for Lung Nodule Characterization. Investig. Radiol. 2008, 43, 349–358. [Google Scholar] [CrossRef]
- Wang, J.; Wu, N.; Cham, M.D.; Song, Y. Tumor Response in Patients With Advanced Non–Small Cell Lung Cancer: Perfusion CT Evaluation of Chemotherapy and Radiation Therapy. AJR Am. J. Roentgenol. 2009, 193, 1090–1096. [Google Scholar] [CrossRef]
- Li, Y.; Yang, Z.-G.; Chen, T.-W.; Yu, J.-Q.; Sun, J.-Y.; Chen, H.-J. First-pass perfusion imaging of solitary pulmonary nodules with 64-detector row CT: Comparison of perfusion parameters of malignant and benign lesions. Br. J. Radiol. 2010, 83, 785–790. [Google Scholar] [CrossRef] [Green Version]
- Rockoff, S.D.; Mendelsohn, M.L. Evaluation of xenon as a gaseous roentgenographic contrast material. A preliminary report. Am. Rev. Respir. Dis. 1962, 86, 434–438. [Google Scholar] [CrossRef] [PubMed]
- Winkler, S.S.; Holden, J.E.; Sackett, J.F.; Flemming, D.C.; Alexander, S.C. Xenon and Krypton as Radiographic Inhalation Contrast Media With Computerized Tomography: Preliminary Note. Investig. Radiol. 1977, 12, 19–20. [Google Scholar] [CrossRef]
- Chon, D.; Beck, K.C.; Simon, B.A.; Shikata, H.; Saba, O.I.; Hoffman, E.A. Effect of low-xenon and krypton supplementation on signal/noise of regional CT-based ventilation measurements. J. Appl. Physiol. 2007, 102, 1535–1544. [Google Scholar] [CrossRef] [Green Version]
- Chae, E.J.; Seo, J.B.; Goo, H.W.; Kim, N.; Song, K.-S.; Lee, S.D.; Hong, S.-J.; Krauss, B. Xenon Ventilation CT with a Dual-Energy Technique of Dual-Source CT: Initial Experience. Radiology 2008, 248, 615–624. [Google Scholar] [CrossRef] [PubMed]
- Park, E.-A.; Goo, J.M.; Park, S.J.; Lee, H.J.; Lee, C.H.; Park, C.M.; Yoo, C.-G.; Kim, J.H. Chronic Obstructive Pulmonary Disease: Quantitative and Visual Ventilation Pattern Analysis at Xenon Ventilation CT Performed by Using a Dual-Energy Technique. Radiology 2010, 256, 985–997. [Google Scholar] [CrossRef] [PubMed]
- Chae, E.J.; Seo, J.B.; Lee, J.; Kim, N.; Goo, H.W.; Lee, H.J.; Lee, C.W.; Ra, S.W.; Oh, Y.-M.; Cho, Y.S. Xenon Ventilation Imaging Using Dual-Energy Computed Tomography in Asthmatics. Investig. Radiol. 2010, 45, 354–361. [Google Scholar] [CrossRef]
- Honda, N.; Osada, H.; Watanabe, W.; Nakayama, M.; Nishimura, K.; Krauss, B.; Otani, K. Imaging of Ventilation with Dual-Energy CT during Breath Hold after Single Vital-Capacity Inspiration of Stable Xenon. Radiology 2012, 262, 262–268. [Google Scholar] [CrossRef]
- Lu, G.M.; Zhao, Y.; Zhang, L.J.; Schoepf, U.J. Dual-Energy CT of the Lung. AJR Am. J. Roentgenol. 2012, 199 (Suppl. S5), S40–S53. [Google Scholar] [CrossRef]
- Park, S.J.; Lee, C.H.; Goo, J.M.; Kim, J.H.; Park, E.-A.; Jung, J.-W.; Park, H.-W.; Cho, S.-H. Quantitative analysis of dynamic airway changes after methacholine and salbutamol inhalation on xenon-enhanced chest CT. Eur. Radiol. 2012, 22, 2441–2450. [Google Scholar] [CrossRef]
- Kim, W.W.; Lee, C.H.; Goo, J.M.; Park, S.J.; Kim, J.H.; Park, E.-A.; Cho, S.-H. Xenon-Enhanced Dual-Energy CT of Patients With Asthma: Dynamic Ventilation Changes After Methacholine and Salbutamol Inhalation. AJR Am. J. Roentgenol. 2012, 199, 975–981. [Google Scholar] [CrossRef] [PubMed]
- Jung, J.-W.; Kwon, J.-W.; Kim, T.-W.; Lee, S.-H.; Kim, K.-M.; Kang, H.-R.; Park, H.-W.; Lee, C.-H.; Goo, J.-M.; Min, K.-U.; et al. New insight into the assessment of asthma using xenon ventilation computed tomography. Ann. Allergy Asthma Immunol. 2013, 111, 90–95.e2. [Google Scholar] [CrossRef] [PubMed]
- Kong, X.; Sheng, H.X.; Lu, G.M.; Meinel, F.G.; Dyer, K.T.; Schoepf, U.J.; Zhang, L.J. Xenon-Enhanced Dual-Energy CT Lung Ventilation Imaging: Techniques and Clinical Applications. Am. J. Roentgenol. 2014, 202, 309–317. [Google Scholar] [CrossRef] [PubMed]
- Park, H.-W.; Jung, J.-W.; Kim, K.-M.; Kim, T.-W.; Lee, S.-H.; Lee, C.H.; Goo, J.M.; Min, K.-U.; Cho, S.-H. Xenon ventilation computed tomography and the management of asthma in the elderly. Respirology 2014, 19, 389–395. [Google Scholar] [CrossRef] [PubMed]
- Hwang, H.J.; Lee, S.M.; Seo, J.B.; Lee, J.S.; Kim, N.; Lee, S.W.; Oh, Y.-M. Visual and Quantitative Assessments of Regional Xenon-Ventilation Using Dual-Energy CT in Asthma-Chronic Obstructive Pulmonary Disease Overlap Syndrome: A Comparison with Chronic Obstructive Pulmonary Disease. Korean J. Radiol. 2020, 21, 1104–1113. [Google Scholar] [CrossRef]
- Dokuni, R.; Kobayashi, K.; Ohno, Y.; Nagano, T.; Tamura, D.; Umezawa, K.; Katsurada, N.; Nakata, K.; Yamamoto, M.; Tachihara, M.; et al. Effect of Bronchial Thermoplasty on Air Trapping Assessed by Xenon Ventilation Computed Tomography. Intern. Med. 2021, 60, 2027–2032. [Google Scholar] [CrossRef]
- Ohno, Y.; Yoshikawa, T.; Takenaka, D.; Fujisawa, Y.; Sugihara, N.; Kishida, Y.; Seki, S.; Koyama, H.; Sugimura, K. Xenon-enhanced CT using subtraction CT: Basic and preliminary clinical studies for comparison of its efficacy with that of dual-energy CT and ventilation SPECT/CT to assess regional ventilation and pulmonary functional loss in smokers. Eur. J. Radiol. 2017, 86, 41–51. [Google Scholar] [CrossRef]
- Ohno, Y.; Fujisawa, Y.; Takenaka, D.; Kaminaga, S.; Seki, S.; Sugihara, N.; Yoshikawa, T. Comparison of Xenon-Enhanced Area-Detector CT and Krypton Ventilation SPECT/CT for Assessment of Pulmonary Functional Loss and Disease Severity in Smokers. AJR Am. J. Roentgenol. 2018, 210, W45–W53. [Google Scholar] [CrossRef]
- Ohno, Y.; Fujisawa, Y.; Sugihara, N.; Kishida, Y.; Koyama, H.; Seki, S.; Yoshikawa, T. Wash-in/wash-out phase xenon-enhanced area-detector CT (ADCT): Utility for regional ventilation, pulmonary functional loss and clinical stage evaluations of smokers. Acta Radiol. 2019, 60, 1619–1628. [Google Scholar] [CrossRef]
- Ohno, Y.; Fujisawa, Y.; Yoshikawa, T.; Takenaka, D.; Koyama, H.; Hattori, H.; Murayama, K.; Fujii, K.; Sugihara, N.; Toyama, H. Inspiratory/expiratory xenon-enhanced area-detector CT: Capability for quantitative assessment of lung ventilation changes in surgically treated non-small cell lung cancer patients. Eur. J. Radiol. 2021, 136, 109574. [Google Scholar] [CrossRef]
- Koyama, H.; Ohno, Y.; Fujisawa, Y.; Seki, S.; Negi, N.; Murakami, T.; Yoshikawa, T.; Sugihara, N.; Nishimura, Y.; Sugimura, K. 3D lung motion assessments on inspiratory/expiratory thin-section CT: Capability for pulmonary functional loss of smoking-related COPD in comparison with lung destruction and air trapping. Eur. J. Radiol. 2016, 85, 352–359. [Google Scholar] [CrossRef] [PubMed]
- Sharifi, H.; Brown, S.; McDonald, G.C.; Chetty, I.J.; Zhong, H. 4-Dimensional computed tomography-based ventilation and compliance images for quantification of radiation-induced changes in pulmonary function. J. Med. Imaging Radiat. Oncol. 2019, 63, 370–377. [Google Scholar] [CrossRef] [PubMed]
- Guo, J.; Hardie, W.D.; Cleveland, Z.I.; Davidson, C.R.; Xu, X.; Madala, S.K.; Woods, J.C. Longitudinal free-breathing MRI measurement of murine lung physiology in a progressive model of lung fibrosis. J. Appl. Physiol. 2019, 126, 1138–1149. [Google Scholar] [CrossRef] [PubMed]
- Yamashiro, T.; Tsubakimoto, M.; Teramoto, R.; Murayama, S.; Nagatani, Y.; Moriya, H.; Sakuma, K.; Tsukagoshi, S.; Inokawa, H.; Kimoto, T. Automated continuous quantitative measurement of proximal airways on dynamic ventilation CT: Initial experience using an ex vivo porcine lung phantom. Int. J. Chronic Obstr. Pulm. Dis. 2015, 10, 2045–2054. [Google Scholar] [CrossRef] [PubMed] [Green Version]
- Yamashiro, T.; Moriya, H.; Matsuoka, S.; Nagatani, Y.; Tsubakimoto, M.; Tsuchiya, N.; Murayama, S. Asynchrony in respiratory movements between the pulmonary lobes in patients with COPD: Continuous measurement of lung density by 4-dimensional dynamic-ventilation CT. Int. J. Chronic Obstr. Pulm. Dis. 2017, 12, 2101–2109. [Google Scholar] [CrossRef] [PubMed] [Green Version]
- Xu, Y.; Yamashiro, T.; Moriya, H.; Tsubakimoto, M.; Tsuchiya, N.; Nagatani, Y.; Matsuoka, S.; Murayama, S. Hyperinflated lungs compress the heart during expiration in COPD patients: A new finding on dynamic-ventilation computed tomography. Int. J. Chronic Obstr. Pulm. Dis. 2017, 12, 3123–3131. [Google Scholar] [CrossRef] [Green Version]
- Hashimoto, M.; Nagatani, Y.; Oshio, Y.; Nitta, N.; Yamashiro, T.; Tsukagoshi, S.; Ushio, N.; Mayumi, M.; Kimoto, T.; Igarashi, T.; et al. Preoperative assessment of pleural adhesion by Four-Dimensional Ultra-Low-Dose Computed Tomography (4D-ULDCT) with Adaptive Iterative Dose Reduction using Three-Dimensional processing (AIDR-3D). Eur. J. Radiol. 2018, 98, 179–186. [Google Scholar] [CrossRef]
- Xu, Y.; Yamashiro, T.; Moriya, H.; Tsubakimoto, M.; Nagatani, Y.; Matsuoka, S.; Murayama, S. Strain measurement on four-dimensional dynamic-ventilation CT: Quantitative analysis of abnormal respiratory deformation of the lung in COPD. Int. J. Chronic Obstr. Pulm. Dis. 2018, 14, 65–72. [Google Scholar] [CrossRef] [PubMed] [Green Version]
- Yamashiro, T.; for the ACTIve Study Group investigators; Moriya, H.; Tsubakimoto, M.; Nagatani, Y.; Kimoto, T.; Murayama, S. Preoperative assessment of parietal pleural invasion/adhesion of subpleural lung cancer: Advantage of software-assisted analysis of 4-dimensional dynamic-ventilation computed tomography. Eur. Radiol. 2019, 29, 5247–5252. [Google Scholar] [CrossRef]
- Nagatani, Y.; Yoshigoe, M.; Tsukagoshi, S.; Ushio, N.; Ohashi, K.; Nitta, N.; Kimoto, T.; Uranishi, A.; Sato, S.; Mayumi, M.; et al. Peripheral bronchial luminal conspicuity on dynamic-ventilation computed tomography: Association with radiation doses and temporal resolution by using an ex vivo porcine lung phantom. Acta Radiol. 2020, 61, 1608–1617. [Google Scholar] [CrossRef]
- Nagatani, Y.; Hashimoto, M.; Oshio, Y.; Sato, S.; Hanaoka, J.; Fukunaga, K.; Uemura, R.; Yoshigoe, M.; Nitta, N.; Usio, N.; et al. Preoperative assessment of localized pleural adhesion: Utility of software-assisted analysis on dynamic-ventilation computed tomography. Eur. J. Radiol. 2020, 133, 109347. [Google Scholar] [CrossRef] [PubMed]
- Sato, S.; Nagatani, Y.; Hashimoto, M.; Nitta, N.; Hanaoka, J.; Ushio, N.; Tsukagoshi, S.; Uranishi, A.; Kimoto, T.; Oshio, Y.; et al. Usability of the lateral decubitus position on four-dimensional ultra-low-dose computed tomography for the detection of localized pleural adhesion in the pulmonary apical region. Acta Radiol. 2021, 62, 462–473. [Google Scholar] [CrossRef] [PubMed]


| Vendor | Reconstruction Methods | ||
|---|---|---|---|
| Hybrid-Type IR | Model-Based IR | DLR | |
| Canon Medical Systems | Adaptive Iterative Dose Reduction 3D (AIDR 3D) | Forward Projected Model-Based Iterative Reconstruction Solution (FIRST) | Advanced intelligent Clear-IQ Engine (AiCE) |
| GE Healthcare | Adaptive Statistical Iterative Reconstruction (ASiR) | Veo | TrueFidelity |
| Philips Healthcare | 4th-Generation Iterative Reconstruction (iDose4) | Iterative Model Reconstruction (IMR) | Precise Image |
| Siemens Healthineers | Iterative Reconstruction in Image Space (IRIS) | N/A | N/A |
| Sinogram Affirmed Iterative Reconstruction (SAFIRE) | |||
| Advanced Modeled Iterative Reconstruction (ADMIRE) | |||
| Multienergy CT Technique | Dual Source | Split Beam | Rapid kVp Switching | Dual-Layer Detector | |
|---|---|---|---|---|---|
| CT vendors | Siemens Healthineers | GE Healthcare | Canon Medical Systems | Philips Healthcare | |
| Number of X-ray tubes | 2 | 1 | 1 | 1 | 1 |
| Scan time (sec/rotation) | 0.25 | 0.28 | 0.28 | 0.275 | 0.27 |
| FOV | Small in one X-ray tube | Full | Full | Full | Full |
| Z-axis coverage/rotation (mm/rot) | 57.6–80 | 40 | 80 | 40–160 | 40–80 |
| Automatic exposure control | Yes | No | Yes | Yes | |
| Cross scattering | Yes | No | No | No | |
| Filter | Yes | No | No | No | |
| Registration | Slight temporal offset | Poor | Good | Good | Good |
| Spectral reconstruction method | Image | Projection and image | Projection and image | Projection and image | |
| Tube current optimization for different energy bin | Yes | No | No | No | No |
| Spectral separation | Good | Limited | Good | Good | Limited |
| Authors | Method | Target | Parameters | Cutoff Values (HU) | SE (%) | SP (%) | AC (%) |
|---|---|---|---|---|---|---|---|
| Ohno Y, et al. [5] | 320-detector row CT | Pulmonary nodules | Perfusion (mL/100 mL/min) calculated with single-input maximum slope method | 40.0 | 98 (42/43) | 79 (26/33) | 90 (68/76) |
| Extraction fraction (mL/100 mL/min) | 2.0 | 88 (38/43) | 82 (27/33) | 86 (65/76) | |||
| Blood volume (mL/100 mL) | 2.0 | 86 (37/43) | 54 (18/33) | 72 (55/76) | |||
| FDG-PET/CT | SUVmax | 2.0 | 91 (39/43) | 52 (17/33) | 74 (56/76) | ||
| Ohno Y, et al. [12] | 320-detector row CT | Pulmonary nodules | Total perfusion (mL/100 mL/min) calculated with dual-input maximum slope method | 40 | 86.0 (49/57) | 79.5 (31/39) | 83.3 (80/96) |
| Perfusion (mL/100 mL/min) calculated with single-input maximum slope method | 20 | 64.9 (37/57) | 69.2 (27/39) | 66.7 (64/96) | |||
| FDG-PET/CT | SUVmax | 2.5 | 63.2 (36/57) | 56.4 (22/39) | 60.4 (58/96) | ||
| Ohno Y, et al. [15] | 320-detector row CT | Pulmonary nodules | Total perfusion (mL/100 mL/min) calculated with dual-input maximum slope method | 29 | 92 (123/133) | 71 (60/85) | 84 (183/218) |
| Nodule perfusion (mL/100 mL/min) calculated with single-input maximum slope method | 10 | 91 (121/133) | 28 (24/85) | 67 (145/218) | |||
| Dynamic first-pass CE-perfusion MRI for 1.5T system | Maximum relative enhancement | 0.13 | 92 (123/133) | 49 (42/85) | 76 (165/218) | ||
| Slope of enhancement | 0.016 | 93 (124/133) | 49 (42/85) | 76 (166/218) | |||
| FDG-PET/CT | SUVmax | 2 | 89 (119/133) | 31 (26/85) | 67 (145/218) | ||
| Ohno Y, et al. [20] | 320-detector row CT | Lymph node metastasis in NSCLC analyzed per node | Total perfusion (mL/100 mL/min) calculated with slope of enhancement dual-input maximum slope method | 58 | 54.2 (32/59) | 89.8 (53/59) | 72.0 (85/118) |
| Systemic arterial perfusion (mL/100 mL/min) calculated with dual-input maximum slope method | 4.1 | 98.3 (58/59) | 56.4 (51/59) | 92.4 (109/118) | |||
| Permeability surface (mL/100 mL/min) assessed with Patlak plot method | 8.7 | 50.8 (30/59) | 94.9 (56/59) | 72.9 (86/118) | |||
| Distribution volume (mL/100 mL) assessed with Patlak plot method | 0.37 | 84.7 (50/59) | 44.1 (26/59) | 64.34 (76/118) | |||
| FDG-PET/CT | SUVmax | 2.9 | 74.6 (44/59) | 91.5 (54/559) | 83.1 (98/118) | ||
| Seki S, et al. [22] | 320-detector row CT | Therapeutic outcome prediction for NSCLC | Total perfusion (mL/100 mL/min) calculated with dual-input maximum slope method | 29.2 | 78.3 (18/23) | 85 (17/20) | 81.4 (35/43) |
| Pulmonary arterial perfusion (mL/100 mL/min) calculated with dual-input maximum slope method | 15.5 | 65.2 (15/23) | 80 (16/20) | 72.1 (31/43) | |||
| Systemic arterial perfusion (mL/100 mL/min) calculated with dual-input maximum slope method | 11 | 82.6 (19/23) | 80 (16/20) | 81.4 (35/43) | |||
| Dynamic first-pass CE-perfusion MRI at 3T system | Total perfusion (mL/100 mL/min) calculated with dual-input maximum slope method | 37.5 | 69.6 (16/23) | 95 (19/20) | 81.4 (35/43) | ||
| Pulmonary arterial perfusion (mL/100 mL/min) calculated with dual-input maximum slope method | 16.3 | 65.2 (15/23) | 80 (16/20) | 72.1 (35/43) | |||
| Systemic arterial perfusion (mL/100 mL/min) calculated with dual-input maximum slope method | 16.5 | 82.6 (19/23) | 80 (16/20) | 81.4 (35/43) | |||
| FDG-PET/CT | SUVmax | 5.7 | 87.0 (20/23) | 76.9 (14/20) | 79.1(34/43) |
Disclaimer/Publisher’s Note: The statements, opinions and data contained in all publications are solely those of the individual author(s) and contributor(s) and not of MDPI and/or the editor(s). MDPI and/or the editor(s) disclaim responsibility for any injury to people or property resulting from any ideas, methods, instructions or products referred to in the content. |
© 2023 by the authors. Licensee MDPI, Basel, Switzerland. This article is an open access article distributed under the terms and conditions of the Creative Commons Attribution (CC BY) license (https://creativecommons.org/licenses/by/4.0/).
Share and Cite
Ohno, Y.; Ozawa, Y.; Nagata, H.; Bando, S.; Cong, S.; Takahashi, T.; Oshima, Y.; Hamabuchi, N.; Matsuyama, T.; Ueda, T.; et al. Area-Detector Computed Tomography for Pulmonary Functional Imaging. Diagnostics 2023, 13, 2518. https://doi.org/10.3390/diagnostics13152518
Ohno Y, Ozawa Y, Nagata H, Bando S, Cong S, Takahashi T, Oshima Y, Hamabuchi N, Matsuyama T, Ueda T, et al. Area-Detector Computed Tomography for Pulmonary Functional Imaging. Diagnostics. 2023; 13(15):2518. https://doi.org/10.3390/diagnostics13152518
Chicago/Turabian StyleOhno, Yoshiharu, Yoshiyuki Ozawa, Hiroyuki Nagata, Shuji Bando, Shang Cong, Tomoki Takahashi, Yuka Oshima, Nayu Hamabuchi, Takahiro Matsuyama, Takahiro Ueda, and et al. 2023. "Area-Detector Computed Tomography for Pulmonary Functional Imaging" Diagnostics 13, no. 15: 2518. https://doi.org/10.3390/diagnostics13152518