

Evaluation of Spleen Stiffness in Young Healthy Volunteers Using Magnetic Resonance Elastography
 , ,
, ,  and
and 
Abstract
:1. Introduction
2. Methods
- Potential contraindications to MRI
- History of liver and spleen disease of the volunteer and his or her familyOnly participants with no history of liver and spleen disease were selected;
- Liver function tests results
- Alcohol consumption, diet type, and medicines taken by the individual
- Liver stiffness and fat fraction values
- Body Mass Index (BMI)
2.1. Study Protocol
2.2. Image Analysis
2.3. Statistical Analysis
3. Results
4. Discussion
Author Contributions
Funding
Institutional Review Board Statement
Informed Consent Statement
Data Availability Statement
Conflicts of Interest
References
- Muthupillai, R.; Ehman, R.L. Magnetic resonance elastography. Nat. Med. 1996, 2, 601–603. [Google Scholar] [CrossRef]
- Muthupillai, R.; Lomas, D.J.; Rossman, P.J.; Greenleaf, J.F.; Manduca, A.; Ehman, R.L. Magnetic resonance elastography by direct visualization of propagating acoustic strain waves. Science 1995, 269, 1854–1857. [Google Scholar] [CrossRef]
- Dresner, M.A.; Fidler, J.L.; Ehman, R.L. MR elastography of in vivo human liver. In Proceedings of the 12th Annual Meeting of the International Society for Magnetic Resonance in Medicine, Kyoto, Japan, 12–17 May 2004; International Society for Magnetic Resonance in Medicine: Berkeley, CA, USA, 2004; p. 502. [Google Scholar]
- Rouvière, O.; Yin, M.; Dresner, M.A.; Rossman, P.J.; Burgart, L.J.; Fidler, J.L.; Ehman, R.L. In Vivo MR Elastography of the Liver: Preliminary Results. In Proceedings of the 13th Annual Meeting of the International Society for Magnetic Resonance in Medicine, Miami, FL, USA, 7–13 May 2005; International Society for Magnetic Resonance in Medicine: Berkeley, CA, USA, 2005; p. 340. [Google Scholar]
- Huwart, L.; Peeters, F.; Sinkus, R.; Annet, L.; Salameh, N.; ter Beek, L.C.; Horsmans, Y.; Van Beers, B.E. Liver fibrosis: Non-invasive assessment with MR elastography. NMR Biomed. 2006, 19, 173–179. [Google Scholar] [CrossRef]
- Klatt, D.; Asbach, P.; Rump, J.; Papazoglou, S.; Somasundaram, R.; Modrow, J.; Braun, J.; Sack, I. In vivo determination of hepatic stiffness using steady-state free precession magnetic resonance elastography. Investig. Radiol. 2006, 41, 841–848. [Google Scholar] [CrossRef]
- Rouvière, O.; Yin, M.; Dresner, M.A.; Rossman, P.J.; Burgart, L.J.; Fidler, J.L.; Ehman, R.L. MR elastography of the liver: Preliminary results. Radiology 2006, 240, 440–448. [Google Scholar] [CrossRef]
- Serai, S.D.; Obuchowski, N.A.; Venkatesh, S.K.; Sirlin, C.B.; Miller, F.H.; Ashton, E.; Cole, P.E.; Ehman, R.L. Repeatability of MR Elastography of Liver: A Meta-Analysis. Radiology 2017, 285, 92–100. [Google Scholar] [CrossRef]
- Singh, S.; Venkatesh, S.K.; Wang, Z.; Miller, F.H.; Motosugi, U.; Low, R.N.; Hassanein, T.; Asbach, P.; Godfrey, E.M.; Yin, M.; et al. Diagnostic performance of magnetic resonance elastography in staging liver fibrosis: A systematic review and meta-analysis of individual participant data. Clin. Gastroenterol. Hepatol. 2015, 13, 440–451.e6. [Google Scholar] [CrossRef]
- Manduca, A.; Bayly, P.V.; Ehman, R.L.; Kolipaka, A.; Royston, T.J.; Sack, I.; Sinkus, R.; Van Beers, B.E. MR elastography: Principles, guidelines, and terminology. Magn. Reson. Med. 2021, 85, 2377–2390. [Google Scholar] [CrossRef]
- Reeder, S.B. Emergence of 3D MR Elastography–based Quantitative Markers for Diffuse Liver Disease. Radiology 2021, 301, 163–165. [Google Scholar] [CrossRef]
- Venkatesh, S.K.; Ehman, R.L. Magnetic resonance elastography of liver. Magn. Reson. Imaging Clin. N. A. 2014, 22, 433–446. [Google Scholar] [CrossRef]
- Ehman, R.L. Magnetic resonance elastography: From invention to standard of care. Abdom. Radiol. 2022, 47, 3028–3036. [Google Scholar] [CrossRef]
- Hoodeshenas, S.; Yin, M.; Venkatesh, S.K. Magnetic Resonance Elastography of Liver: Current Update. Top. Magn. Reson. Imaging 2018, 27, 319–333. [Google Scholar] [CrossRef]
- Li, J.; Venkatesh, S.K.; Yin, M. Advances in Magnetic Resonance Elastography of Liver. Magn. Reson. Imaging Clin. N. A. 2020, 28, 331–340. [Google Scholar] [CrossRef]
- Liang, Y.; Li, D. Magnetic resonance elastography in staging liver fibrosis in non-alcoholic fatty liver disease: A pooled analysis of the diagnostic accuracy. BMC Gastroenterol. 2020, 20, 89. [Google Scholar] [CrossRef]
- Morisaka, H.; Motosugi, U.; Ichikawa, S.; Nakazawa, T.; Kondo, T.; Funayama, S.; Matsuda, M.; Ichikawa, T.; Onishi, H. Magnetic resonance elastography is as accurate as liver biopsy for liver fibrosis staging. J. Magn. Reson. Imaging 2018, 47, 1268–1275. [Google Scholar] [CrossRef]
- Nielsen, J.; Kjær, M.S.; Rasmussen, A.; Chiranth, D.; Willemoe, G.L.; Henriksen, B.M.; Borgwardt, L.; Grand, M.K.; Borgwardt, L.; Christensen, V.B. Noninvasive Prediction of Advanced Fibrosis in Pediatric Liver Disease-Discriminatory Performance of 2D Shear Wave Elastography, Transient Elastography and Magnetic Resonance Elastography in Comparison to Histopathology. Diagnostics 2022, 12, 2785. [Google Scholar] [CrossRef]
- Selvaraj, E.A.; Mózes, F.E.; Jayaswal, A.N.A.; Zafarmand, M.H.; Vali, Y.; Lee, J.A.; Levick, C.K.; Young, L.A.J.; Palaniyappan, N.; Liu, C.-H.; et al. Diagnostic accuracy of elastography and magnetic resonance imaging in patients with NAFLD: A systematic review and meta-analysis. J. Hepatol. 2021, 75, 770–785. [Google Scholar] [CrossRef]
- Bae, J.S.; Lee, J.M.; Park, S.J.; Lee, K.B.; Han, J.K. Magnetic resonance elastography of healthy livers at 3.0 T: Normal liver stiffness measured by SE-EPI and GRE. Eur. J. Radiol. 2018, 107, 46–53. [Google Scholar] [CrossRef]
- Svensson, S.F.; Fuster-Garcia, E.; Latysheva, A.; Fraser-Green, J.; Nordhøy, W.; Darwish, O.I.; Hovden, I.T.; Holm, S.; Vik-Mo, E.O.; Sinkus, R.; et al. Decreased tissue stiffness in glioblastoma by MR elastography is associated with increased cerebral blood flow. Eur. J. Radiol. 2022, 147, 110136. [Google Scholar] [CrossRef]
- Hsieh, T.J.; Chou, M.C.; Chen, Y.C.; Chou, Y.C.; Lin, C.H.; Chen, C.K. Reliability of Gradient-Echo Magnetic Resonance Elastography of Lumbar Muscles: Phantom and Clinical Studies. Diagnostics 2022, 12, 1385. [Google Scholar] [CrossRef]
- Jondal, D.E.; Wang, J.; Chen, J.; Gorny, K.R.; Felmlee, J.; Hesly, G.; Laughlin-Tommaso, S.; Stewart, E.A.; Ehman, R.; Woodrum, D.A. Uterine fibroids: Correlations between MRI appearance and stiffness via magnetic resonance elastography. Abdom. Radiol. 2018, 43, 1456–1463. [Google Scholar] [CrossRef] [PubMed]
- Murphy, M.C.; Huston, J., 3rd; Ehman, R.L. MR elastography of the brain and its application in neurological diseases. Neuroimage 2019, 187, 176–183. [Google Scholar] [CrossRef] [PubMed]
- Obrzut, M.; Obrzut, B.; Zmuda, M.; Baran, J.; Cholewa, M.; Ehman, R.; Darmochwal-Kolarz, D. Uterine leiomyomas: Correlation between histologic composition and stiffness via magnetic resonance elastography—A Pilot Study. Ginekol. Pol. 2020, 91, 373–378. [Google Scholar] [CrossRef] [PubMed]
- Plaikner, M.; Kremser, C.; Zoller, H.; Kannengiesser, S.; Henninger, B. MR elastography in patients with suspected diffuse liver disease at 1.5T: Intraindividual comparison of gradient-recalled echo versus spin-echo echo-planar imaging sequences and investigation of potential confounding factors. Eur. J. Radiol. 2021, 142, 109898. [Google Scholar] [CrossRef]
- Wang, J.; Deng, Y.; Jondal, D.; Woodrum, D.M.; Shi, Y.; Yin, M.; Venkatesh, S.K. New and Emerging Applications of Magnetic Resonance Elastography of Other Abdominal Organs. Top. Magn. Reson. Imaging 2018, 27, 335–352. [Google Scholar] [CrossRef]
- Yang, J.Y.; Qiu, B.S. The Advance of Magnetic Resonance Elastography in Tumor Diagnosis. Front. Oncol. 2021, 11, 722703. [Google Scholar] [CrossRef]
- Zhang, L.; Chen, J.; Jiang, H.; Rong, D.; Guo, N.; Yang, H.; Zhu, J.; Hu, B.; He, B.; Yin, M.; et al. MR elastography as a biomarker for prediction of early and late recurrence in HBV-related hepatocellular carcinoma patients before hepatectomy. Eur. J. Radiol. 2022, 152, 110340. [Google Scholar] [CrossRef]
- Pagé, G.; Garteiser, P.; Van Beers, B.E. Magnetic resonance elastography of malignant tumors. Front. Phys. 2022, 10, 910036. [Google Scholar] [CrossRef]
- Pepin, K.M.; Ehman, R.L.; McGee, K.P. Magnetic resonance elastography (MRE) in cancer: Technique, analysis, and applications. Prog. Nucl. Magn. Reson. Spectrosc. 2015, 90–91, 32–48. [Google Scholar] [CrossRef]
- Runge, J.H.; Bohte, A.E.; Verheij, J.; Terpstra, V.; Nederveen, A.J.; van Nieuwkerk, K.M.J.; de Knegt, R.J.; Baak, B.C.; Jansen, P.L.M.; Sinkus, R.; et al. Comparison of interobserver agreement of magnetic resonance elastography with histopathological staging of liver fibrosis. Abdom. Imaging 2014, 39, 283–290. [Google Scholar] [CrossRef]
- Yasar, T.K.; Wagner, M.; Bane, O.; Besa, C.; Babb, J.S.; Kannengiesser, S.; Fung, M.; Ehman, R.L.; Taouli, B. Interplatform reproducibility of liver and spleen stiffness measured with MR elastography. J. Magn. Reson. Imaging 2016, 43, 1064–1072. [Google Scholar] [CrossRef]
- Zhang, L.; Long, X.; Nijiati, M.; Zhang, T.; Li, M.; Deng, Y.; Kuang, S.; Xiao, Y.; Zhu, J.; He, B.; et al. Tumor stiffness measured by 3D magnetic resonance elastography can help predict the aggressiveness of endometrial carcinoma: Preliminary findings. Cancer Imaging 2021, 21, 50. [Google Scholar] [CrossRef] [PubMed]
- Ronot, M.; Lambert, S.; Elkrief, L.; Doblas, S.; Rautou, P.-E.; Castera, L.; Vilgrain, V.; Sinkus, R.; Van Beers, B.E.; Garteiser, P. Assessment of portal hypertension and high-risk oesophageal varices with liver and spleen three-dimensional multifrequency MR elastography in liver cirrhosis. Eur. Radiol. 2014, 24, 1394–1402. [Google Scholar] [CrossRef] [PubMed]
- Yin, M.; Kolipaka, A.; Woodrum, D.A.; Glaser, K.J.; Romano, A.J.; Manduca, A.; Talwalkar, J.A.; Araoz, P.A.; McGee, K.P.; Anavekar, N.S.; et al. Hepatic and splenic stiffness augmentation assessed with MR elastography in an in vivo porcine portal hypertension model. J. Magn. Reson. Imaging 2013, 38, 809–815. [Google Scholar] [CrossRef] [PubMed]
- Cheng, Y.W.; Chang, Y.C.; Chen, Y.L.; Chen, R.C.; Chou, C.T. Feasibility of measuring spleen stiffness with MR elastography and splenic volume to predict hepatic fibrosis stage. PLoS ONE 2019, 14, e0217876. [Google Scholar] [CrossRef]
- Jhang, Z.E.; Wu, K.L.; Chen, C.B.; Chen, Y.L.; Lin, P.Y.; Chou, C.T. Diagnostic value of spleen stiffness by magnetic resonance elastography for prediction of esophageal varices in cirrhotic patients. Abdom. Radiol. 2021, 46, 526–533. [Google Scholar] [CrossRef]
- Morisaka, H.; Motosugi, U.; Ichikawa, S.; Sano, K.; Ichikawa, T.; Enomoto, N. Association of splenic MR elastographic findings with gastroesophageal varices in patients with chronic liver disease. J. Magn. Reson. Imaging 2015, 41, 117–124. [Google Scholar] [CrossRef]
- Shin, S.U.; Yu, M.H.; Yoon, J.H.; Han, J.K.; Choi, B.-I.; Glaser, K.J.; Ehman, R.L.; Lee, J.M.; Kang, H.-J.; Ahn, S.J.; et al. Prediction of esophageal varices in patients with cirrhosis: Usefulness of three-dimensional MR elastography with echo-planar imaging technique. Radiology 2014, 272, 143–153. [Google Scholar] [CrossRef]
- Jiang, X.; Asbach, P.; Streitberger, K.-J.; Thomas, A.; Hamm, B.; Braun, J.; Sack, I.; Guo, J. In vivo high-resolution magnetic resonance elastography of the uterine corpus and cervix. Eur. Radiol. 2014, 24, 3025–3033. [Google Scholar] [CrossRef]
- Kemper, J.; Sinkus, R.; Lorenzen, J.; Nolte-Ernsting, C.; Stork, A.; Adam, G. MR elastography of the prostate: Initial in-vivo application. Rofo 2004, 176, 1094–1099. [Google Scholar] [CrossRef]
- Lee, D.H.; Lee, J.M.; Han, J.K.; Choi, B.I. MR elastography of healthy liver parenchyma: Normal value and reliability of the liver stiffness value measurement. J. Magn. Reson. Imaging 2013, 38, 1215–1223. [Google Scholar] [CrossRef] [PubMed]
- Obrzut, M.; Atamaniuk, V.; Obrzut, B.; Ehman, R.; Cholewa, M.; Rzucidło, M.; Pozaruk, A.; Gutkowski, K. Normative values for magnetic resonance elastography-based liver stiffness in a healthy population. Pol. Arch. Intern. Med. 2019, 129, 321–326. [Google Scholar] [CrossRef] [PubMed]
- Shi, Y.; Glaser, K.J.; Venkatesh, S.K.; Ben-Abraham, E.I.; Ehman, R.L. Feasibility of using 3D MR elastography to determine pancreatic stiffness in healthy volunteers. J. Magn. Reson. Imaging 2015, 41, 369–375. [Google Scholar] [CrossRef]
- Talwalkar, J.A.; Yin, M.; Venkatesh, S.K.; Rossman, P.J.; Grimm, R.C.; Manduca, A.; Romano, A.; Kamath, P.S.; Ehman, R.L. Feasibility of in vivo MR elastographic splenic stiffness measurements in the assessment of portal hypertension. Am. J. Roentgenol. 2009, 193, 122–127. [Google Scholar] [CrossRef] [PubMed]
- Mannelli, L.; Godfrey, E.; Joubert, I.; Patterson, A.J.; Graves, M.J.; Gallagher, F.A.; Lomas, D.J. MR elastography: Spleen stiffness measurements in healthy volunteers—Preliminary experience. Am. J. Roentgenol. 2010, 195, 387–392. [Google Scholar] [CrossRef] [PubMed]
- Bamber, J.; Cosgrove, D.; Dietrich, C.F.; Fromageau, J.; Bojunga, J.; Calliada, F.; Cantisani, V.; Correas, J.-M.; D’Onofrio, M.; Drakonaki, E.E.; et al. EFSUMB guidelines and recommendations on the clinical use of ultrasound elastography. Part 1: Basic principles and technology. Ultraschall Med. 2013, 34, 169–184. [Google Scholar] [CrossRef]
- Cosgrove, D.; Piscaglia, F.; Bamber, J.; Bojunga, J.; Correas, J.-M.; Gilja, O.H.; Klauser, A.S.; Sporea, I.; Calliada, F.; Cantisani, V.; et al. EFSUMB guidelines and recommendations on the clinical use of ultrasound elastography. Part 2: Clinical applications. Ultraschall Med. 2013, 34, 238–253. [Google Scholar] [CrossRef]
- Arda, K.; Ciledag, N.; Aktas, E.; Aribas, B.K.; Kose, K. Quantitative assessment of normal soft-tissue elasticity using shear-wave ultrasound elastography. Am. J. Roentgenol. 2011, 197, 532–536. [Google Scholar] [CrossRef]
- Takuma, Y.; Nouso, K.; Morimoto, Y.; Tomokuni, J.; Sahara, A.; Toshikuni, N.; Takabatake, H.; Shimomura, H.; Doi, A.; Sakakibara, I.; et al. Measurement of spleen stiffness by acoustic radiation force impulse imaging identifies cirrhotic patients with esophageal varices. Gastroenterology 2013, 144, 92–101.e2. [Google Scholar] [CrossRef]
- Leung, V.Y.-F.; Shen, J.; Wong, V.W.-S.; Abrigo, J.; Wong, G.L.-H.; Chim, A.M.-L.; Chu, S.H.-T.; Chan, A.W.-H.; Choi, P.C.-L.; Ahuja, A.T.; et al. Quantitative elastography of liver fibrosis and spleen stiffness in chronic hepatitis B carriers: Comparison of shear-wave elastography and transient elastography with liver biopsy correlation. Radiology 2013, 269, 910–918. [Google Scholar] [CrossRef]
- Pawluś, A.; Inglot, M.S.; Szymańska, K.; Kaczorowski, K.; Markiewicz, B.D.; Kaczorowska, A.; Gąsiorowski, J.; Szymczak, A.; Inglot, M.; Bladowska, J.; et al. Shear wave elastography of the spleen: Evaluation of spleen stiffness in healthy volunteers. Abdom. Radiol. 2016, 41, 2169–2174. [Google Scholar] [CrossRef] [PubMed]
- Giuffrè, M.; Macor, D.; Masutti, F.; Abazia, C.; Tinè, F.; Patti, R.; Buonocore, M.R.; Colombo, A.; Visintin, A.; Campigotto, M.; et al. Evaluation of spleen stiffness in healthy volunteers using point shear wave elastography. Ann. Hepatol. 2019, 18, 736–741. [Google Scholar] [CrossRef] [PubMed]


| Descriptives | |||
|---|---|---|---|
| Parameter | Range | Mean [SD] | |
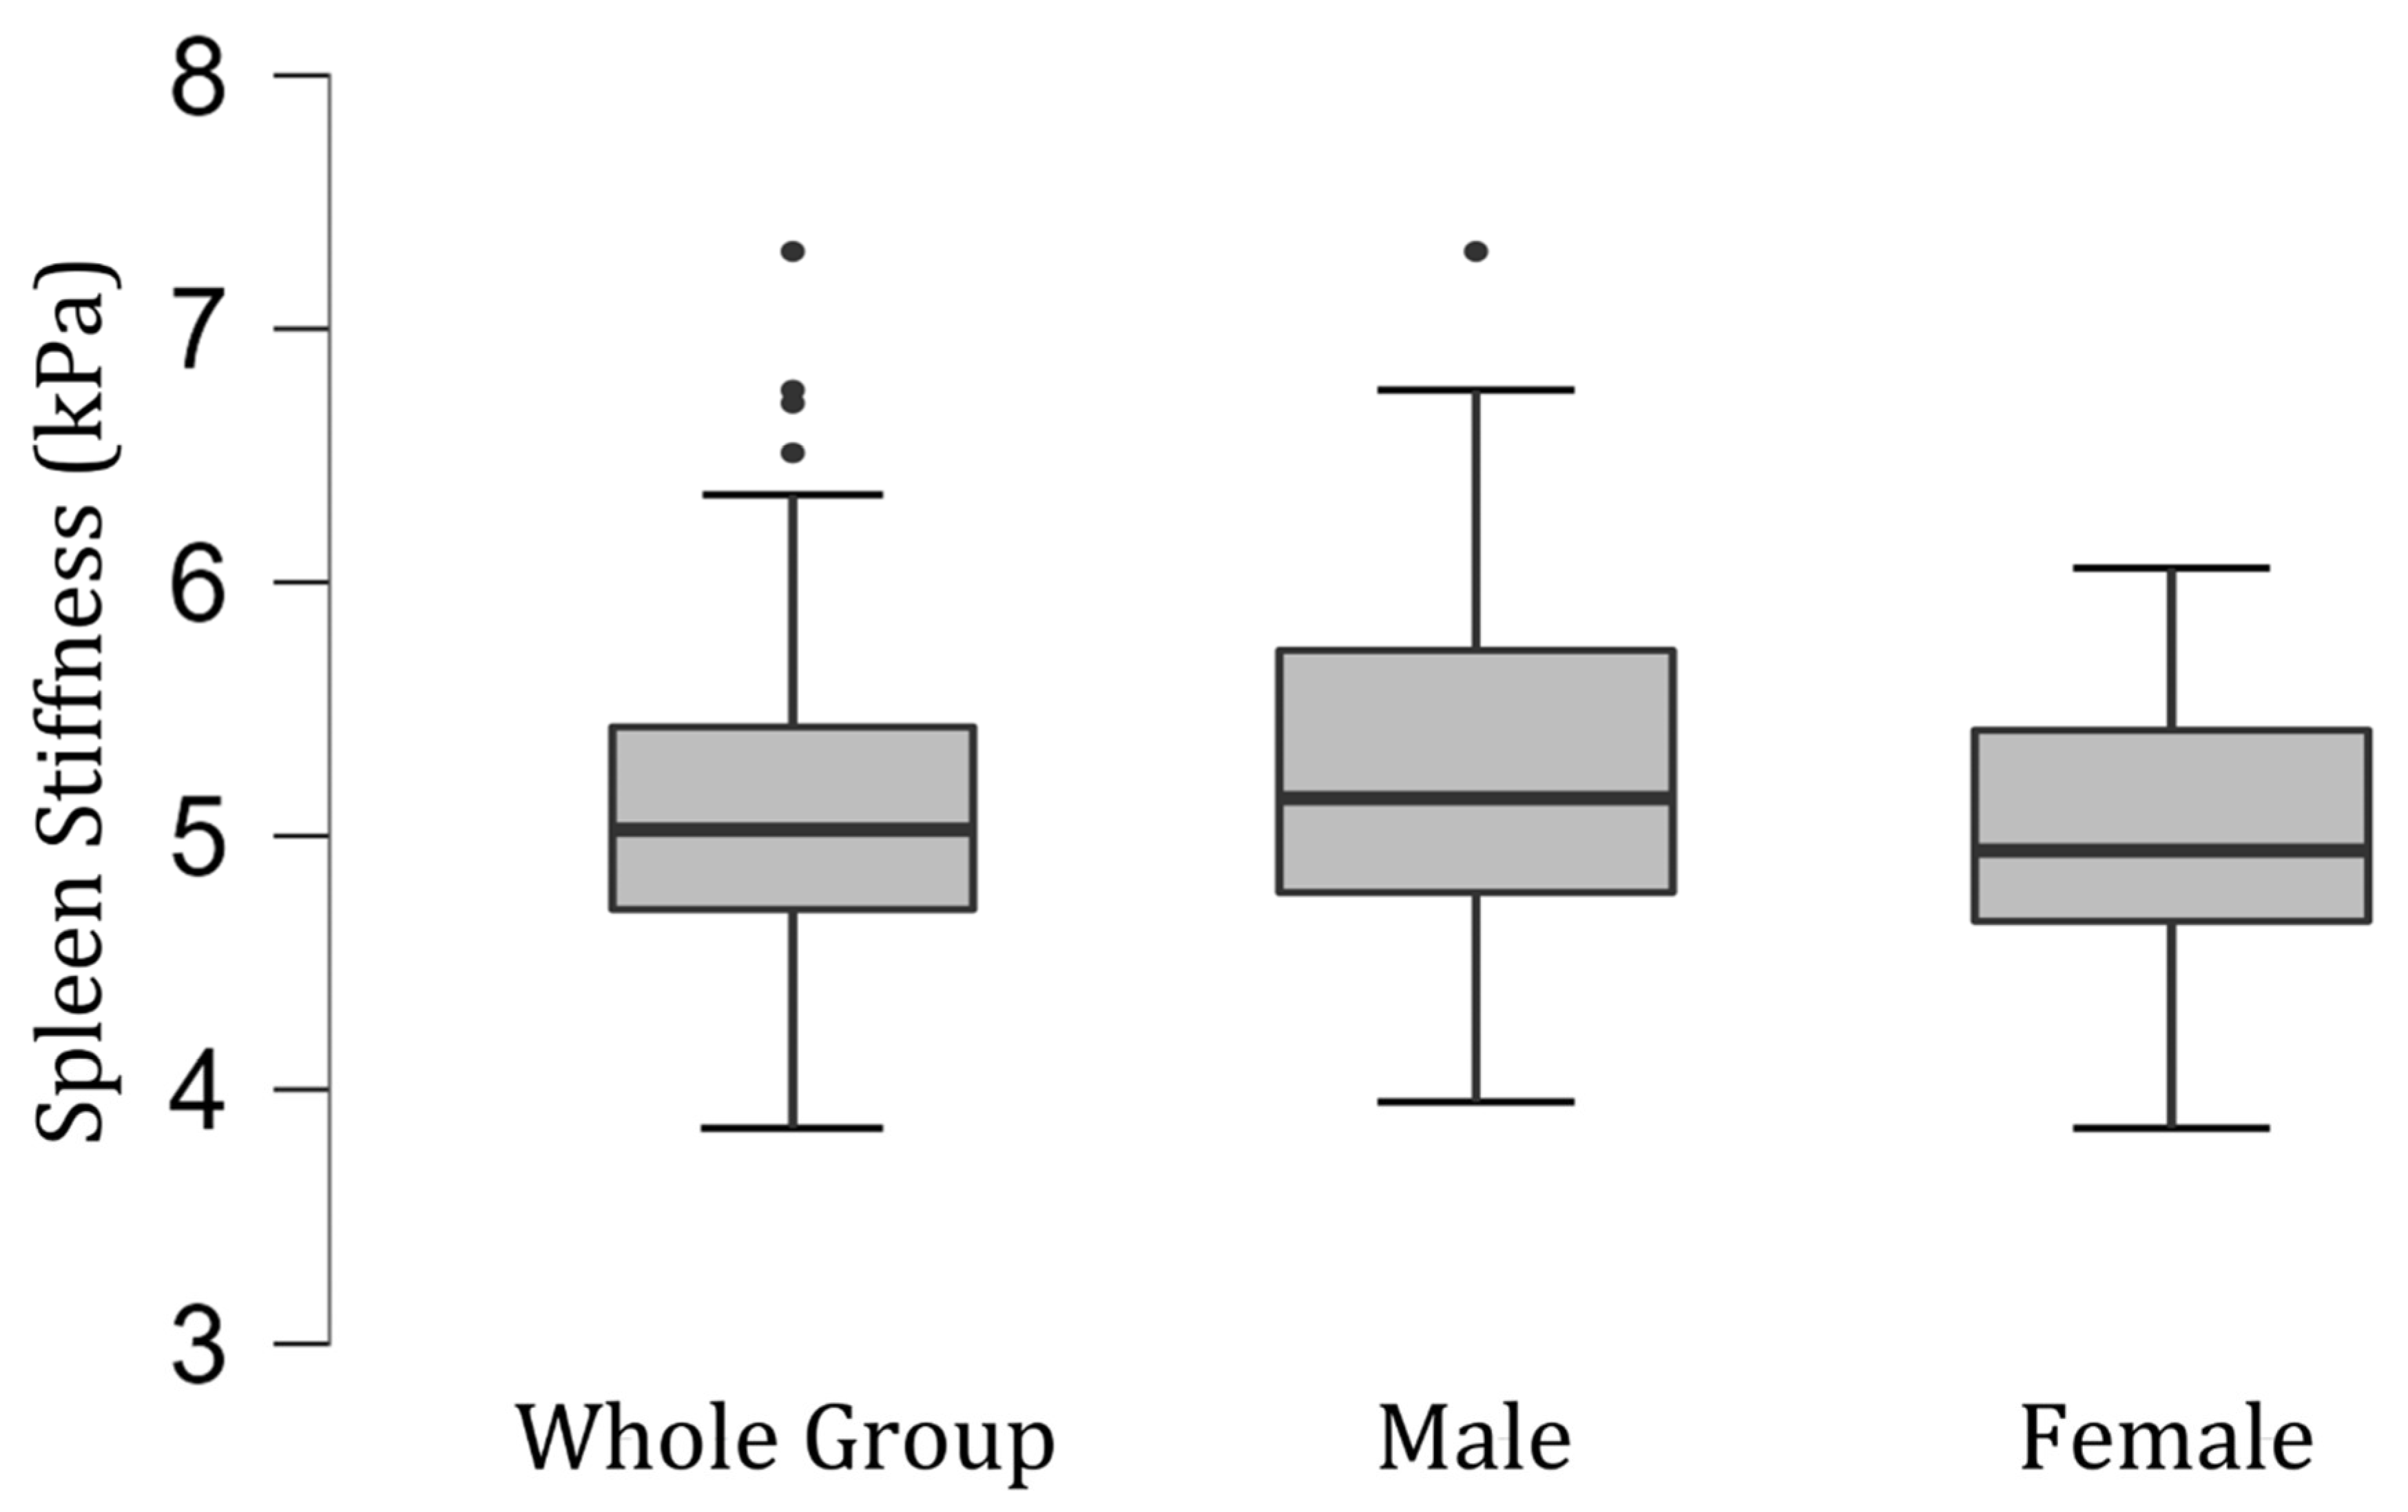
| Spleen Stiffness | Male | 3.99–7.24 kPa | 5.28 [0.78] kPa |
| Female | 3.89–6.03 kPa | 4.98 [0.51] kPa | |
| Whole Group | 3.89–7.24 kPa | 5.09 [0.65] kPa | |
| BMI | 16.85–25.76 kg/m2 | 21.33 [2.16] kg/m2 | |
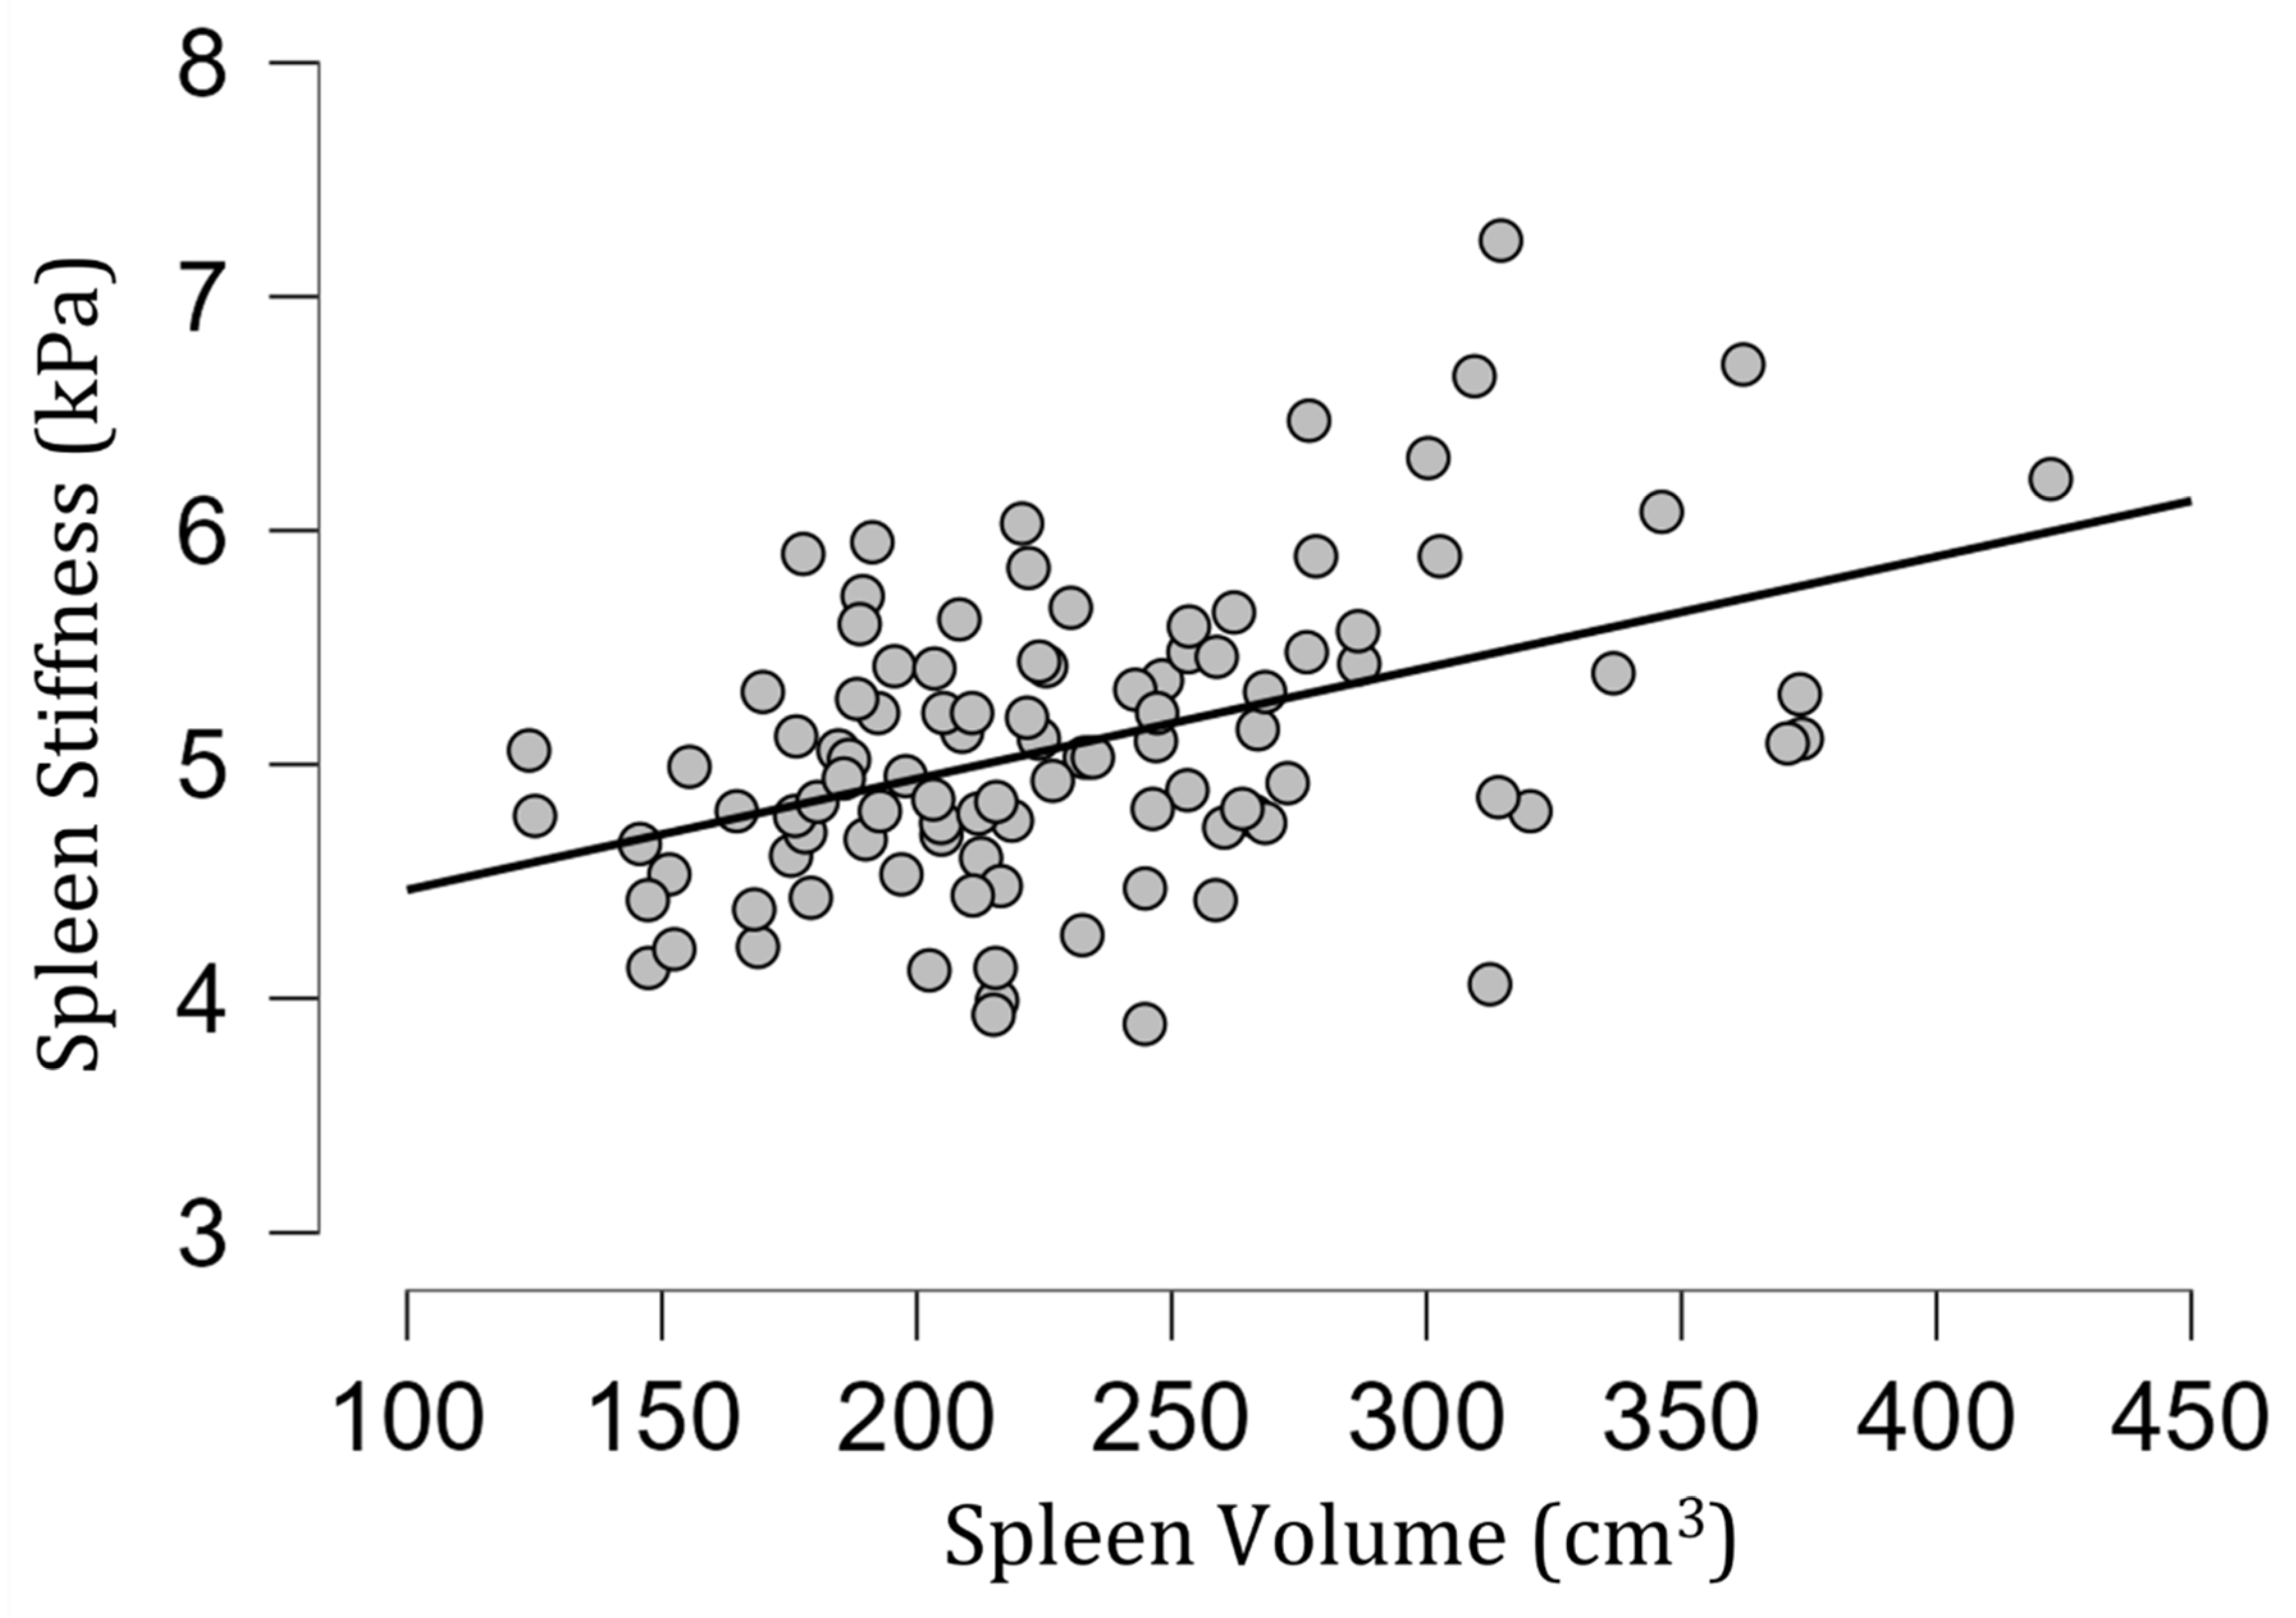
| Spleen Volume | 123.94–422.43 cm3 | 231.13 [58.44] cm3 | |
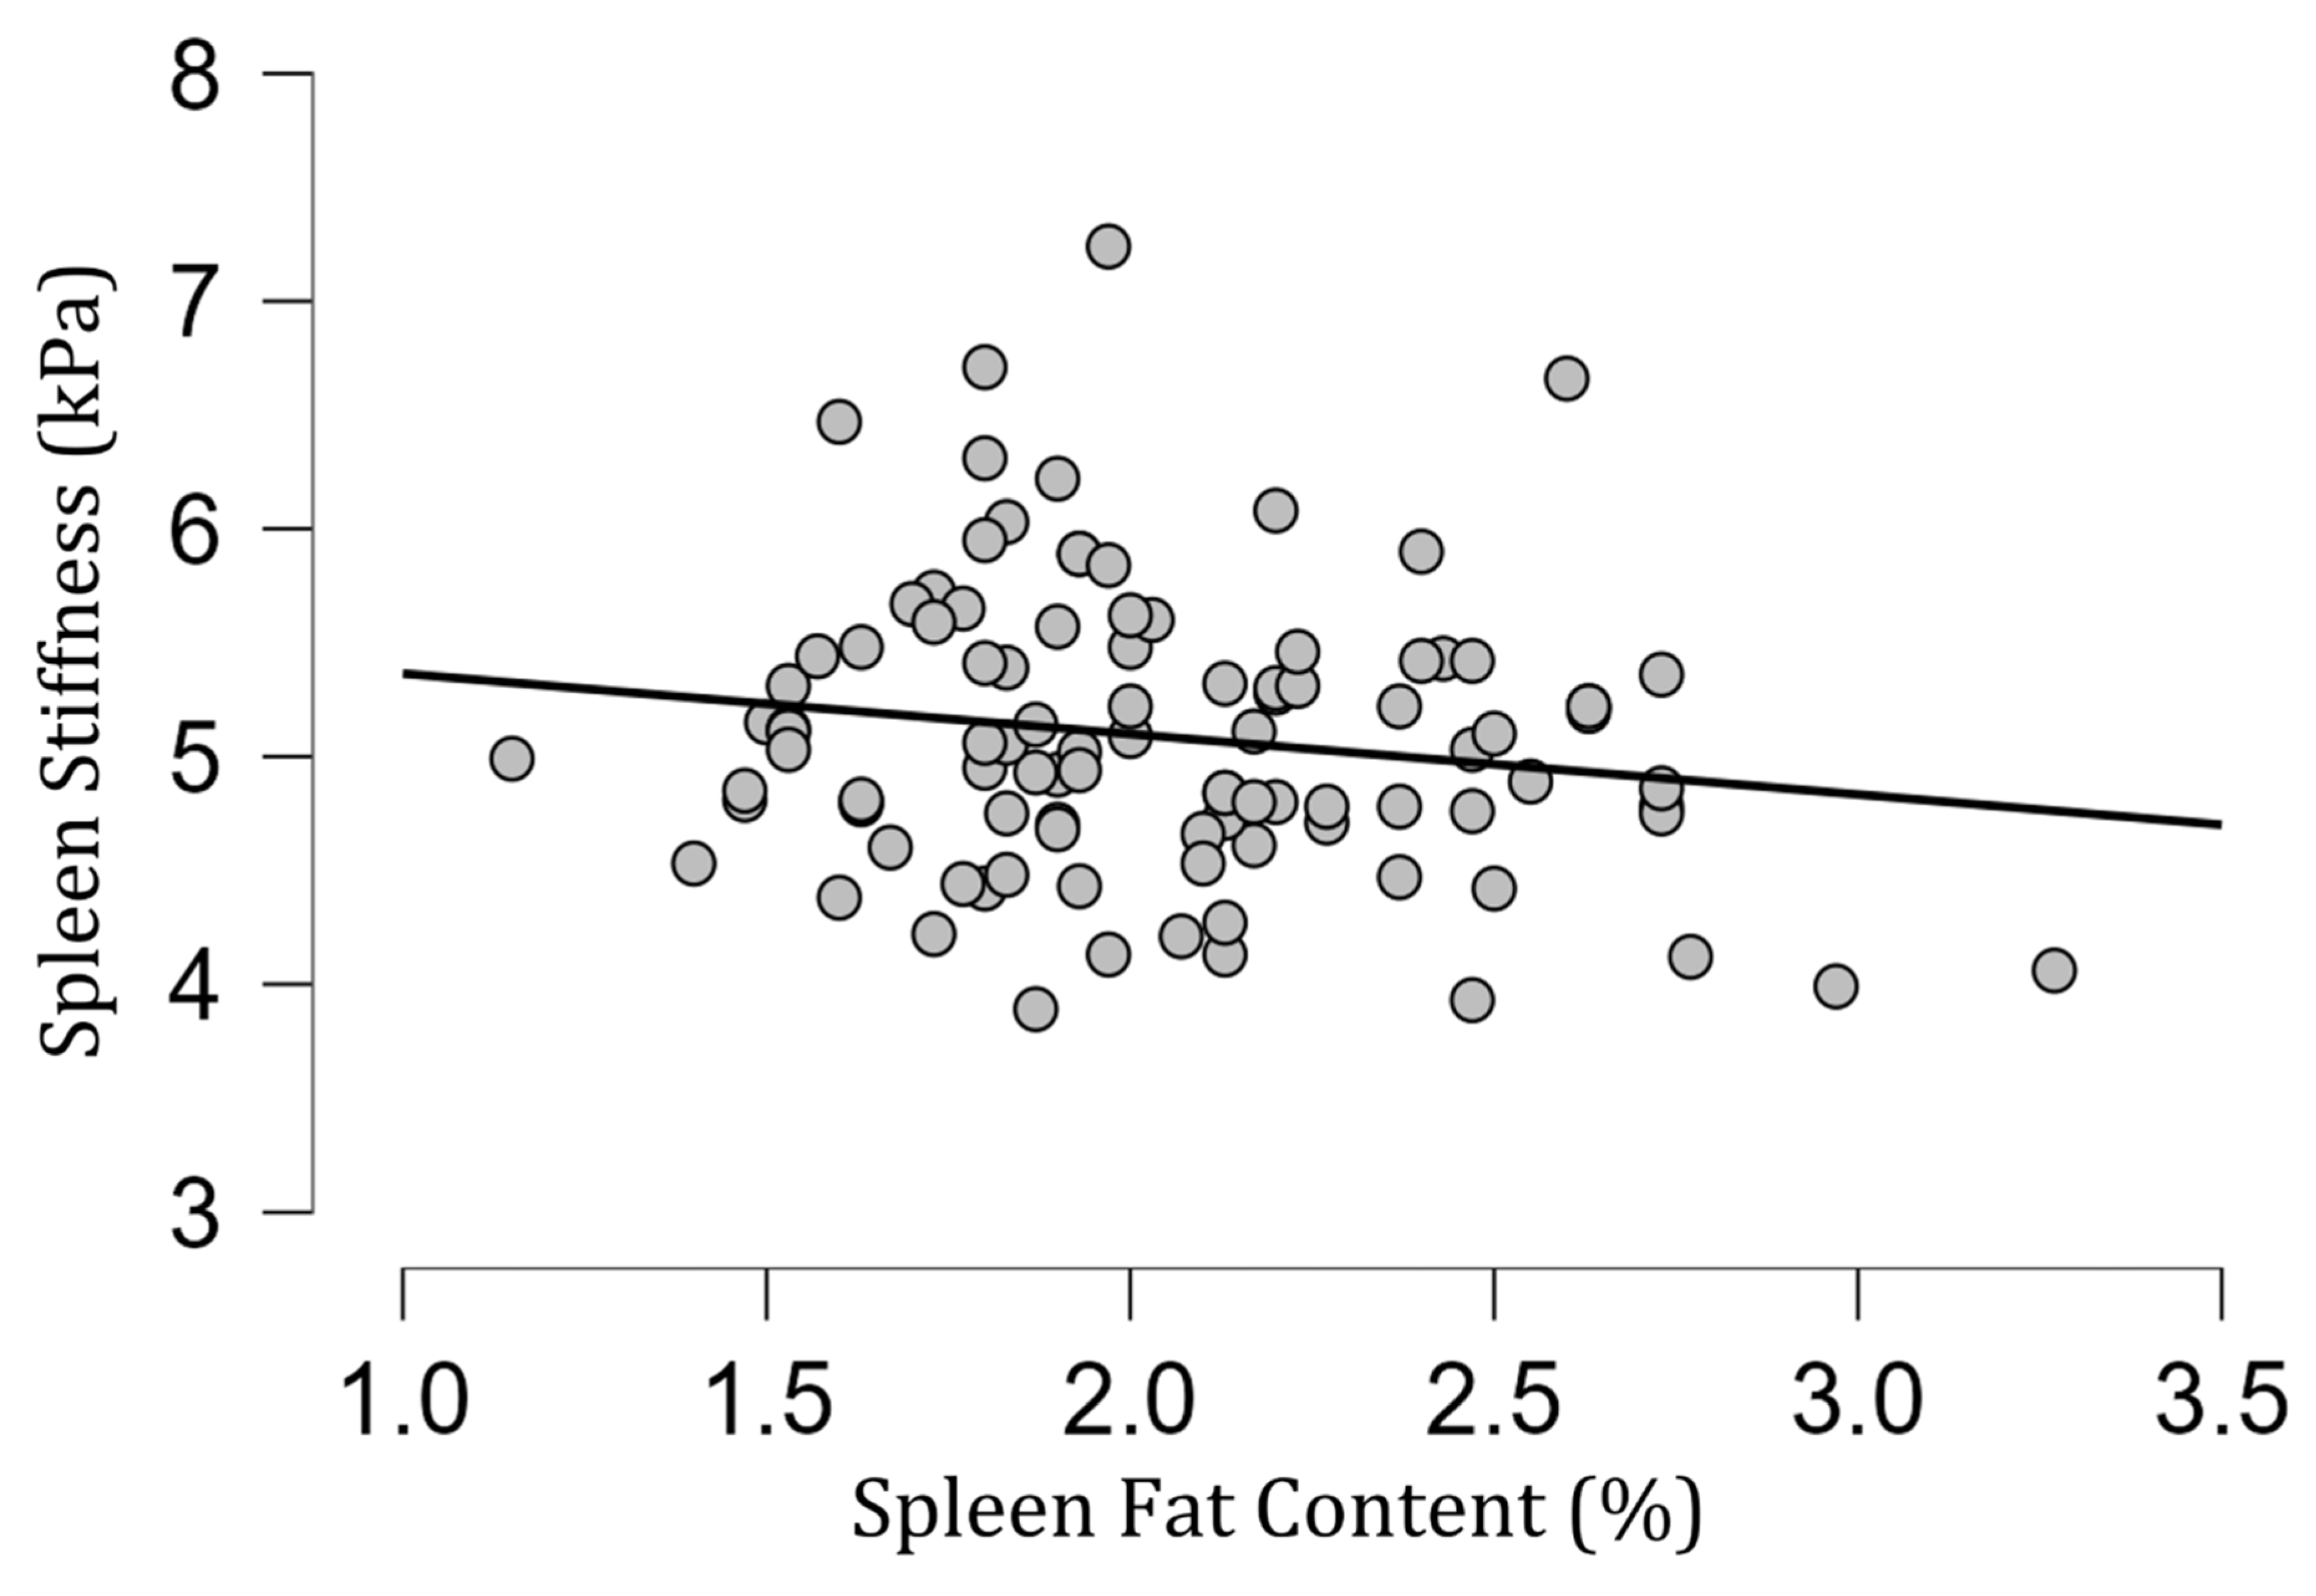
| Spleen Fat Content | 1.15–3.27% | 2.04 [0.39]% | |
| Correlation Results | |||
| Spleen Stiffness and Sex | p = 0.12 | ||
| Spleen Stiffness and Spleen Fat Content | rho = −0.13; p = 0.20 | ||
| Spleen Stiffness and R2* | rho = 0.03; p = 0.74 | ||
| Spleen Stiffness and BMI | rho = 0.09; p = 0.36 | ||
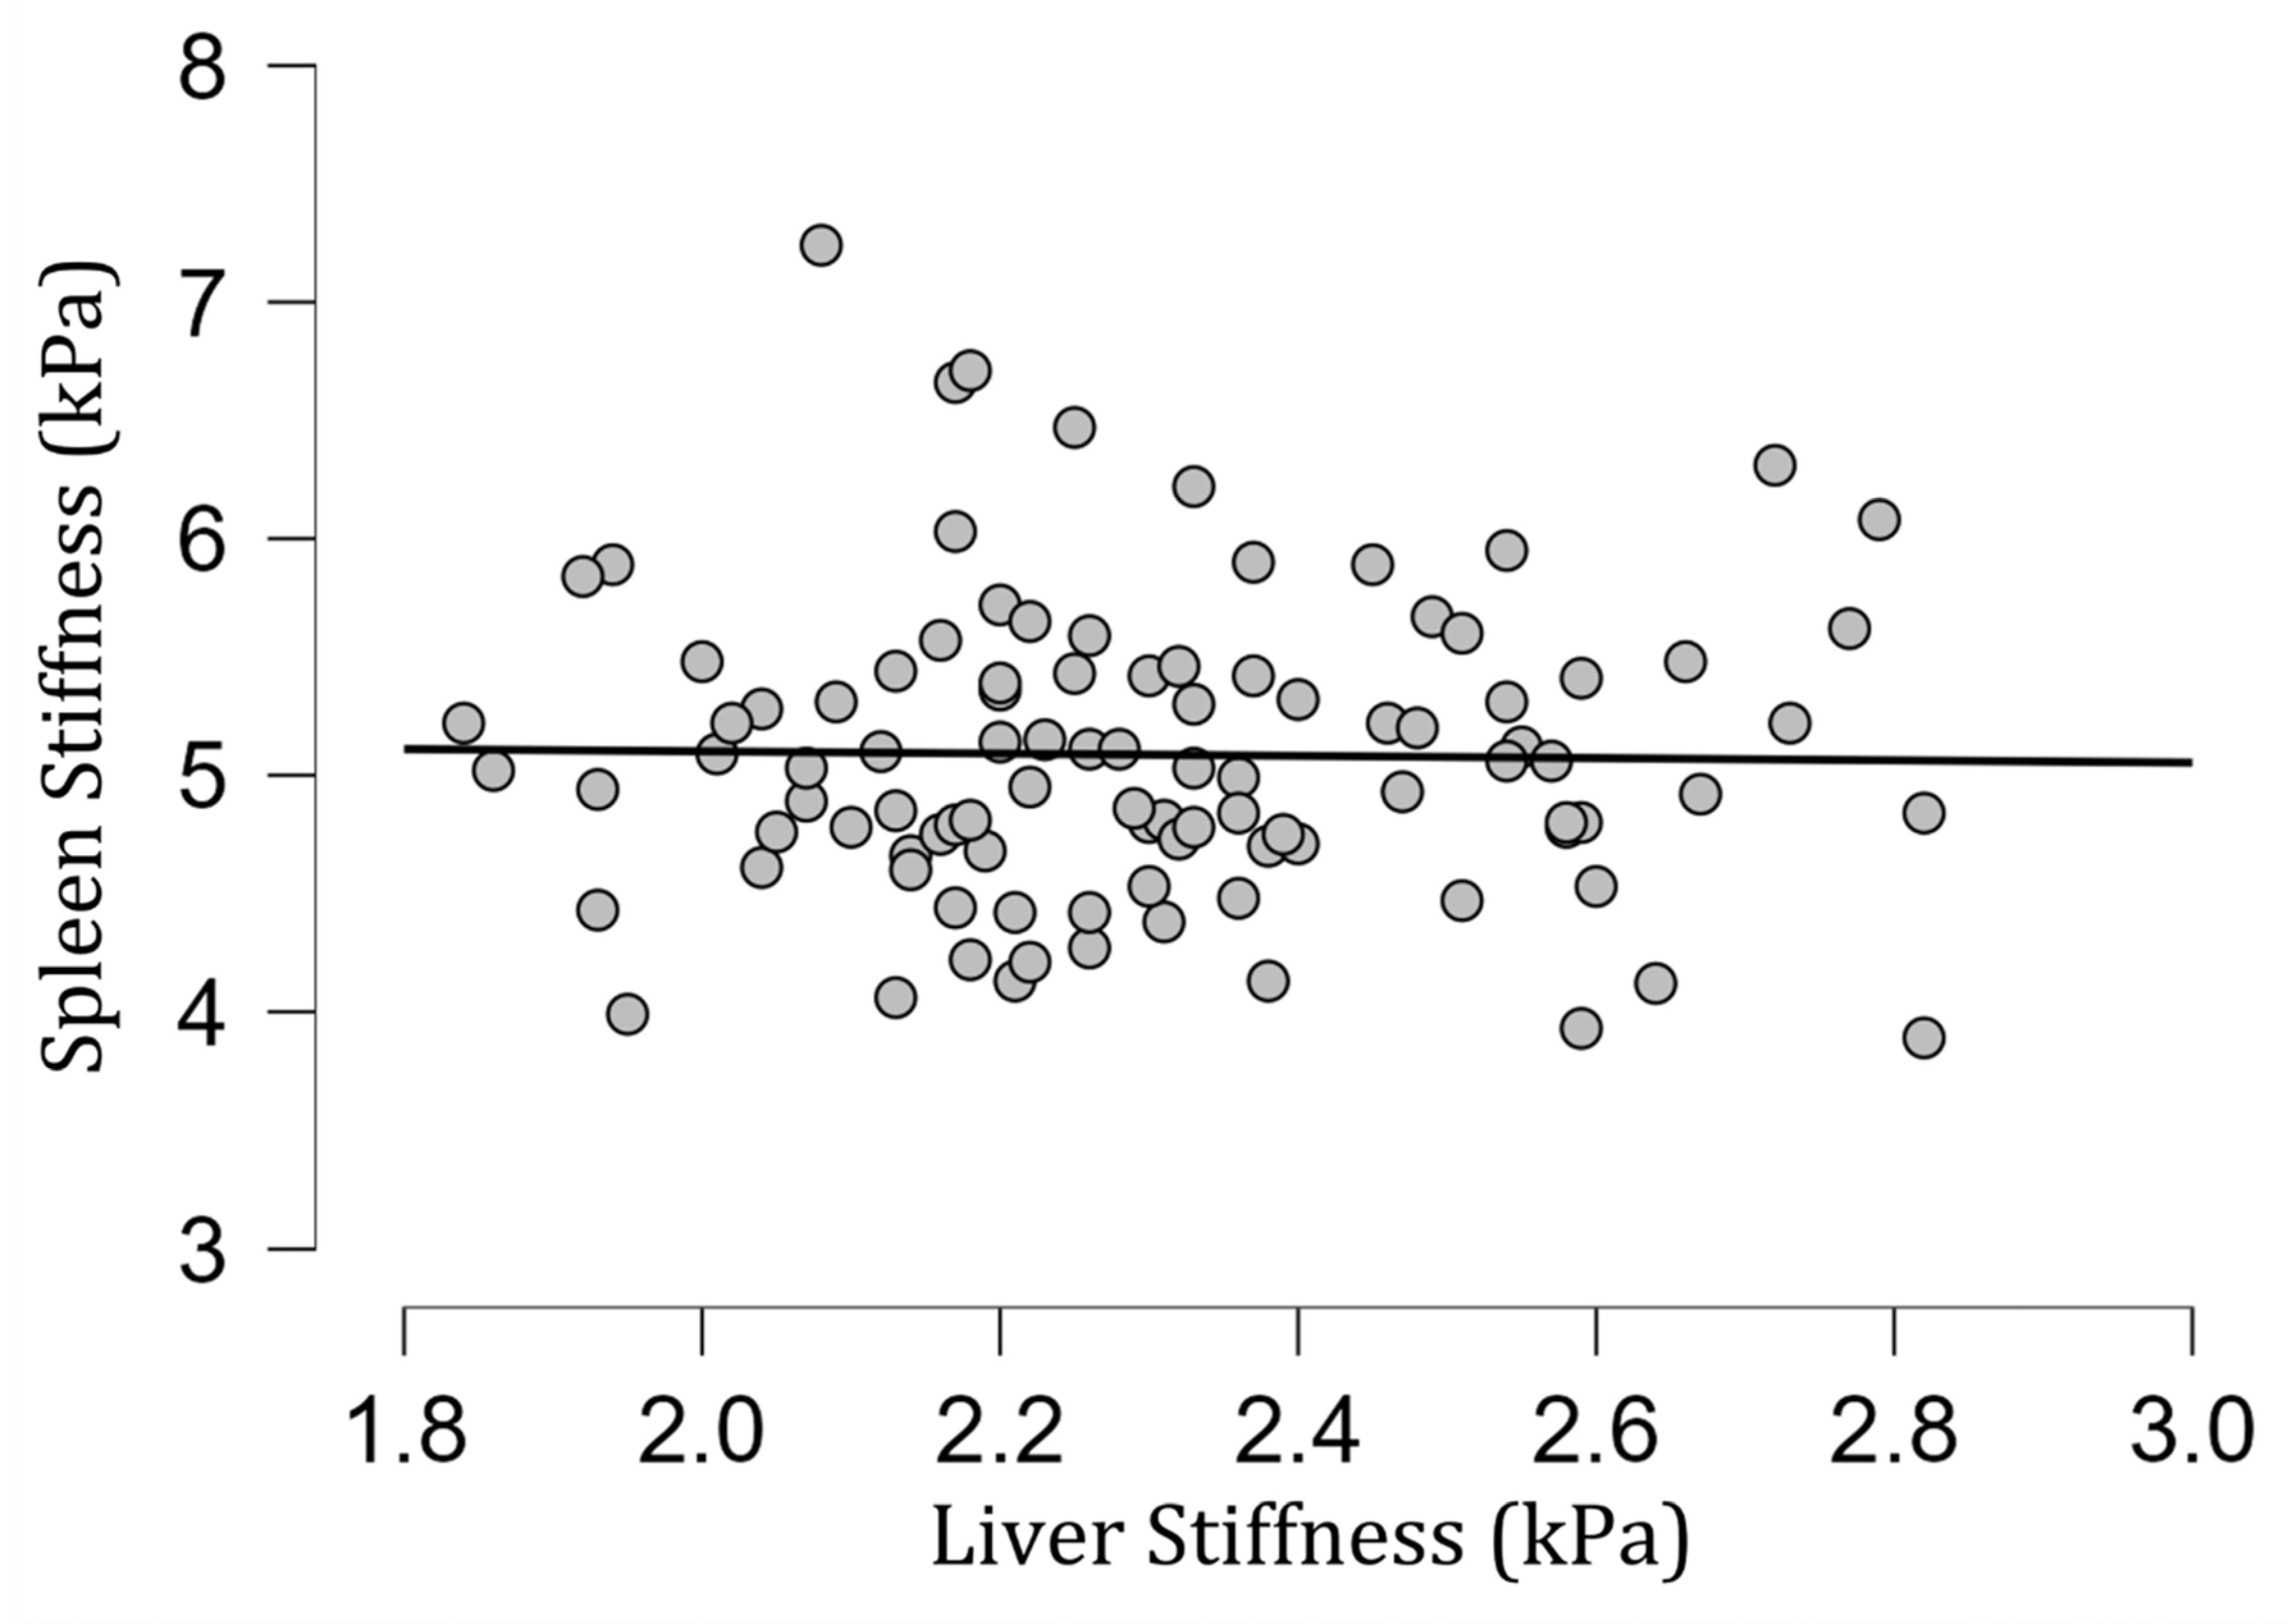
| Spleen Stiffness and Liver Stiffness | rho = 0.01; p = 0.95 | ||
| Spleen Stiffness and Spleen Volume | rho = 0.40, p < 0.001 | ||
Disclaimer/Publisher’s Note: The statements, opinions and data contained in all publications are solely those of the individual author(s) and contributor(s) and not of MDPI and/or the editor(s). MDPI and/or the editor(s) disclaim responsibility for any injury to people or property resulting from any ideas, methods, instructions or products referred to in the content. |
© 2023 by the authors. Licensee MDPI, Basel, Switzerland. This article is an open access article distributed under the terms and conditions of the Creative Commons Attribution (CC BY) license (https://creativecommons.org/licenses/by/4.0/).
Share and Cite
Obrzut, M.; Atamaniuk, V.; Ehman, R.L.; Yin, M.; Cholewa, M.; Gutkowski, K.; Domka, W.; Ozga, D.; Obrzut, B. Evaluation of Spleen Stiffness in Young Healthy Volunteers Using Magnetic Resonance Elastography. Diagnostics 2023, 13, 2738. https://doi.org/10.3390/diagnostics13172738
Obrzut M, Atamaniuk V, Ehman RL, Yin M, Cholewa M, Gutkowski K, Domka W, Ozga D, Obrzut B. Evaluation of Spleen Stiffness in Young Healthy Volunteers Using Magnetic Resonance Elastography. Diagnostics. 2023; 13(17):2738. https://doi.org/10.3390/diagnostics13172738
Chicago/Turabian StyleObrzut, Marzanna, Vitaliy Atamaniuk, Richard L. Ehman, Meng Yin, Marian Cholewa, Krzysztof Gutkowski, Wojciech Domka, Dorota Ozga, and Bogdan Obrzut. 2023. "Evaluation of Spleen Stiffness in Young Healthy Volunteers Using Magnetic Resonance Elastography" Diagnostics 13, no. 17: 2738. https://doi.org/10.3390/diagnostics13172738
APA StyleObrzut, M., Atamaniuk, V., Ehman, R. L., Yin, M., Cholewa, M., Gutkowski, K., Domka, W., Ozga, D., & Obrzut, B. (2023). Evaluation of Spleen Stiffness in Young Healthy Volunteers Using Magnetic Resonance Elastography. Diagnostics, 13(17), 2738. https://doi.org/10.3390/diagnostics13172738