Abstract
We investigated whether 18F-fluorodeoxyglucose positron emission tomography (PET)/computed tomography images restored via deep learning (DL) improved image quality and affected axillary lymph node (ALN) metastasis diagnosis in patients with breast cancer. Using a five-point scale, two readers compared the image quality of DL-PET and conventional PET (cPET) in 53 consecutive patients from September 2020 to October 2021. Visually analyzed ipsilateral ALNs were rated on a three-point scale. The standard uptake values SUVmax and SUVpeak were calculated for breast cancer regions of interest. For “depiction of primary lesion”, reader 2 scored DL-PET significantly higher than cPET. For “noise”, “clarity of mammary gland”, and “overall image quality”, both readers scored DL-PET significantly higher than cPET. The SUVmax and SUVpeak for primary lesions and normal breasts were significantly higher in DL-PET than in cPET (p < 0.001). Considering the ALN metastasis scores 1 and 2 as negative and 3 as positive, the McNemar test revealed no significant difference between cPET and DL-PET scores for either reader (p = 0.250, 0.625). DL-PET improved visual image quality for breast cancer compared with cPET. SUVmax and SUVpeak were significantly higher in DL-PET than in cPET. DL-PET and cPET exhibited comparable diagnostic abilities for ALN metastasis.
1. Introduction
18F-fluorodeoxyglucose positron emission tomography/computed tomography (18F-FDG PET/CT) is a noninvasive technique for detecting morphological changes and metabolic activities associated with malignancy [1,2]. It is useful for identifying distant metastases or secondary cancers associated with breast cancer and predicting their prognosis and therapeutic effects [1,3,4]. However, for several years, the noise and low spatial resolution of PET, which hinder its sensitivity, have been an issue [5,6,7]. Recently, PET scanners have been updated with technologies such as time-of-flight [2], digital output [8], and dedicated breast imaging [9] technologies to improve image quality.
Deep learning (DL) is a field of artificial intelligence wherein computers are not explicitly programmed but can analyze relationships among existing data and perform tasks based on new data [10]. DL has been applied in various fields, including breast PET-based research. Sato et al. created an Xception-based DL model using dedicated breast PET to detect breast cancer, reporting that its diagnostic performance was comparable with that of expert radiologists [11]. Takahashi et al. developed an Xception-based DL model that employed maximum-intensity projection PET images to detect breast cancer, revealing that its diagnostic performance was significantly better than that of the single radiologist participating in their study [12]. Moreau et al. used the no-new-Net method to segment bone and bone metastatic lesions of breast cancer [13]. Choi et al. used AlexNet to predict patient responses to neoadjuvant chemotherapy for advanced breast cancer. They found that compared with PET and magnetic resonance imaging (MRI) parameters, DL application improved the area under the curve [14].
DL technology is already in practical use to improve CT and MRI images by reducing noise and artifacts without reducing spatial resolution [15,16]. Replacing the image reconstruction process with DL improved the image quality of low-dose CT and shortened the MRI data acquisition time [15,16]. A previous study investigated the image quality improvement engendered by DL-based PET for 49 different malignancies and 1 case of Takayasu arteritis [17]. Another study evaluating the image quality obtained via digital PET/CT included 30 malignancies and 3 inflammations [18]. According to those studies, the noise was lower and lesion delineation and image quality were superior in the PET images restored using the DL method compared with the images produced using conventional reconstruction. Noise reduction using the DL algorithm increased the standard uptake values (SUVs) compared with those obtained via conventional reconstruction in most healthy tissues and tumors. However, the role of DL imaging in actual diagnosis is yet to be established [17,18].
Herein, we used the Advanced intelligent Clear-IQ Engine (AiCE), developed by Canon Medical Systems Corporation (Otawara, Japan) [18], to perform the DL method to investigate whether restoration via this method improved PET image quality and affected the diagnosis of ipsilateral axillary lymph node (ALN) metastasis in patients with breast cancer. To the best of our knowledge, this is the first study to examine the diagnostic ability of production-based PET using the DL algorithm with improved image quality. 18F-FDG PET/CT restored using the DL method might be useful for application in daily clinical practice.
2. Materials and Methods
2.1. Study Design and Patients
This retrospective study was approved by the medical ethics committee of our hospital (no. M2020-339).
The study enrolled consecutive patients with pathologically proven breast cancer who underwent 18F-FDG PET/CT before surgery or neoadjuvant therapy at our hospital from September 2020 to October 2021. Only the patients imaged using digital PET were enrolled. Two patients who had a recent history (within 2 months) of vaccination for COVID-19 on the shoulder ipsilateral to their breast cancer, which was likely to affect the diagnosis of ALN metastasis, were excluded. We excluded one patient with numerous superficial lymph nodes exhibiting FDG accumulation, probably owing to dermatitis. One patient with four simultaneous breast cancers was excluded as the breast cancer responsible for ALN accumulation could not be identified. One patient whose DL images were unavailable was excluded as the radiologist did not restore the DL images and deleted the raw data. The final cohort comprised 55 breast cancers in 53 patients. One patient had cancers in both the left and right breasts, and another patient had two cancers in the same breast.
2.2. 18F-FDG PET/CT Protocol
All patients were intravenously administered 18F-FDG (3.7 MBq/kg) after a minimum fasting period of 4 h. Whole-body images were routinely obtained using a digital PET/CT system (Cartesion Prime: Canon Medical Systems Corporation, Otawara, Tochigi, Japan). CT was performed using the following parameters: pitch, 0.813; gantry rotation time, 0.5 s; table time, 30 mm/s; autoexposure control (SD 20), 120 KVp; and slice thickness, 2.0 mm. Contrast materials were not used for the CT examinations. After ~60 min of 18F-FDG administration, whole-body emission PET was performed using the following parameters: emission time per bed, 90 s; bed position, 6–7; slice thickness, 2.11 mm; and matrix, 336 × 336.
2.3. Image Reconstruction
AiCE was used to obtain the DL-PET images. The conventional PET (cPET) images for comparison were reconstructed using the three-dimensional time-of-flight and ordered subset expectation maximization methods with 12 subsets, 2 iterations, scatter correction, attenuation correction, point spread function omission, and a Gaussian 3.00-mm postfilter.
2.4. Image Analysis
Two breast radiologists with 8 and 13 years of experience in breast imaging individually used EV Insite R viewer software (PSP Corporation, Tokyo, Japan) to visually assess the axial PET images. The radiologists were blinded to whether they were assessing DL-PET or cPET images. They were aware of the position of the breast cancers in the left and right breast quadrants. The “depiction of primary lesion” score was defined as either 1, not visible; 2, indistinguishable from the background; 3, slight accumulation; 4, clearly visible; or 5, very clearly visible. The “noise” score was defined as either 1, not suitable for diagnosis; 2, noise inseparable from the accumulation; 3, noise that did not obscure the accumulation; 4, little noise; or 5, almost no noise. “Clarity of mammary gland” and “overall image quality” scores were both defined as either 1, extremely poor; 2, poor; 3, fair; 4, good; or 5, excellent.
Both radiologists further visually analyzed the ipsilateral ALNs, which they scored as either 1, negative; 2, intermediate; or 3, positive, with 1 indicating no evident ALN metastasis and 3 indicating the presence of ALN metastasis. If ALN accumulation was clear but the presence or absence of metastasis was difficult to determine, a score of 2 was given. For one patient with duplicate unilateral breast cancers, we considered that the ALN metastasis was associated with the larger breast cancer.
A region of interest was circled on each breast cancer image to calculate the SUVmax and SUVpeak by a reader with 8 years of experience in breast imaging using a VOX-BASE image reader (version 2.8: J-Mac System, Inc., Hokkaido, Japan). The region of interest located on the contralateral breast at the maximum accumulation site, excluding the nipple, was considered the normal breast reference. A patient whose data was not sent to VOX-BASE was excluded. The contralateral breast SUV of one patient with ipsilateral double breast cancer was measured for the larger breast cancer. For one patient with bilateral breast cancer, the region of interest was selected to exclude the breast cancers to evaluate the normal breast.
2.5. Clinicopathologic Evaluation
Age, sex, and pathology data were obtained from the medical records of the patients. The surgical specimens of the breast tissue were sectioned by pathologists into 5–10 mm contiguous sections, and thinner slices were obtained as required. All surgical and biopsy specimens were evaluated by a pathologist who recorded the following histologic features: tumor size of an invasive component; nuclear grade (1, 2, or 3); presence of vascular and lymphatic invasion; receptor status (estrogen receptor, progesterone receptor, or HER2); and Ki-67 staining. A cutoff of 1% was used for the estrogen and progesterone receptor assays, as specified in the American Society of Clinical Oncology/College of American Pathologists guidelines [19]. The HER2 status was considered positive for 3+ scores in immunohistochemistry or if fluorescence in situ hybridization demonstrated gene amplification [20].
2.6. Statistical Analysis
Any difference in each visual analysis score between cPET and DL-PET was evaluated using the IBM SPSS Statistics software application (version 24: IBM Corporation, NY, USA). Kolmogorov–Smirnov test was used to assess whether SUVs were normally distributed. Two-tailed paired samples t-test was used for normal distributions and Wilcoxon signed-rank test was used for non-normal distributions to confirm whether SUVs differed significantly between the DL-PET and cPET images. Marginal homogeneity and McNemar tests were performed to investigate whether the ALN metastasis scores of the cPET and DL-PET matched. A p-value of <0.05 was considered statistically significant.
3. Results
3.1. Patients
All 53 patients with 55 breast cancers were women. The mean age of the cohort was 59.85 ± 14.38 (range, 37–88) years. Of the 53 patients, 51 underwent biopsy at an average of 25.35 ± 20.88 (range, 1–41) days before 18F-FDG PET/CT. Of the 45 patients who underwent surgery, the mean interval from 18F-FDG PET/CT to surgery was 37.51 ± 15.54 (range, 9–76) days. Surgery revealed invasive ductal carcinomas of no special type (n = 34) and in situ ductal (n = 6), invasive lobular (n = 1), mucinous (n = 1), apocrine (n = 1), secretory (n = 1), invasive solid papillary (n = 1), micro-invasive ductal (n = 1), and micro-invasive apocrine (n = 1) carcinomas. The average invasive diameter of the resected breast cancers was 14.10 ± 10.83 (range, 0–40) mm. The remaining 8 lesions were diagnosed as invasive ductal carcinomas of no special type (n = 7) or invasive lobular carcinoma (n = 1) via biopsy. The average Ki-67 staining in the 55 breast cancers was 23.52% ± 15.89% (range, 1–63.9%). Table 1 presents the biomarker status of the cancers.

Table 1.
Pathology results of the 55 breast cancers.
3.2. Visual Analysis
For “depiction of primary lesion”, the average score provided by reader 1 was higher for DL-PET than for cPET; however, no significant difference was observed (4.673 ± 0.695 vs. 4.455 ± 0.857, p = 0.121). Conversely, the score provided by reader 2 for DL-PET was significantly higher than that for cPET (4.364 ± 0.969 vs. 4.000 ± 1.089, p = 0.049). The scores of readers 1 and 2 for DL-PET were significantly higher than those for cPET in terms of “noise” (reader 1, 4.782 ± 0.498 vs. 4.073 ± 0.663, p < 0.001; reader 2, 4.491 ± 0.573 vs. 3.855 ± 0.621, p < 0.001), “clarity of mammary gland” (reader 1, 4.309 ± 0.836 vs. 3.909 ± 0.727, p = 0.003; reader 2, 4.109 ± 0.737 vs. 3.291 ± 0.737, p < 0.001), and “overall image quality” (reader 1, 4.636 ± 0.557 vs. 4.073 ± 0.663, p < 0.001; reader 2, 4.473 ± 0.539 vs. 3.904 ± 0.470, p < 0.001). The relevant data are shown in Table 2. Figure 1 shows a sample PET from a patient with some visual analysis scores higher in DL-PET than in cPET.
Table 2.
Visual analysis scores.
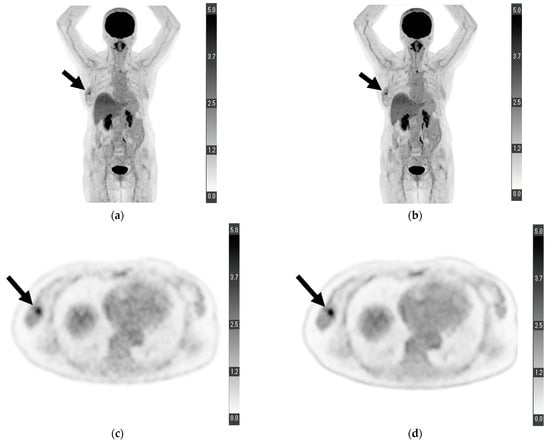
Figure 1.
Maximum-intensity projection of (a) conventional positron emission tomography (PET) reconstruction and (b) deep learning (DL) PET restoration of a woman in her 60 s with invasive ductal carcinoma in the right breast (arrows): invasive diameter, 15 mm; nuclear grade, 2; lymphatic invasion, negative; vascular invasion, negative; estrogen receptor, positive; progesterone receptor, positive; HER2 receptor, positive; Ki-67 staining, 25.5%; and nodal stage, 0. Axial view of a tumor cross-section for the same woman using (c) cPET reconstruction and (d) DL-PET restoration. Images were scored on a five-point scale from 1 = extremely poor to 5 = excellent. The scores of reader 1 for “depiction of the primary lesion”, “noise”, “clarity of mammary gland”, and “overall image quality” were 4, 5, 5, and 5 for cPET and 5, 5, 5, and 5 for DL-PET, respectively; the scores of reader 2 were 3, 4, 4, and 4 for cPET and 5, 5, 5, and 5 for DL-PET, respectively.
3.3. SUVs
Table 3 presents the results of the Kolmogorov–Smirnov test, and Table 4 presents the results of the two-tailed paired samples t-test and Wilcoxon signed-rank test. The SUVmax and SUVpeak in primary breast cancer were significantly higher in DL-PET restorations than in cPET reconstructions (SUVmax, 8.954 ± 6.544 vs. 7.220 ± 5.161, p < 0.001; SUVpeak, 4.564 ± 3.828 vs. 4.413 ± 3.667, p < 0.001). Similarly, in normal breast tissue, the SUVmax and SUVpeak were observed to be significantly higher in DL-PET restorations than in cPET reconstructions (SUVmax, 1.771 ± 0.716 vs. 1.612 ± 0.572, p < 0.001; SUVpeak, 1.612 ± 0.572 vs. 1.235 ± 0.393, p < 0.001).
Table 3.
Kolmogorov–Smirnov test for standardized uptake values (SUVs).
Table 4.
SUVs.
3.4. ALN Metastasis
The group positive for ALN metastases included 13 breast cancers diagnosed by surgery or biopsy in 13 patients and 1 stage IV cancer in a patient with clearly imaged metastases. The group negative for ALN metastasis included 33 patients with no metastases on surgery or biopsy and 3 patients with metastases <2 mm (N1 mi). Three patients whose ALNs were not pathologically diagnosed or who had smaller unilaterally duplicated breast cancers were excluded.
Table 5 shows the results of the visual analysis for the presence or absence of ALN metastasis. The marginal homogeneity test revealed a significant difference in the scores assigned to cPET reconstructions and DL-PET restorations by reader 1 (p = 0.034) but not by reader 2 (p = 0.439). When the scores of 1 and 2 were defined as negative and a score of 3 was defined as positive, the sensitivity, specificity, positive predictive value, negative predictive value, and accuracy were 57.14%, 94.59%, 80.00%, 85.37%, and 84.31% for cPET and 64.29%, 89.19%, 69.23%, 86.84%, and 82.35% for DL-PET, respectively, according to reader 1. Per the McNemar test, the scores of reader 1 for cPET and DL-PET were not significantly different (p = 0.250). According to the evaluation of reader 2, the sensitivity, specificity, positive predictive value, negative predictive value, and accuracy were 42.86%, 94.59%, 75.00%, 81.40%, and 80.39% for cPET and 50.00%, 91.89%, 70.00%, 82.93%, and 80.39% for DL-PET, respectively (Table 6). Per the McNemar test, the scores of reader 2 for cPET and DL-PET were also not significantly different (p = 0.625). Figure 2 shows a sample axial PET image of a patient with ALN metastasis.
Table 5.
Scores by each reader for axillary lymph node (ALN) metastasis on visual analysis *.
Table 6.
Diagnostic accuracy of ALN metastasis *.
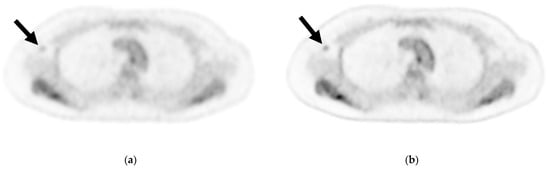
Figure 2.
Axial image of an axillary lymph node (ALN) cross-section via (a) cPET and (b) DL-PET of a woman in her 40 s with invasive lobular carcinoma in the right breast: invasive diameter, 18 mm; nuclear grade, 1; lymphatic invasion, positive; vascular invasion, positive; estrogen receptor, positive; progesterone receptor, positive; HER2 receptor, negative; Ki-67 staining, 17.3%; and nodal stage, 1a. Of 18 ALNs, 3 were positive for metastasis; the maximum diameter was 3 mm, and an extranodal invasion was evident. Visual analysis for ipsilateral ALN metastasis was rated on a scale of 1–3 (1 = negative, 2 = intermediate, 3 = positive). For ALN metastasis, reader 1 gave a score of 2 for cPET and 3 for DL-PET, and reader 2 gave a score of 1 for both the PET types. cPET, PET with conventional reconstruction; DL-PET, PET with deep learning restoration.
4. Discussion
Herein, DL-PET improved the visualization of primary breast cancer and mammary gland contrast, reduced visual noise, and significantly increased SUVmax and SUVpeak, suggesting that new criteria should be established for interpreting DL-PET. DL-PET exhibits an efficiency equivalent to that of cPET for ALN diagnosis.
Currently, DL has been applied to various fields, including breast PET-based research. There have been studies regarding breast cancer classification according to dedicated breast [11] and multiple-intensity projection of whole-body PET [12], bone lesion segmentation [13], and neoadjuvant chemotherapy response prediction using PET and MRI [14]. However, few studies involving PET have used DL to improve image quality, and to the best of our knowledge, there have been no reports regarding its application in breast-related diseases. There have been studies with the aim of improving PET image quality from the perspective of attenuation correction, which have generated attenuation maps [21] and predicted patient-specific attenuation correction factors [22] using convolution neural networks and paired attenuation- and non-attenuation-corrected PET images employing three-dimensional patch-based cycle-consistent generative adversarial networks [23]. A study by Park et al. involving the PET/MRI of 20 patients with Crohn’s disease reported that the image quality of low-dose PET with 90% dose reduction was potentially comparable with that of full-dose PET using the DL technique [24].
Herein, image quality was significantly improved in DL-PET than in cPET, consistent with the results of previous studies [13,14], and restored the image quality preferred by readers. Numerous studies have analyzed the relationship between 18F-FDG uptake and pathological findings of breast cancer to predict disease prognosis and chemotherapy efficacy [1,3,25,26]. The noise reduction and improved lesion/normal tissue contrast achieved with DL-PET might make a more accurate prediction of chemotherapy efficacy. Furthermore, the improved image quality of PET/CT can be achieved with tracers other than 18F-FDG, such as 18F-FLT [27]. The difference between the conventional and DL approaches explains the significantly higher SUVmax and SUVpeak obtained in DL-PET than in cPET. Gaussian filtering shaves off pixel values in the images, whereas DL only removes noise [13,14]. A meta-analysis revealed that patients with breast cancer and high SUVmax were at an increased risk of adverse events or death, with high metabolic tumor volume and total lesion glycolysis predicting a high risk of death and adverse events, respectively [4]. When using DL-PET to predict tumor activity and chemotherapy efficacy, it is necessary to understand that SUVs will be higher for DL-PET than for cPET.
Although the contrast between the background axillary adipose tissue and ALNs improved, it did not improve the diagnosis of ALN metastases while using DL-PET (Figure 2). The DL-PET images in metastasis-negative cases were scored 2 or 3 by reader 1 more frequently compared with cPET images. It was difficult to determine whether the 18F-FDG accumulation on DL-PET was associated with metastasis because the accumulation was clear regardless of the presence or absence of ALN metastasis. When scores of 1 and 2 were defined as negative and a score of 3 as positive, both readers reached the same visual diagnosis with cPET reconstructions and DL-PET restorations. When evaluating high-contrast images, such as those obtained using DL-PET, moderate accumulation requires careful assessment to ensure it is not mistakenly labeled as positive for metastasis. In this study, cPET, which was considered as the baseline, was performed using the latest digital PET scanner technology. Hence, it is possible that the image quality was too good to demonstrate a significant difference between cPET and DL-PET.
Future studies with larger sample sizes are warranted to confirm that lowering the 18F-FDG dose and shortening the emission time per bed do not compromise the visual diagnosis of ALN metastases owing to the improvement in the quality of PET images obtained via DL restoration. The patient benefits of using the DL method might include low testing costs and exposure doses by lowering examination time and the 18F-FDG dose [24].
Our study has some limitations. First, this was a retrospective single-center study. Second, it included a relatively small sample size. Third, we did not evaluate the diagnostic abilities of DL-PET and cPET for distant metastasis apart from ALNs, as most patients had early-stage breast cancer. Furthermore, no SUVmean measurements or SUV histograms were obtained because breast cancer is often irregular and 18F-FDG uptake is very low, rendering it inseparable from the background mammary gland and making it difficult to determine accurate margins.
In conclusion, compared with cPET, DL-PET improved the quality of the resulting breast cancer images. The SUVmax and SUVpeak were significantly higher in DL-PET than in cPET reconstructions owing to selective noise reduction. Thus, DL-PET and cPET exhibited comparable abilities to diagnose ALN metastasis. Therefore, the DL method has the potential to generate high-quality PET images while preserving the ability to visually diagnose ALNs.
Author Contributions
Conceptualization, J.T. and U.T.; methodology, J.T., K.K. and U.T.; software, J.T. and U.T.; validation, T.F. and K.K.; formal analysis, M.M.; investigation, M.M. and T.F.; resources, K.H., Y.K., G.O., I.O. and T.N.; data curation, L.K., Y.Y., E.Y. and K.Y.; writing—original draft preparation, M.M.; writing—review and editing, M.M., M.H. and T.F.; visualization, M.M.; supervision, T.F.; project administration, K.K.; funding acquisition, U.T. All authors have read and agreed to the published version of the manuscript.
Funding
This study was funded by Canon Medical Systems Corporation, Otawara, Tochigi, Japan: 21AA100483.
Institutional Review Board Statement
The study was conducted according to the guidelines of the Declaration of Helsinki and approved by the medical ethics committee of Tokyo Medical and Dental University (no. M2020-339, approved on 23 March 2021).
Informed Consent Statement
Informed consent was obtained from all subjects involved in the study. The requirement for written informed consent was waived because of the retrospective nature of the study.
Data Availability Statement
The data presented in this study are available on request from the corresponding author. The data are not publicly available due to protect patient anonymity.
Conflicts of Interest
The authors declare no conflict of interest.
References
- Mori, M.; Fujioka, T.; Kubota, K.; Katsuta, L.; Yashima, Y.; Nomura, K.; Yamaga, E.; Tsuchiya, J.; Hosoya, T.; Oda, G.; et al. Relationship between prognostic stage in breast cancer and fluorine-18 fluorodeoxyglucose positron emission tomography/computed tomography. J. Clin. Med. 2021, 10, 3173. [Google Scholar] [CrossRef]
- Mori, M.; Fujioka, T.; Katsuta, L.; Tsuchiya, J.; Kubota, K.; Kasahara, M.; Oda, G.; Nakagawa, T.; Onishi, I.; Tateishi, U. Diagnostic performance of time-of-flight PET/CT for evaluating nodal metastasis of the axilla in breast cancer. Nucl. Med. Commun. 2019, 40, 958–964. [Google Scholar] [CrossRef]
- Ishiba, T.; Nakagawa, T.; Sato, T.; Nagahara, M.; Oda, G.; Sugimoto, H.; Kasahara, M.; Hosoya, T.; Kubota, K.; Fujioka, T.; et al. Efficiency of fluorodeoxyglucose positron emission tomography/computed tomography to predict prognosis in breast cancer patients received neoadjuvant chemotherapy. Springerplus 2015, 4, 817. [Google Scholar] [CrossRef] [PubMed]
- Wen, W.; Xuan, D.; Hu, Y.; Li, X.; Liu, L.; Xu, D. Prognostic value of maximum standard uptake value, metabolic tumor volume, and total lesion glycolysis of positron emission tomography/computed tomography in patients with breast cancer: A systematic review and meta-analysis. PLoS ONE 2019, 14, e0225959. [Google Scholar] [CrossRef] [PubMed]
- Ergul, N.; Kadioglu, H.; Yildiz, S.; Yucel, S.B.; Gucin, Z.; Erdogan, E.B.; Aydin, M.; Muslumanoglu, M. Assessment of multifocality and axillary nodal involvement in early-stage breast cancer patients using 18F-FDG PET/CT compared to contrast-enhanced and diffusion-weighted magnetic resonance imaging and sentinel node biopsy. Acta Radiol. 2015, 56, 917–923. [Google Scholar] [CrossRef] [PubMed]
- Crippa, F.; Gerali, A.; Alessi, A.; Agresti, R.; Bombardieri, E. FDG-PET for axillary lymph node staging in primary breast cancer. Eur. J. Nucl. Med. Mol. Imaging 2004, 31, S97–S102. [Google Scholar] [CrossRef]
- Kumar, R.; Chauhan, A.; Zhuang, H.; Chandra, P.; Schnall, M.; Alavi, A. Clinicopathologic factors associated with false negative FDG-PET in primary breast cancer. Breast Cancer Res. Treat. 2006, 98, 267–274. [Google Scholar] [CrossRef]
- Lecomte, R. Novel detector technology for clinical PET. Eur. J. Nucl. Med. Mol. Imaging 2009, 36, S69–S85. [Google Scholar] [CrossRef]
- Nishimatsu, K.; Nakamoto, Y.; Miyake, K.K.; Ishimori, T.; Kanao, S.; Toi, M.; Togashi, K. Higher breast cancer conspicuity on dbPET compared to WB-PET/CT. Eur. J. Radiol. 2017, 90, 138–145. [Google Scholar] [CrossRef] [PubMed]
- Fujioka, T.; Mori, M.; Kubota, K.; Oyama, J.; Yamaga, E.; Yashima, Y.; Katsuta, L.; Nomura, K.; Nara, M.; Oda, G.; et al. The utility of deep learning in breast ultrasonic imaging: A review. Diagnostics 2020, 10, 1055. [Google Scholar] [CrossRef]
- Satoh, Y.; Imokawa, T.; Fujioka, T.; Mori, M.; Yamaga, E.; Takahashi, K.; Takahashi, K.; Kawase, T.; Kubota, K.; Tateishi, U.; et al. Deep learning for image classification in dedicated breast positron emission tomography (dbPET). Ann. Nucl. Med. 2022, 36, 401–410. [Google Scholar] [CrossRef] [PubMed]
- Takahashi, K.; Fujioka, T.; Oyama, J.; Mori, M.; Yamaga, E.; Yashima, Y.; Imokawa, T.; Hayashi, A.; Kujiraoka, Y.; Tsuchiya, J.; et al. Deep learning using multiple degrees of maximum-intensity projection for PET/CT image classification in breast cancer. Tomography 2022, 8, 131–141. [Google Scholar] [CrossRef] [PubMed]
- Moreau, N.; Rousseau, C.; Fourcade, C.; Santini, G.; Ferrer, L.; Lacombe, M.; Guillerminet, C.; Campone, M.; Colombie, M.; Rubeaux, M.; et al. Deep learning approaches for bone and bone lesion segmentation on 18FDG PET/CT imaging in the context of metastatic breast cancer. Annu. Int. Conf. IEEE Eng. Med. Biol. Soc. 2020, 2020, 1532–1535. [Google Scholar] [PubMed]
- Choi, J.H.; Kim, H.-A.; Kim, W.; Lim, I.; Lee, I.; Byun, B.H.; Noh, W.C.; Seong, M.-K.; Lee, S.-S.; Kim, B.I.; et al. Early prediction of neoadjuvant chemotherapy response for advanced breast cancer using PET/MRI image deep learning. Sci. Rep. 2020, 10, 21149. [Google Scholar] [CrossRef] [PubMed]
- Nakamura, Y.; Higaki, T.; Tatsugami, F.; Honda, Y.; Narita, K.; Akagi, M.; Awai, K. Possibility of deep learning in medical imaging focusing improvement of computed tomography image quality. J. Comput. Assist. Tomogr. 2020, 44, 161–167. [Google Scholar] [CrossRef]
- Higaki, T.; Nakamura, Y.; Tatsugami, F.; Nakaura, T.; Awai, K. Improvement of image quality at CT and MRI using deep learning. Jpn J. Radiol. 2019, 37, 73–80. [Google Scholar] [CrossRef]
- Tsuchiya, J.; Yokoyama, K.; Yamagiwa, K.; Watanabe, R.; Kimura, K.; Kishino, M.; Chan, C.; Asma, E.; Tateishi, U. Deep learning–based image quality improvement of 18F-fluorodeoxyglucose positron emission tomography: A retrospective observational study. EJNMMI Phys. 2021, 8, 31. [Google Scholar] [CrossRef]
- Amagiwa, K.; Tsuchiya, J.; Yokoyama, K.; Watanabe, R.; Kimura, K.; Kishino, M.; Tateishi, U. Enhancement of 18F-fluorodeoxyglucose PET image quality by deep-learning-based image reconstruction using Advanced intelligent Clear-IQ Engine in semiconductor-based PET/CT scanners. Diagnostics 2022, 12, 2500. [Google Scholar] [CrossRef]
- Hammond, M.E.; Hayes, D.F.; Dowsett, M.; Allred, D.C.; Hagerty, K.L.; Badve, S.; Fitzgibbons, P.L.; Francis, G.; Goldstein, N.S.; Hayes, M.; et al. American Society of Clinical Oncology/College of American Pathologists guideline recommendations for immunohistochemical testing of estrogen and progesterone receptors in breast cancer. J. Clin. Oncol. 2010, 28, 2784–2795. [Google Scholar] [CrossRef]
- Wolff, A.C.; Hammond, M.E.H.; Hicks, D.G.; Dowsett, M.; McShane, L.M.; Allison, K.H.; Allred, D.C.; Bartlett, J.M.; Bilous, M.; Fitzgibbons, P.; et al. Recommendations for human epidermal growth factor receptor 2 testing in breast cancer: American Society of Clinical Oncology/College of American Pathologists clinical practice guideline update. J. Clin. Oncol. 2013, 31, 3997–4013. [Google Scholar] [CrossRef]
- Hwang, D.; Kang, S.K.; Kim, K.Y.; Choi, H.; Lee, J.S. Comparison of deep learning–based emission-only attenuation correction methods for positron emission tomography. Eur. J. Nucl. Med. Mol. Imaging 2022, 49, 1833–1842. [Google Scholar] [CrossRef] [PubMed]
- Arabi, H.; Zaidi, H. Deep learning–guided estimation of attenuation correction factors from time-of-flight PET emission data. Med. Image Anal. 2020, 64, 101718. [Google Scholar] [CrossRef] [PubMed]
- Dong, X.; Lei, Y.; Wang, T.; Higgins, K.; Liu, T.; Curran, W.J.; Mao, H.; Nye, J.A.; Yang, X. Deep learning–based attenuation correction in the absence of structural information for whole-body positron emission tomography imaging. Phys. Med. Biol. 2020, 65, 055011. [Google Scholar] [CrossRef] [PubMed]
- Park, C.J.; Chen, W.; Pirasteh, A.; Kim, D.H.; Perlman, S.B.; Robbins, J.B.; McMillan, A.B. Initial experience with low-dose 18F-fluorodeoxyglucose positron emission tomography/magnetic resonance imaging with deep learning enhancement. J. Comput. Assist. Tomogr. 2021, 45, 637–642. [Google Scholar] [CrossRef] [PubMed]
- Kadoya, T.; Aogi, K.; Kiyoto, S.; Masumoto, N.; Sugawara, Y.; Okada, M. Role of maximum standardized uptake value in fluorodeoxyglucose positron emission tomography/computed tomography predicts malignancy grade and prognosis of operable breast cancer: A multi-institute study. Breast Cancer Res. Treat. 2013, 141, 269–275. [Google Scholar] [CrossRef]
- Ahn, S.G.; Lee, M.; Jeon, T.J.; Han, K.; Lee, H.M.; Lee, S.A.; Ryu, Y.H.; Son, E.J.; Jeong, J. 18F-Fluorodeoxyglucose positron emission tomography can contribute to discriminate patients with poor prognosis in hormone receptor-positive breast cancer. PLoS ONE 2014, 9, e105905. [Google Scholar] [CrossRef]
- Mori, M.; Fujioka, T.; Ichikawa, R.; Inomata, R.; Katsuta, L.; Yashima, Y.; Yamaga, E.; Tsuchiya, J.; Hayashi, K.; Kumaki, Y.; et al. Comparison of 18F-fluorothymidine positron emission tomography/computed tomography and 18F-fluorodeoxyglucose positron emission tomography/computed tomography in patients with breast cancer. Tomography 2022, 8, 2533–2546. [Google Scholar] [CrossRef]


Disclaimer/Publisher’s Note: The statements, opinions and data contained in all publications are solely those of the individual author(s) and contributor(s) and not of MDPI and/or the editor(s). MDPI and/or the editor(s) disclaim responsibility for any injury to people or property resulting from any ideas, methods, instructions or products referred to in the content. |
© 2023 by the authors. Licensee MDPI, Basel, Switzerland. This article is an open access article distributed under the terms and conditions of the Creative Commons Attribution (CC BY) license (https://creativecommons.org/licenses/by/4.0/).