Using an Artificial Intelligence Approach to Predict the Adverse Effects and Prognosis of Tuberculosis
Abstract
:1. Introduction
2. Methods
2.1. Study Design, Setting, and Samples
2.2. Feature and Outcome Variables
2.3. Model Building and Evaluation
3. Results
4. Discussion
4.1. Acute Hepatitis
4.2. Acute Respiratory Failure
4.3. Mortality
5. Conclusions
Author Contributions
Funding
Institutional Review Board Statement
Informed Consent Statement
Data Availability Statement
Conflicts of Interest
References
- Global Tuberculosis Report 2022; World Health Organization: Geneva, Switzerland, 2022; Available online: https://www.who.int/teams/global-tuberculosis-programme/tb-reports/global-tuberculosis-report-2022 (accessed on 10 January 2023).
- Alffenaar, J.W.C.; Stocker, S.L.; Forsman, L.D.; Garcia-Prats, A.; Heysell, S.K.; Aarnoutse, R.E.; Akkerman, O.W.; Aleksa, A.; van Altena, R.; de Oñata, W.A.; et al. Clinical standards for the dosing and management of TB drugs. Int. J. Tuberc. Lung Dis. 2022, 26, 483–499. [Google Scholar] [CrossRef] [PubMed]
- Ramappa, V.; Aithal, G.P. Hepatotoxicity Related to Anti-tuberculosis Drugs: Mechanisms and Management. J. Clin. Exp. Hepatol. 2013, 3, 37–49. [Google Scholar] [CrossRef] [Green Version]
- Elhidsi, M.; Rasmin, M. Prasenohadi In-hospital mortality of pulmonary tuberculosis with acute respiratory failure and related clinical risk factors. J. Clin. Tuberc. Other Mycobact. Dis. 2021, 23, 100236. [Google Scholar] [CrossRef] [PubMed]
- Kim, Y.J.; Pack, K.M.; Jeong, E.; Na, J.O.; Oh, Y.M.; Lee, S.D.; Kim, W.S.; Kim, D.S.; Shim, T.S. Pulmonary tuberculosis with acute respiratory failure. Eur. Respir. J. 2008, 32, 1625–1630. [Google Scholar] [CrossRef]
- Harris, M.; Qi, A.; JeaGal, L.; Torabi, N.; Menzies, D.; Korobitsyn, A.; Pai, M.; Nathavitharana, R.R.; Khan, F.A. A systematic review of the diagnostic accuracy of artificial intelligence-based computer programs to analyze chest x-rays for pulmonary tuberculosis. PLoS ONE 2019, 14, e0221339. [Google Scholar] [CrossRef] [PubMed]
- Doshi, R.; Falzon, D.; Thomas, B.V.; Temesgen, Z.; Sadasivan, L.; Migliori, G.B.; Raviglione, M. Tuberculosis control, and the where and why of artificial intelligence. ERJ Open Res. 2017, 21, 00056–2017. [Google Scholar] [CrossRef] [Green Version]
- Asad, M.; Mahmood, A.; Usman, M. A machine learning-based framework for Predicting Treatment Failure in tuberculosis: A case study of six countries. Tuberculosis 2020, 123, 101944. [Google Scholar] [CrossRef]
- Kheirandish, M.; Catanzaro, D.; Crudu, V.; Zhang, S. Integrating landmark modeling framework and machine learning algorithms for dynamic prediction of tuberculosis treatment outcomes. J. Am. Med. Inform. Assoc. 2022, 29, 900–908. [Google Scholar] [CrossRef]
- Sauer, C.M.; Sasson, D.; Paik, K.E.; McCague, N.; Celi, L.A.; Fernández, I.S.; Illigens, B.M.W. Feature selection and prediction of treatment failure in tuberculosis. PLoS ONE 2018, 13, e0207491. [Google Scholar] [CrossRef]
- Chawla, N.V.; Bowyer, K.W.; Hall, L.O.; Kegelmeyer, W.P. SMOTE: Synthetic Minority Over-sampling Technique. J. Artif. Intell. Res. 2002, 16, 321–357. [Google Scholar] [CrossRef]
- Kanesamoorthy, K.; Dissanayake, M.B. Prediction of treatment failure of tuberculosis using support vector machine with genetic algorithm. Int. J. Mycobacteriol. 2021, 10, 279–284. [Google Scholar] [CrossRef]
- Hussain, O.A.; Junejo, K.N. Predicting treatment outcome of drug-susceptible tuberculosis patients using machine-learning models. Inform. Health Soc. Care 2019, 44, 135–151. [Google Scholar] [CrossRef] [PubMed]
- Luo, Y.; Xue, Y.; Liu, W.; Song, H.; Huang, Y.; Tang, G.; Wang, F.; Wang, Q.; Cai, Y.; Sun, Z. Development of diagnostic algorithm using machine learning for distinguishing between active tuberculosis and latent tuberculosis infection. BMC Infect. Dis. 2022, 22, 965. [Google Scholar] [CrossRef] [PubMed]
- Nijiati, M.; Zhou, R.; Damaola, M.; Hu, C.; Li, L.; Qian, B.; Abulizi, A.; Kaisaier, A.; Cai, C.; Li, H.; et al. Deep learning based CT images automatic analysis model for active/non-active pulmonary tuberculosis differential diagnosis. Front. Mol. Biosci. 2022, 9, 1086047. [Google Scholar] [CrossRef] [PubMed]
- Acharya, V.; Dhiman, G.; Prakasha, K.; Bahadur, P.; Choraria, A.; Sushobhitha, M.; Sowjanya, J.; Prabhu, S.; Chadaga, K.; Viriyasitavat, W.; et al. AI-Assisted Tuberculosis Detection and Classification from Chest X-Rays Using a Deep Learning Normalization-Free Network Model. Comput. Intell. Neurosci. 2022, 2022, 2399428. [Google Scholar] [CrossRef]
- Pande, J.N.; Singh, S.P.; Khilnani, G.C.; Khilnani, S.; Tandon, R.K. Risk factors for hepatotoxicity from antituberculosis drugs: A case-control study. Thorax 1996, 51, 132–136. [Google Scholar] [CrossRef] [Green Version]
- Døssing, M.; Wilcke, J.; Askgaard, D.; Nybo, B. Liver injury during antituberculosis treatment: An 11-year study. Tuber. Lung Dis. 1996, 77, 335–340. [Google Scholar] [CrossRef]
- Wong, W.-M.; Wu, P.-C.; Yuen, M.-F.; Cheng, C.-C.; Yew, W.-W.; Wong, P.-C.; Tam, C.-M.; Leung, C.-C.; Lai, C.-L. Antituberculosis drug-related liver dysfunction in chronic hepatitis B infection. Hepatology 2000, 31, 201–206. [Google Scholar] [CrossRef]
- Molla, Y.; Wubetu, M.; Dessie, B. Anti-Tuberculosis Drug Induced Hepatotoxicity and Associated Factors among Tuberculosis Patients at Selected Hospitals, Ethiopia. Hepatic Med. Évid. Res. 2021, 13, 1–8. [Google Scholar] [CrossRef]
- Gezahegn, L.K.; Argaw, E.; Assefa, B.; Geberesilassie, A.; Hagazi, M. Magnitude, outcome, and associated factors of anti-tuberculosis drug-induced hepatitis among tuberculosis patients in a tertiary hospital in North Ethiopia: A cross-sectional study. PLoS ONE 2020, 15, e0241346. [Google Scholar] [CrossRef]
- Penner, C.; Roberts, D.; Kunimoto, D.; Manfreda, J.; Long, R. Tuberculosis as a Primary Cause of Respiratory Failure Requiring Mechanical Ventilation. Am. J. Respir. Crit. Care Med. 1995, 151, 867–872. [Google Scholar] [CrossRef] [PubMed]
- Lee, P.L.; Jerng, J.S.; Chang, Y.L.; Chen, C.F.; Hsueh, P.R.; Yu, C.J.; Yang, P.C.; Luh, K.T. Patient mortality of active pulmonary tuberculosis requiring mechanical ventilation. Eur. Respir. J. 2003, 22, 141–147. [Google Scholar] [CrossRef] [PubMed] [Green Version]
- Joseph, Y.; Yao, Z.; Dua, A.; Severe, P.; Collins, S.E.; Bang, H.; Jean-Juste, M.A.; Ocheretina, O.; Apollon, A.; McNairy, M.L.; et al. Long-term mortality after tuberculosis treatment among persons living with HIV in Haiti. J. Int. AIDS Soc. 2021, 24, e25721. [Google Scholar] [CrossRef] [PubMed]
- Moosazadeh, M.; Bahrampour, A.; Nasehi, M.; Khanjani, N. Survival and Predictors of Death after Successful Treatment among Smear Positive Tuberculosis: A Cohort Study. Int. J. Prev. Med. 2014, 5, 1005–1012. [Google Scholar] [PubMed]
- Selvaraju, S.; Thiruvengadam, K.; Watson, B.; Thirumalai, N.; Malaisamy, M.; Vedachalam, C.; Swaminathan, S.; Padmapriyadarsini, C. Long-term Survival of Treated Tuberculosis Patients in Comparison to a General Population in South India: A Matched Cohort Study. Int. J. Infect. Dis. 2021, 110, 385–393. [Google Scholar] [CrossRef] [PubMed]
- Lefebvre, N.; Falzon, D. Risk factors for death among tuberculosis cases: Analysis of European surveillance data. Eur. Respir. J. 2008, 31, 1256–1260. [Google Scholar] [CrossRef] [Green Version]


| Variable | Overall | Acute Hepatitis | Acute Respiratory Failure | Mortality | ||||||
|---|---|---|---|---|---|---|---|---|---|---|
| NO | Yes | p Value | NO | Yes | p Value | NO | Yes | p Value | ||
| Cases, n (%) | 2248 (100.0) | 1377 (61.3) | 871 (38.7) | 2141 (95.2) | 107 (4.8) | 2128 (94.7) | 120 (5.3) | |||
| sex, n (%) | ||||||||||
| Female | 637 (28.3) | 420 (30.5) | 217 (24.9) | 0.005 | 611 (28.5) | 26 (24.3) | 0.401 | 608 (28.6) | 29 (24.2) | 0.348 |
| Male | 1611 (71.7) | 957 (69.5) | 654 (75.1) | 1530 (71.5) | 81 (75.7) | 1520 (71.4) | 91 (75.8) | |||
| age, mean (SD) | 67.7 (16.4) | 67.2 (16.5) | 68.5 (16.3) | 0.071 | 67.1 (16.5) | 79.9 (8.7) | <0.001 | 66.9 (16.4) | 80.9 (9.9) | <0.001 |
| TB_type, n (%) | ||||||||||
| Extra-pulmonary | 140 (6.2) | 77 (5.6) | 63 (7.2) | 0.292 | 138 (6.4) | 2 (1.9) | 0.145 | 139 (6.5) | 1 (0.8) | 0.022 |
| Intra-pulmonary | 2025 (90.1) | 1249 (90.7) | 776 (89.1) | 1925 (89.9) | 100 (93.5) | 1913 (89.9) | 112 (93.3) | |||
| Both (Intra + Extra) | 83 (3.7) | 51 (3.7) | 32 (3.7) | 78 (3.6) | 5 (4.7) | 76 (3.6) | 7 (5.8) | |||
| History_DM, n (%) | 612 (27.2) | 376 (27.3) | 236 (27.1) | 0.952 | 579 (27.0) | 33 (30.8) | 0.454 | 581 (27.3) | 31 (25.8) | 0.805 |
| History_Hypertension, n (%) | 780 (34.7) | 485 (35.2) | 295 (33.9) | 0.541 | 733 (34.2) | 47 (43.9) | 0.051 | 713 (33.5) | 67 (55.8) | <0.001 |
| History_Dyslipidemia, n (%) | 233 (10.4) | 159 (11.5) | 74 (8.5) | 0.025 | 219 (10.2) | 14 (13.1) | 0.434 | 220 (10.3) | 13 (10.8) | 0.985 |
| History_ESRD, n (%) | 125 (5.6) | 80 (5.8) | 45 (5.2) | 0.580 | 118 (5.5) | 7 (6.5) | 0.812 | 119 (5.6) | 6 (5.0) | 0.944 |
| History_CVA, n (%) | 278 (12.4) | 170 (12.3) | 108 (12.4) | 0.978 | 256 (12.0) | 22 (20.6) | 0.013 | 237 (11.1) | 41 (34.2) | <0.001 |
| History_Dementia, n (%) | 135 (6.0) | 86 (6.2) | 49 (5.6) | 0.609 | 116 (5.4) | 19 (17.8) | <0.001 | 117 (5.5) | 18 (15.0) | <0.001 |
| History_CHF, n (%) | 161 (7.2) | 98 (7.1) | 63 (7.2) | 0.984 | 142 (6.6) | 19 (17.8) | <0.001 | 144 (6.8) | 17 (14.2) | 0.004 |
| History_COPD, n (%) | 693 (30.8) | 440 (32.0) | 253 (29.0) | 0.159 | 638 (29.8) | 55 (51.4) | <0.001 | 641 (30.1) | 52 (43.3) | 0.003 |
| History_Asthma, n (%) | 122 (5.4) | 83 (6.0) | 39 (4.5) | 0.138 | 115 (5.4) | 7 (6.5) | 0.762 | 112 (5.3) | 10 (8.3) | 0.216 |
| History_malignancy, n (%) | 483 (21.5) | 292 (21.2) | 191 (21.9) | 0.723 | 466 (21.8) | 17 (15.9) | 0.185 | 463 (21.8) | 20 (16.7) | 0.227 |
| History_Autoimmune disease, n (%) | 97 (4.3) | 50 (3.6) | 47 (5.4) | 0.057 | 92 (4.3) | 5 (4.7) | 0.806 | 94 (4.4) | 3 (2.5) | 0.438 |
| History_Liver cirrhosis, n (%) | 68 (3.0) | 25 (1.8) | 43 (4.9) | <0.001 | 67 (3.1) | 1 (0.9) | 0.376 | 64 (3.0) | 4 (3.3) | 0.782 |
| History_old TB, n (%) | 172 (7.7) | 108 (7.8) | 64 (7.3) | 0.727 | 167 (7.8) | 5 (4.7) | 0.317 | 168 (7.9) | 4 (3.3) | 0.098 |
| History_Hepatitis, n (%) | 100 (4.4) | 44 (3.2) | 56 (6.4) | <0.001 | 94 (4.4) | 6 (5.6) | 0.474 | 98 (4.6) | 2 (1.7) | 0.196 |
| Pleural effusion, n (%) | 20 (0.9) | 10 (0.7) | 10 (1.1) | 0.420 | 16 (0.7) | 4 (3.7) | 0.013 | 17 (0.8) | 3 (2.5) | 0.087 |
| Isoniazid 101 mg, n (%) | 360 (16.0) | 137 (9.9) | 223 (25.6) | <0.001 | 333 (15.6) | 27 (25.2) | 0.011 | 333 (15.6) | 27 (22.5) | 0.062 |
| E-butol 401 mg, n (%) | 2236 (99.5) | 1372 (99.6) | 864 (99.2) | 0.233 | 2130 (99.5) | 106 (99.1) | 0.444 | 2117 (99.5) | 119 (99.2) | 0.483 |
| Pyrazinamide 501 mg, n (%) | 699 (31.1) | 378 (27.5) | 321 (36.9) | <0.001 | 665 (31.1) | 34 (31.8) | 0.961 | 654 (30.7) | 45 (37.5) | 0.145 |
| Rifampicin 151 mg, n (%) | 416 (18.5) | 190 (13.8) | 226 (25.9) | <0.001 | 384 (17.9) | 32 (29.9) | 0.003 | 389 (18.3) | 27 (22.5) | 0.300 |
| Rifater, n (%) | 1877 (83.5) | 1145 (83.2) | 732 (84.0) | 0.620 | 1788 (83.5) | 89 (83.2) | 0.966 | 1781 (83.7) | 96 (80.0) | 0.350 |
| Rifinah 150/101 mg, n (%) | 785 (34.9) | 526 (38.2) | 259 (29.7) | <0.001 | 742 (34.7) | 43 (40.2) | 0.286 | 758 (35.6) | 27 (22.5) | 0.005 |
| Mycobutin 151 mg, n (%) | 61 (2.7) | 7 (0.5) | 54 (6.2) | <0.001 | 56 (2.6) | 5 (4.7) | 0.211 | 56 (2.6) | 5 (4.2) | 0.376 |
| Rifinah 300/151 mg, n (%) | 1096 (48.8) | 680 (49.4) | 416 (47.8) | 0.480 | 1067 (49.8) | 29 (27.1) | <0.001 | 1055 (49.6) | 41 (34.2) | 0.001 |
| HbsAg, n (%) | ||||||||||
| Negative | 2191 (97.5) | 1347 (97.8) | 844 (96.9) | 0.224 | 2086 (97.4) | 105 (98.1) | 1.000 | 2072 (97.4) | 119 (99.2) | 0.366 |
| Positive | 57 (2.5) | 30 (2.2) | 27 (3.1) | 55 (2.6) | 2 (1.9) | 56 (2.6) | 1 (0.8) | |||
| Anti-HCV, n (%) | ||||||||||
| Negative | 2166 (96.4) | 1344 (97.6) | 822 (94.4) | <0.001 | 2066 (96.5) | 100 (93.5) | 0.109 | 2053 (96.5) | 113 (94.2) | 0.203 |
| Positive | 82 (3.6) | 33 (2.4) | 49 (5.6) | 75 (3.5) | 7 (6.5) | 75 (3.5) | 7 (5.8) | |||
| W.B.C., mean (SD) | 10.5 (7.1) | 9.6 (5.4) | 12.0 (9.0) | <0.001 | 10.2 (6.9) | 17.9 (8.3) | <0.001 | 10.3 (6.9) | 15.1 (9.9) | <0.001 |
| Hb, mean (SD) | 12.9 (1.8) | 12.9 (1.8) | 13.0 (1.8) | 0.409 | 12.9 (1.8) | 12.8 (1.7) | 0.426 | 13.0 (1.8) | 12.1 (1.7) | <0.001 |
| Platelet count, mean (SD) | 201.0 (100.3) | 213.8 (96.3) | 180.8 (103.3) | <0.001 | 203.3 (99.5) | 155.3 (106.0) | <0.001 | 203.0 (100.4) | 167.1 (93.4) | <0.001 |
| BUN, mean (SD) | 28.5 (24.5) | 25.8 (21.0) | 32.7 (28.7) | <0.001 | 27.5 (23.2) | 47.9 (37.8) | <0.001 | 27.6 (23.5) | 44.8 (34.8) | <0.001 |
| Creatinine, mean (SD) | 1.7 (1.9) | 1.6 (1.9) | 1.9 (2.0) | 0.007 | 1.7 (1.9) | 2.2 (2.1) | 0.030 | 1.7 (1.9) | 2.1 (1.8) | 0.018 |
| AST (GOT), mean (SD) | 116.9 (656.2) | 41.1 (46.6) | 236.6 (1041.8) | <0.001 | 112.0 (656.7) | 215.3 (642.3) | 0.107 | 113.6 (657.9) | 175.5 (626.1) | 0.295 |
| ALT (GPT), mean (SD) | 93.2 (242.2) | 35.7 (50.1) | 184.0 (366.1) | <0.001 | 90.9 (230.0) | 138.4 (415.4) | 0.243 | 91.7 (231.0) | 118.6 (390.9) | 0.457 |
| Bili Total, mean (SD) | 1.4 (2.7) | 0.7 (0.4) | 2.5 (4.1) | <0.001 | 1.4 (2.6) | 1.8 (3.5) | 0.226 | 1.4 (2.7) | 1.8 (3.1) | 0.128 |
| Algorithms | Accuracy | Sensitivity | Specificity | AUC |
|---|---|---|---|---|
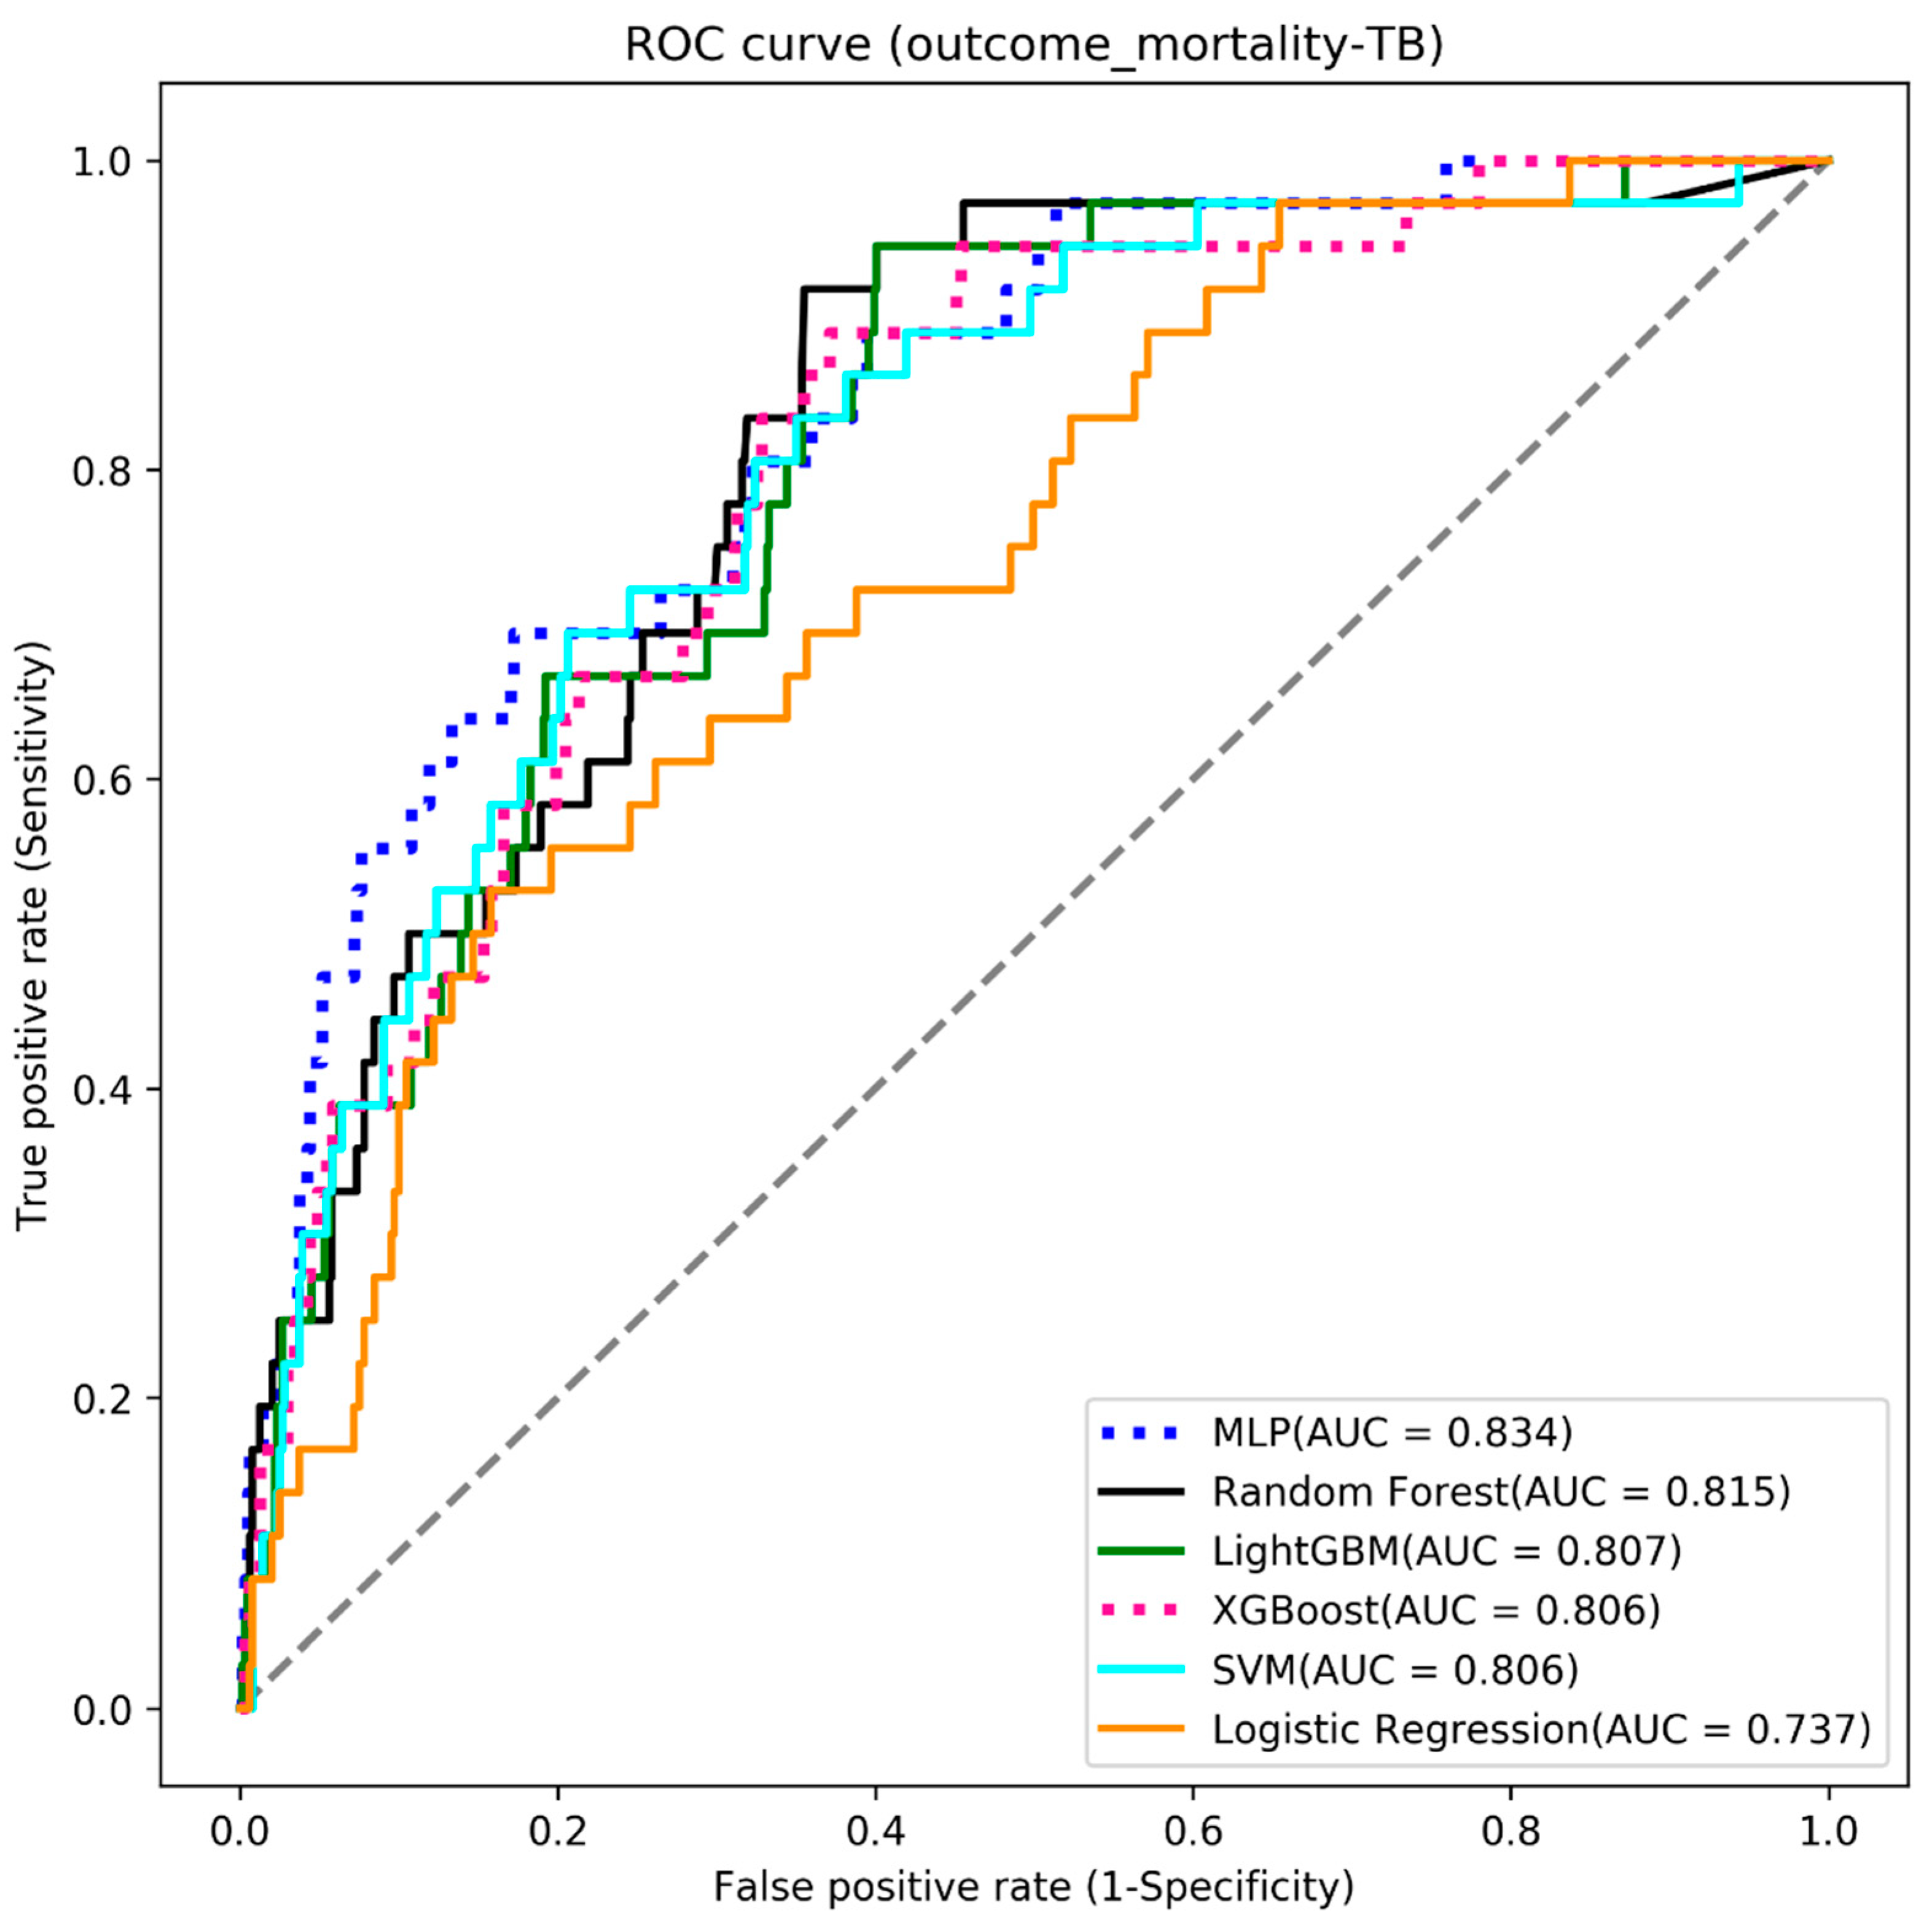
| MLP | 0.735 | 0.722 | 0.736 | 0.834 |
| Random Forest | 0.713 | 0.722 | 0.712 | 0.815 |
| LightGBM | 0.705 | 0.694 | 0.706 | 0.807 |
| XGBoost | 0.705 | 0.694 | 0.706 | 0.806 |
| SVM | 0.686 | 0.778 | 0.681 | 0.806 |
| Logistic Regression | 0.656 | 0.667 | 0.656 | 0.737 |
| Algorithms | Accuracy | Sensitivity | Specificity | AUC |
|---|---|---|---|---|
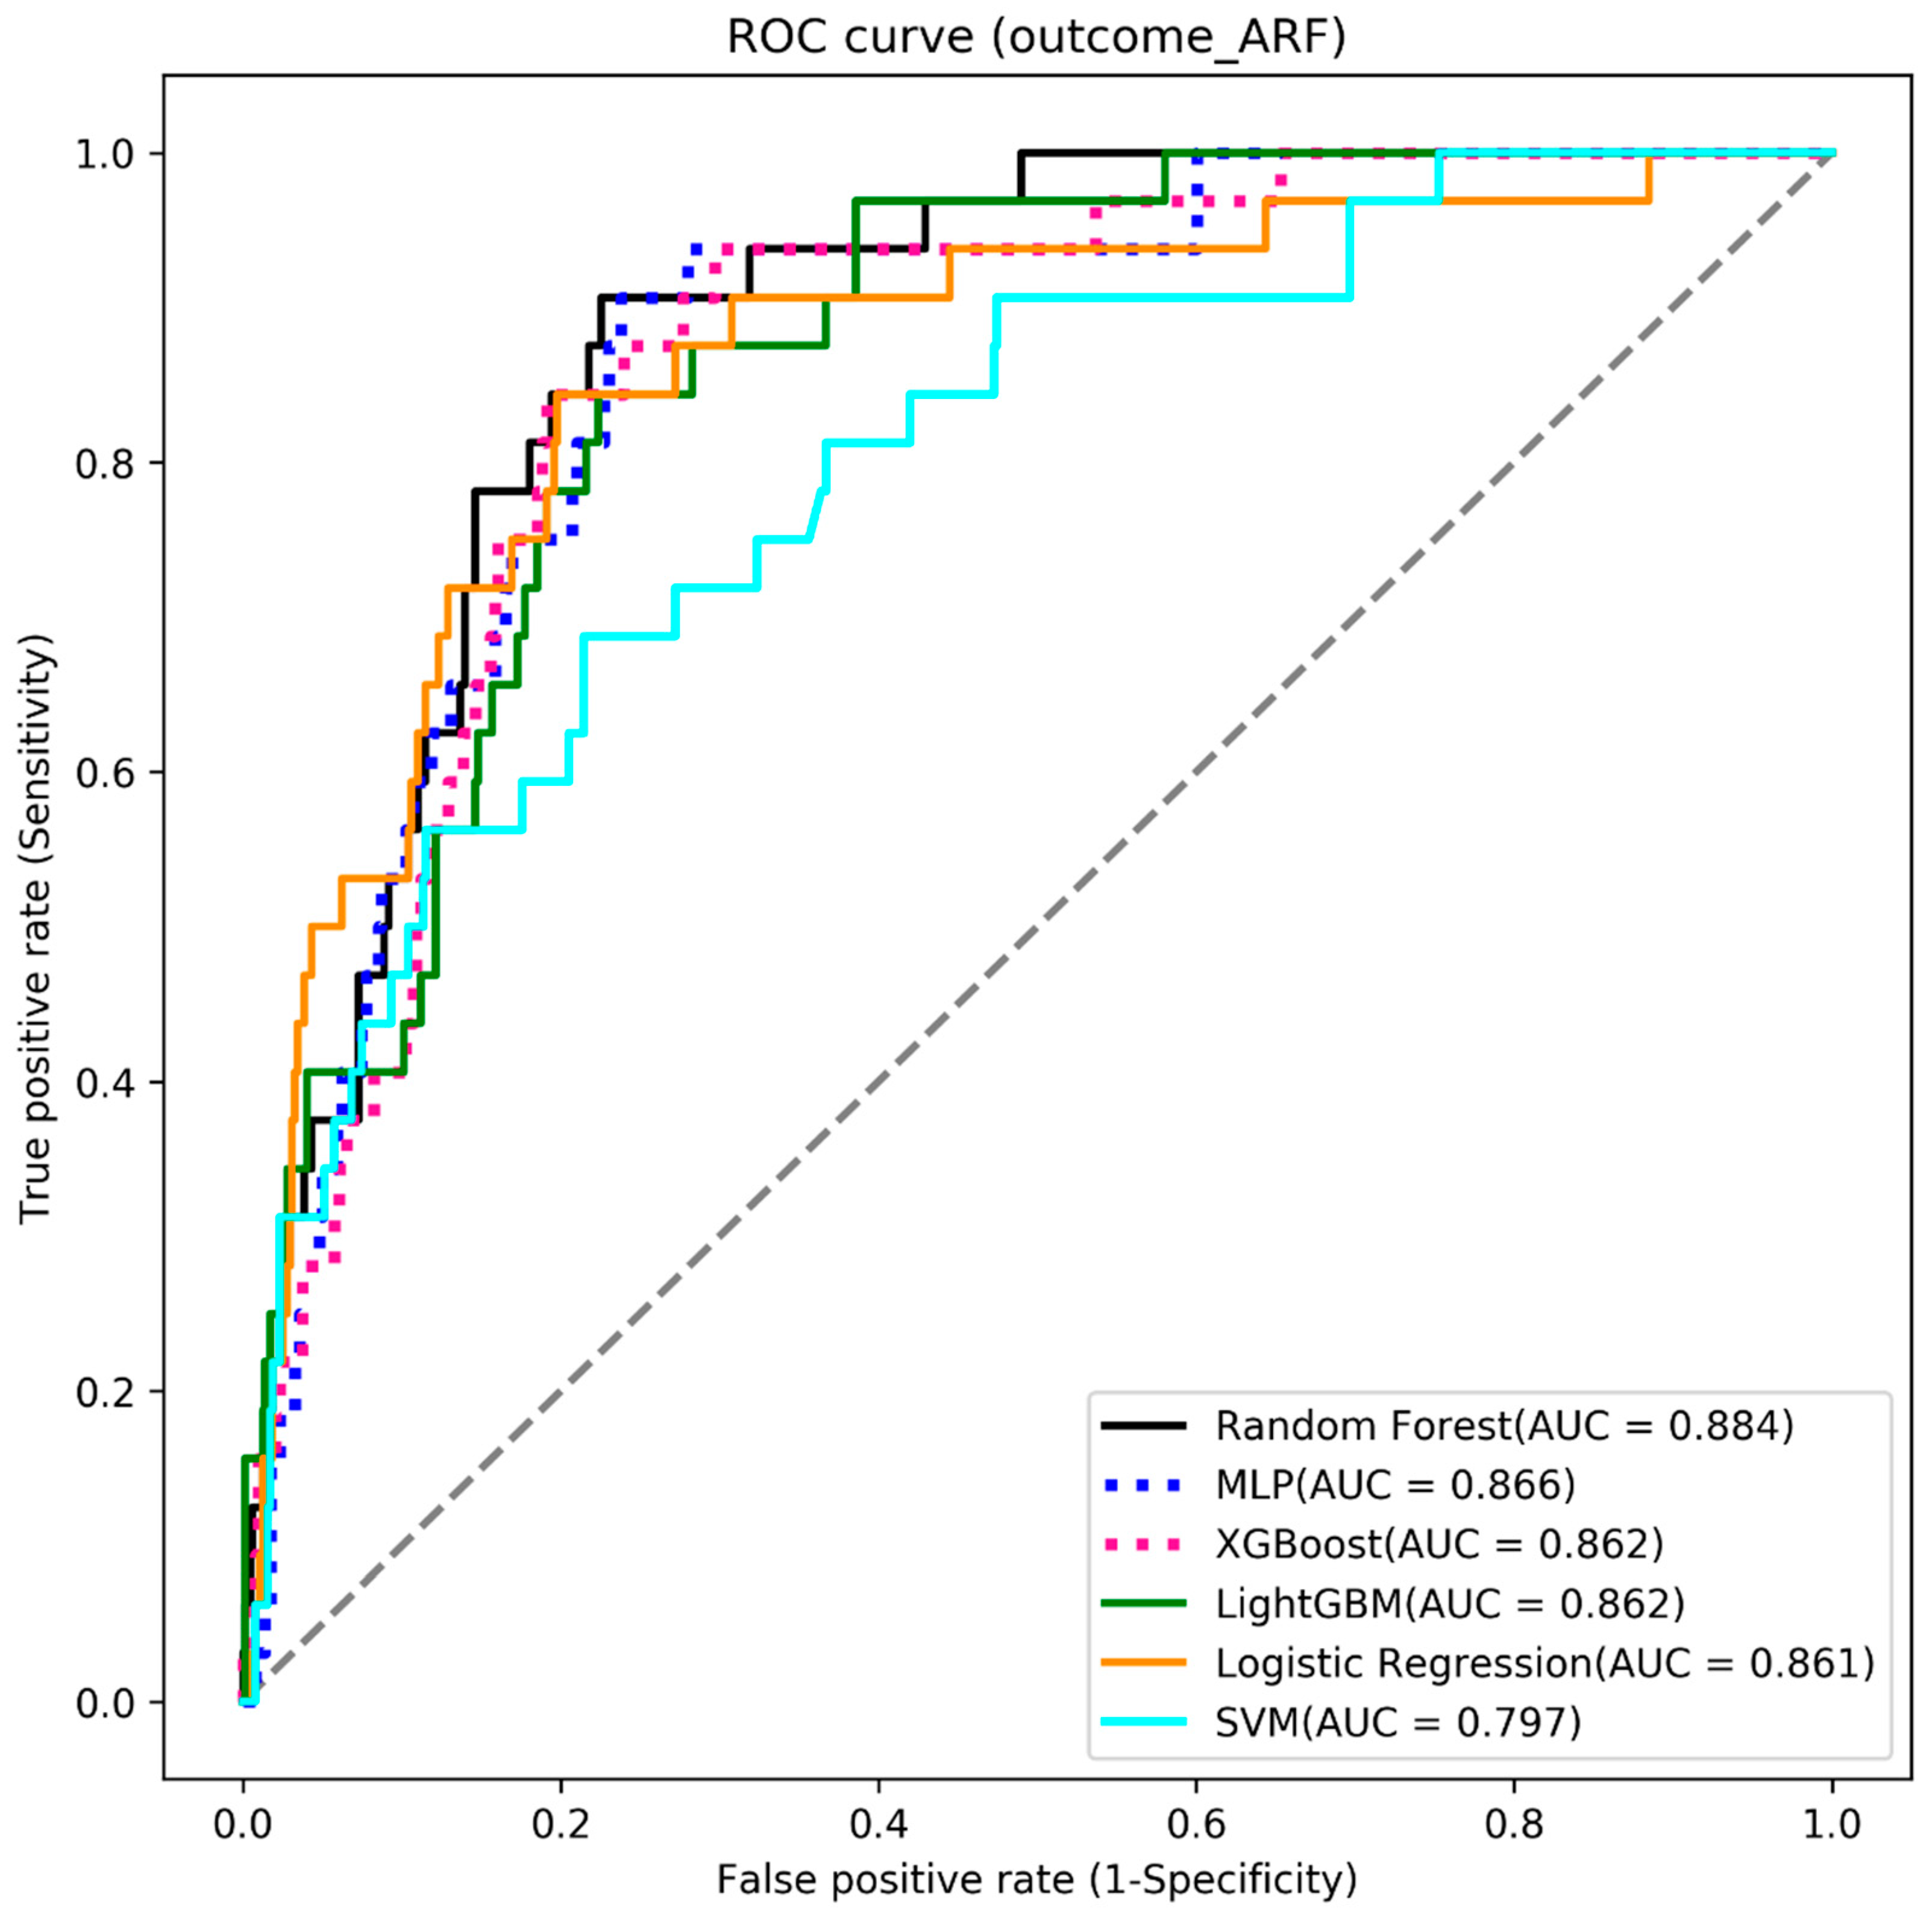
| Random Forest | 0.819 | 0.812 | 0.820 | 0.884 |
| MLP | 0.812 | 0.812 | 0.790 | 0.866 |
| XGBoost | 0.812 | 0.812 | 0.812 | 0.862 |
| LightGBM | 0.812 | 0.750 | 0.815 | 0.862 |
| Logistic Regression | 0.806 | 0.781 | 0.807 | 0.861 |
| SVM | 0.727 | 0.719 | 0.728 | 0.797 |
| Algorithms | Accuracy | Sensitivity | Specificity | AUC |
|---|---|---|---|---|
| XGBoost | 0.868 | 0.779 | 0.925 | 0.920 |
| Random forest | 0.856 | 0.794 | 0.896 | 0.918 |
| MLP | 0.853 | 0.752 | 0.918 | 0.909 |
| LightGBM | 0.847 | 0.771 | 0.896 | 0.907 |
| Logistic regression | 0.776 | 0.779 | 0.775 | 0.863 |
| SVM | 0.717 | 0.721 | 0.714 | 0.766 |
| Study | Our Study | [8] | [9] | [10] | [12] | [13] |
|---|---|---|---|---|---|---|
| Countries | Taiwan | Patients originated from India, Azerbaijan, Moldova, Georgia, Belarus, and Romania | Moldova | Azerbaijan, Belarus, Moldova, Georgia, Romania | Myanmar | Pakistan |
| Patient number | 2248 | 1443 | 17,958 | 587 | 393 | 4213 |
| Outcome | Acute hepatitis, acute respiratory failure, and mortality after TB treatment | Treatment failure, which is defined as failed in therapy or death | Cured, not cured, and died after 24 months following treatment initiation | Treatment failure, which we defined as failure of therapy or death | TB drug resistance | Patient will complete his treatment or not |
| Machine learning method | XGBoost, random forest, MLP, light GBM, logistic regression, and SVM. | Artificial Neural Network (ANN), Support Vector Machine (SVM), k-Nearest Neighbors (k-NN), and random forest (RF). | Random forest algorithm, support vector machine, penalized multinomial logistic regression models. | Stepwise forward selection, stepwise backward elimination, backward elimination and forward selection, Least Absolute Shrinkage and Selection Operator (LASSO) regression, random forest, and support vector machine (SVM) with linear kernel and polynomial kernel. | Genetic algorithm (GA) and support vector machine (SVM) model. | Artificial neural networks (ANNs), support vector machines (SVMs), random forest (RF). |
| Attribute data | Used 36 attributes including sex, age, TB type (intra-pulmonary TB or extra-pulmonary TB), disease history (diabetes mellitus, hypertension, dyslipidemia, end stage renal disease, cerebrovascular accident, dementia, congestive heart failure, chronic obstructive pulmonary disease, asthma, malignancy, autoimmune disease, liver cirrhosis, previous TB, hepatitis, pleural effusion, TB medication, and laboratory data. | Used 22 attributes including country, education level, sex, employment status, type of resistance, number of daily contacts, Body Mass Index (BMI), localization in the lung, number of X-rays, number of CT scans, dissemination, pleural effusion, pneumothorax, pleuritis, process extension, decrease in lung capacity, lung cavern, culture results, microscopy results, social risk factors (including smoking, alcoholism, ex-prisoner, Multi Drug-resistant patients etc.), and drug regimen. | Used 112 attributes including baseline covariates: gender, microbiological data, age of onset, TB group, direct smear test profile for second-line drugs; time-dependent covariates: smear, culture, direct smear test profile for first-line drugs | Used 28 attributes including country, age of onset, sex, education level, employment status, number of daily contacts, type of resistance, body mass index, localization in the lung, number of X-rays, number of CT scans, dissemination, size of the lung cavity, pleural involvement, imaging pattern, pneumothorax, pleuritis, nodal calcinosis, process extension, decrease in lung capacity, lung cavities, culture results, microscopy results, social risk factors, and drug regimen. | Used 35 attributes including sex, residence, occupation, marital, dwelling, drink, smoking, HIV, diabetes, alcohol, trips to traditional healer after TB positive, preferred health care provider to visit when sick, missing treatment in last 4 days, how often patient missed taking TB drugs private treatment type, whether patient takes traditional medicine, private doctor treatments in the past 24 months, traditional healer treatments in the past 24 months, medicine taken before TB diagnosis, and household income. | Used 52 attributes including demographics, screening, medical tests, Diagnosis, baseline treatment, and other variables related to TB treatment |
| Testing results | Area under the receiver operating characteristic curve in predicting acute hepatitis, respiratory failure, and mortality was 0.928, 0.884, and 0.834, respectively | Accuracy: 70–78%. | Sensitivity and positive predictive value increased to 0.84 and 0.88, respectively, for the not cured class. | Area under the receiver operating characteristic curve: 0.74. | SVM with GA is capable of achieving 67% of accuracy. | Accuracy: 76.01–76.32%. |
| Year | 2022 | 2020 | 2022 | 2018 | 2021 | 2019 |
Disclaimer/Publisher’s Note: The statements, opinions and data contained in all publications are solely those of the individual author(s) and contributor(s) and not of MDPI and/or the editor(s). MDPI and/or the editor(s) disclaim responsibility for any injury to people or property resulting from any ideas, methods, instructions or products referred to in the content. |
© 2023 by the authors. Licensee MDPI, Basel, Switzerland. This article is an open access article distributed under the terms and conditions of the Creative Commons Attribution (CC BY) license (https://creativecommons.org/licenses/by/4.0/).
Share and Cite
Liao, K.-M.; Liu, C.-F.; Chen, C.-J.; Feng, J.-Y.; Shu, C.-C.; Ma, Y.-S. Using an Artificial Intelligence Approach to Predict the Adverse Effects and Prognosis of Tuberculosis. Diagnostics 2023, 13, 1075. https://doi.org/10.3390/diagnostics13061075
Liao K-M, Liu C-F, Chen C-J, Feng J-Y, Shu C-C, Ma Y-S. Using an Artificial Intelligence Approach to Predict the Adverse Effects and Prognosis of Tuberculosis. Diagnostics. 2023; 13(6):1075. https://doi.org/10.3390/diagnostics13061075
Chicago/Turabian StyleLiao, Kuang-Ming, Chung-Feng Liu, Chia-Jung Chen, Jia-Yih Feng, Chin-Chung Shu, and Yu-Shan Ma. 2023. "Using an Artificial Intelligence Approach to Predict the Adverse Effects and Prognosis of Tuberculosis" Diagnostics 13, no. 6: 1075. https://doi.org/10.3390/diagnostics13061075
APA StyleLiao, K.-M., Liu, C.-F., Chen, C.-J., Feng, J.-Y., Shu, C.-C., & Ma, Y.-S. (2023). Using an Artificial Intelligence Approach to Predict the Adverse Effects and Prognosis of Tuberculosis. Diagnostics, 13(6), 1075. https://doi.org/10.3390/diagnostics13061075


