Abstract
The causes of sore throat are complex. It can be caused by diseases of the pharynx, adjacent organs of the pharynx, or even systemic diseases. Therefore, a lack of medical knowledge and experience may cause misdiagnoses or missed diagnoses in sore throat diagnoses, especially for general practitioners in primary hospitals. This study aims to develop a computer-aided diagnostic system to assist clinicians in the differential diagnoses of sore throat. The computer-aided system is developed based on the Dynamic Uncertain Causality Graph (DUCG) theory. We cooperated with medical specialists to establish a sore throat DUCG model as the diagnostic knowledge base. The construction of the model integrates epidemiological data, knowledge, and clinical experience of medical specialists. The chain reasoning algorithm of the DUCG is used for the differential diagnoses of sore throat. The system can diagnose 27 sore throat-related diseases. The model builder initially tests it with 81 cases, and all cases are correctly diagnosed. Then the system is verified by the third-party hospital, and the diagnostic accuracy is 98%. Now, the system has been applied in hundreds of primary hospitals in Jiaozhou City, China, and the degree of recognition for doctors to the diagnostic results of the system is more than 99.9%. It is feasible to use DUCG for the differential diagnoses of sore throat, which can assist primary doctors in clinical diagnoses and the diagnostic results are acceptable to clinicians.
1. Introduction
Sore throat is a common clinical symptom. Pharyngeal infection, trauma, ulcer, foreign body, malignant tumor, styloid process syndrome, and some systemic diseases manifest as sore throats of varying degrees [1,2,3]. Because the causes of sore throat are complex, it is necessary to make differential diagnoses. Lack of clinical experience may lead to missed diagnoses or misdiagnoses of sore throat, especially for doctors in primary hospitals. Therefore, using computer-aided technology to complete the diagnosis of sore throat is one of the solutions. Computer-aided diagnoses and decision-making systems can help doctors shorten diagnostic time, reduce missed diagnoses and misdiagnoses, and make the diagnoses as soon as possible [4,5,6,7]. Since 1970, various algorithms have been applied to computer-aided clinical diagnoses, including rule-based algorithms [8,9,10,11], case-based reasoning methods [12], machine learning methods [13,14,15,16,17,18,19], and probabilistic models [20,21,22,23]. However, those algorithms have some defects when used in computer-aided clinical diagnoses. Clinical diagnoses require a lot of knowledge, but the rule-based and case-based methods are challenging to manage a large amount of knowledge, existing problems of knowledge conflict, and reasoning inefficiency. The computer-aided clinical diagnostic system needs to be interpretable. Most machine learning algorithms have no explainable or weak interpretability. For example, the SVM and the neural network models are incomprehensible to doctors, and their algorithms cannot interpret how the diagnostic results are obtained. The Bayesian network is one of the probabilistic graphical models with the ability of interpretability. The training of conditional probability tables (CPTs) requires a lot of high-quality data sets. However, in reality, it is difficult for us to obtain a large number of high-quality medical records to train Bayesian networks, which affects the practical application of the Bayesian network in computer-aided clinical diagnoses. These shortcomings weaken doctors’ confidence in the diagnostic results. Therefore, those models are difficult to generalize in practical clinical applications.
The algorithms applied in computer-aided clinical decision-making need to have high diagnostic accuracy. Meanwhile, it also requires the capability of interpreting the results, and the diagnostic methods are in line with the diagnostic idea of clinical doctors.
Currently, the clinical diagnostic system can be divided into expert knowledge-based and neural network-based. The rule-based expert systems have explanatory ability, but their reasoning efficiency is not high, and they have difficulties in knowledge management. The neural network-based diagnostic systems have no interpretability to the diagnostic results. In this study, we developed an intelligent clinical diagnostic system based on the DUCG for sore throat diseases. It has high reasoning efficiency and the ability to explain results. The model of DUCG can be built in a modular way. This feature makes it easy to build and update complex knowledge bases. The inference process of the DUCG is transparent to doctors, and the diagnostic results are well interpretable, making the diagnostic results more acceptable to clinical doctors. Now, this system has been applied to assist doctors in completing clinical diagnoses in primary hospitals, and it has high diagnostic accuracy.
The rest of this paper is organized as follows. Section 2 introduces the theoretical basis of DUCG, inference methods, and modeling methods of sore throat based on DUCG. Section 3 explains the validation process and results of the diagnostic model of sore throat based on DUCG. Section 4 concludes this paper and outlines future work.
2. Materials and Methods
2.1. Causal Expression of DUCG
The dynamic uncertain causality graph is a probabilistic graphical model. It can graphically represent the uncertain causalities of events and perform causal reasoning based on the DUCG model [24]. Figure 1 depicts a simple DUCG model. B1, B6, and B10 are root cause events, other variables are consequence events, and they are caused directly or indirectly by these three variables. The red-directed arcs indicate the causal propagation directions. From this DUCG model, we can understand the causal propagation paths among events, such as the causal path (B1→X2→X3→X9). The variables and their physical meaning in the DUCG are illustrated in Appendix A. When constructing the DUCG model, we can select appropriate types of variables to express knowledge according to the characteristics and functions of events. Different variables play different roles in the causal reasoning process. The DUCG model can be built in a modular way. When building a large and complex DUCG model, we can model some local knowledge as some sub-DUCGs. Then those sub-DUCGs can be automatically merged into a complete DUCG model according to the compilation rules of DUCG [25]. This modular knowledge base construction method reduces the construction difficulty of the large and complex knowledge base and makes the DUCG model well-maintainable. When we need to modify the DUCG model, we only need to modify the local knowledge in the corresponding sub-DUCGs, to achieve the purpose of modifying the whole DUCG model. Some other features of DUCG include: (1) DUCG can deal with loops, so the DUCG model supports the expression of causal loops [26]; (2) DUCG can deal with discrete, continuous, and fuzzy evidence, which increases the robustness of the model [25,27]; (3) the causal reasoning of DUCG depends much on the structure of the model and has low requirements for the precision of model parameters; (4) DUCG can realize the concise expression of knowledge and allow the incomplete expression of knowledge.
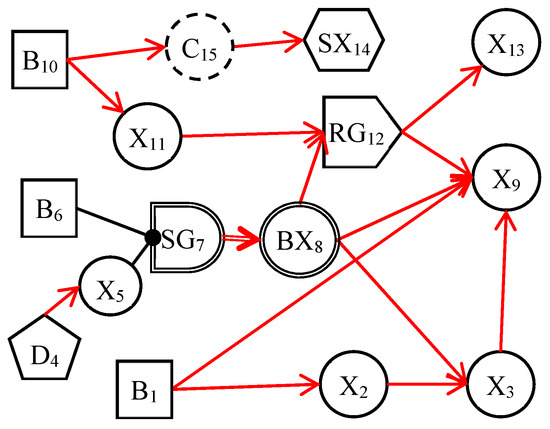
Figure 1.
An example of DUCG.
In DUCG, the causal mechanism between a child variable and its parent variables is shown in Figure 2. The child event Xnk may be caused by one or more parent events. In order to calculate the probability that each parent variable causes the occurrence of the child event, the child event performs logic expression expansion operations along the opposite direction of the causal chain. After expression expansion, the child event is expressed by its parent variables. The expansion process can be executed recursively until the parent events are the B-type or BX-type variables. The B-type and BX-type variables are the root causes of other variables and the targets of inference calculation. The logic expansion expression is shown in Equation (1).
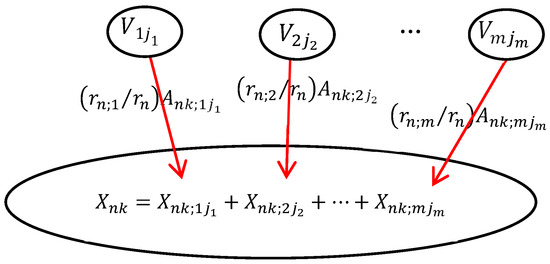
Figure 2.
The causal mechanism of the DUCG.
For simplicity, Equation (1) can be briefly written as Equation (2).
In Equation (2), Xnk (n is the index of the variable in DUCG, k is the current state of Xn, usually, k ≠ 0 stands for the abnormal state) denotes the child event. Vij (V∈{B, X, BX, RG, D, SG}) denotes the parent variables of Xn. Fnk;ij = (rn;i/rn)Ank;ij is the weighted functional event, the strength of causality that the parent variable Vij affects the child variable Xnk. Ank;ij denotes the virtual random functional event representing the causal mechanism that Vij independently causes Xnk. rn;i/rn
() is the weight; it is used to normalize the effect of parent variables on child variables.
2.2. The Inference Process of the DUCG
The reasoning process of DUCG contains four steps: DUCG simplification, DUCG decomposition, expression expansion, and probability calculation.
Step 1. DUCG simplification. Simplifying the DUCG according to the current evidence E (E = E′E″, E′ = {Xij, j ≠ 0} is the collection of abnormal evidence, E″ = {Xi0} is the collection of normal evidence) based on the simplification rules of DUCG. The purposes of simplification are deleting the unrelated variables and causalities under the current evidence and reducing the complexity of inference computation. The simplified DUCG demonstrates the causalities between current evidence and their related hypotheses.
Step 2. Decomposition. The inference of DUCG is based on the rule that abnormal evidence is caused by only one root cause at once. The purpose of decomposition is to decompose the simplified DUCG into a series of sub-DUCGs. The sub-DUCG demonstrates the causalities between a single hypothesis and the current evidence. Meanwhile, we get the hypothesis set SH = {Hkj} = {Bkj, BXkj}.
Step 3. Logical expansion of HkjE. Expand HkjE according to Equation (2) on each sub-DUCGs. We can get the evidence expansion expressions in the form of sum-of-products composed of only {B-, BX-, D-, A-, r-}-type events and parameters on each sub-DUCGs, they are used for conditional probability calculation in the next step.
Step 4. Probability calculation. Calculate the evidence probability ζkj = Pr{HkjE} on each sub-DUCG. According to the expansion result of HkjE in Step 3, ζkj can be easily obtained. Then the conditional probability of each hypothesis can be calculated by Equation (3).
The results are ranked in descending order as the final inference results.
2.3. Sore Throat DUCG Modeling
We cooperated with ENT specialists to construct the sore throat DUCG. The construction of the model not only uses the expert’s clinical knowledge and experience but also uses the results of statistical data [28]. The sore throat DUCG is built in a modular way. We model each disease as one individual sub-DUCG. Then, those sub-DUCGs are merged into one complete DUCG as the knowledge base for sore throat diagnoses. An example of laryngopharyngeal reflux (LPR) illustrates the process of constructing the sub-DUCG.
LPR is a common disease in otolaryngology. Due to the lack of understanding of the disease in the past, the disease has been misdiagnosed as chronic pharyngitis for a long time. In recent years, as otolaryngologists have gradually deepened their understanding of laryngopharyngeal reflux, they found that the incidence of laryngopharyngeal reflux in the population is very high, accounting for 10% of all patients in otolaryngology outpatient clinics and 50% of patients with hoarseness. The DUCG of LPR is shown in Figure 3. B23 ( ) stands for LPR. It has two states; state 0 indicates its negative state and state 1 indicates its positive state with a priori probability of 0.03 (Pr{B23,1} = 0.03). This probability can be obtained from statistical data of the disease or depending on the experience of the clinical specialists. A history of reflux esophagitis is one risk factor for LPR; people with a history of reflux esophagitis can increase the incidence of LPR 10 times more than people without a reflux esophagitis history. As shown in Figure 3, we use the X-type variable numbered X74 (
 ) to stand for the history of reflux esophagitis. SG23 (
 ) is a special logic gate; its logic specification table records the risk factor combination of X74 shown in Equation (4) [29]. Equation (4) means that when X74,1 is true, state 1 of SG23 is true (SG23,1). Otherwise, the state 0 is true (SG23,0). The different states of SG23 act with different affections to the incidence of the LPR. The special functional event variable SA23;23 records the strength of the effect of risk factors on the disease shown in Equation (5).
) stands for LPR. It has two states; state 0 indicates its negative state and state 1 indicates its positive state with a priori probability of 0.03 (Pr{B23,1} = 0.03). This probability can be obtained from statistical data of the disease or depending on the experience of the clinical specialists. A history of reflux esophagitis is one risk factor for LPR; people with a history of reflux esophagitis can increase the incidence of LPR 10 times more than people without a reflux esophagitis history. As shown in Figure 3, we use the X-type variable numbered X74 () to stand for the history of reflux esophagitis. SG23 () is a special logic gate; its logic specification table records the risk factor combination of X74 shown in Equation (4) [29]. Equation (4) means that when X74,1 is true, state 1 of SG23 is true (SG23,1). Otherwise, the state 0 is true (SG23,0). The different states of SG23 act with different affections to the incidence of the LPR. The special functional event variable SA23;23 records the strength of the effect of risk factors on the disease shown in Equation (5).
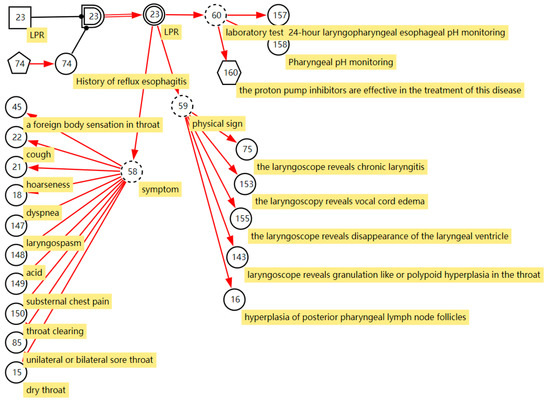
Figure 3.
The DUCG of laryngopharyngeal reflux.
BX23 ( ) stands for the incidence of the disease when X74,1 is true, Pr{BX23,1} = Pr{SA23,1;23,1B23,1} = 10 × 0.03 = 0.3. In this way, we express the effect of risk factors on disease incidence in DUCG. Manifestations caused by LPR are drowning as the children of the BX-type variable; most of them are represented by the X-type variable standing for the nonspecific clinical manifestations, except the manifestation “proton pump inhibitors are effective in the treatment of this disease”. The manifestation SX160 (
 , proton pump inhibitors are effective in the treatment of this disease) is the clinical gold standard for LPR diagnosis; it is represented by the SX-type variable. When the manifestation appears, the disease can be directly diagnosed based on this evidence. Appendix B shows the parameters of causal strength between variables of the sub-DUCG of LPR shown in Figure 3. This sub-DUCG model describes the relationship between LPR and its clinical diagnostic information, including the involved symptoms, signs, laboratory tests, diagnostic gold standard, risk factors, and other information. This information is understandable to doctors.
) stands for the incidence of the disease when X74,1 is true, Pr{BX23,1} = Pr{SA23,1;23,1B23,1} = 10 × 0.03 = 0.3. In this way, we express the effect of risk factors on disease incidence in DUCG. Manifestations caused by LPR are drowning as the children of the BX-type variable; most of them are represented by the X-type variable standing for the nonspecific clinical manifestations, except the manifestation “proton pump inhibitors are effective in the treatment of this disease”. The manifestation SX160 (, proton pump inhibitors are effective in the treatment of this disease) is the clinical gold standard for LPR diagnosis; it is represented by the SX-type variable. When the manifestation appears, the disease can be directly diagnosed based on this evidence. Appendix B shows the parameters of causal strength between variables of the sub-DUCG of LPR shown in Figure 3. This sub-DUCG model describes the relationship between LPR and its clinical diagnostic information, including the involved symptoms, signs, laboratory tests, diagnostic gold standard, risk factors, and other information. This information is understandable to doctors.The complete DUCG with a sore throat as the chief complaint is shown in Figure 4. Currently, it contains 27 diseases, including acute and chronic inflammation, trauma, cancer, and other diseases related to sore throat; the diseases are shown in Table 1. A total of 354 variables are used to build the DUCG, 27 groups of {B, SG, BX}-type variable combinations are used to represent diseases and the impact of risk factors on diseases. A total of 153 X-type variables are divided into two classes, 22 variables are used to stand for the risk factors, 131 variables are used to represent nonspecific clinical manifestations, and 11 SX-type variables stand for the specific clinical manifestations. A total of 76 C-type variables are used to classify the diseases’ manifestations in each sub-DUCG. A total of 651 F-type variables are used to represent the causalities between variables. As we can see, the complete DUCG is complex, and it is difficult for medical specialists to build this knowledge base directly on one graph. The modular knowledge base construction method of DUCG makes the construction of large and complex knowledge bases feasible and simple.
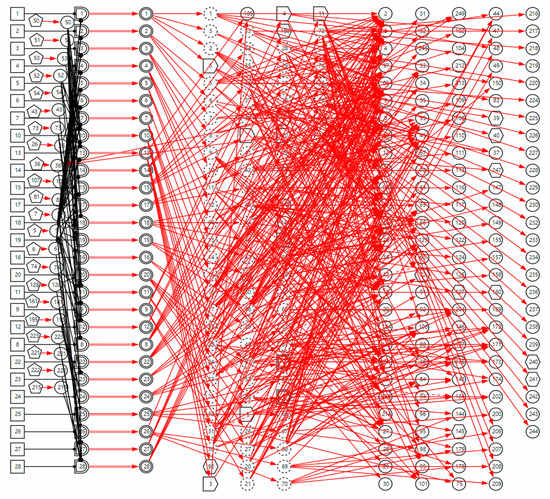
Figure 4.
The complete DUCG of sore throat is used as the diagnostic knowledge base for sore throat.

Table 1.
The sore throat-related diseases in the complete DUCG.
3. Results
The computer-aided diagnostic model based on DUCG has good interactivity and interpretability. Doctors can make clinical inquiries based on diagnoses and carry out the following diagnosis until the disease is confirmed. A case is employed to explain the diagnostic process of DUCG.
A young (X7,4) male (X52,1) patient with bilateral sore throat (X85,1) as the chief complaint, together with the symptoms of hoarseness (X21,1), foreign body sensation in throat (X45,1), throat itching (X44,1), throat clearing (X150,1), subacute stage (X5,1), other symptoms that need to be consulted are negative, i.e., dry throat (X51,0), cough (X22,0), expectoration (X23,0), dyspnea (X18,0). When we input the evidence E = E′E″ into the model (E′ = X7,4X52,1X85,1X21,1X15,1X45,1X44,1X150,1X5,1 is the positive symptoms of the patient, E″ is the negative symptoms of the patient). The top 5 inference results are shown in Table 2, and the probabilities of other diseases are less than 1%.
Table 2.
The diagnostic result of DUCG basing on the patient’s current symptoms.
According to the patient’s current symptoms, the inference results of the DUCG show that the patient is most likely to have chronic laryngitis. Chronic pharyngitis comes second, and LPR comes third. The patient is less likely to suffer from other diseases. Figure 5, Figure 6 and Figure 7 are graphic interpretations of the three diseases. From Figure 5, we can see that chronic laryngitis can explain most abnormal symptoms, except for the evidence of throat clearing (X150,1). Throat clearing is not the manifestation of chronic pharyngitis. Therefore, it is regarded as isolated evidence in the Figure. Standing for it cannot be explained by the current disease. It decreases the conditional probability of the disease during the reasoning calculation. X15,0, X23,0, and X22,0 are normal evidence; they function as negative evidence to reduce the conditional probability of the disease. X5,1 and X52,1 are two risk factors for chronic laryngitis. They increase the incidence of the disease. Similarly, chronic pharyngitis and laryngopharyngeal reflux also have isolated and normal evidence. In the DUCG model, the prior probabilities of the three diseases are 0.04, 0.09, and 0.03. Therefore, the diagnostic result is reasonable based on the current evidence, and the diagnostic results provide a reference for follow-up consultation and physical examination.
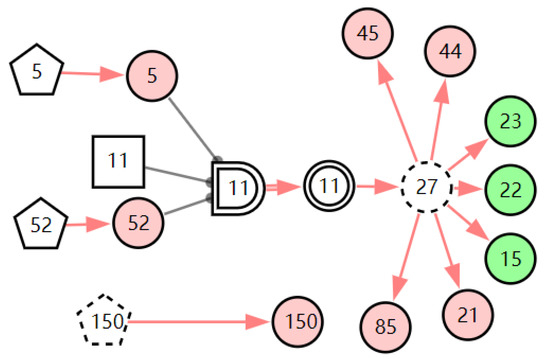
Figure 5.
The graphic interpretation of chronic laryngitis when E′ = X7,4X52,1X85,1X21,1X15,1X45,1X44,1X150,1X5,1.
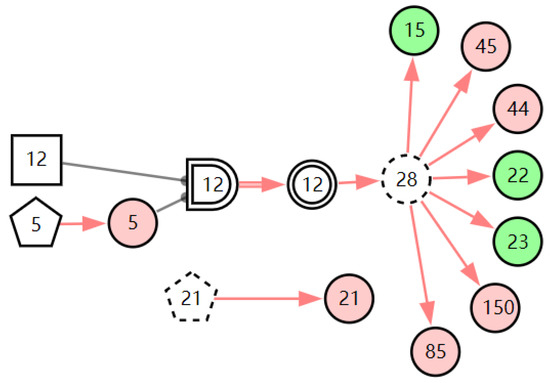
Figure 6.
The graphic interpretation of chronic pharyngitis when E′ = X7,4X52,1X85,1X21,1X15,1X45,1X44,1X150,1X5,1.
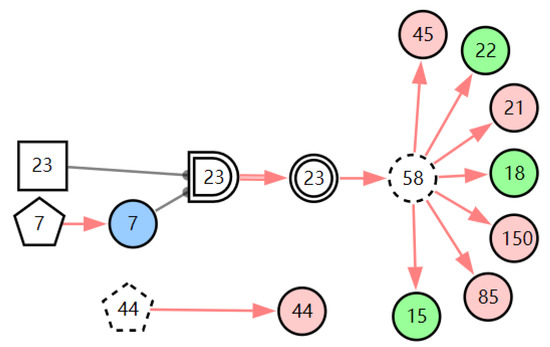
Figure 7.
The graphic interpretation of LPR when E′ = X7,4X52,1X85,1X21,1X15,1X45,1X44,1X150,1X5,1.
According to the first diagnostic result, the physical signs related to these three diseases were checked first. Physical examination found that the patient has one positive physical sign; laryngoscopy reveals vocal cord edema. The evidence E = E′E″(E′ = X7,4X52,1X85,1X21,1X15,1X45,1X44,1X150,1X5,1X153,1) is inputted into the model for another diagnosis, and the diagnostic results are shown in Table 3. The probability of LPR is 82.74%. The probabilities of acute laryngitis and chronic laryngitis are only 11.11% and 6.11%. They are far less than the probability of LPR. From the graphic interpretation in Figure 8, Figure 9 and Figure 10, we can see that LPR can explain the patient’s abnormal physical signs. Although acute laryngitis can explain abnormal physical signs, it has 3 unexplainable abnormal symptoms. Similarly, chronic laryngitis can not explain abnormal physical signs. We can initially confirm that the patient has LPR, depending on the diagnostic result. In the following, some laboratory tests or imaging tests related to LPR are done to validate the result.
Table 3.
The diagnostic result of DUCG basing on the patient’s current symptoms and physical signs.
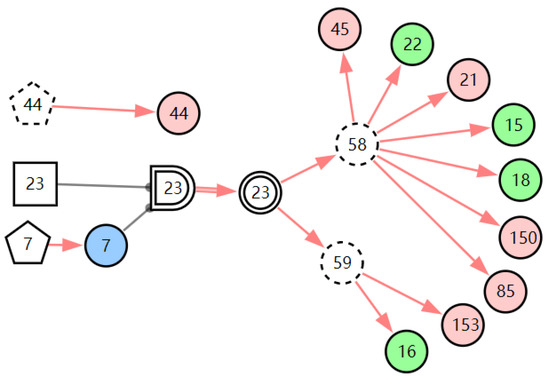
Figure 8.
The graphic interpretation of LPR when E′ = X7,4X52,1X85,1X21,1X15,1X45,1X44,1X150,1X5,1X153,1.
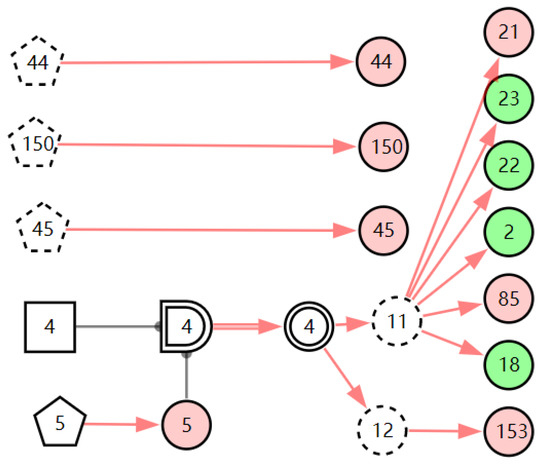
Figure 9.
The graphic interpretation of acute laryngitis when E′ = X7,4X52,1X85,1X21,1X15,1X45,1X44,1X150,1X5,1X153,1.
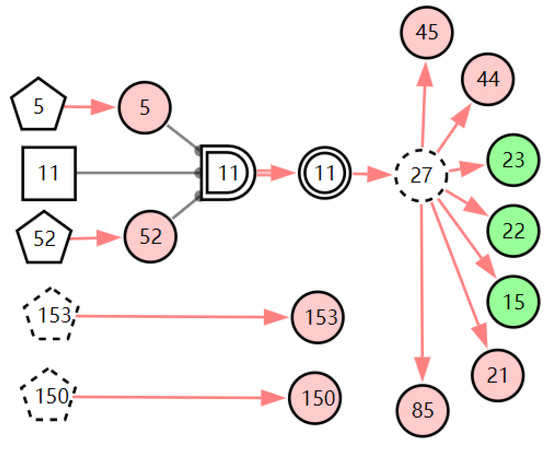
Figure 10.
The graphic interpretation of chronic laryngitis when E′ = X7,4X52,1X85,1X21,1X15,1X45,1X44,1X150,1X5,1X153,1.
In the case record, the patient’s routine blood test report showed that the patient’s neutrophil percent (NEUT%) was normal (X9,0) and the white blood cell count (WBC) was normal (X8,0). The result of pharyngeal pH monitoring was positive (X158,1). When we inputted this new evidence E = X158,1X9,0X8,0 to the model, the diagnostic results showed that the probability of LPR is 99.98%. From the graphic interpretation in Figure 11, we can see that LPR can explain all the abnormal evidence except throat itching. This means most of the abnormal evidence can be traced back to LPR, so the diagnostic result is believable. Throat itching is not the clinical manifestation of LPR; it is regarded as interference with the diagnosis of LPR. The existence of interference evidence does not affect the diagnostic results of the model, which shows that the model has good robustness.
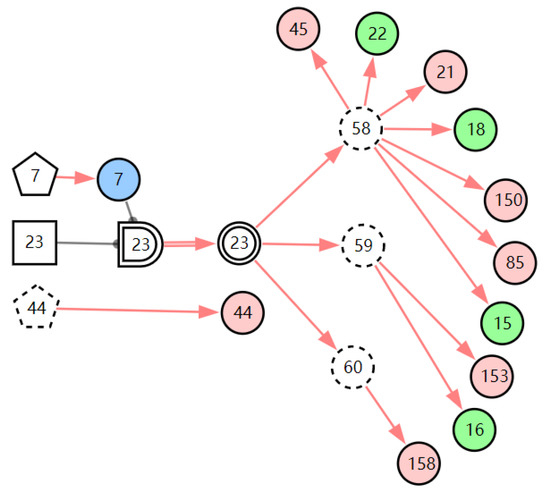
Figure 11.
The graphic interpretation of LPR when E′ = X7,4X52,1X85,1X21,1X15,1X45,1X44,1X150,1X5,1X153,1X158,1.
This case study demonstrates the whole diagnostic process of the DUCG. The disease is finally diagnosed through a gradual process of continuous inference and clinical inquiries. Based on the diagnostic result in each step, the scope of the disease is determined. Further consultation information for each disease can be calculated based on the DUCG. The graphical explanation can explain every step of the calculation so that the doctor can understand the whole reasoning process of the system, and it is convenient for the doctor to make a judgment on rejecting or accepting the reasoning results of the system.
The validation of the model contains two stages. First, the creator of the knowledge base self-tests the model. The purpose of the self-test is to initially verify the correctness of knowledge representation in the model and adjust the knowledge structure of the model according to the test results. The test cases are selected from published case reports, outpatient cases, or created by the medical specialists by their experience. For the diseases in the DUCG model, each disease was tested with 3 cases, and a total of 81 cases were used to test the model. The accuracy of the test was 100%. The self-test results manifest that the medical knowledge expression of the model is reasonable and correct. If the test finds that the knowledge expression is wrong, the medical specialist should modify the model. After modifying the model, the original case and some new cases are used to test the model again to avoid the overfitting problem.
The second stage of testing is third-party testing. The third-party hospital is Suining Central Hospital, a Grade 3 and Class A hospital located in Suining City, Sichuan Province. During the test, the doctor reads the clinical information in the case, inputs it into the system for calculation, and compares whether the calculation results of the system are consistent with the case record results. The test cases are randomly selected from the health information system (HIS) of the hospital from the past five years. The test cases were obtained using an equal sampling method. Each disease is tested with 10 cases. If there are fewer than 10 cases of the disease, all eligible cases are used to test for the disease. The test results are shown in Table 4.
Table 4.
The third-party test of the model in Suining Central Hospital.
In the HIS of Suining Central Hospital, in the past five years, a total of 2592 cases can be used to test the diagnosis model of pharyngeal pain, among which there are more common inflammatory diseases and fewer tumor-related diseases. A total of 196 cases with sore throat as their chief complaint was used to test the model, accounting for 7.5% of the total cases. For each case, the doctor reads the patient’s clinical information recorded in the case and inputs it into the system. The system makes clinical diagnoses according to the input information and outputs the probability of each disease the patient may have in the form of probabilities. The top 1 disease is regarded as the system’s diagnostic result. Doctors compare the diagnosed diseases recorded in the cases with the system results. If the results are consistent, the system’s diagnostic result is true (true case); otherwise, the diagnosis is considered false (false case). The accuracy of the diagnostic system is evaluated by Equation (6).
Out of 196 cases, 194 cases were correctly diagnosed, and the diagnostic accuracy was 98.9%. Two cases were misdiagnosed. One infectious mononucleosis case was misdiagnosed as acute tonsillitis. Another case is peritonsillitis, which was misdiagnosed as chronic pharyngitis. Three diseases (pharyngeal burn, laryngeal syphilis, and pharyngeal syphilis) are not validated because there have been no cases in the HIS of the hospital in the past five years.
After the third-party test, the model was used for clinical assistant diagnoses in all primary hospitals in Jiaozhou City, Shandong Province, China. In clinical diagnoses, the doctor inputs the patient’s self-reported symptoms and physical signs into the system for preliminary calculation. For some common diseases, if the doctor highly agrees with the diagnostic result, then the diagnosis is completed, and the doctor evaluates the diagnostic results of the system. For some uncommon diseases, such as cancer, the doctor should input the patient’s symptoms and physical signs for initial diagnoses and advise the patient to perform corresponding imaging or laboratory tests. Then, all the evidence is input into the system for diagnoses. This result is used as the final diagnostic result. The actual application of the model is shown in Table 5.
Table 5.
Application of sore throat diagnostic model in primary hospitals in Jiaozhou City.
Table 5 is the application data of the system from 8 April 2020 to 16 April 2022. In the past two years, doctors used the system to diagnose 7236 patients with sore throat, involving a total of 16 conditions. In the process of using the system, we collected doctors’ feedback on the recognition of diagnostic results. Doctors’ recognition of the diagnostic system exceeded 99.9%. Among the 7236 diagnostic results, doctors had doubts about the diagnostic results only once. This shows that it is feasible to use the system for clinical assistant diagnoses in primary hospitals.
4. Conclusions
Doctors in primary hospitals have the problem of a lack of diagnostic knowledge and insufficient experience, which is the main reason for missed diagnoses and misdiagnoses. In this study, we develop a computer-aided diagnostic system for differential diagnoses of sore throats based on DUCG. The diagnostic model integrates medical specialists’ knowledge, experience, and epidemiological data and presents the diagnostic knowledge of diseases in a way that doctors can intuitively understand. The purpose of designing the diagnostic system is to help doctors make differential diagnoses of sore throat-related diseases and reduce misdiagnoses and missed diagnoses caused by lacking knowledge and experience. Meanwhile, we hope doctors can improve their diagnostic experience and knowledge using the system.
The diagnostic accuracy of the model depends on the accuracy and completeness of expert clinical diagnosis and knowledge expression. Therefore, this study’s main challenge is building a large and complex diagnostic model and ensuring the accuracy of knowledge expressed in the model. Building a knowledge base with experienced clinical experts and verifying the knowledge base many times is one method to ensure the accurate expression of knowledge. With the help of DUCG’s modular model construction method and causal knowledge expression method, each disease is constructed as an independent sub-DUCG model, which can be understood and maintained easily. The reasoning mode of DUCG is chain reasoning; that is, based on the current evidence, the evidence along the causal propagation chain is expanded until it reaches the root cause variable, then the conditional probability of each hypothesis under the current evidence is calculated, and the results are explained graphically. This reasoning method is in line with the diagnostic idea of evidence-based medicine in clinical science and is easily accepted by doctors.
The model was built by medical specialists in otolaryngology at Capital Medical University Xuanwu Hospital and can differentially diagnose 27 common and uncommon sore throat-related diseases. The model used 81 cases from Xuanwu Hospital for self-test, and the test accuracy was 100%. Then, the model was tested by a third party, and the test accuracy was 99.8%. Currently, the model has been applied in primary hospitals in Jiaozhou City, Shandong Province. Doctors agree with the diagnosis results by more than 99.9%. This shows that it is feasible to use DUCG for sore throat-related diseases and has high diagnostic accuracy. It can be applied to primary hospitals to assist doctors in clinical diagnosis. Meanwhile, the study indicates that it is feasible to construct a diagnostic model based on expert knowledge, experience, and statistical data.
The purpose of this study is to differentially diagnose the diseases with a sore throat as the chief complaint, that is, the patient with a sore throat as his main symptom. If the patient has no sore throat or it is not his main symptom, this diagnostic model is not applicable. In order to realize clinical assistant diagnoses in general practice, we construct many diagnostic models according to different chief complaints. For example, the model of abdominal pain takes abdominal pain as the chief complaint and can diagnose 93 kinds of diseases related to abdominal pain. At present, we have constructed 46 diagnostic models with different chief complaints, and these models have been applied in clinical practice. In clinical diagnoses, the doctor chooses the corresponding diagnostic model according to the patient’s chief complaint, then inputs the patient’s clinical information for diagnoses. We constantly update and improve the diagnostic system according to the doctors’ feedback. There are two kinds of improvement. The first is the improvement of the chief complaint. If the doctors propose to add a new chief complaint model, we will build a new DUCG model based on the chief complaint, and all diseases in the model will take the chief complaint as the main symptom. The second part is the updating and improvement of the model. If doctors find a disease missing in the model, we will add the disease to the model so that the model can diagnose this disease. Based on the DUCG modular modeling approach, this model is easily updated. We plan to use this approach to improve the disease diagnosis capabilities of the system continuously. In the following work, we will continue to expand the model so that the model can diagnose more diseases. In addition, we consider adding treatment guidelines to the model so that the model can recommend treatment for doctors after getting the diagnostic conclusion.
Author Contributions
Conceptualization: Q.Z., X.B. and Z.Z.; Model building: M.Z.; Supervision: Q.Z. and Z.Z.; Data curation: M.Z. and Z.Z.; Methodology: X.B., Q.Z. and Z.Z.; Implementation: X.B. and M.Z.; Writing—original draft: X.B.; Writing—review and editing: all the authors. All authors have read and agreed to the published version of the manuscript.
Funding
This research was supported by Institute for Guo Qiang, Tsinghua University (project number: 2020GQG0001).
Institutional Review Board Statement
Not applicable.
Informed Consent Statement
Not applicable.
Data Availability Statement
The data presented in this study are available on request from the corresponding author. The data are not publicly available due to the medical record data involves patient privacy.
Acknowledgments
The authors would like to thank Hu Jie at Suining Central Hospital for his help in model testing.
Conflicts of Interest
The authors declare no conflict of interest.
Appendix A
The variables and their physical meaning in the DUCG.
The root cause variable (B-type variable, written as Bn, represented as  ) is used to represent the root cause that causes other variables to occur.
) is used to represent the root cause that causes other variables to occur.The consequence or process variable (X-type variable, written as Xn, represented as  ), which is used to represent the result caused by the root cause variable, can also be used as the cause of other variables.
), which is used to represent the result caused by the root cause variable, can also be used as the cause of other variables.The special manifestation of a root cause variable (SX-type variable, written as SXn, represented as  ), only connects with one root cause variable. If it is true, then the corresponding root cause must be true.
), only connects with one root cause variable. If it is true, then the corresponding root cause must be true.The unknown cause or default cause variables (D-type variable, written as Dn, represented as  ), when the cause of a variable’s occurrence is unknown, then a D-type variable is used to represent the root cause variable that causes it to occur.
), when the cause of a variable’s occurrence is unknown, then a D-type variable is used to represent the root cause variable that causes it to occur.The special logic gate (SG-type variable, written as SGn, represented as  ) is only used to express logical relationships between the B-type variable and X-type variables.
) is only used to express logical relationships between the B-type variable and X-type variables.The integrated cause variable (BX-type variable, written as BXn, represented as  ) integrates multiple root cause events as one cause event. It expresses the joint affection of multiple causes.
) integrates multiple root cause events as one cause event. It expresses the joint affection of multiple causes.The classification variable (C-type variable, written as Ci, represented as  ) can organize the variable by group, making the DUCG more readable and understandable.
) can organize the variable by group, making the DUCG more readable and understandable.The reverse logic gate (RG-type variable, written as RGn, represented as  ) is used to represent the logic combinations of its child variables.
) is used to represent the logic combinations of its child variables.The red-directed arc (F-type variable, written as Fn;i, represented as →) is the weighted functional event variable; it is used to represent and quantify the causalities between parent variables and child variables. The red dashed directed arc is the condition weighted functional event variable; its condition is described as Zi;j. When Zi;j is true, the causal relationship between its parent and child variable holds. Otherwise, the causality does not exist.
The double line directed arc (SA-type variable, written as SAn;I, represented as  ) is the special functional event variable. It is only used between the SG-type variable and BX-type variable, quantifying the joint affection of the variable combinations in the logical gate specification of the SG-type variable.
) is the special functional event variable. It is only used between the SG-type variable and BX-type variable, quantifying the joint affection of the variable combinations in the logical gate specification of the SG-type variable.Appendix B
The parameters of causal strength between variables in the DUCG of the LPR. The parameter bi records the prior probability of abnormal states of diseases. The parameter ai;j records the causal strengths that the variable Vj may cause Vi to occur. The parameter is the importance of variables, which is used to calculate the influence of isolated evidence on reasoning. The accuracy of these parameters is not strictly required. Doctors only need to give the relative magnitude of the action intensity between variables, while reasoning diagnosis has a high dependence on the model structure and low dependence on parameters.
References
- Currò, V.; Buonuomo, P.S.; De Rose, P.; Onesimo, R.; Vituzzi, A.; D’Atri, A. The evolution of web-based medical information on sore throat: A longitudinal study. J. Med. Internet Res. 2003, 5, e884. [Google Scholar] [CrossRef]
- Dalalah, D.; Magableh, S. remote fuzzy multicriteria diagnosis of sore throat. Telemed. E-Health 2008, 14, 656–665. [Google Scholar] [CrossRef] [PubMed]
- Wahab, D.; Bichard, J.; Shah, A.; Mann, B. Just a sore throat? Uncommon causes of significant respiratory disease. Case Rep. 2013, 2013, bcr2013008739. [Google Scholar] [CrossRef] [PubMed]
- Leaper, D.J.; Dombal, F.; Horrocks, J.C.; Staniland, J.R. Computer-Assisted Diagnosis of Abdominal Pain Using “Estimates” Provided by Clinicians. Br. J. Surg. 1972, 59, 897–898. [Google Scholar] [CrossRef]
- Anbar, M. Computer assisted clinical decisions: Present scope, limitations, and future. Int. J. Technol. Assess. Health Care 1986, 2, 168–176. [Google Scholar] [CrossRef]
- Innocent, P.R.; John, R.I. Computer aided fuzzy medical diagnosis. Inf. Sci. 2004, 162, 81–104. [Google Scholar] [CrossRef]
- Alkahlout, M.A.; Abujamie, T.N.; Abu-Naser, S.S. Throat Problems Expert System Using SL5. Int. J. Acad. Inf. Syst. Res. (IJAISR) 2021, 5, 68–78. [Google Scholar]
- Shortliffe, E.H. Computer-based medical consultations: MYCIN. J. Clin. Eng. 1976, 388. [Google Scholar] [CrossRef]
- Weiss, S.M.; Kulikowski, C.A.; Amarel, S.; Safir, A. A model-based method for computer-aided medical decision-making. Artif. Intell. 1978, 11, 145–172. [Google Scholar] [CrossRef]
- Myers, J.; Pople, H.; Miller, R.; Myers, J.; Pople, H.; Miller, R.; Myers, J.; Pople, H.; Miller, R.; Myers, J. INTERNIST-I, An Experimental Computer-Based Diagnostic Consultant for General Internal Medicine. In Computer-Assisted Medical Decision Making; Springer: New York, NY, USA, 1985. [Google Scholar]
- Tunmibi, S.; Adeniji, O.; Aregbesola, A.; Dasylva, A. A rule based expert system for diagnosis of fever. Int. J. Adv. Res. 2013, 1, 343–348. [Google Scholar]
- Kumar, K.A.; Singh, Y.; Sanyal, S. Hybrid approach using case-based reasoning and rule-based reasoning for domain independent clinical decision support in ICU. Expert Syst. Appl. 2009, 36, 65–71. [Google Scholar] [CrossRef]
- Joloudari, J.H.; Saadatfar, H.; Dehzangi, A.; Shamshirband, S. Computer-aided decision-making for predicting liver disease using PSO-based optimized SVM with feature selection. Inform. Med. Unlocked 2019, 17, 100255. [Google Scholar] [CrossRef]
- Mazurowski, M.A.; Habas, P.A.; Zurada, J.M.; Lo, J.Y.; Baker, J.A.; Tourassi, G.D. Training neural network classifiers for medical decision making: The effects of imbalanced datasets on classification performance. Neural Netw. 2008, 21, 427–436. [Google Scholar] [CrossRef]
- Ince, T.; Kiranyaz, S.; Pulkkinen, J.; Gabbouj, M. Evaluation of global and local training techniques over feed-forward neural network architecture spaces for computer-aided medical diagnosis. Expert Syst. Appl. 2010, 37, 8450–8461. [Google Scholar] [CrossRef]
- Vasilakos, A.V.; Tang, Y.; Yao, Y. Neural networks for computer-aided diagnosis in medicine: A review. Neurocomputing 2016, 216, 700–708. [Google Scholar]
- Zribi, M.; Boujelbene, Y. Neural networks in the medical decision making. Int. J. Comput. Sci. Inf. Secur. 2016, 14, 70. [Google Scholar]
- Arabasadi, Z.; Alizadehsani, R.; Roshanzamir, M.; Moosaei, H.; Yarifard, A.A. Computer aided decision making for heart disease detection using hybrid neural network-Genetic algorithm. Comput. Methods Programs Biomed. 2017, 141, 19–26. [Google Scholar] [CrossRef] [PubMed]
- Srivastava, A.K.; Kumar, Y.; Singh, P.K. Computer aided diagnostic system based on SVM and K harmonic mean based attribute weighting method. Obes. Med. 2020, 19, 100270. [Google Scholar] [CrossRef]
- D’Ambrosi, R.; Biancardi, E.; Massari, G.; Ragone, V.; Facchini, R.M. Computer-assisted Bayesian diagnosis of connective tissue diseases. Methods Inf. Med. 1981, 20, 19–23. [Google Scholar]
- Xiang, Y.; Pant, B.; Eisen, A.; Beddoes, M.P.; Poole, D. Multiply sectioned Bayesian networks for neuromuscular diagnosis. Artif. Intell. Med. 1993, 5, 293–314. [Google Scholar] [CrossRef]
- Tosetto, A.; Castaman, G.; Rodeghiero, F. Evidence-based diagnosis of type 1 von Willebrand disease: A Bayes theorem approach. Blood 2008, 111, 3998–4003. [Google Scholar] [CrossRef] [PubMed]
- Jackins, V.; Vimal, S.; Kaliappan, M.; Mi, Y.L. AI-based smart prediction of clinical disease using random forest classifier and Naive Bayes. J. Supercomput. 2020, 77, 5198–5219. [Google Scholar] [CrossRef]
- Zhang, Q. Dynamic Uncertain Causality Graph for Knowledge Representation and Reasoning: Discrete DAG Cases. J. Comput. Sci. Technol. 2012, 27, 1–23. [Google Scholar] [CrossRef]
- Zhang, Q.; Dong, C.; Cui, Y.; Yang, Z. Dynamic Uncertain Causality Graph for Knowledge Representation and Probabilistic Reasoning: Statistics Base, Matrix, and Application. IEEE Trans. Neural Netw. Learn. Syst. 2014, 25, 645. [Google Scholar] [CrossRef] [PubMed]
- Zhang, Q. Dynamic Uncertain Causality Graph for Knowledge Representation and Probabilistic Reasoning: Directed Cyclic Graph and Joint Probability Distribution. IEEE Trans. Neural Netw. Learn. Syst. 2015, 26, 1503–1517. [Google Scholar] [CrossRef] [PubMed]
- Zhang, Q. Dynamic Uncertain Causality Graph for Knowledge Representation and Reasoning: Continuous Variable, Uncertain Evidence, and Failure Forecast. IEEE Trans. Syst. Man Cybern. Syst. 2017, 45, 990–1003. [Google Scholar] [CrossRef]
- Zhang, Q.; Yao, Q. Dynamic Uncertain Causality Graph for Knowledge Representation and Reasoning: Utilization of Statistical Data and Domain Knowledge in Complex Cases. IEEE Trans. Neural Netw. Learn. Syst. 2018, 29, 1637–1651. [Google Scholar] [CrossRef]
- Zhang, Q.; Bu, X.; Zhang, M.; Zhang, Z.; Hu, J. Dynamic uncertain causality graph for computer-aided general clinical diagnoses with nasal obstruction as an illustration. Artif. Intell. Rev. 2021, 54, 27–61. [Google Scholar] [CrossRef]


Disclaimer/Publisher’s Note: The statements, opinions and data contained in all publications are solely those of the individual author(s) and contributor(s) and not of MDPI and/or the editor(s). MDPI and/or the editor(s) disclaim responsibility for any injury to people or property resulting from any ideas, methods, instructions or products referred to in the content. |
© 2023 by the authors. Licensee MDPI, Basel, Switzerland. This article is an open access article distributed under the terms and conditions of the Creative Commons Attribution (CC BY) license (https://creativecommons.org/licenses/by/4.0/).