

A Comprehensive Evaluation of Deep Learning Models on Knee MRIs for the Diagnosis and Classification of Meniscal Tears: A Systematic Review and Meta-Analysis


Abstract
1. Introduction
2. Materials and Methods
2.1. Eligibility Criteria
- All selected studies employed a deep learning model to detect menisci;
- The studies exclusively focused on diagnosing knee pathology using MRI images;
- The selected papers were primarily intended to identify meniscal tears alone or in conjunction with other knee abnormalities (ACL);
- We compared the deep learning models’ performance to human interpretation.
- Review articles or meta-analyses;
- Studies utilizing AI models other than deep learning;
- Articles are not written in the English language;
- Articles addressing the diagnosis of injuries in knees or joints other than meniscal tears.
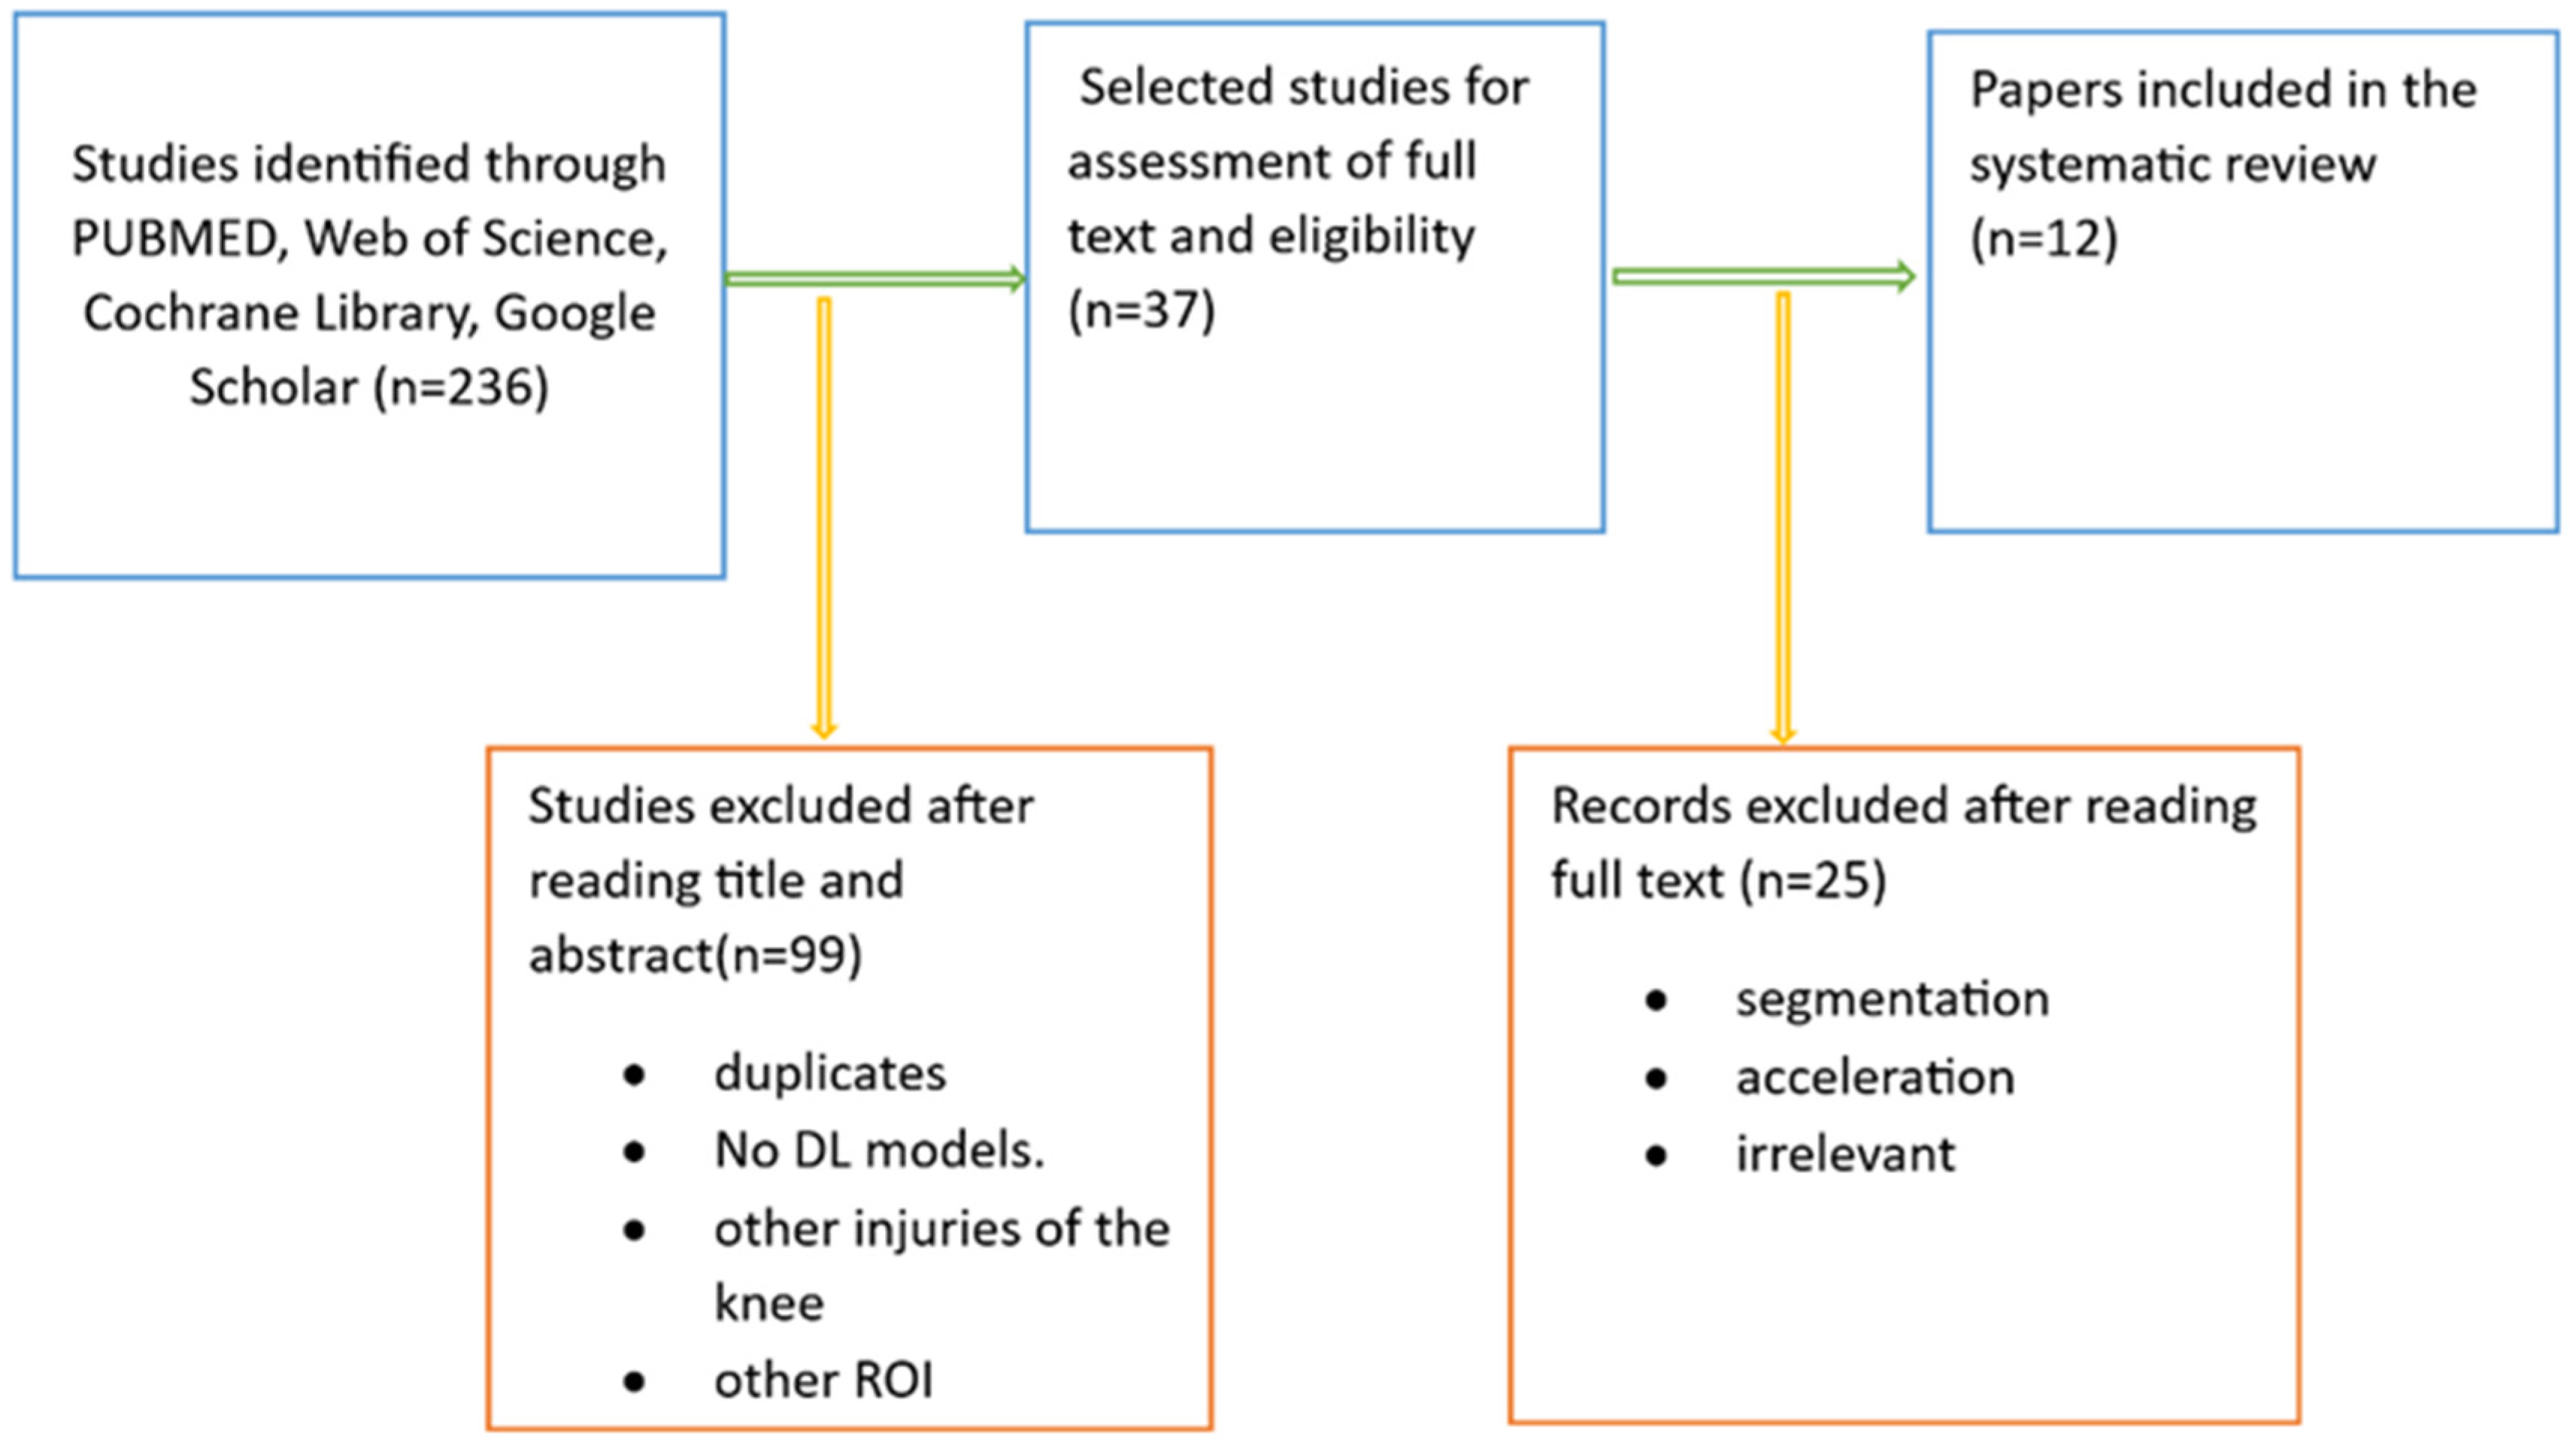
2.2. Information Sources
- Papers where the deep learning (DL) model primarily focused on detecting meniscal tears, characterization, or even classification of the lesions;
- Articles recommended using a deep learning-based assisting tool in combination with a deep learning-based assisting tool for detecting common knee injuries, such as meniscal tears, ACL injuries, and osteoarthritis.
2.3. Search: Keywords
2.4. Study Selection and Data Collection
- The area of application covered by the article includes meniscal localization, meniscal tear detection, characterizing meniscal tears, and external validation of meniscal tear detection;
- Details include the number of patients, publication year, database source, type of deep learning model used, data acquisition, standard reference, preprocessing methods, model training, and external validation.
2.5. Statistical Analysis
2.5.1. Meta-Analysis
2.5.2. Quality Assessment
2.5.3. Risk of Bias
3. Results
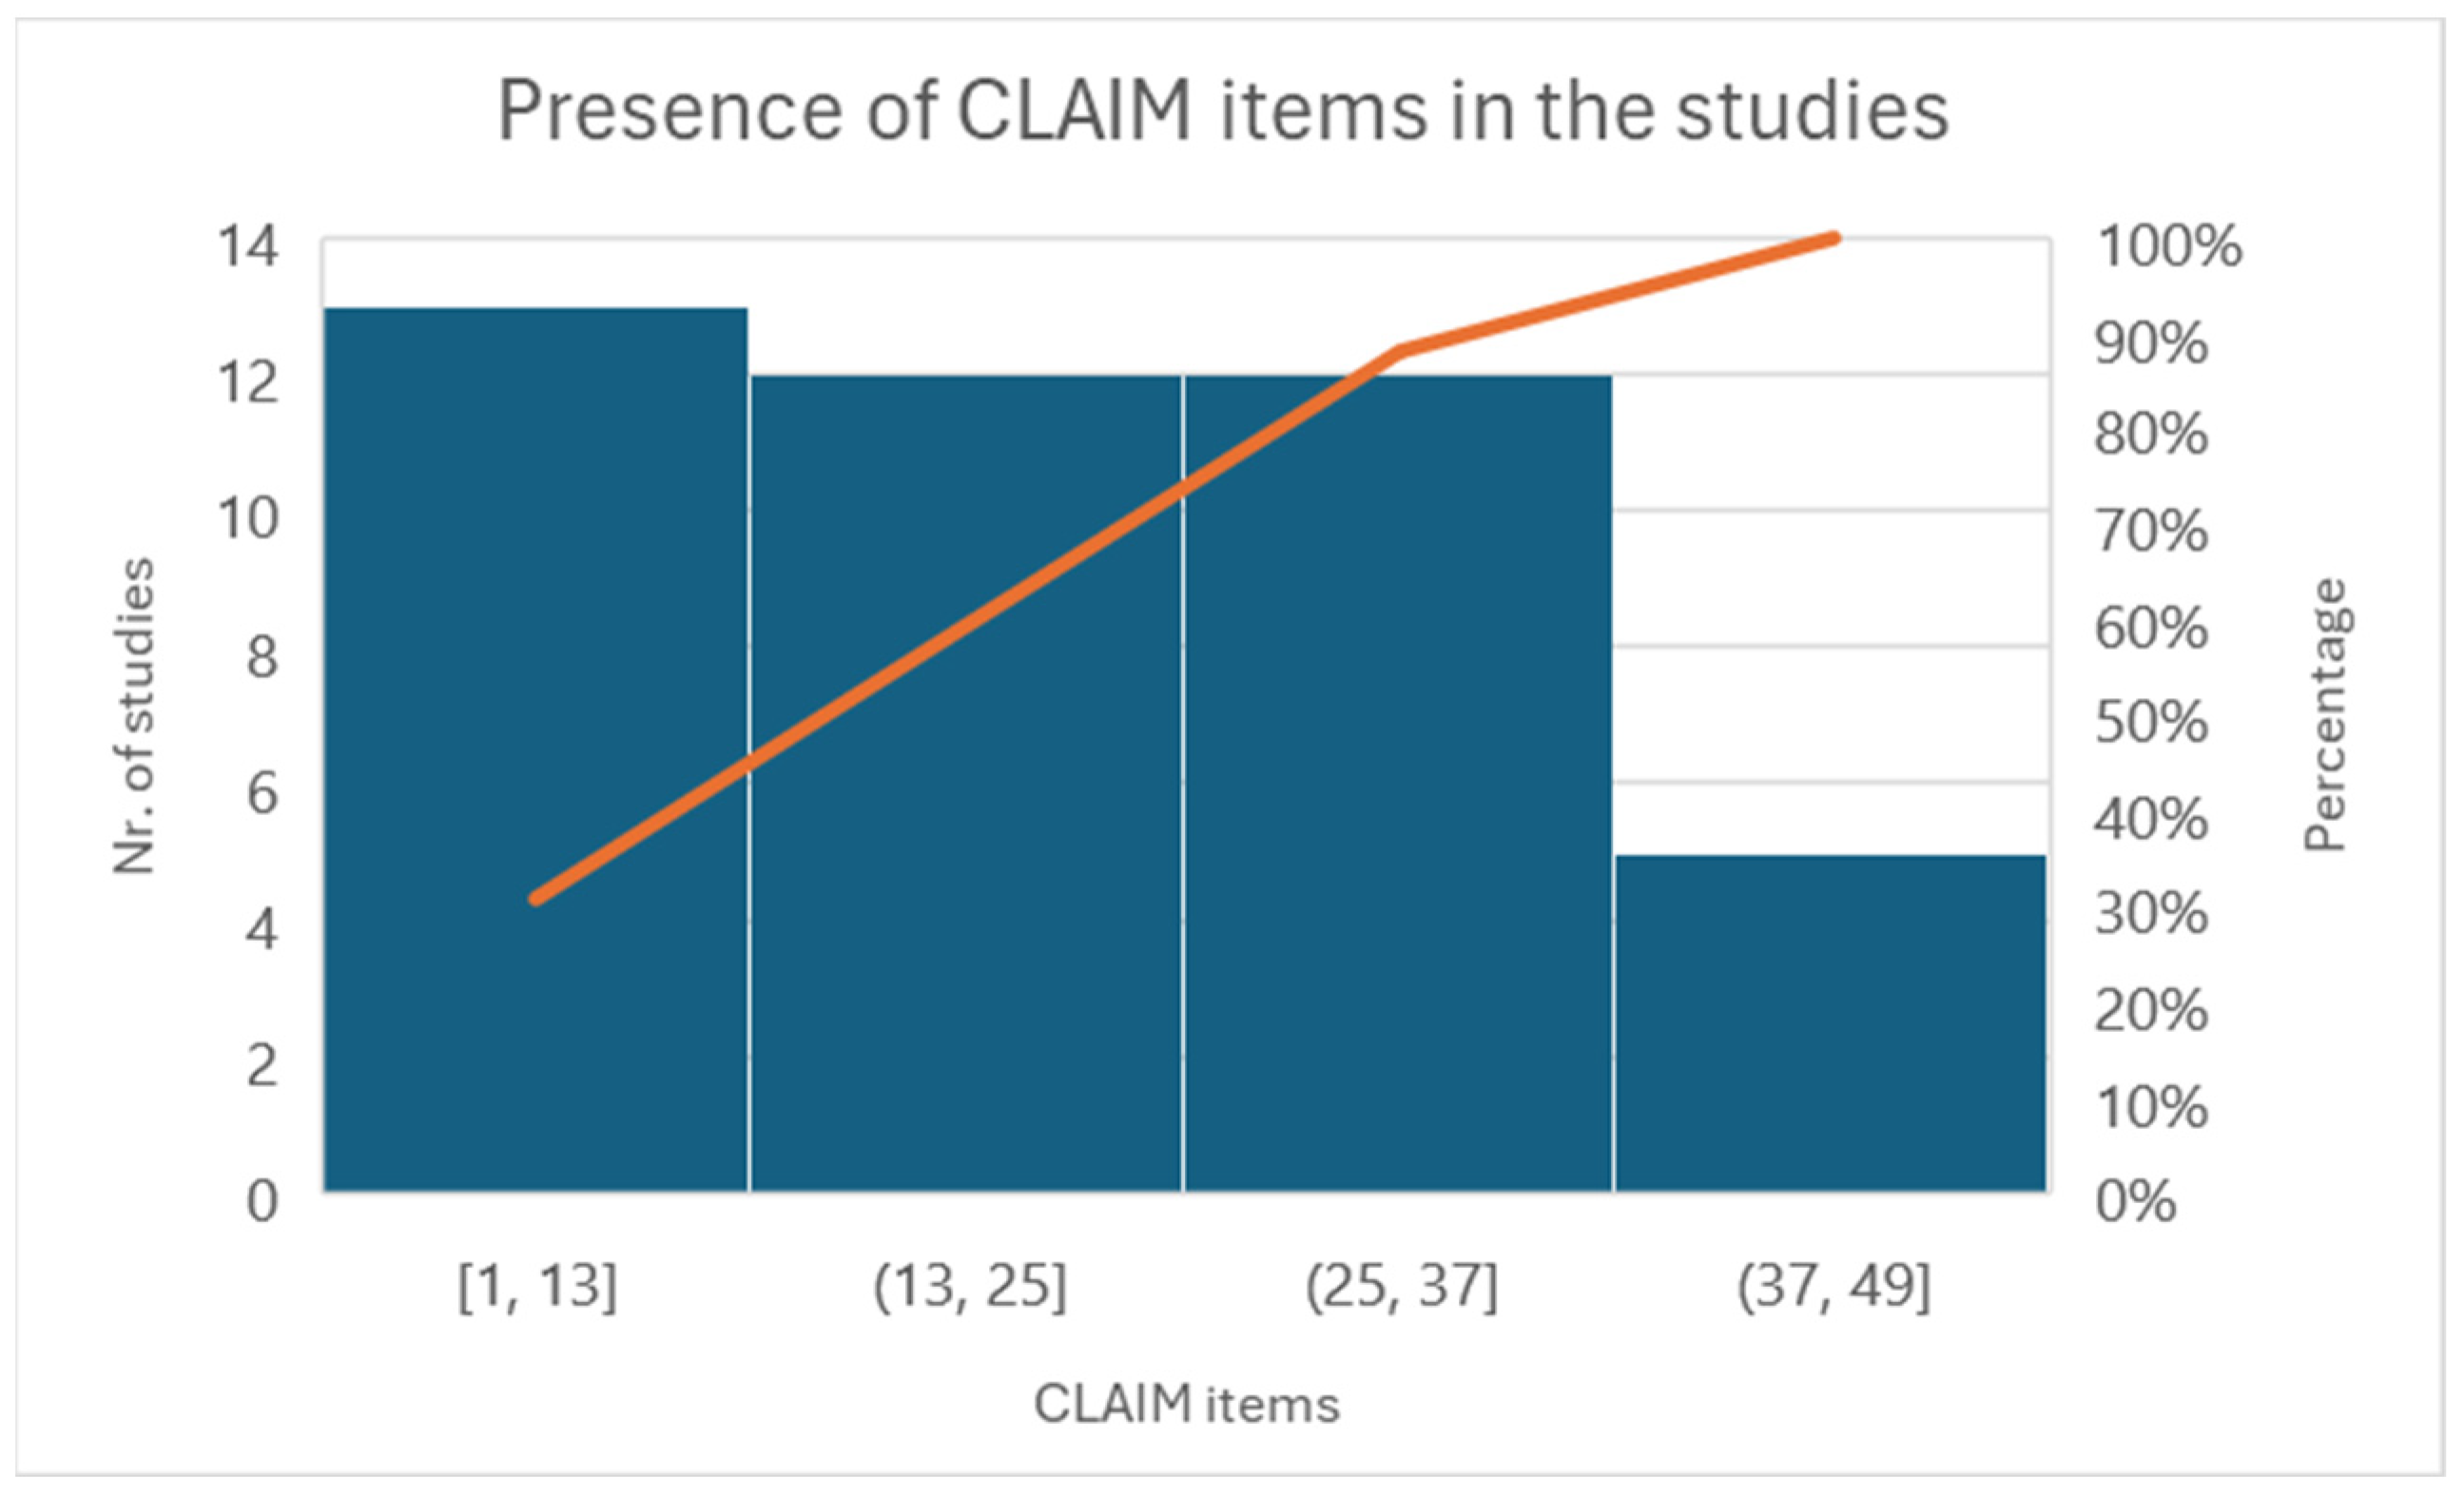
3.1. Quality Assessment
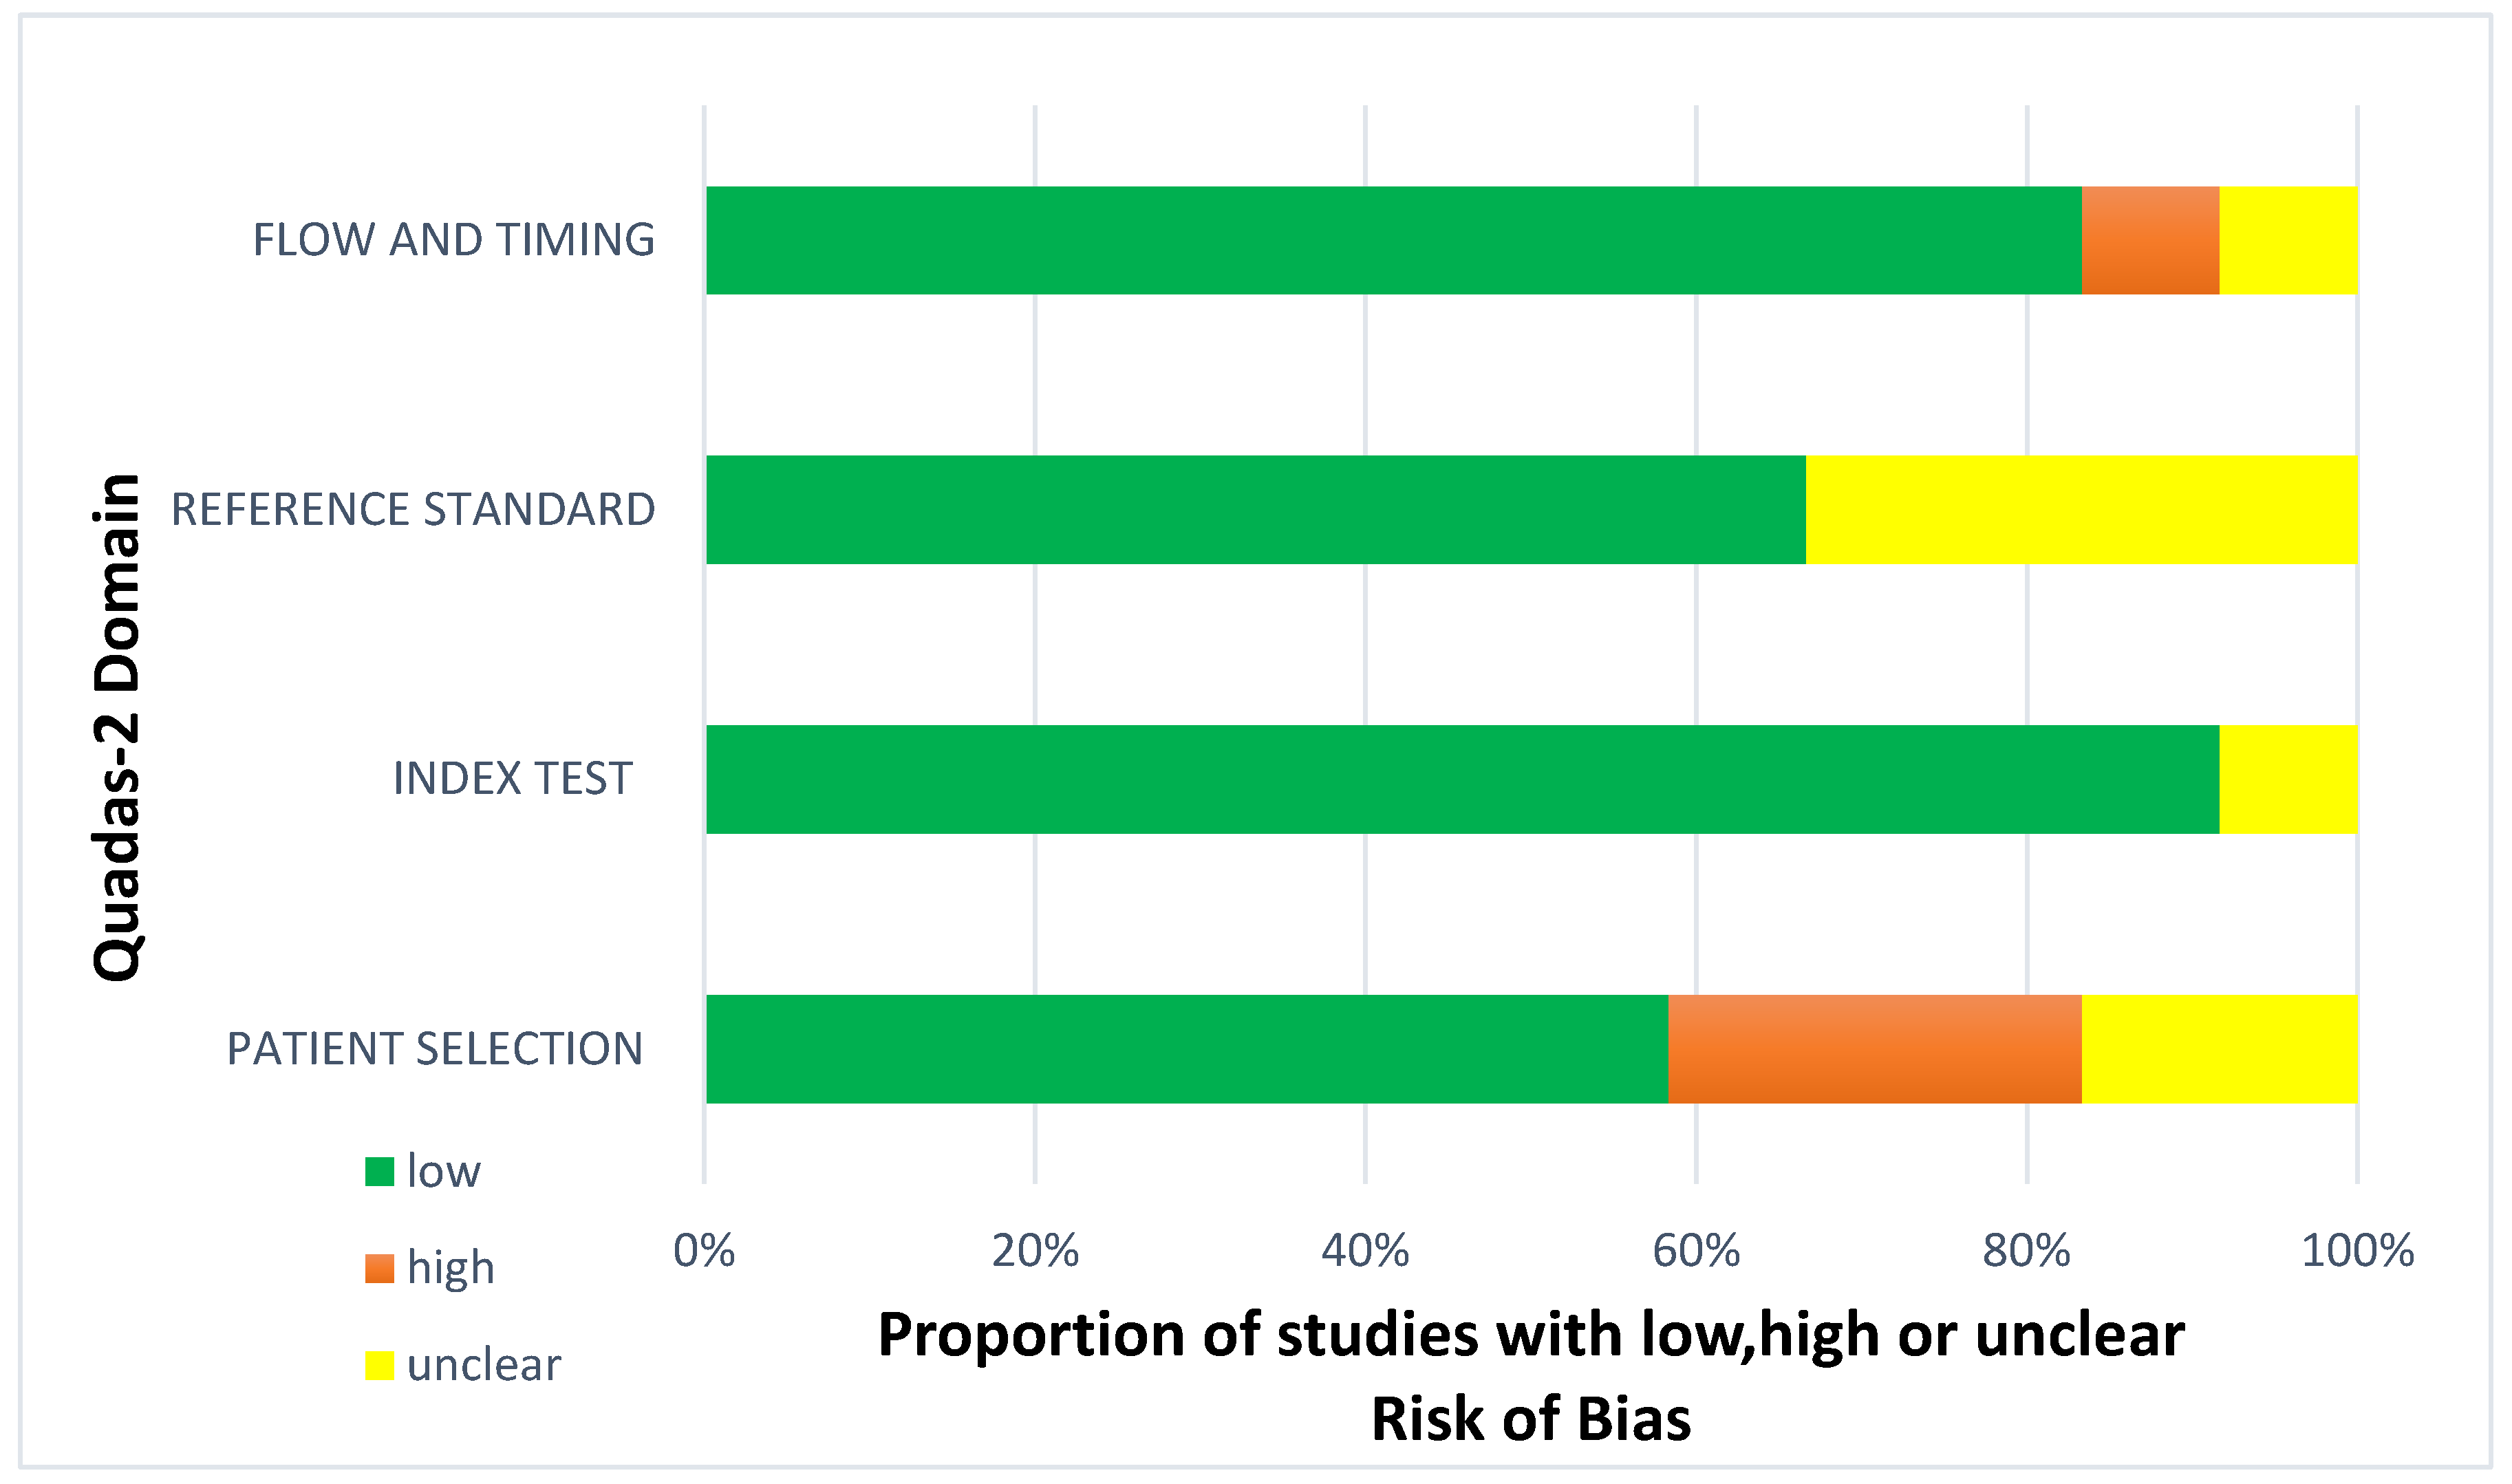
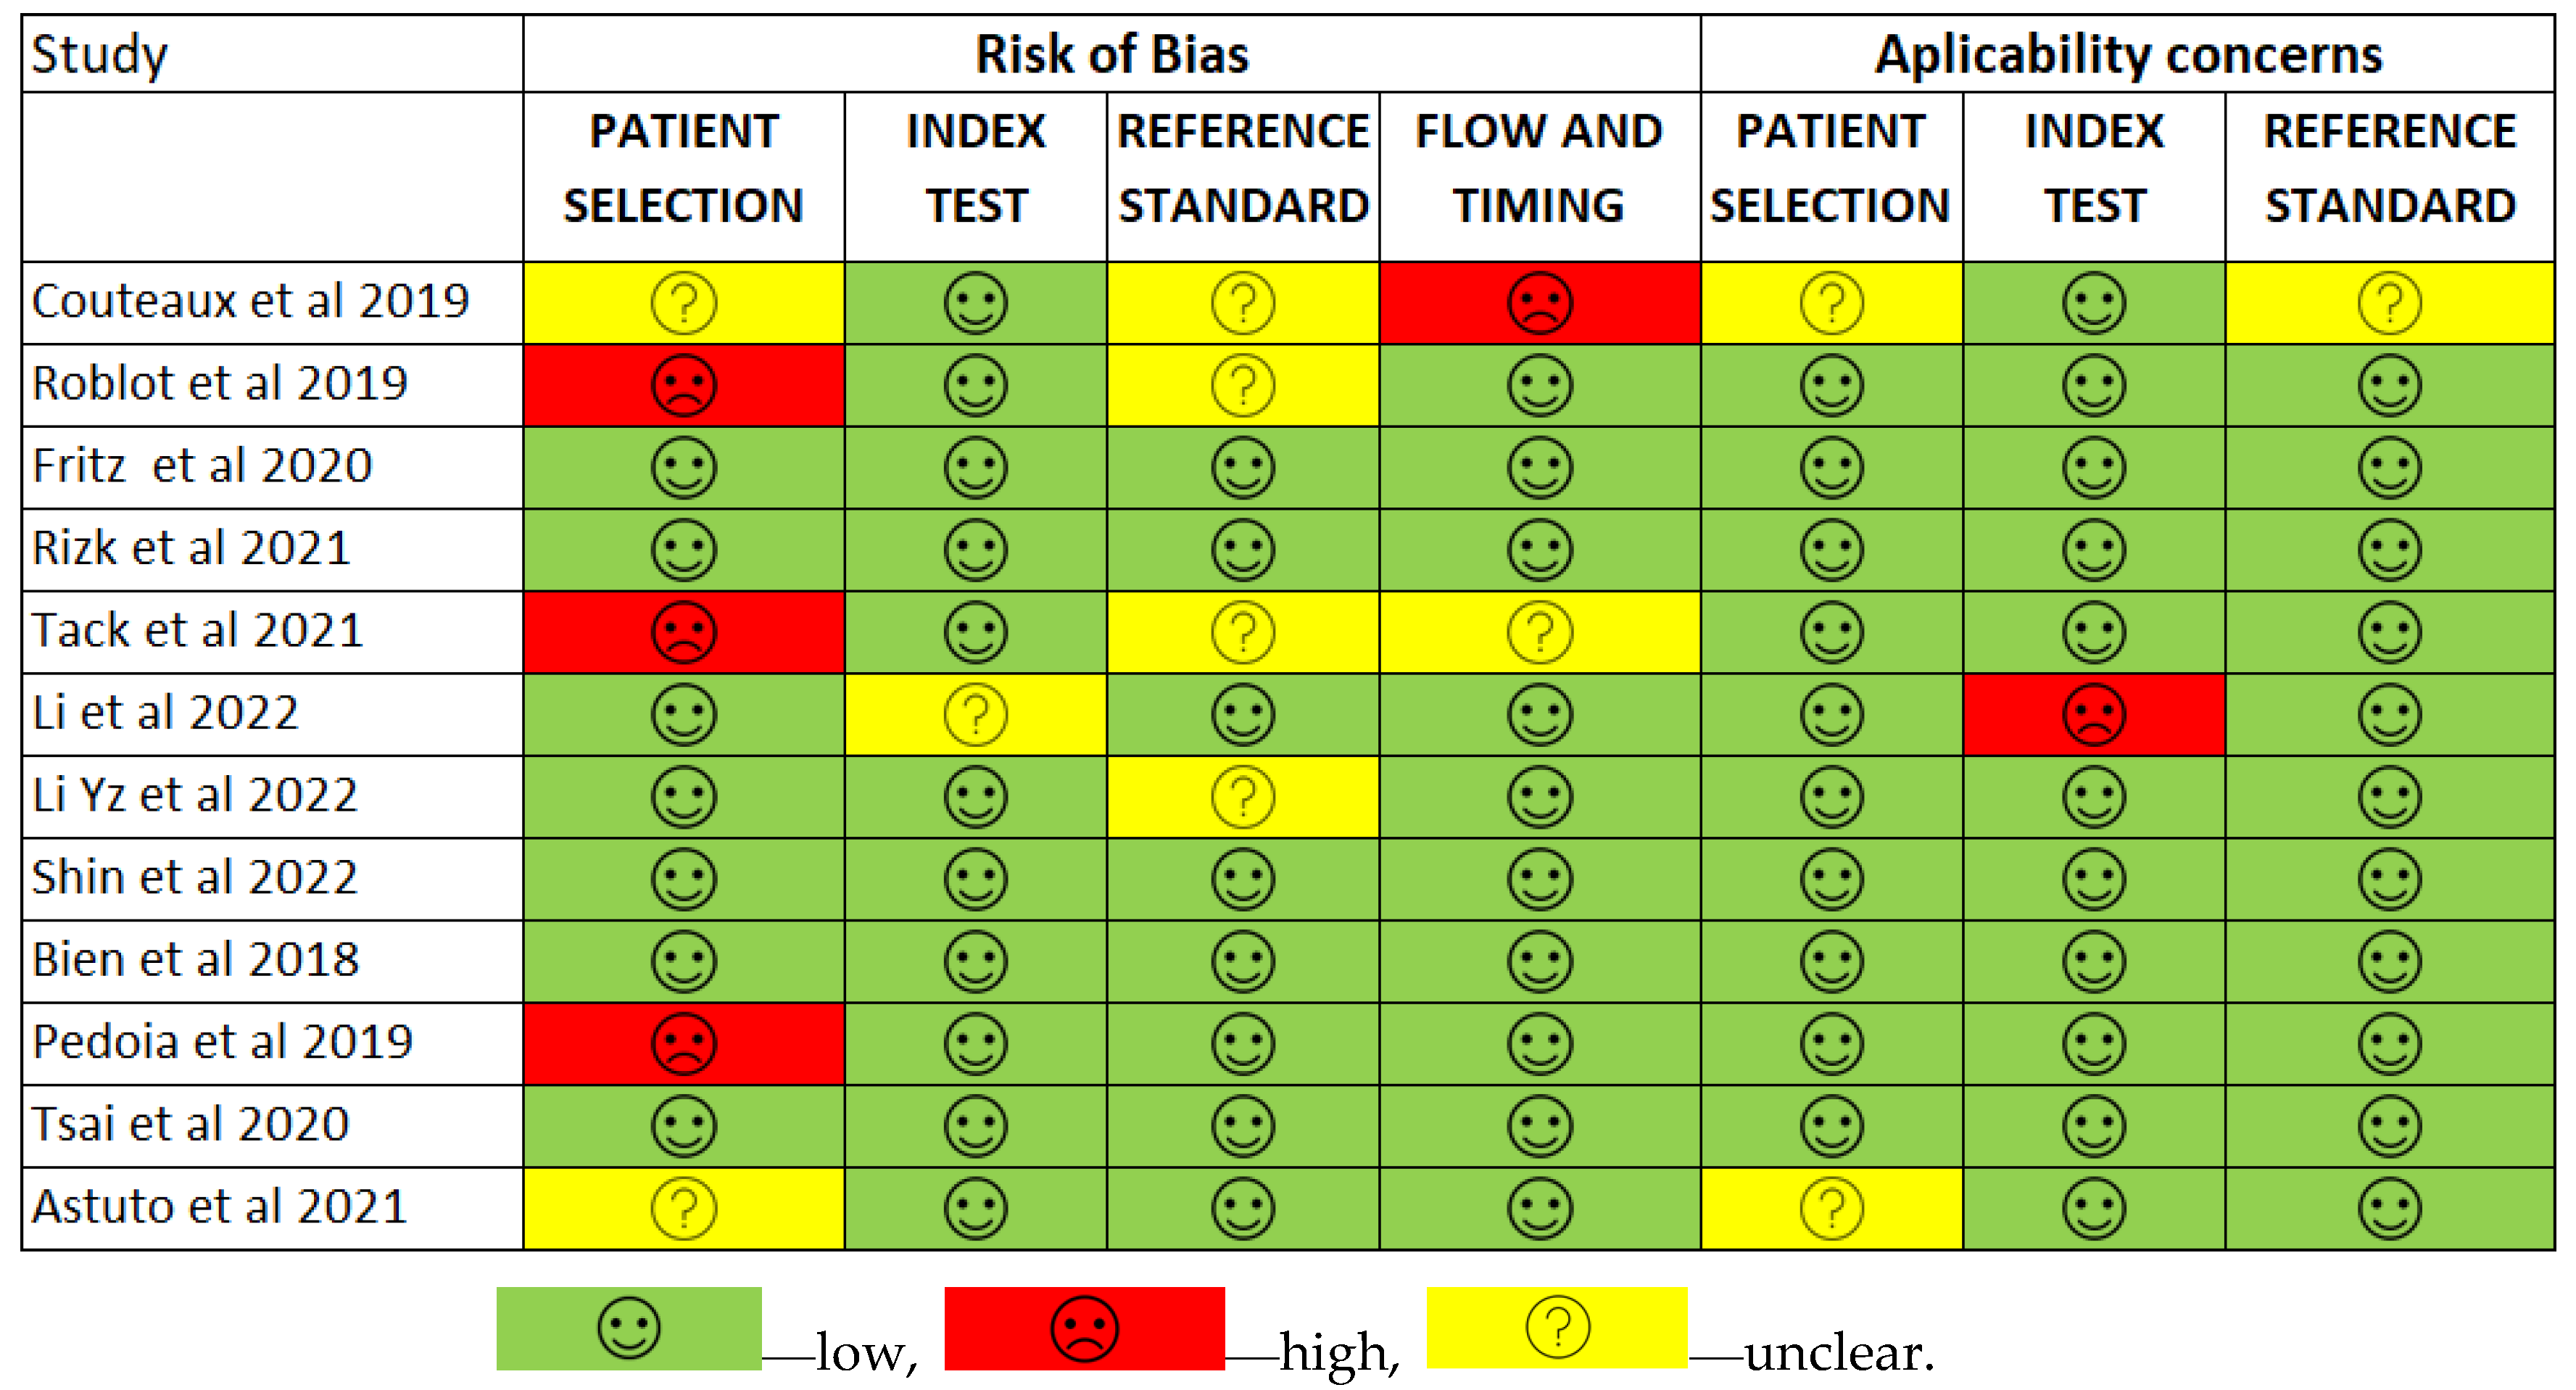
3.2. Risk of Bias
3.3. Meta-Analysis
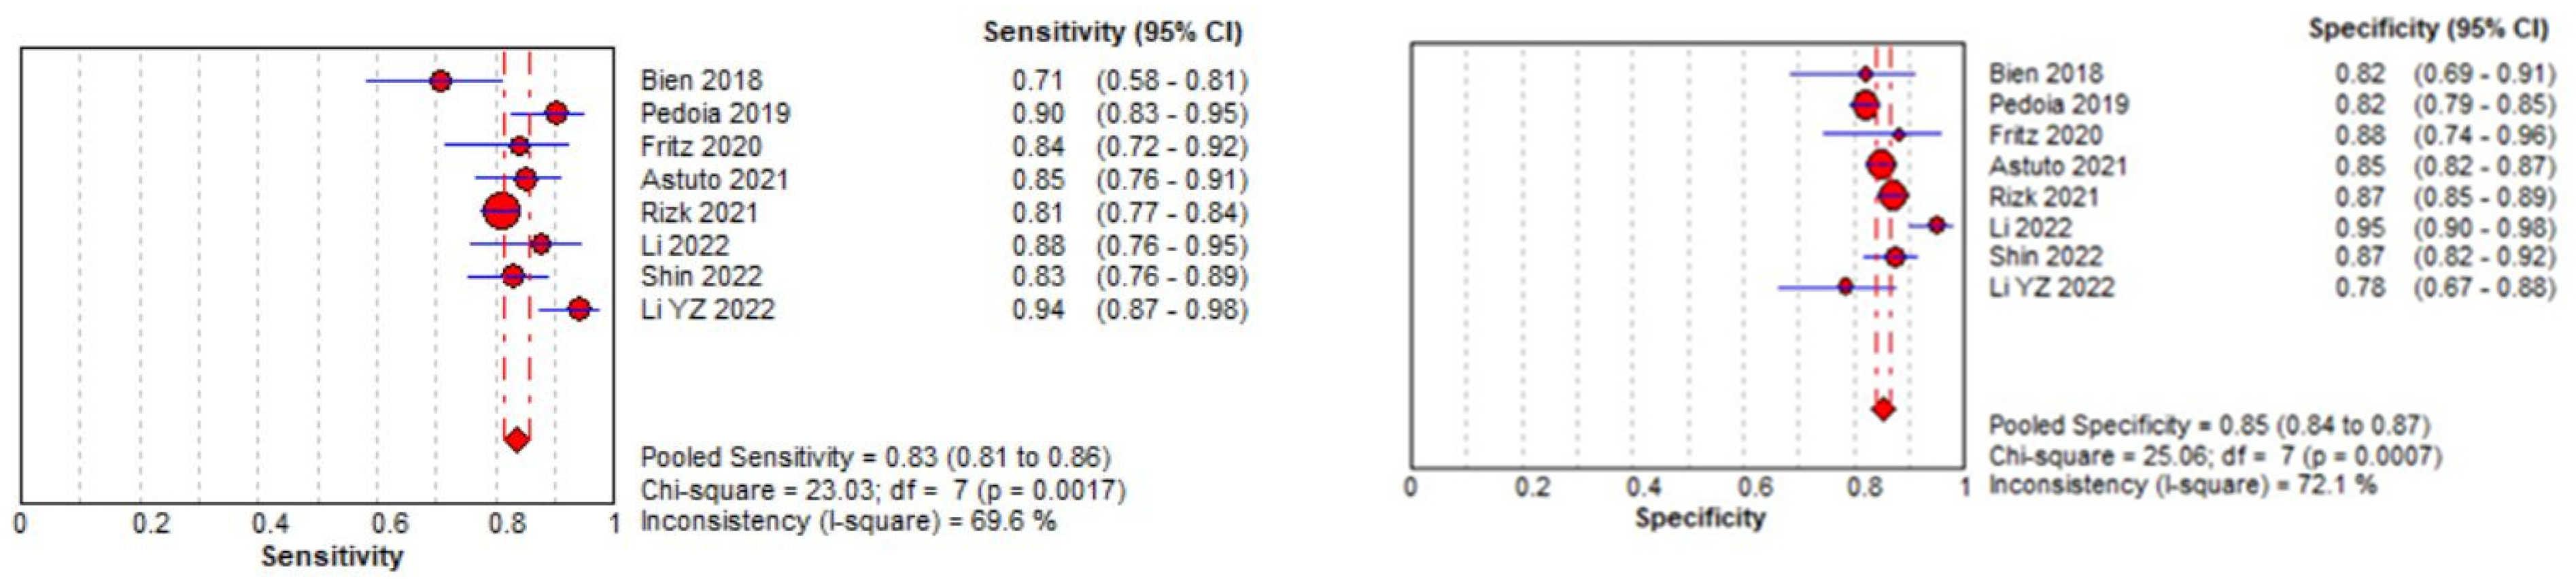
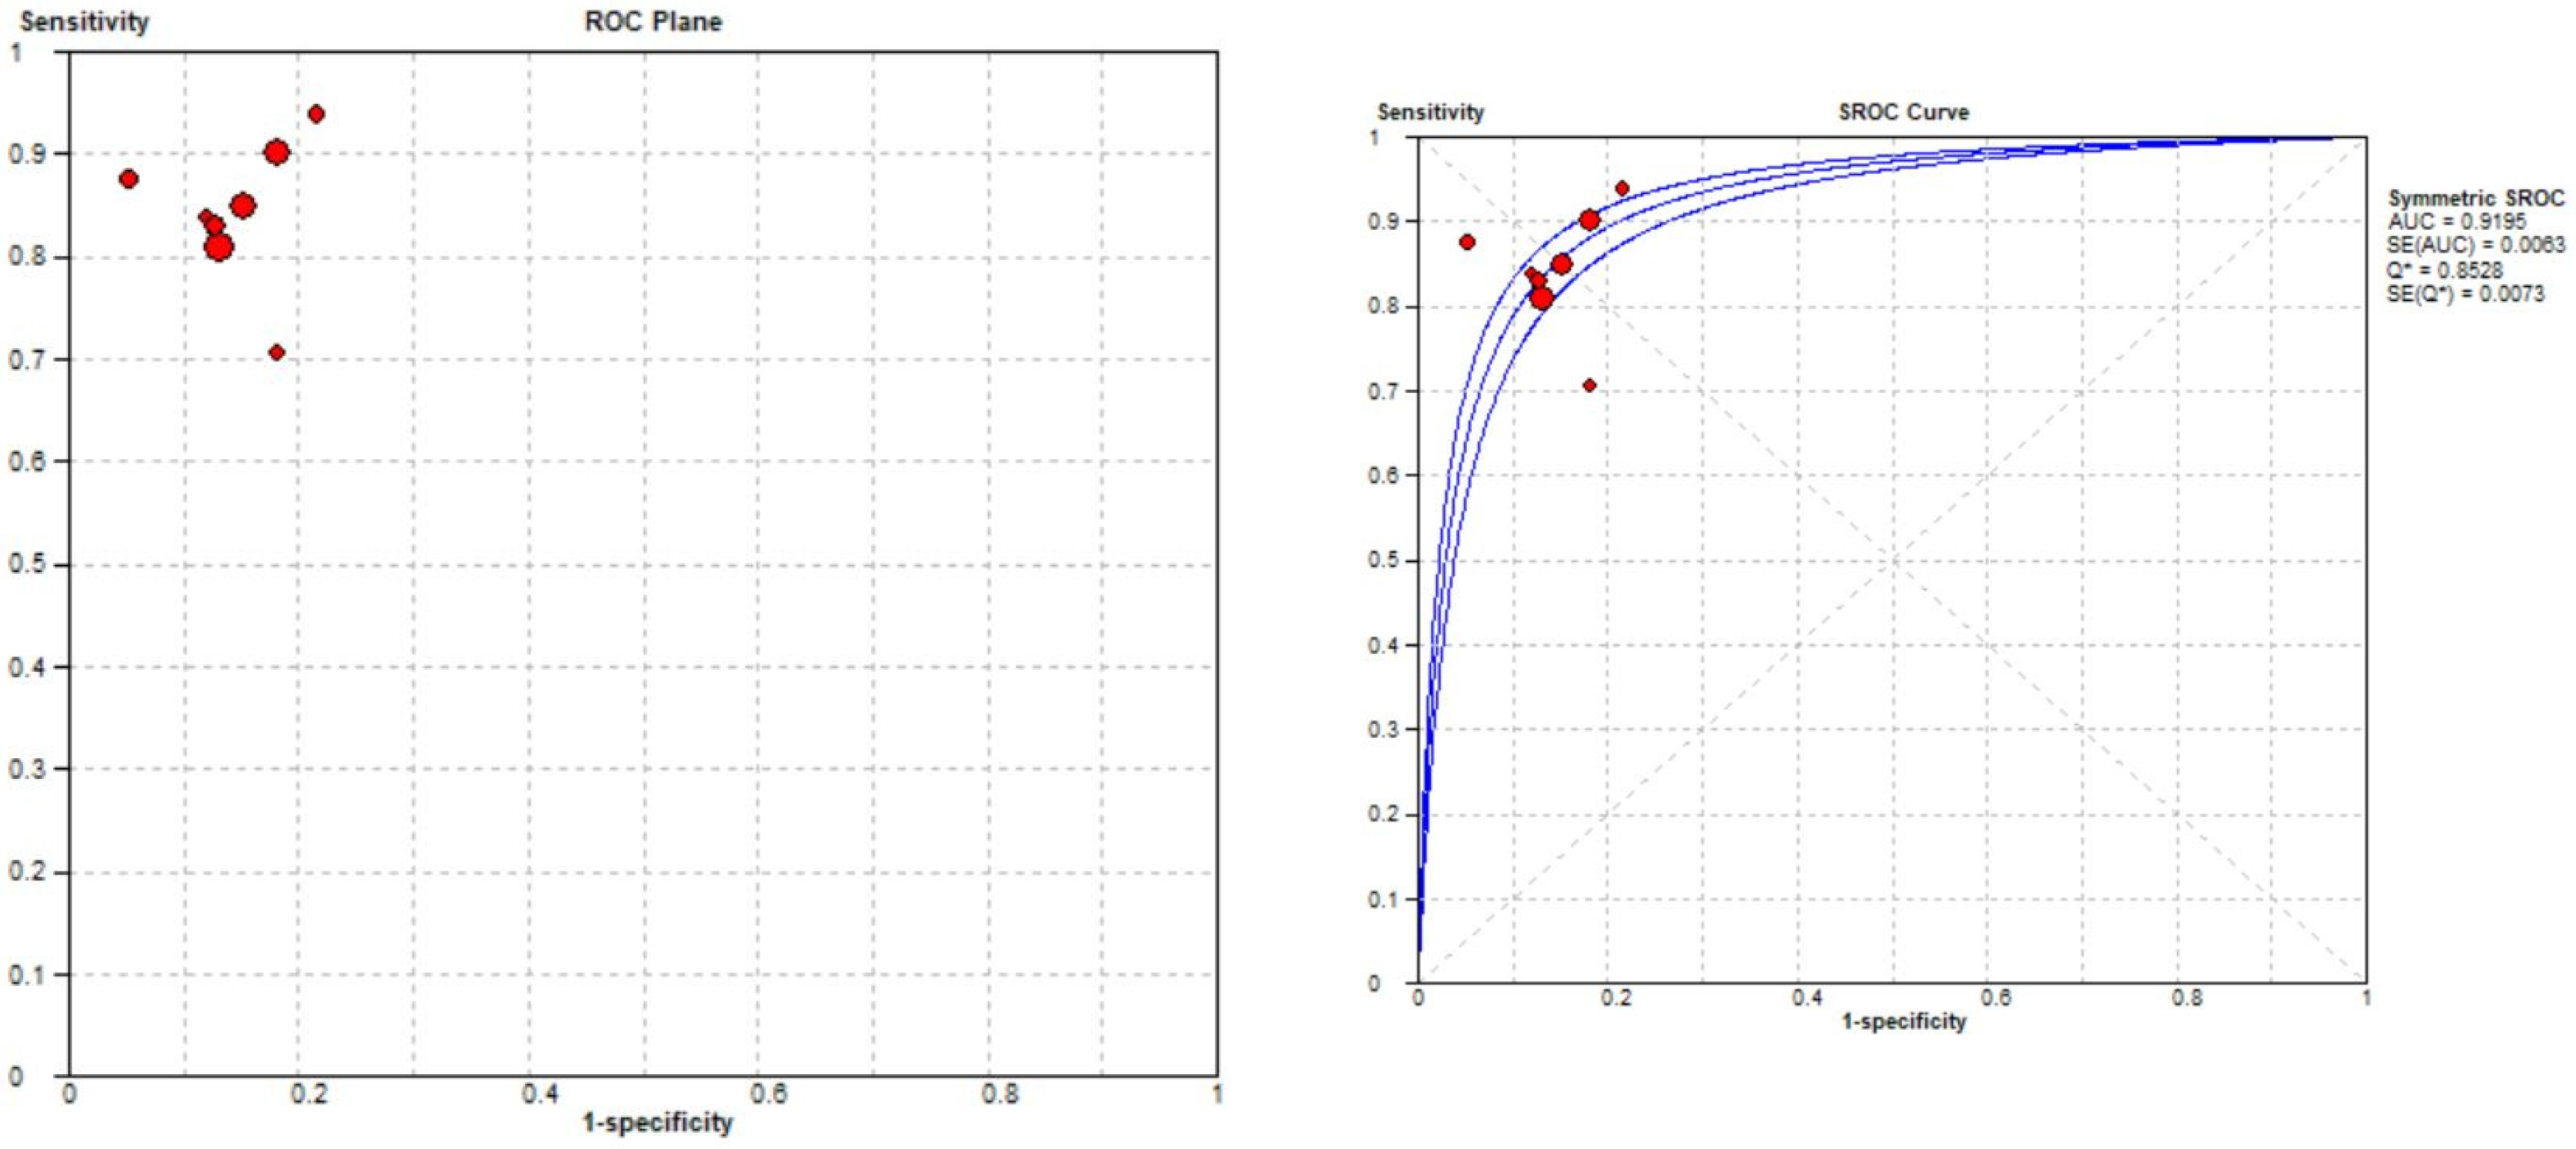
3.3.1. Meniscal Tear Identification Analysis
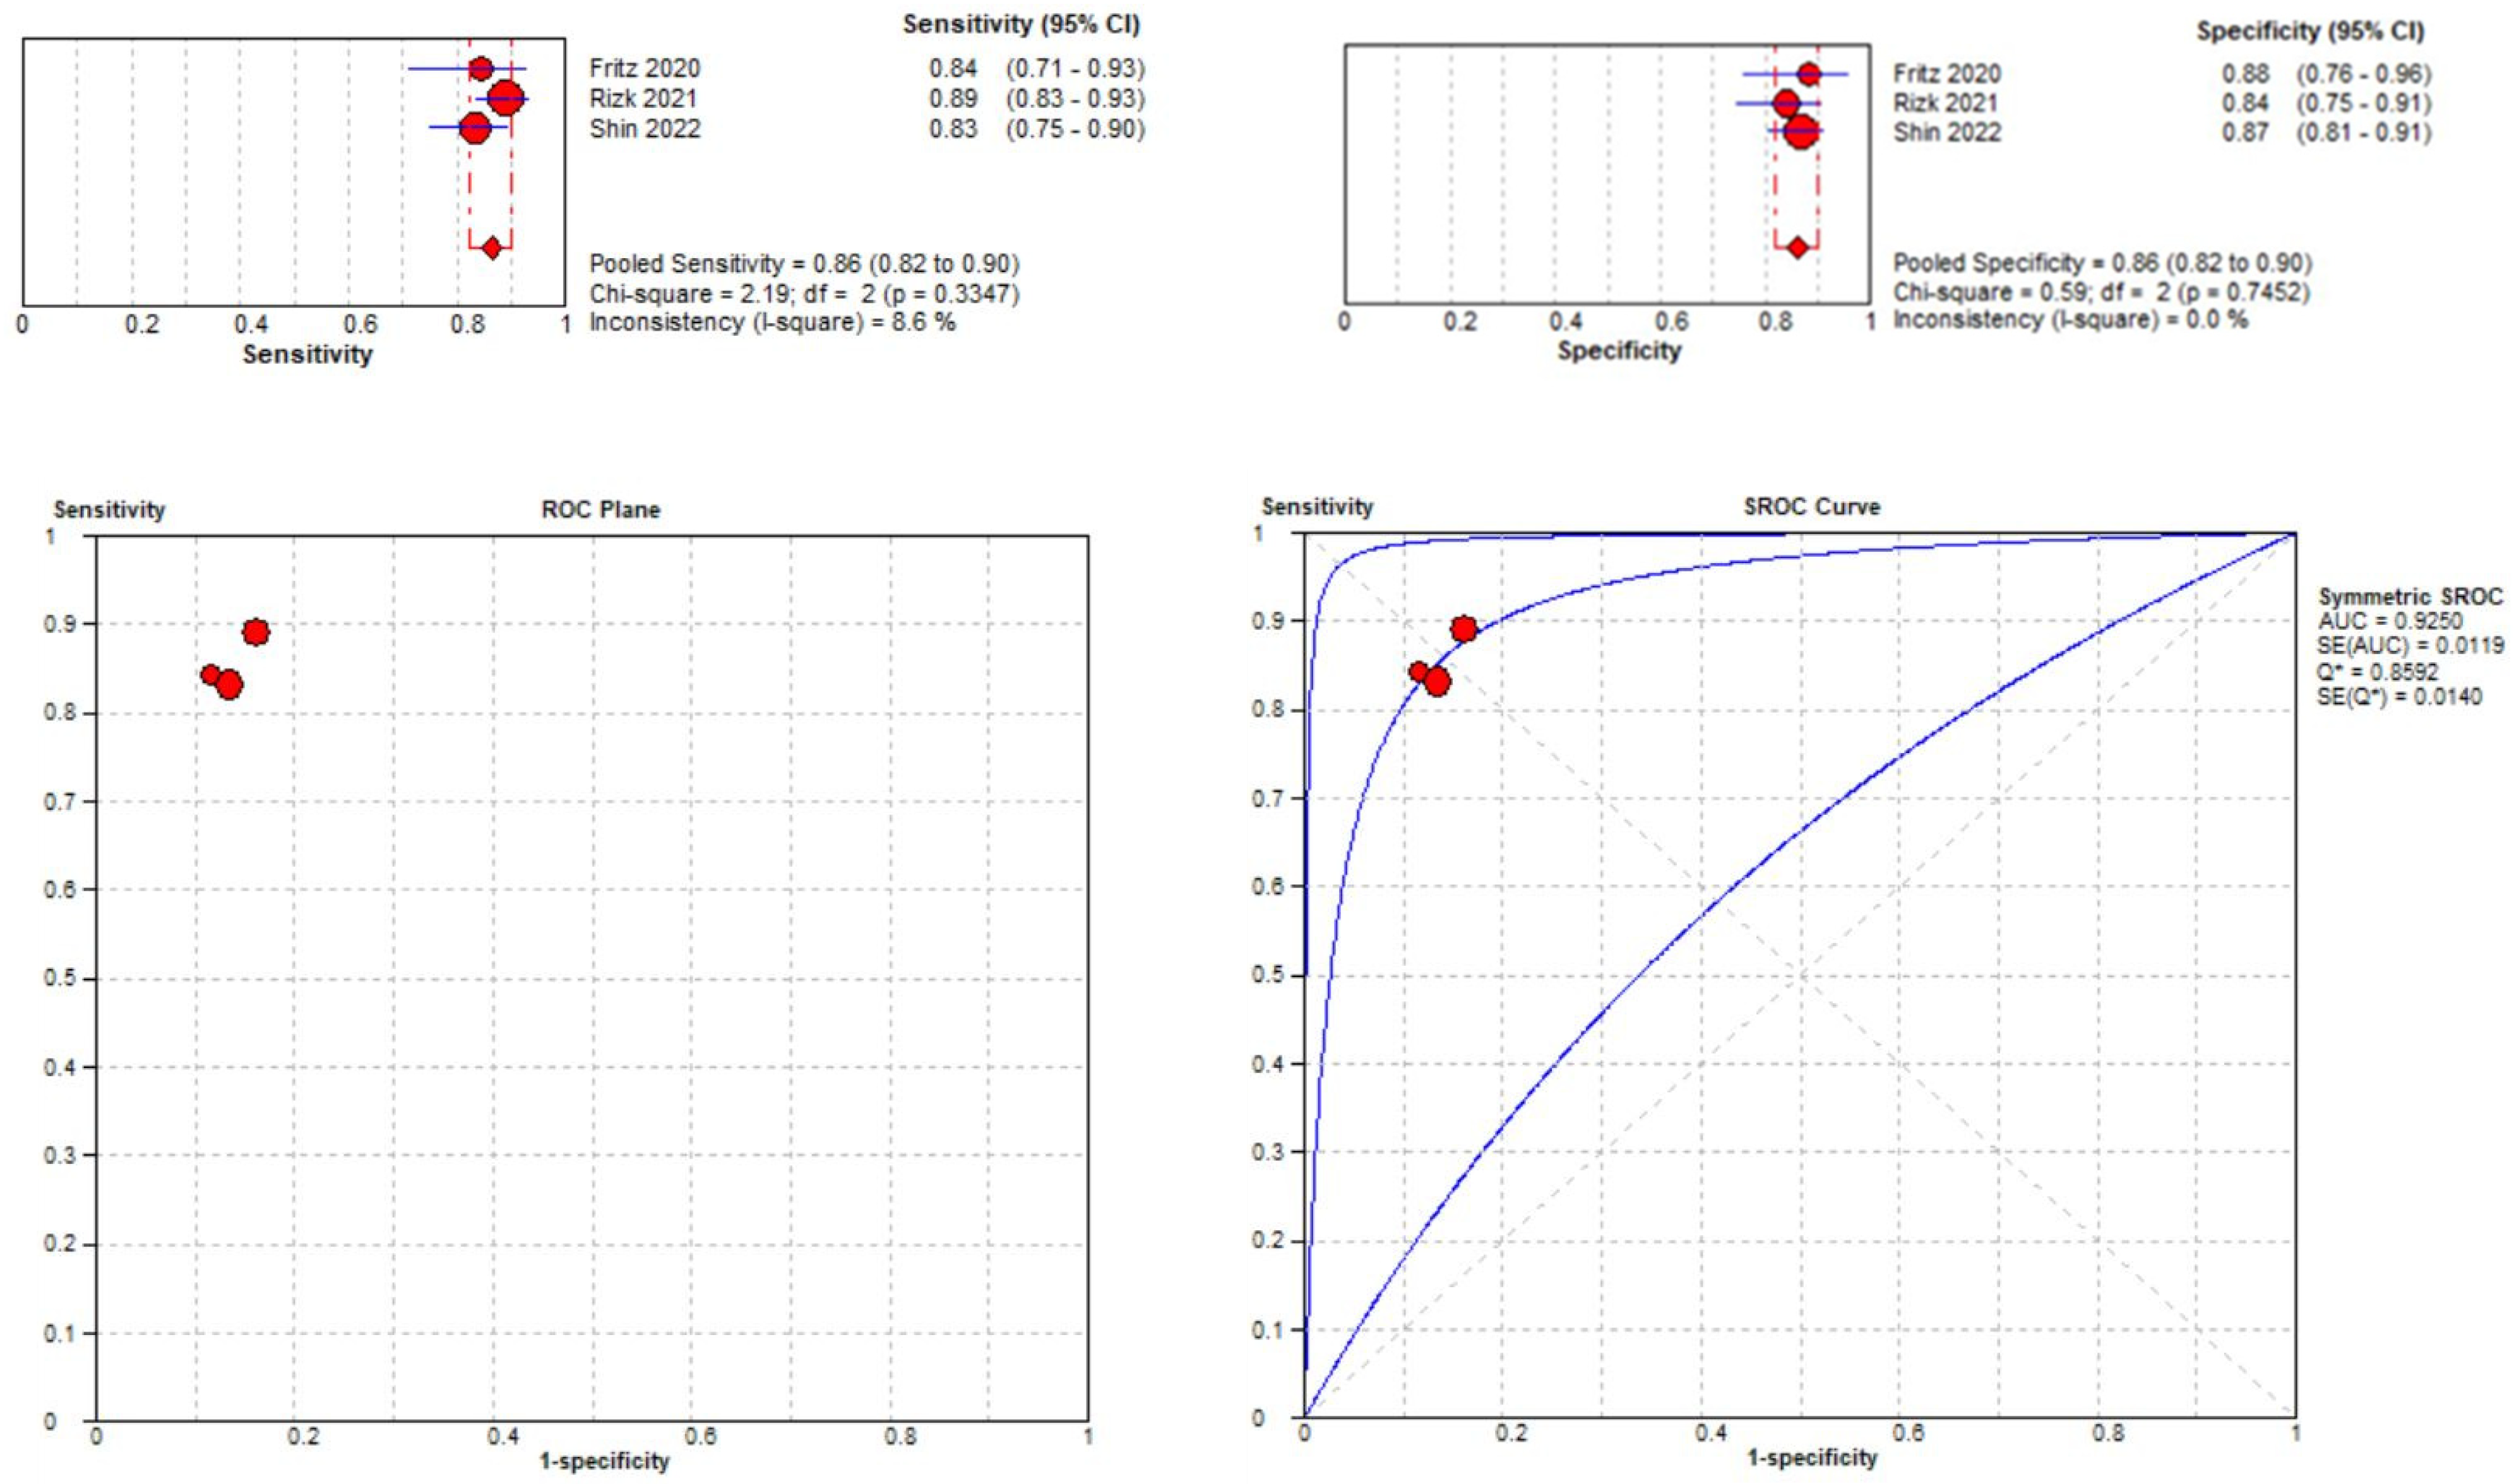
3.3.2. Medial Meniscal Tear Localization Analyses
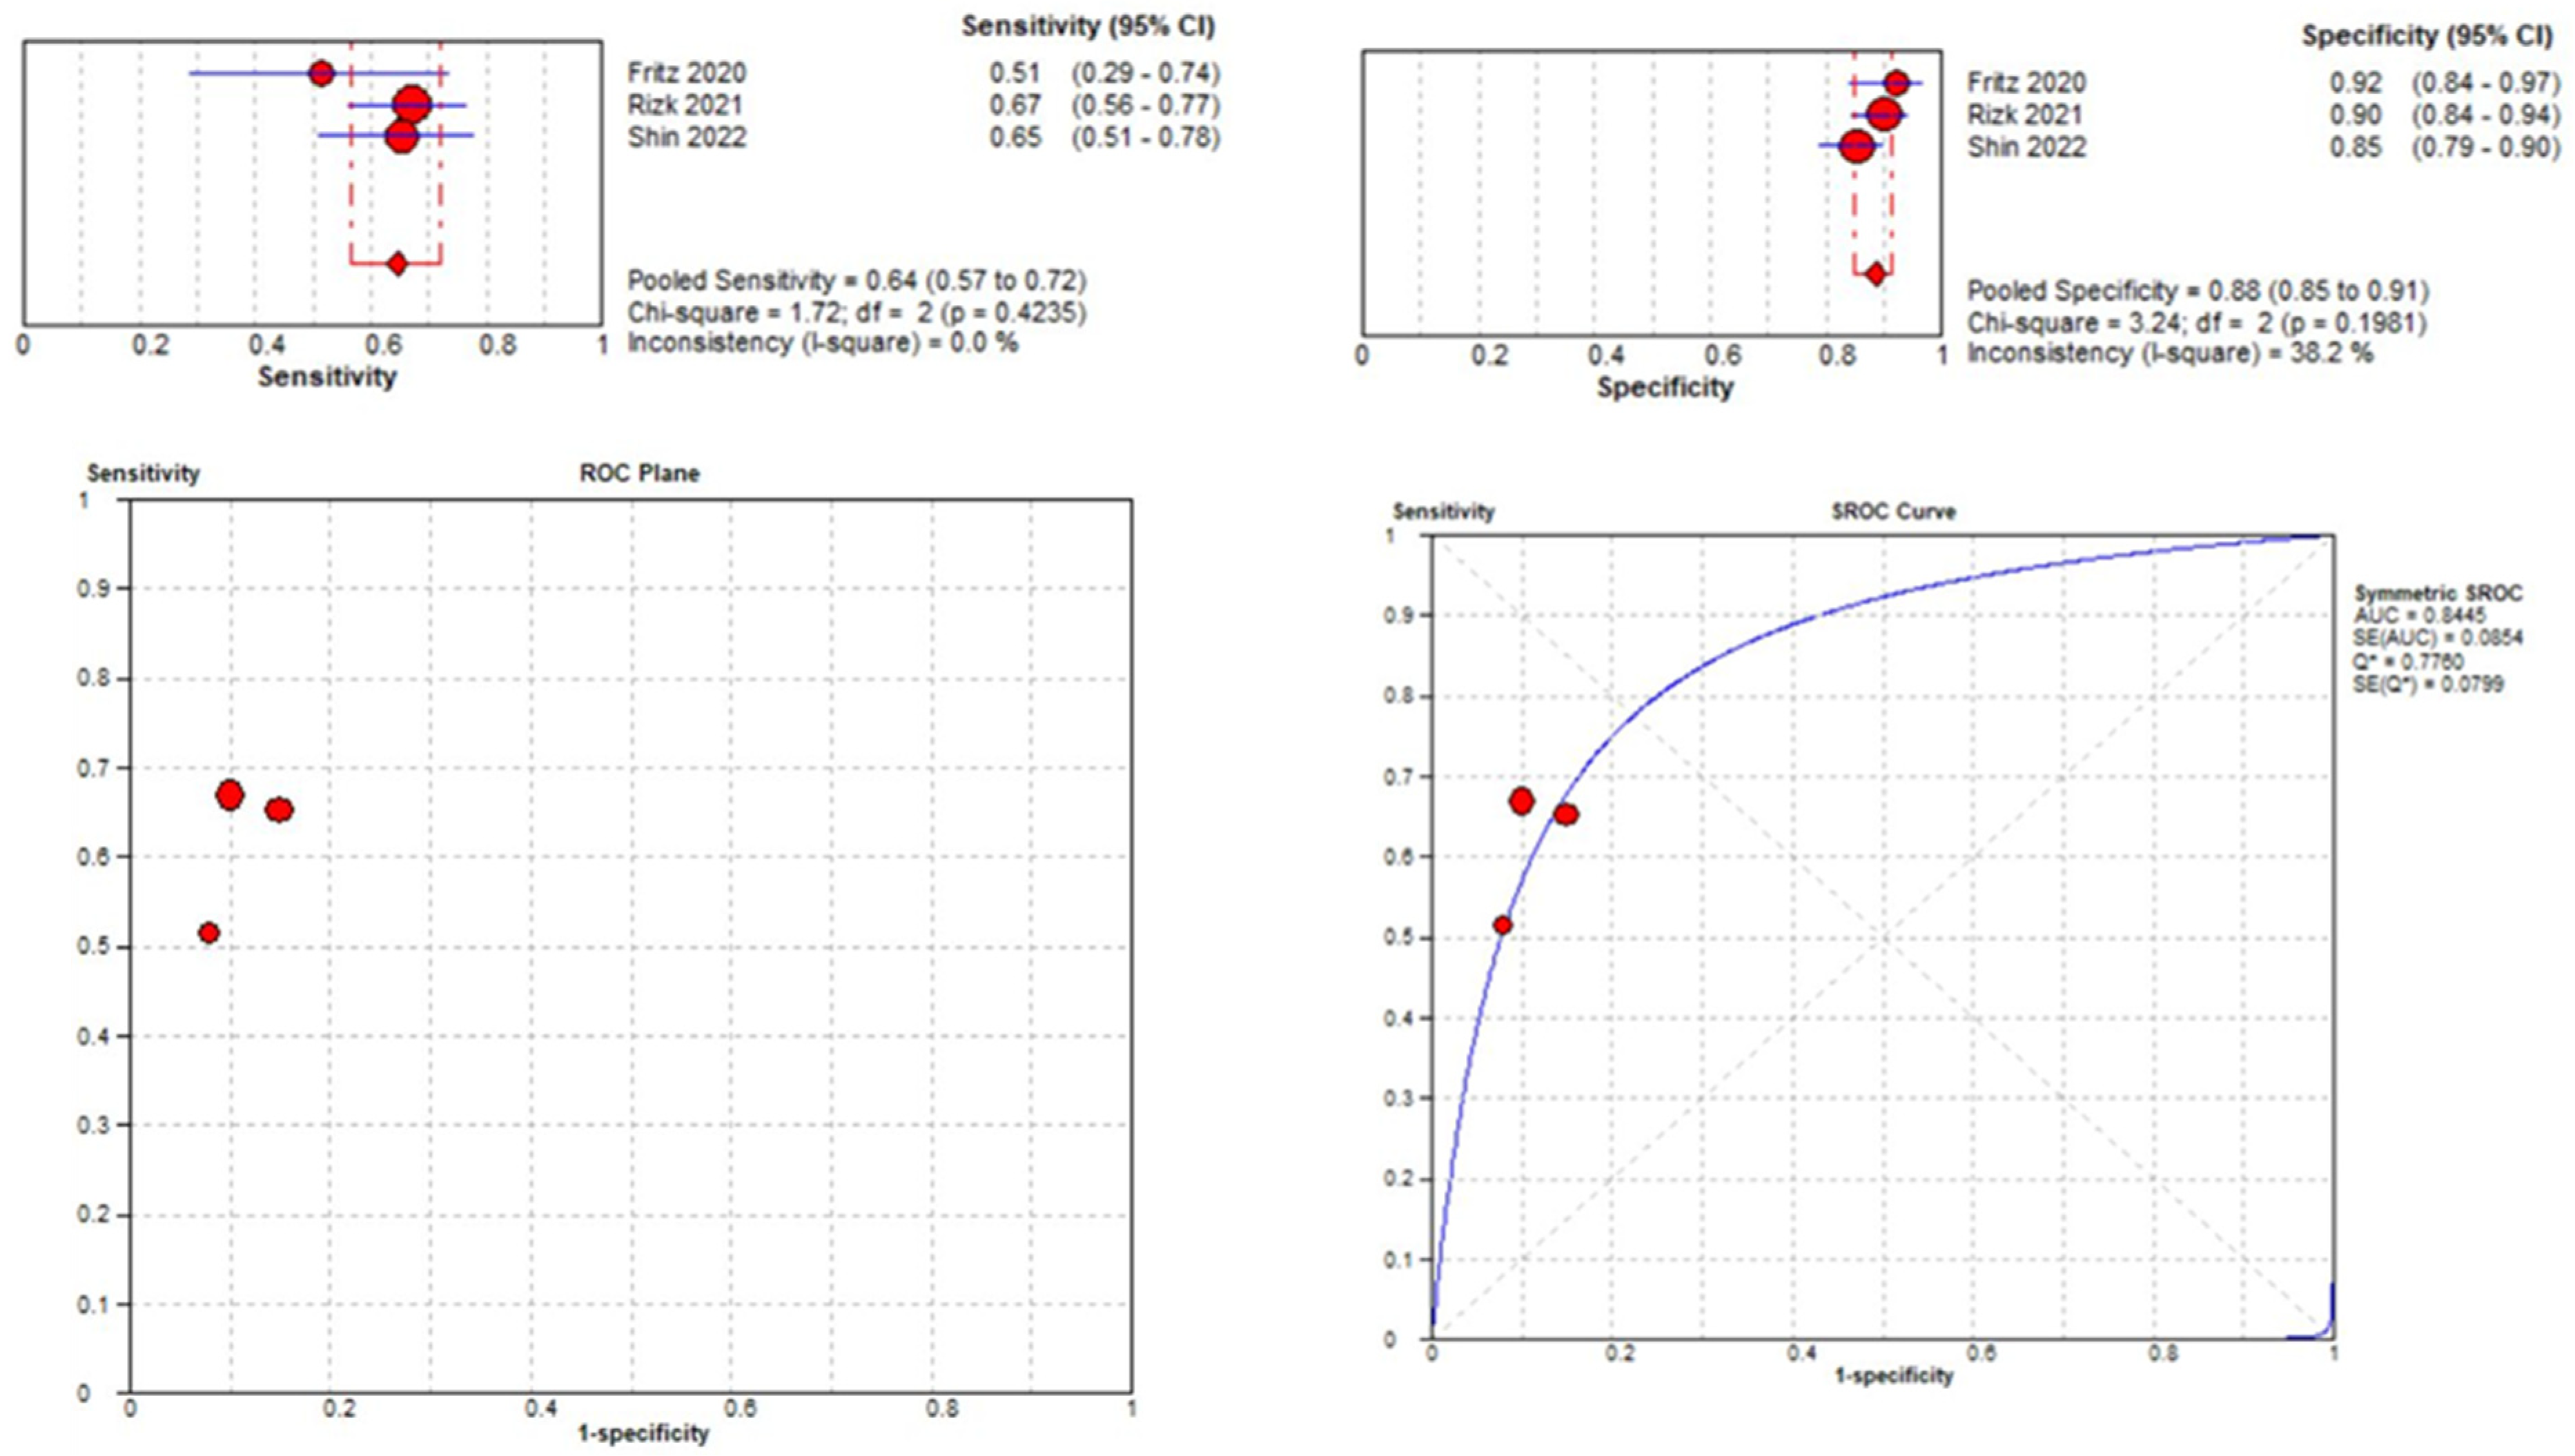
3.3.3. Lateral Meniscal Tear Localization
3.4. Knee MRI Sequence Acquisition
3.5. MRI Dataset
3.6. Classification
- Full-Scale Approach: The AUC values for the medial meniscus (MM) ranged from 0.74 to 0.85 and for the lateral meniscus (LM) from 0.91 to 0.94.
- BB-Crop Approach: Achieved higher AUC values (MM: 0.87 to 0.89; LM: 0.91 to 0.95).
- BB-Loss Approach: Yielded the highest AUC values (MM: 0.93 to 0.94; LM: 0.91 to 0.96) [44].
3.7. Comparison between the DL Model and Human Interpretation
3.7.1. DL Model against MSK Radiological Evaluation
3.7.2. DL Model against Arthroscopic Surgery Diagnosis
4. Discussion
4.1. Description of the Dataset
4.2. Description of the Image Preprocessing
- Resizing and resampling: The images varied in resolutions and dimensions. Resizing and resampling the images to a consistent size or spacing was essential for ensuring compatibility with deep learning models requiring fixed input dimensions. Dimensionality reduction was achieved by manual cropping [45] and bounding boxes [44] or by deep models such as UNet [13].
- Intensity normalization and histogram equalization: The MRIs exhibited varying intensity ranges and contrasts due to differences in acquisition protocols and devices. Intensity normalization scaled the pixel values to a standard range, such as [0, 1] or [0, 255], enhancing the contrast and enabling more meaningful image comparisons. A histogram-based intensity standardization algorithm was applied to the images to account for variable pixel intensity scales within the MRI series [12,49]. A representative intensity distribution was learned from the training set exams for each series. Then, the parameters of this distribution were used to adjust the pixel intensities of exams in all datasets (training, tuning, and validation). Under this transformation, pixels with similar values correspond to similar tissue types. After intensity standardization, pixel values were clipped between 0 and 255, the standard range for PNG images [12,49].
- Image noise and signal abnormalities reduction: MRIs can be affected by various types of noise, such as Gaussian noise, salt-and-pepper noise, or speckle noise. Noise reduction techniques, such as Gaussian filtering, median filtering, or anisotropic diffusion, reduce noise while preserving important image features. The model’s performance is very much dependent on the image quality of the training dataset. One profound influence on the model’s performance is the image nosiness or the artifacts [42]. Signal abnormalities in images are still a challenge [44]. When menisci with tears are to be distinguished from menisci without tears, signal abnormalities are currently regarded as the latter. A fine-grained differentiation between tears and signal abnormalities is a challenge, primarily because of the ambiguous image appearance [44].
- Data augmentation: Data augmentation was used to increase the size and diversity of a training dataset by creating new instances by applying various transformations to the original data. Most studies have imbalanced sets for the categories to be used for training. Usually, there are fewer images of healthy meniscus than of torn ones. Also, as in the case of the predefined datasets [41,42], those contained only two T2-weighted MR images in the sagittal plane for each patient, whereas an MRI examination of the knee usually includes around 100 images. Moreover, images were preprocessed to have the same matrix and voxel size. Dataset imbalance may explain the inferior overall performances on lateral meniscal tear detection and characterization. A more significant amount of data, including lateral meniscal tears in the training dataset, may further increase model performances laterally [45]. Tsai et al. [49] performed randomized data augmentations on each series, which included translation, horizontal scaling, and minor rotations up to 10 degrees around the center of the volume. For volumes captured in the axial and coronal orientations, they applied an additional random rotation of a multiple of 90 degrees to the volume. Finally, all the images were resized to 256 × 256 before entering the network. Aside from data augmentation, they implemented oversampling to compensate for dataset imbalances [49].
4.3. Description of the ROI Localization
4.4. Description of the Ground Truth Determination
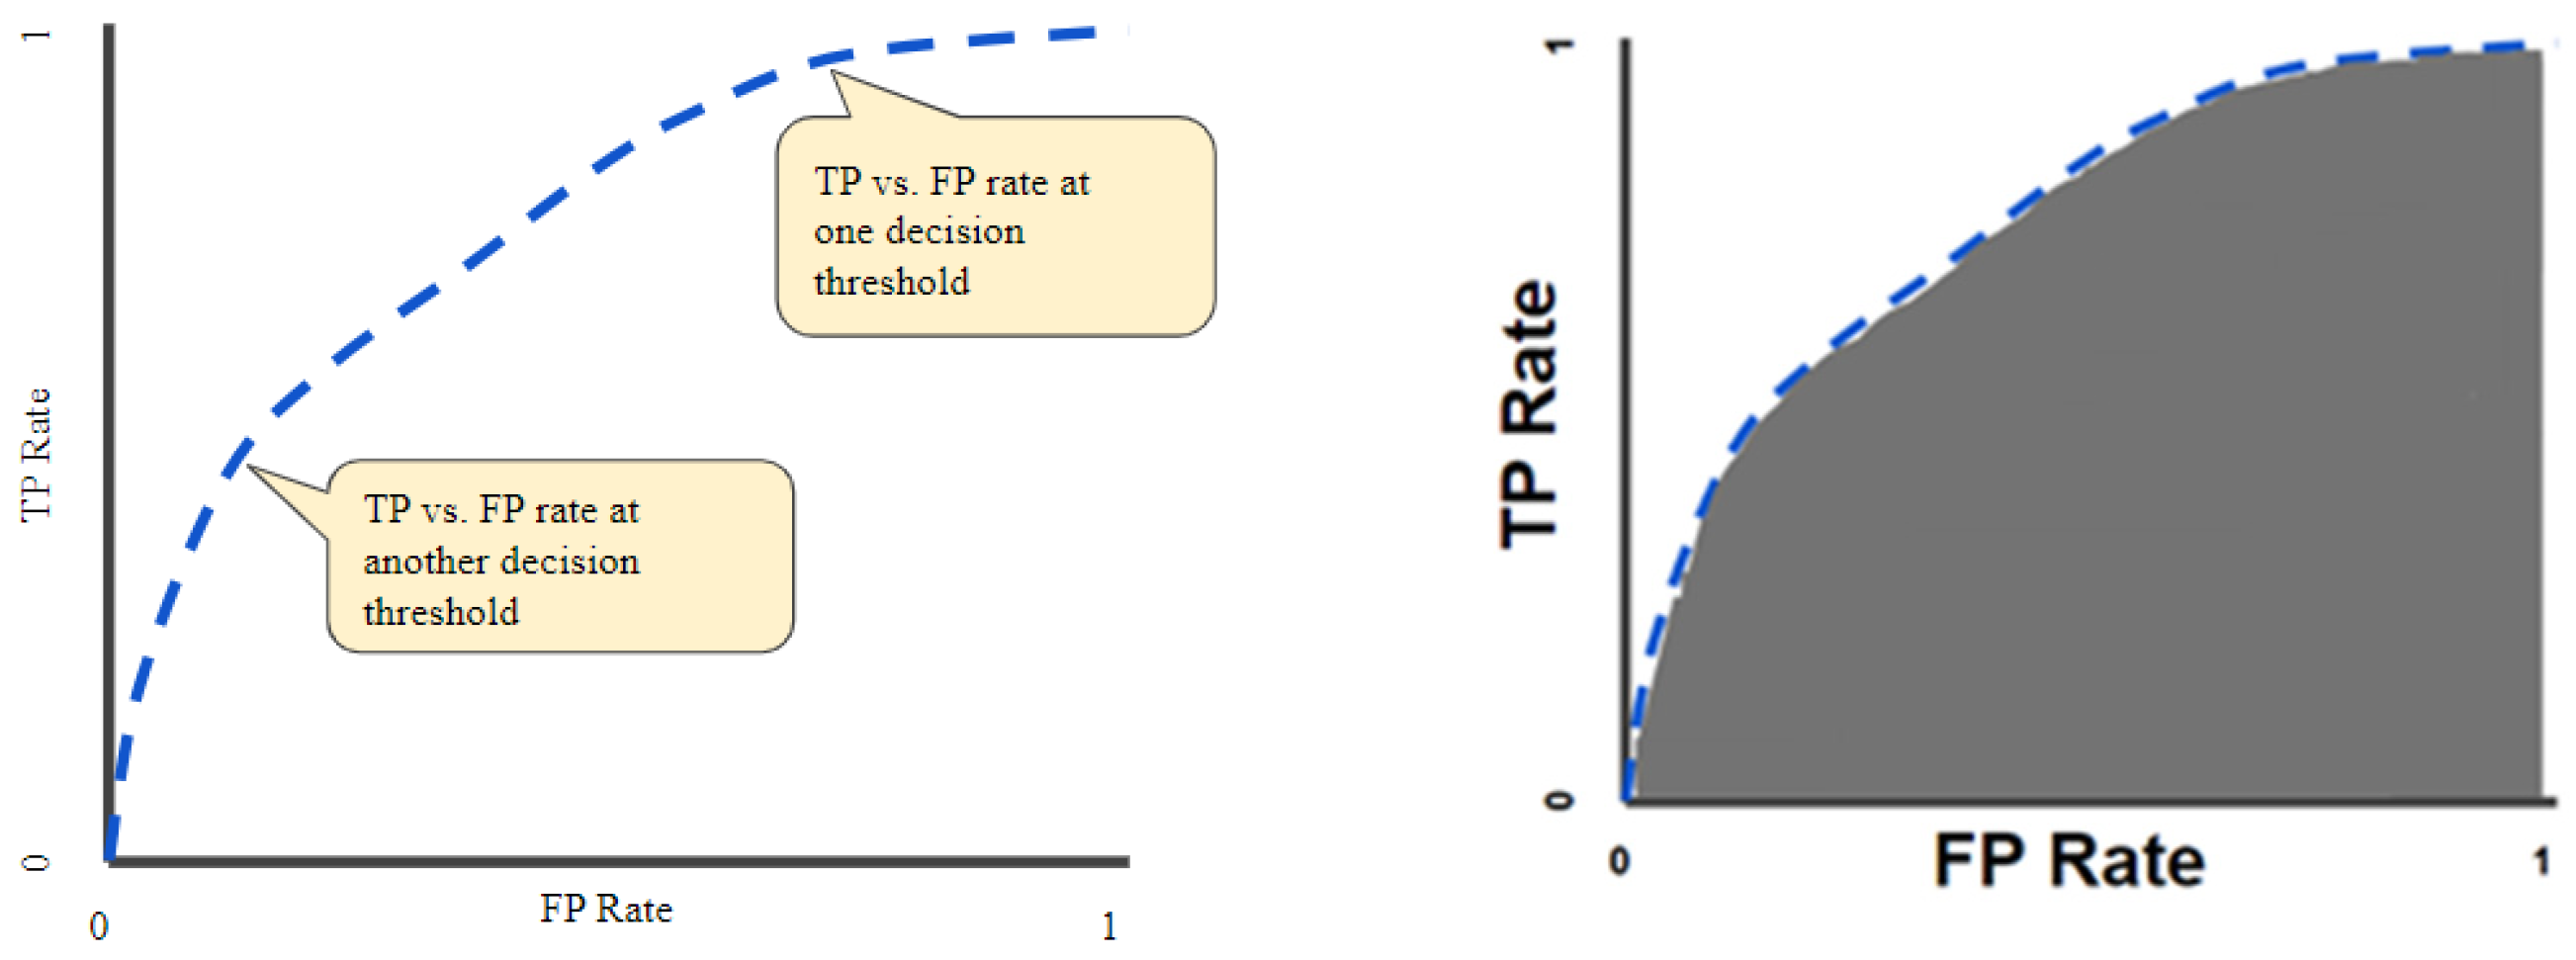
4.5. Description of the Evaluation Applied to DL Models and Metrics
4.6. Description of the Applied Methods’ Limitations
5. Study Limitations
6. Conclusions
- The quality of segmentation, a crucial aspect in most studies, poses a significant challenge due to the inhomogeneous appearance of the pathological menisci in the MRI data and insufficient contrast in additional tissues [53]. It is imperative to develop better preprocessing techniques and algorithms for automated segmentation. A promising avenue is to design an extension of the Segment Anything Model (SAM) for knee MRIs [54].
- Most of the models operated on 2D slices. Appropriate selection of such slices is time-consuming and requires expert knowledge. Better algorithms that operate on 3D images are required to understand the pathological menisci of the whole anatomical structure, not only one or two localizations.
- None of the methods, with one exception [44], can individually detect anatomical subregions of the menisci. Research should be directed into this area.
- To overcome the scarcity of data, transfer learning from other, more advanced fields with more data should be implied in new model configurations.
- A significant limitation of DL models is their task-specific nature. These models are typically designed and trained for a specific task, and their performance can degrade significantly when applied to new tasks or different types of imaging data. This lack of generality poses a substantial obstacle to the broader application of these models in clinical practice. Therefore, there is a growing demand for universal models in knee image segmentation and classification: models that can be trained once and then applied to a wide range of segmentation and classification tasks. In our opinion, further work needs to be performed to cover a broader structure analysis of knee components in a structured and standardized way before implementing these tools efficiently in clinical practice. Other studies on deep learning algorithms’ interpretability are also needed to support professional confidence and efficient implementation. Still, the active participation of radiologists in building these models and strong partnerships with data scientists are keys to supporting early adoption in clinical routine. To generalize and bring any DL algorithm to a clinical application, such an algorithm would need to be incorporated into a standardized workflow and an accurate end-to-end diagnostic tool would need to be developed.
Author Contributions
Funding
Institutional Review Board Statement
Informed Consent Statement
Data Availability Statement
Acknowledgments
Conflicts of Interest
Abbreviations
| ACL | Anterior cruciate ligament |
| AHT | Anterior horn tear |
| AUC | Area under the curve |
| BM | Both meniscus |
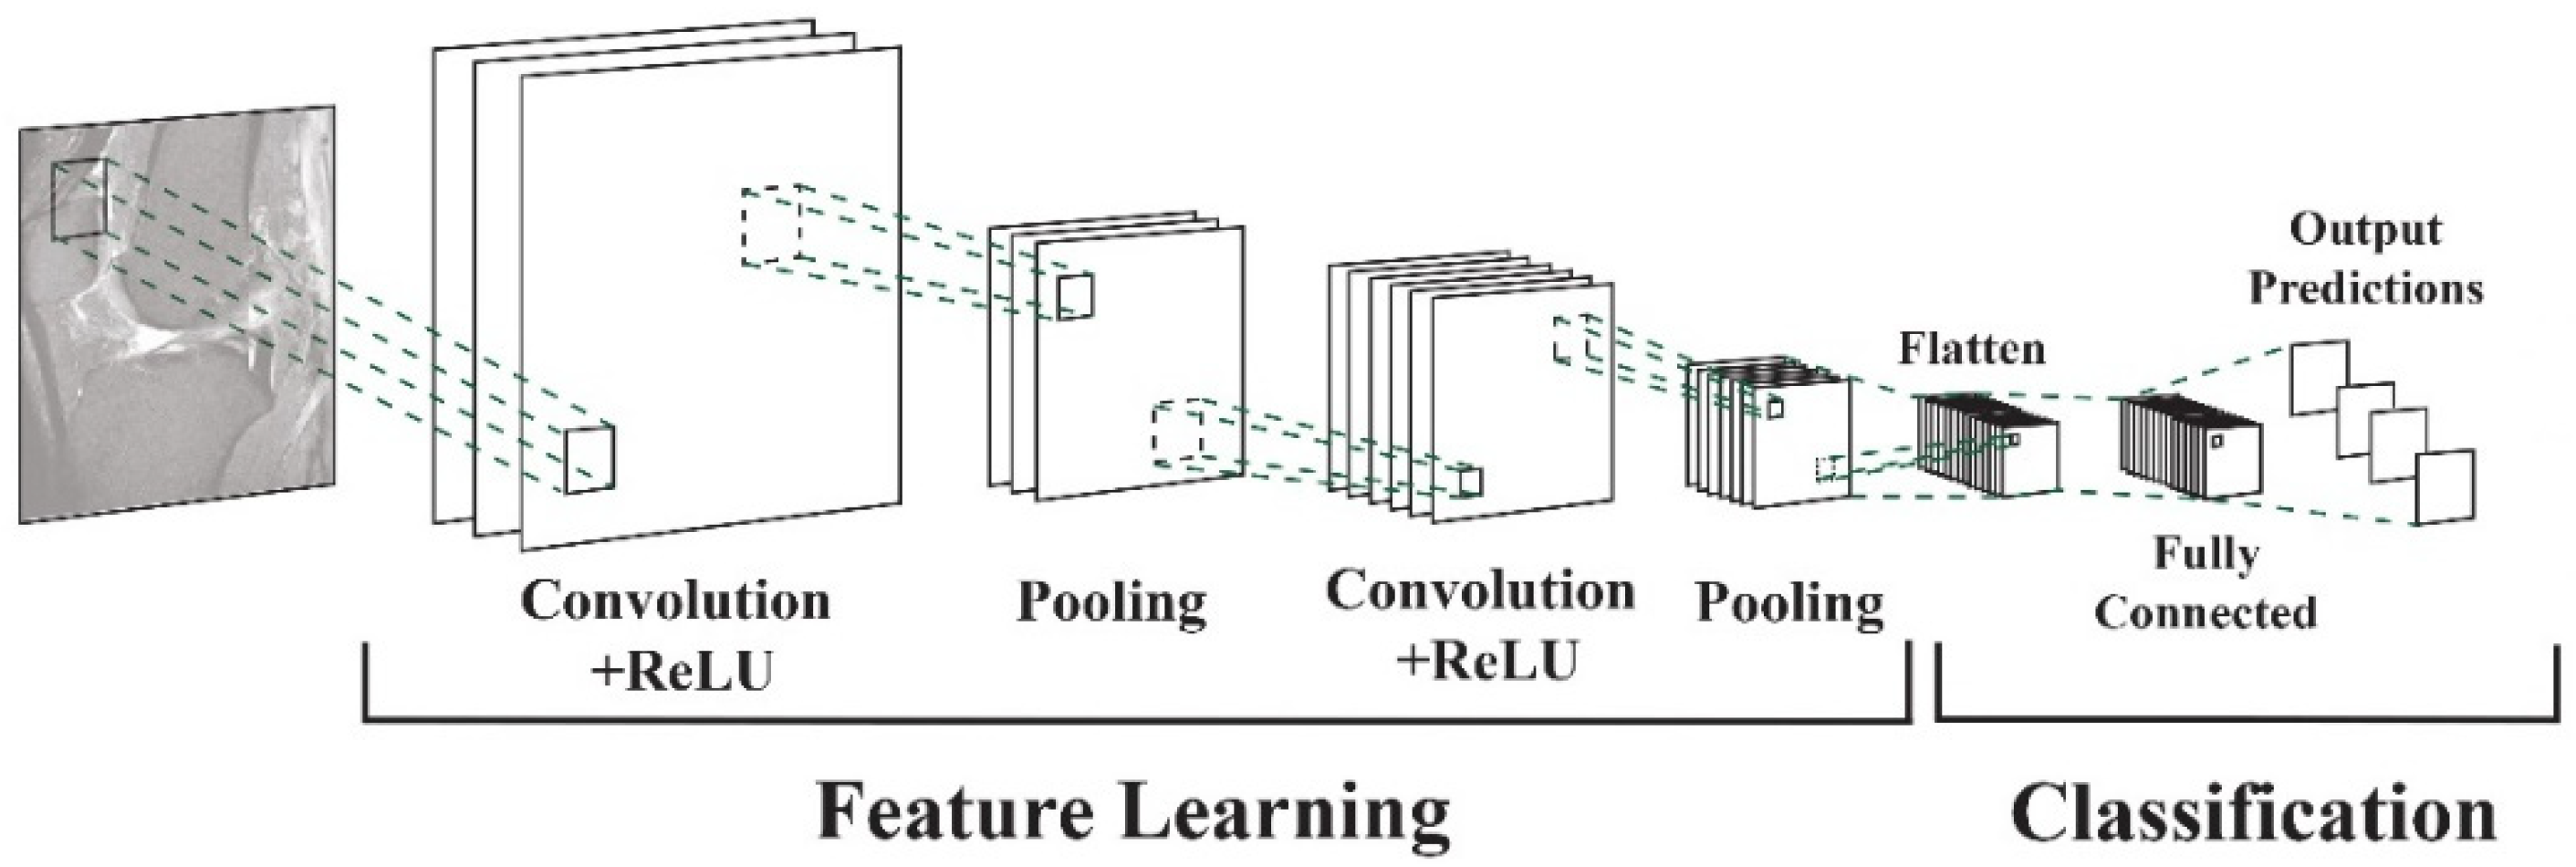
| CNN | Convolutional neural network |
| COR | Coronal |
| DESS | Double echo stead-state |
| DM | Degenerated meniscus |
| FSE | Fast spin echo |
| FSW | Fat suppressed weighted |
| IW | Intermediate weighted |
| LM | Lateral meniscus |
| MM | Medial meniscus |
| MRI | Magnetic resonance imaging |
| NM | Normal meniscus |
| PD | Proton density |
| PDW | Proton density weighted |
| PRISMA | The Preferred Reporting Items for Systematic Reviews and Meta-Analyses |
| ROC | Receiver operating characteristic |
| ROI | Region of interest |
| SAG | Sagittal |
| STIR | Short T1 inversion recovery |
| TRANS | Transversal |
| TSE | Turbo spin echo |
| WORMS | Whole-organ magnetic resonance imaging score |
References
- Yeoh, P.S.Q.; Lai, K.W.; Goh, S.L.; Hasikin, K.; Hum, Y.C.; Tee, Y.K.; Dhanalakshmi, S. Emergence of Deep Learning in Knee Osteoarthritis Diagnosis. Comput. Intell. Neurosci. 2021, 2021, 4931437. [Google Scholar] [CrossRef] [PubMed] [PubMed Central]
- Chan, H.P.; Samala, R.K.; Hadjiiski, L.M.; Zhou, C. Deep Learning in Medical Image Analysis. Adv. Exp. Med. Biol. 2020, 1213, 3–21. [Google Scholar] [CrossRef] [PubMed] [PubMed Central]
- Egger, J.; Gsaxner, C.; Pepe, A.; Pomykala, K.L.; Jonske, F.; Kurz, M.; Li, J.; Kleesiek, J. Medical deep learning-A systematic meta-review. Comput. Methods Programs Biomed. 2022, 221, 106874. [Google Scholar] [CrossRef] [PubMed]
- Adams, B.G.; Houston, M.N.; Cameron, K.L. The Epidemiology of Meniscus Injury. Sports Med. Arthrosc. Rev. 2021, 29, e24–e33. [Google Scholar] [CrossRef] [PubMed]
- Culvenor, A.G.; Øiestad, B.E.; Hart, H.F.; Stefanik, J.J.; Guermazi, A.; Crossley, K.M. Prevalence of knee osteoarthritis features on magnetic resonance imaging in asymptomatic uninjured adults: A systematic review and meta-analysis. Br. J. Sports Med. 2019, 53, 1268–1278. [Google Scholar] [CrossRef] [PubMed] [PubMed Central]
- Orthopaedic Knowledge Update: Sports Medicine 2, 2nd ed.; American Academy of Orthopaedic Surgeons: Rosemont, IL, USA, 1999.
- Majewski, M.; Susanne, H.; Klaus, S. Epidemiology of athletic knee injuries: A 10-year study. Knee 2006, 13, 184–188. [Google Scholar] [CrossRef] [PubMed]
- Lecouvet, F.; Van Haver, T.; Acid, S.; Perlepe, V.; Kirchgesner, T.; Vande Berg, B.; Triqueneaux, P.; Denis, M.L.; Thienpont, E.; Malghem, J. Magnetic resonance imaging (MRI) of the knee: Identification of difficult-to-diagnose meniscal lesions. Diagn. Interv. Imaging 2018, 99, 55–64. [Google Scholar] [CrossRef] [PubMed]
- De Smet, A.A.; Tuite, M.J. Use of the “Two-Slice-Touch”: Rule for the MRI Diagnosis of meniscal tears. AJR Am. J. Roentgenol. 2006, 187, 911–914. [Google Scholar] [CrossRef] [PubMed]
- De Smet, A.A.; Norris, M.A.; Yandow, D.R.; Quintana, F.A.; Graf, B.K.; Keene, J.S. MR diagnosis of meniscal tears of the knee: Importance of high signal in the meniscus that extends to the surface. AJR Am. J. Roentgenol. 1993, 161, 101–107. [Google Scholar] [CrossRef] [PubMed]
- Wadhwa, V.; Omar, H.; Coyner, K.; Khazzam, M.; Robertson, W.; Chhabra, A. ISAKOS classification of meniscal tears-illustration on 2D and 3D isotropic spin-echo MR imaging. Eur. J. Radiol. 2016, 85, 15–24. [Google Scholar] [CrossRef] [PubMed]
- Bien, N.; Rajpurkar, P.; Ball, R.L.; Irvin, J.; Park, A.; Jones, E.; Bereket, M.; Patel, B.N.; Yeom, K.W.; Shpanskaya, K.; et al. Deep learning-assisted diagnosis for knee magnetic resonance imaging: Development and retrospective validation of MRNet. PLoS Med. 2018, 15, e1002699. [Google Scholar] [CrossRef] [PubMed]
- Pedoia, V.; Norman, B.; Mehany, S.N.; Bucknor, M.D.; Link, T.M.; Majumdar, S. 3D convolutional neural networks for detection and severity staging of meniscus and PFJ cartilage morphological degenerative changes in osteoarthritis and anterior cruciate ligament subjects. J. Magn. Reson. Imaging 2019, 49, 400–410. [Google Scholar] [CrossRef] [PubMed]
- Chaudhari, A.S.; Kogan, F.; Pedoia, V.; Majumdar, S.; Gold, G.E.; Hargreaves, B.A. Rapid Knee MRI Acquisition and Analysis Techniques for Imaging Osteoarthritis. J. Magn. Reson. Imaging 2020, 52, 1321–1339. [Google Scholar] [CrossRef] [PubMed] [PubMed Central]
- Si, L.; Zhong, J.; Huo, J.; Xuan, K.; Zhuang, Z.; Hu, Y.; Wang, Q.; Zhang, H.; Yao, W. Deep learning in knee imaging: A systematic review utilizing a Checklist for Artificial Intelligence in Medical Imaging (CLAIM). Eur. Radiol. 2022, 32, 1353–1361. [Google Scholar] [CrossRef] [PubMed]
- Kadar, M.; Botnari, A. Challenges in Deep Learning Applied to the Knee Joint Magnetic Resonance Imaging: A Survey. In Proceedings of Seventh International Congress on Information and Communication Technology; Yang, X.-S., Yang, X.-S., Sherratt, S., Dey, N., Eds.; Lecture Notes in Networks and Systems 465; Springer Nature Singapore Pte Ltd.: Singapore, 2023. [Google Scholar] [CrossRef]
- Fritz, B.; Fritz, J. Artificial intelligence for MRI diagnosis of joints: A scoping review of the current state-of-the-art deep learning-based approaches. Skeletal Radiol. 2022, 51, 315–329. [Google Scholar] [CrossRef] [PubMed]
- Qiu, X.; Liu, Z.; Zhuang, M.; Cheng, D.; Zhu, C.; Zhang, X. Fusion of CNN1 and CNN2-based magnetic resonance image diagnosis of knee meniscus injury and a comparative analysis with computed tomography. Comput. Methods Programs Biomed. 2021, 211, 106297. [Google Scholar] [CrossRef] [PubMed]
- Suzuki, K. Overview of deep learning in medical imaging. Radiol. Phys. Technol. 2017, 10, 257–273. [Google Scholar] [CrossRef] [PubMed]
- Venkatesh, K.; Santomartino, S.M.; Sulam, J.; Yi, P.H. Code and Data Sharing Practices in the Radiology Artificial Intelligence Literature: A Meta-Research Study. Radiol. Artif. Intell. 2022, 4, e220081. [Google Scholar] [CrossRef] [PubMed]
- Saba, L.; Biswas, M.; Kuppili, V.; Godia, E.C.; Suri, H.S.; Edla, D.R.; Omerzu, T.; Laird, J.R.; Khanna, N.N.; Mavrogeni, S.; et al. The present and future of deep learning in radiology. Eur. J. Radiol. 2019, 114, 14–24. [Google Scholar] [CrossRef]
- Cao, C.; Liu, F.; Tan, H.; Song, D.; Shu, W.; Li, W. Deep learning and its applications in biomedicine. Genom. Proteom. Bioinform. 2018, 16, 17–32. [Google Scholar] [CrossRef]
- Lakhani, P.; Gray, D.L.; Pett, C.R.; Nagy, P.; Shih, G. Hello World Deep Learning in Medical Imaging. J. Digit. Imaging 2018, 31, 283–289. [Google Scholar] [CrossRef]
- Pawlowski, N.; Ktena, S.I.; Lee, M.C.; Kainz, B.; Rueckert, D.; Glocker, B. DLTK: State of the art reference implementations for deep learning on medical images. arXiv 2017, arXiv:1711.06853. [Google Scholar]
- Lee, D.D.; Sugiyama, M.; Luxburg, U.V.; Guyon, I.; Garnett, R. (Eds.) Advances in Neural Information Processing Systems 29; Curran Associates, Inc.: New York, NY, USA, 2016; pp. 10–18. [Google Scholar]
- Wang, S.; Su, Z.; Ying, L.; Peng, X.; Zhu, S.; Liang, F. Accelerating magnetic resonance imaging via deep learning. In Proceedings of the 2016 IEEE 13th International Symposium on Biomedical Imaging (ISBI), Prague, Czech Republic, 13–16 April 2016; pp. 514–517. [Google Scholar]
- Qin, C.; Hajnal, J.V.; Rueckert, D.; Schlemper, J.; Caballero, J.; Price, A.N. Convolutional recurrent neural networks for dynamic MR image reconstruction. IEEE Trans. Med. Imaging 2018, 38, 280–290. [Google Scholar] [CrossRef]
- Schlemper, J.; Caballero, J.; Hajnal, J.V.; Price, A.N.; Rueckert, D. A deep cascade of convolutional neural networks for dynamic MR image reconstruction. IEEE Trans. Med. Imaging 2018, 37, 491–503. [Google Scholar] [CrossRef]
- Bluemke, D.A.; Moy, L.; Bredella, M.A.; Ertl-Wagner, B.B.; Fowler, K.J.; Goh, V.J.; Halpern, E.F.; Hess, C.P.; Schiebler, M.L.; Weiss, C.R. Assessing Radiology Research on Artificial Intelligence: A Brief Guide for Authors, Reviewers, and Readers—From the Radiology Editorial Board. Radiology 2020, 294, 487–489. [Google Scholar] [CrossRef]
- Santomartino, S.M.; Kung, J.; Yi, P.H. Systematic review of artificial intelligence development and evaluation for MRI diagnosis of knee ligament or meniscus tears. Skeletal Radiol. 2024, 53, 445–454. [Google Scholar] [CrossRef]
- Kunze, K.N.; Rossi, D.M.; White, G.M.; Karhade, A.V.; Deng, J.; Williams, B.T.; Chahla, J. Diagnostic Performance of Artificial Intelligence for Detection of Anterior Cruciate Ligament and Meniscus Tears: A Systematic Review. Arthrosc. J. Arthrosc. Relat. Surg. 2021, 37, 771–781. [Google Scholar] [CrossRef]
- Siouras, A.; Moustakidis, S.; Giannakidis, A.; Chalatsis, G.; Liampas, I.; Vlychou, M.; Hantes, M.; Tasoulis, S.; Tsaopoulos, D. Knee Injury Detection Using Deep Learning on MRI Studies: A Systematic Review. Diagnostics 2022, 12, 537. [Google Scholar] [CrossRef] [PubMed] [PubMed Central]
- Mongan, J.; Moy, L.; Kahn, C.E., Jr. Checklist for Artificial Intelligence in Medical Imaging (CLAIM): A Guide for Authors and Reviewers. Radiol. Artif. Intell. 2020, 2, e200029. [Google Scholar] [CrossRef]
- Page, M.J.; McKenzie, J.E.; Bossuyt, P.M.; Boutron, I.; Hoffmann, T.C.; Mulrow, C.D.; Shamseer, L.; Tetzlaff, J.M.; Akl, E.A.; Brennan, S.E.; et al. The PRISMA 2020 statement: An updated guideline for reporting systematic reviews. BMJ 2021, 372, n71. [Google Scholar] [CrossRef] [PubMed] [PubMed Central]
- Mandrekar, J.N. Receiver operating characteristic curve in diagnostic test assessment. J. Thorac. Oncol. 2010, 5, 1315–1316. [Google Scholar] [CrossRef] [PubMed]
- Leeflang, M.M.; Deeks, J.J.; Takwoingi, Y.; Macaskill, P. Cochrane diagnostic test accuracy reviews. Syst. Rev. 2013, 2, 82. [Google Scholar] [CrossRef] [PubMed] [PubMed Central]
- Deeks, J.J.; Higgins, J.P.T.; Altman, D.G. (Eds.) Chapter 10: Analysing Data and Undertaking Meta-Analyses. In: Higgins JPT, Thomas J, Chandler J, Cumpston M, Li T, Page MJ, Welch VA (Editors). Cochrane Handbook for Systematic Reviews of Interventions Version 6.4 (Updated August 2023). Cochrane, 2023. Available online: www.training.cochrane.org/handbook (accessed on 15 March 2024).
- Zhao, Y.; Coppola, A.; Karamchandani, U.; Amiras, D.; Gupte, C.M. Artificial intelligence applied to magnetic resonance imaging reliably detects the presence, but not the location, of meniscus tears: A systematic review and meta-analysis. Eur. Radiol. 2024. epub ahead of print. [Google Scholar] [CrossRef] [PubMed]
- Zamora, J.; Abraira, V.; Muriel, A.; Khan, K.; Coomarasamy, A. Meta-DiSc: A software for meta-analysis of test accuracy data. BMC Med. Res. Methodol. 2006, 6, 31. [Google Scholar] [CrossRef] [PubMed]
- Whiting, P.F.; Rutjes, A.W.; Westwood, M.E.; Mallett, S.; Deeks, J.J.; Reitsma, J.B.; Leeflang, M.M.; Sterne, J.A.; Bossuyt, P.M.; QUADAS-2 Group. QUADAS-2: A revised tool for the quality assessment of diagnostic accuracy studies. Ann. Intern. Med. 2011, 155, 529–536. [Google Scholar] [CrossRef] [PubMed]
- Couteaux, V.; Si-Mohamed, S.; Nempont, O.; Lefevre, T.; Popoff, A.; Pizaine, G.; Villain, N.; Bloch, I.; Cotten, A.; Boussel, L. Automatic knee meniscus tear detection and orientation classification with Mask-RCNN. Diagn. Interv. Imaging 2019, 100, 235–242. [Google Scholar] [CrossRef] [PubMed]
- Roblot, V.; Giret, Y.; Bou Antoun, M.; Morillot, C.; Chassin, X.; Cotten, A.; Zerbib, J.; Fournier, L. Artificial intelligence to diagnose meniscus tears on MRI. Diagn. Interv. Imaging 2019, 100, 243–249. [Google Scholar] [CrossRef] [PubMed]
- Fritz, B.; Marbach, G.; Civardi, F.; Fucentese, S.F.; Pfirrmann, C.W.A. Deep convolutional neural network-based detection of meniscus tears: Comparison with radiologists and surgery as standard of reference. Skeletal Radiol. 2020, 49, 1207–1217, Erratum in Skeletal Radiol. 2020, 49, 1219. [Google Scholar] [CrossRef] [PubMed] [PubMed Central]
- Tack, A.; Shestakov, A.; Lüdke, D.; Zachow, S. A Multi-Task Deep Learning Method for Detection of Meniscal Tears in MRI Data from the Osteoarthritis Initiative Database. Front. Bioeng. Biotechnol. 2021, 9, 747217. [Google Scholar] [CrossRef] [PubMed] [PubMed Central]
- Rizk, B.; Brat, H.; Zille, P.; Guillin, R.; Pouchy, C.; Adam, C.; Ardon, R.; d’Assignies, G. Meniscal lesion detection and characterization in adult knee MRI: A deep learning model approach with external validation. Phys. Med. 2021, 83, 64–71. [Google Scholar] [CrossRef] [PubMed]
- Li, J.; Qian, K.; Liu, J.; Huang, Z.; Zhang, Y.; Zhao, G.; Wang, H.; Li, M.; Liang, X.; Zhou, F.; et al. Identification and diagnosis of meniscus tear by magnetic resonance imaging using a deep learning model. J. Orthop. Translat. 2022, 34, 91–101. [Google Scholar] [CrossRef] [PubMed] [PubMed Central]
- Li, Y.Z.; Wang, Y.; Fang, K.B.; Zheng, H.Z.; Lai, Q.Q.; Xia, Y.F.; Chen, J.Y.; Dai, Z.S. Automated meniscus segmentation and tear detection of knee MRI with a 3D mask-RCNN. Eur. J. Med. Res. 2022, 27, 247. [Google Scholar] [CrossRef] [PubMed] [PubMed Central]
- Shin, H.; Choi, G.S.; Shon, O.J.; Kim, G.B.; Chang, M.C. Development of convolutional neural network model for diagnosing meniscus tear using magnetic resonance image. BMC Musculoskelet. Disord. 2022, 23, 510. [Google Scholar] [CrossRef] [PubMed] [PubMed Central]
- Tsai, C.; Kiryati, N.; Konen, E.; Eshed, I.; Mayer, A. Knee Injury Detection using MRI with Efficiently-Layered Network (ELNet). Proceedings of the Third Conference on Medical Imaging with Deep Learning. Proc. Mach. Learn. Res. 2020, 121, 784–794. [Google Scholar]
- Astuto, B.; Flament, I.; KNamiri, N.; Shah, R.; Bharadwaj, U.; MLink, T.; DBucknor, M.; Pedoia, V.; Majumdar, S. Automatic Deep Learning-assisted Detection and Grading of Abnormalities in Knee MRI Studies. Radiol. Artif. Intell. 2021, 3, e200165, Erratum in Radiol. Artif. Intell. 2021, 3, e219001. [Google Scholar] [CrossRef] [PubMed] [PubMed Central]
- Ying, M.; Wang, Y.; Yang, K.; Wang, H.; Liu, X. A deep learning knowledge distillation framework using knee MRI and arthroscopy data for meniscus tear detection. Front. Bioeng. Biotechnol. 2024, 11, 1326706. [Google Scholar] [CrossRef] [PubMed] [PubMed Central]
- Shetty, N.D.; Dhande, R.; Unadkat, B.S.; Parihar, P. A Comprehensive Review on the Diagnosis of Knee Injury by Deep Learning-Based Magnetic Resonance Imaging. Cureus 2023, 15, e45730. [Google Scholar] [CrossRef] [PubMed] [PubMed Central]
- Altman, D.G.; Royston, P. What do we mean by validating a prognostic model? Stat. Med. 2000, 19, 453–473. [Google Scholar] [CrossRef]
- Kirillov, A.; Mintun, E.; Ravi, N.; Mao, H.; Rolland, C.; Gustafson, L.; Xiao, T.; Whitehead, S.; Berg, A.C.; Lo, W.-Y.; et al. Segment anything. arXiv 2023, arXiv:2304.02643. [Google Scholar]


| Couteaux et al. | Roblot et al. | Fritz et al. | Rizk et al. | Tack et al. | Li Yz et al. | Li et al. | Shin et al. | Bien et al. | Pedoia et al. | Tsai et al. | Astuto et al. | |
|---|---|---|---|---|---|---|---|---|---|---|---|---|
| [41] | [42] | [43] | [45] | [44] | [47] | [46] | [48] | [12] | [13] | [49] | [50] | |
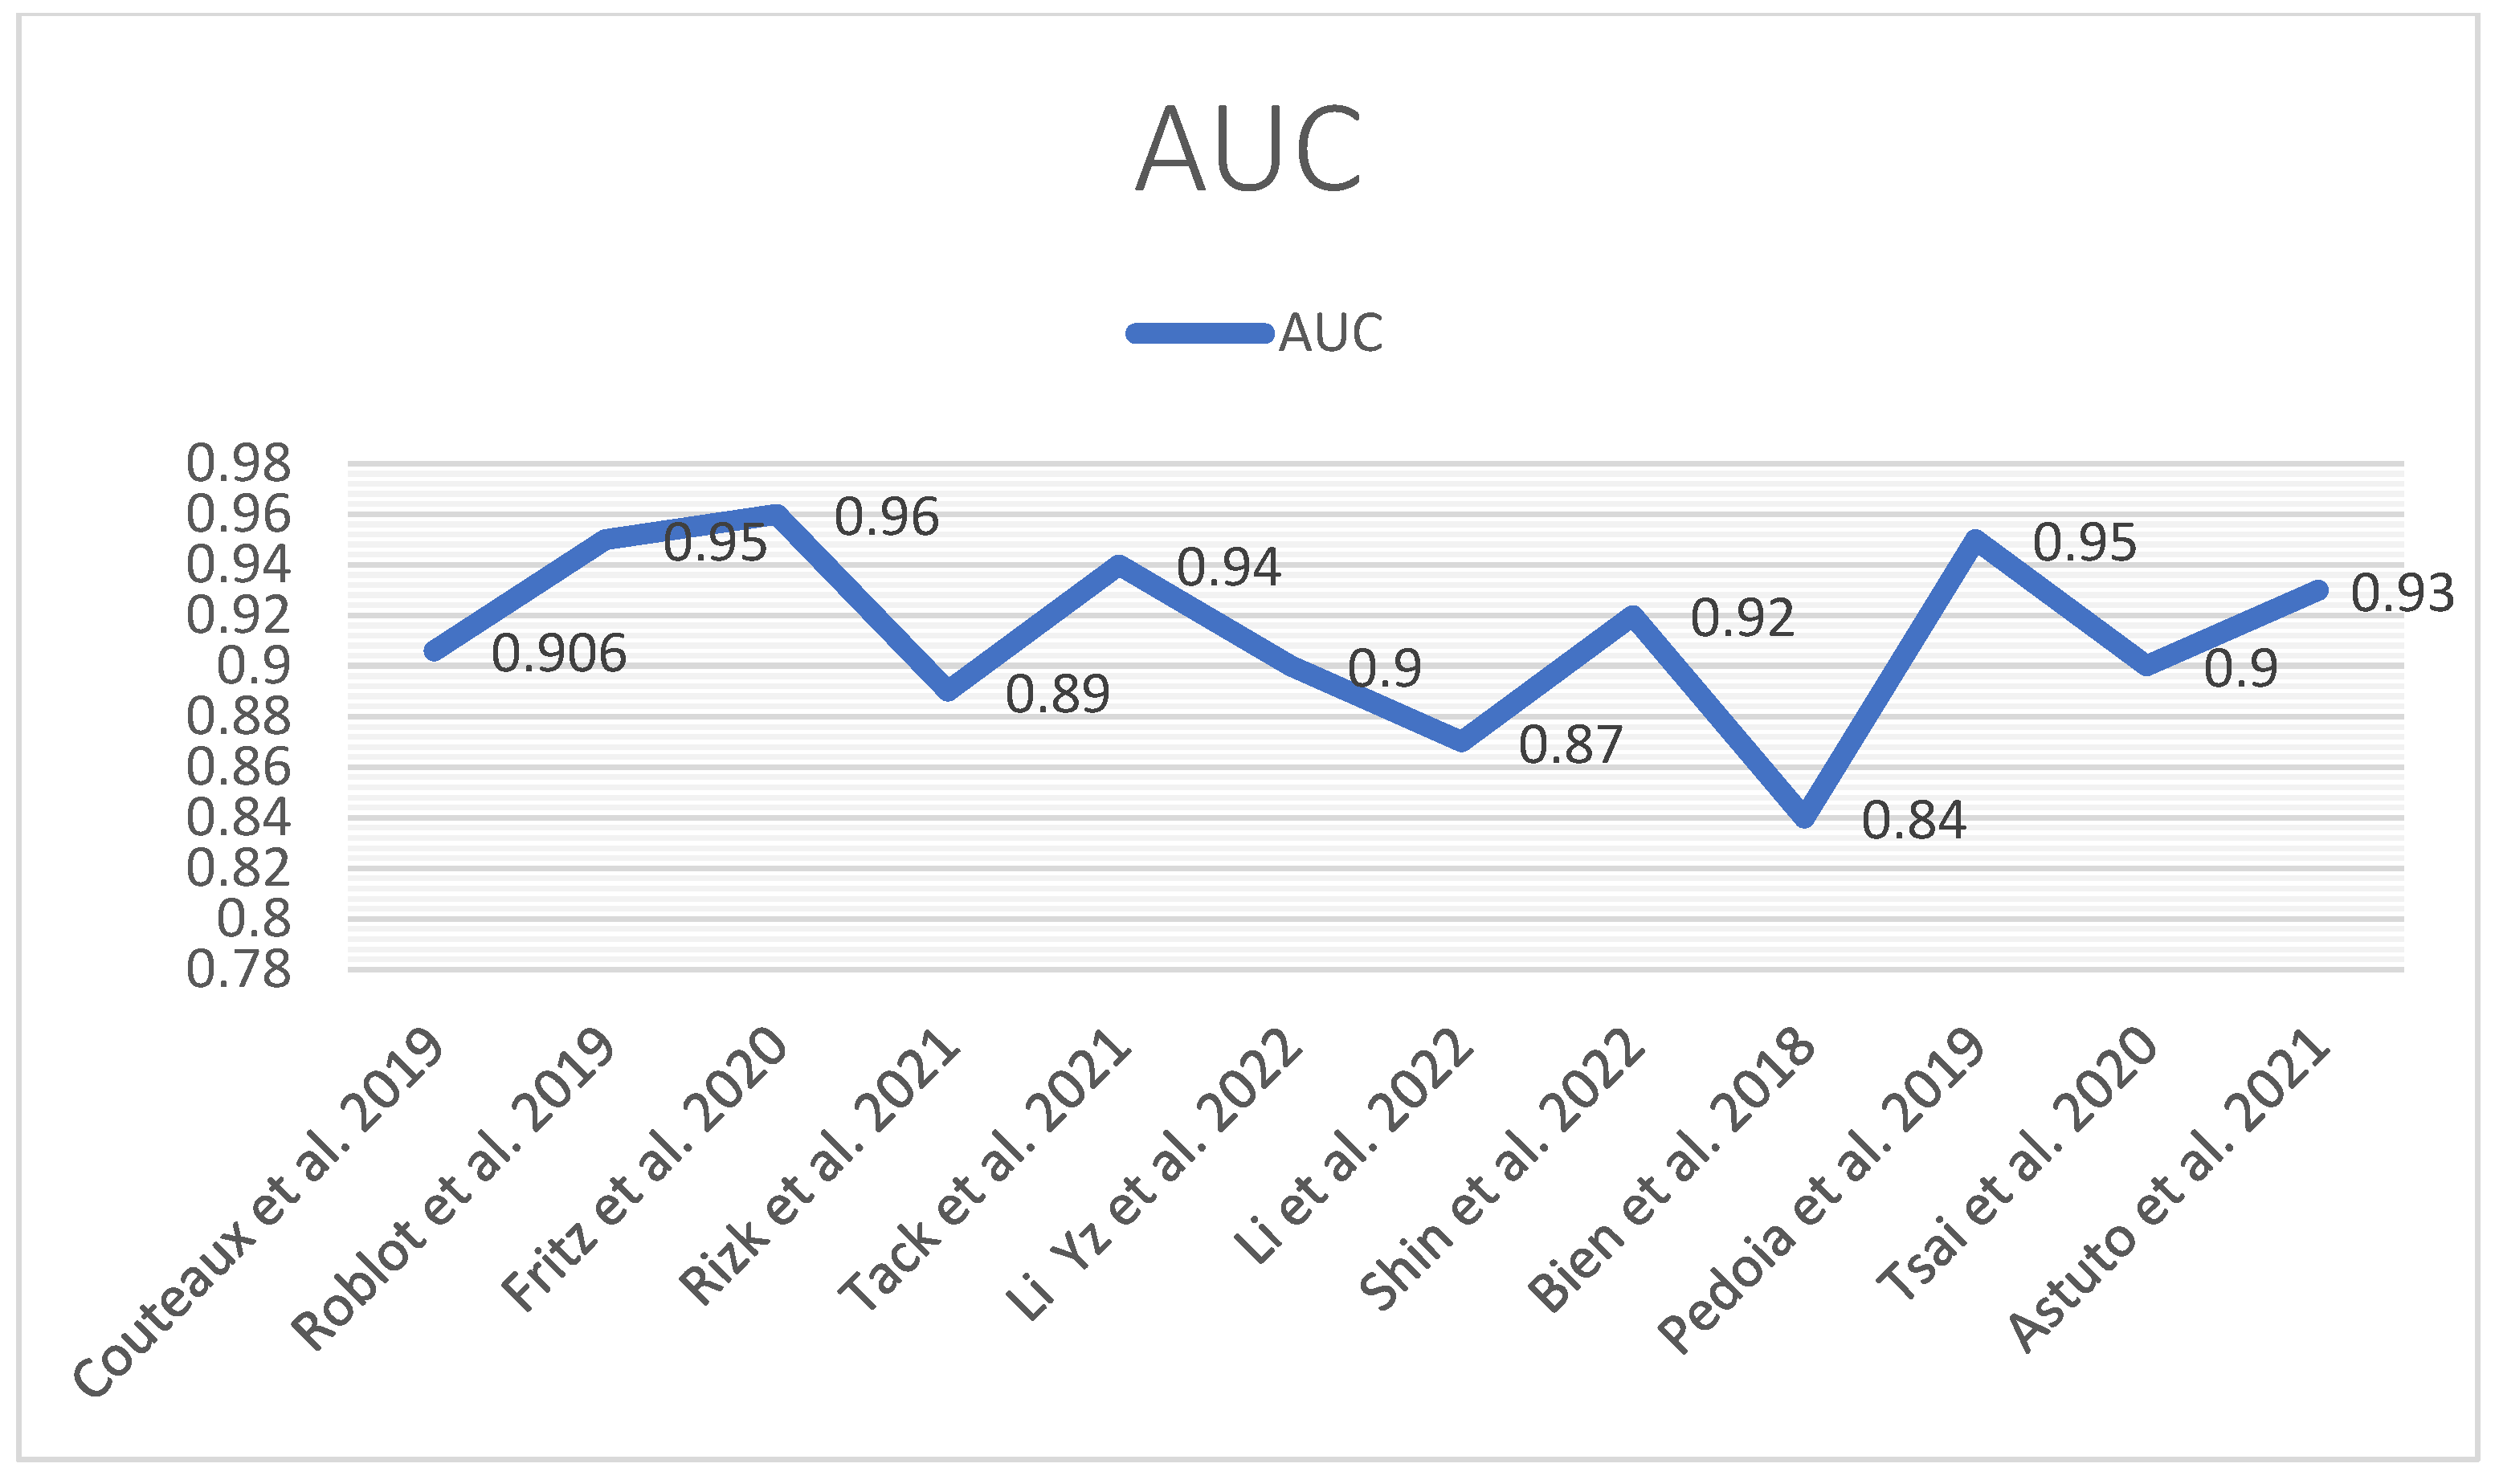
| Meniscus | 0.906 | 0.95 | 0.96 | 0.89 | 0.94 | 0.90 | 0.87 | 0.92 | 0.84 | 0.95 | 0.90 | 0.93 |
| Degeneration | 0.85 | |||||||||||
| MM | 0.88 | 0.93 | 0.94 | 0.88 | ||||||||
| LM | 0.78 | 0.84 | 0.93 | 0.81 | ||||||||
| AH MM | 0.94 | 0.69 | ||||||||||
| AH LM | 0.96 | |||||||||||
| PH MM | 0.93 | 0.71 | ||||||||||
| PH LM | 0.91 | |||||||||||
| Body MM | 0.93 | 0.7 | ||||||||||
| Body LM | 0.91 | |||||||||||
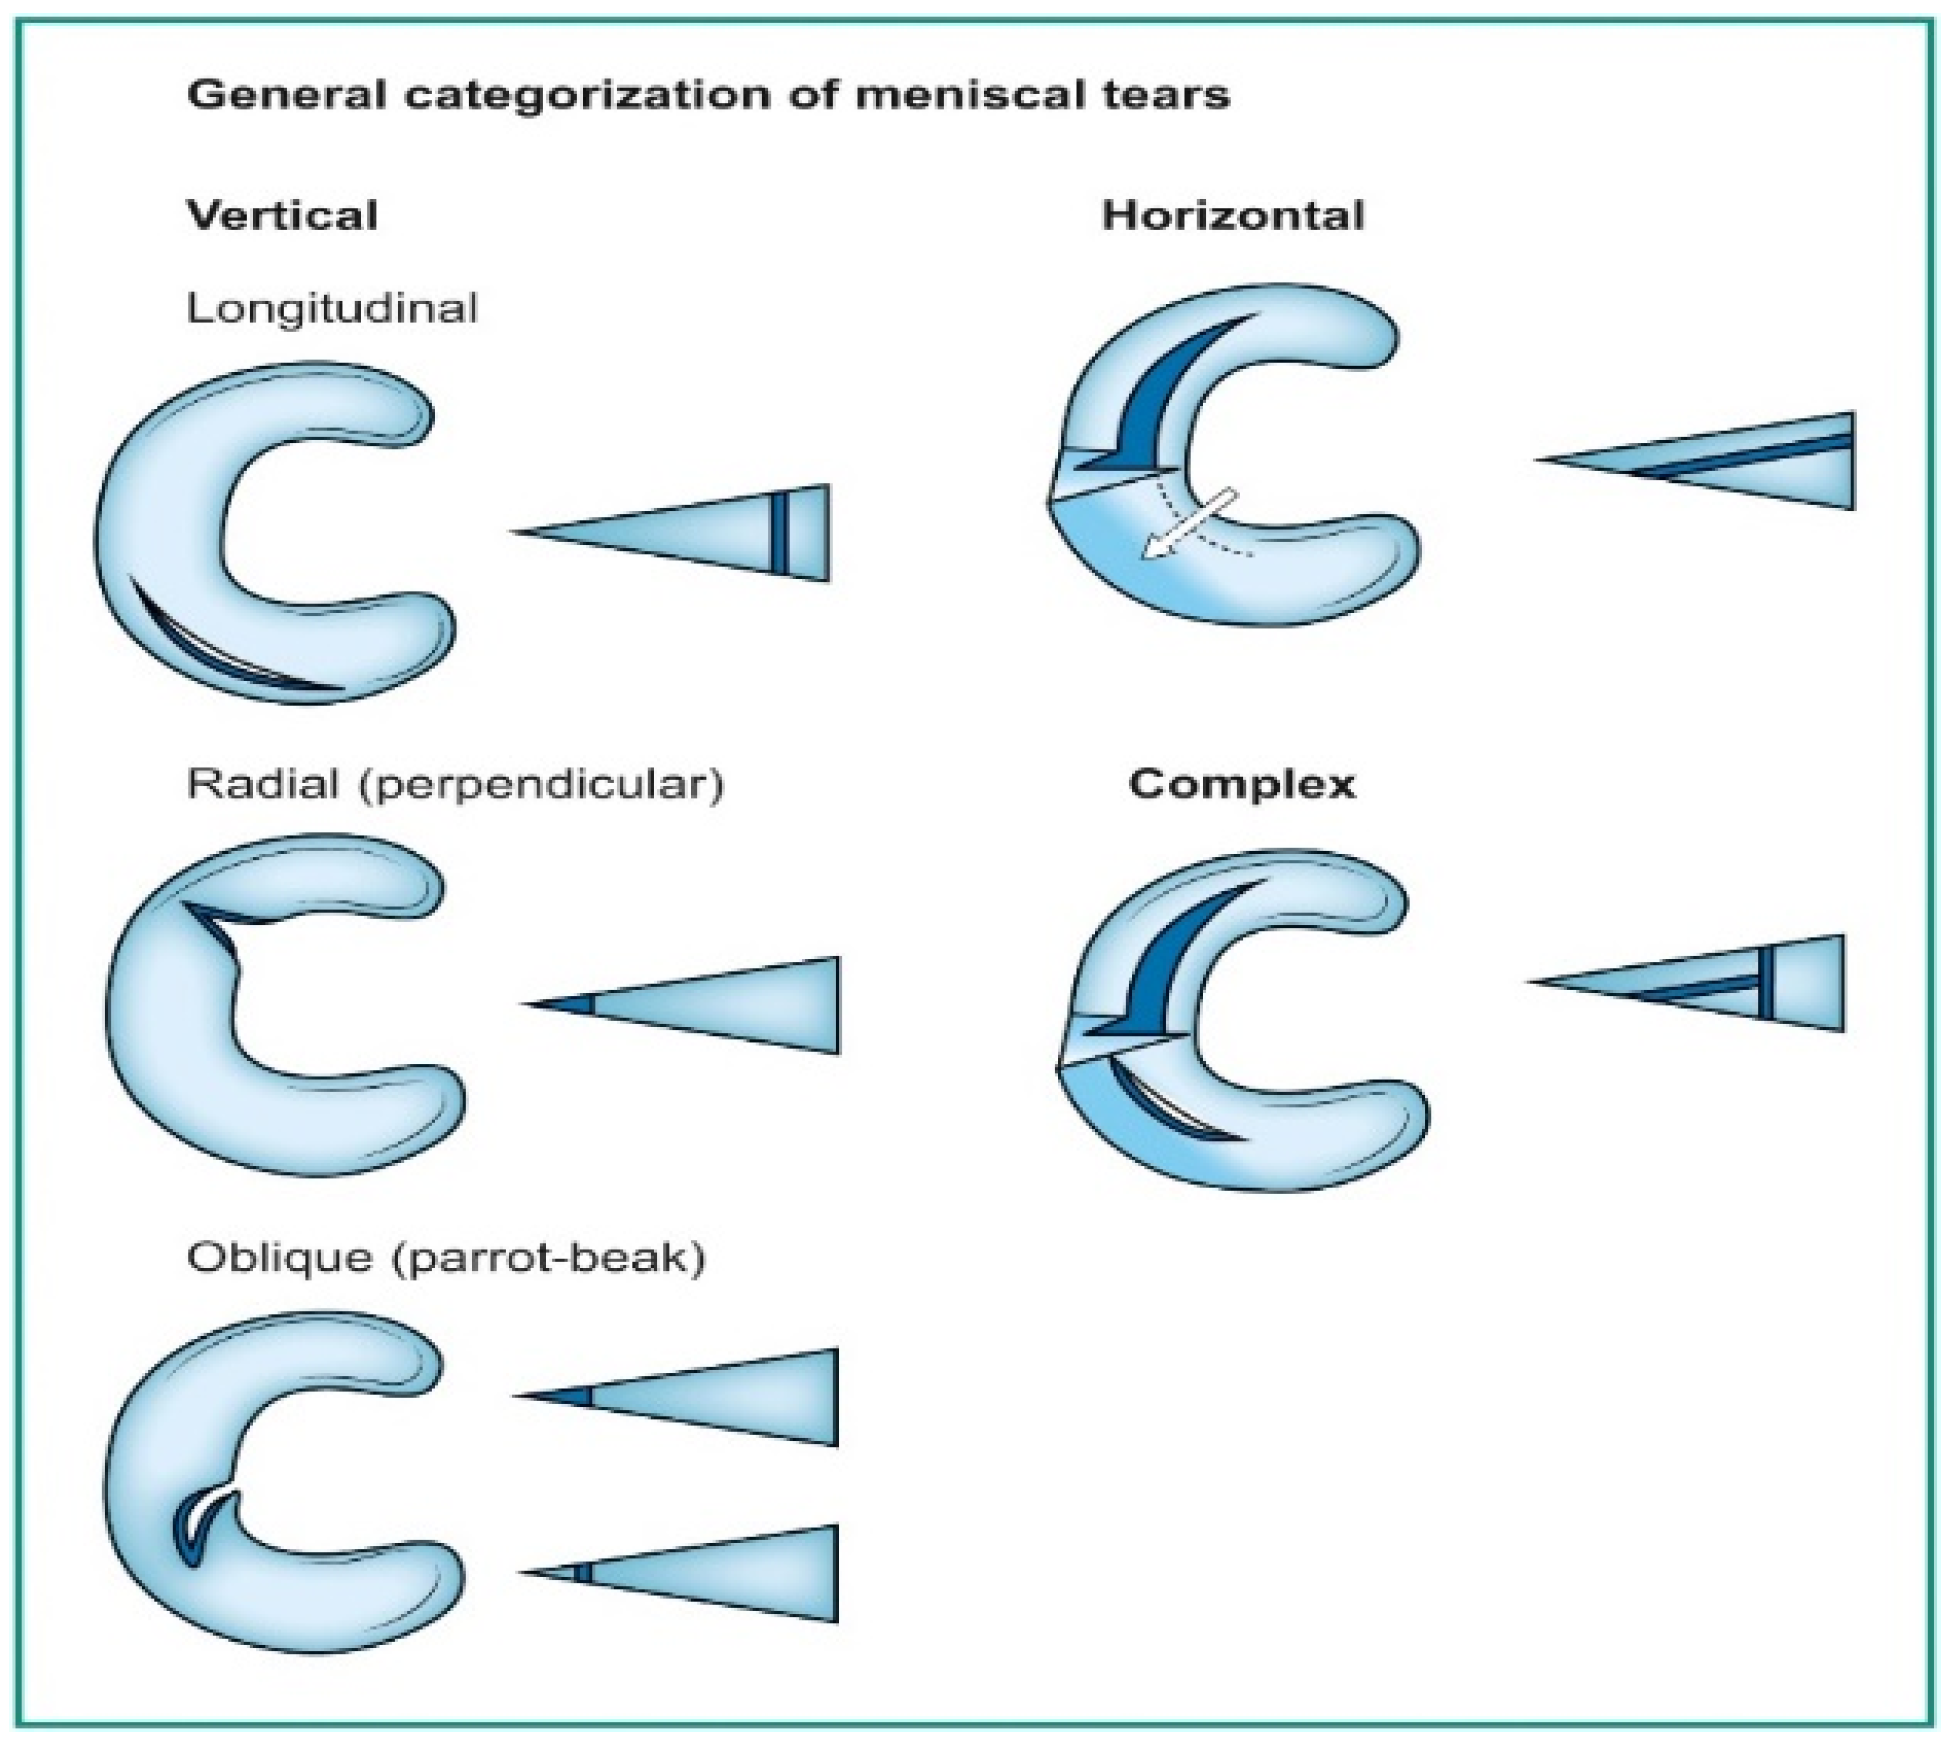
| Horizontal tear | 0.76 | |||||||||||
| Complex tear | 0.75 | |||||||||||
| Radial tear | 0.61 | |||||||||||
| Longitudinal tear | 0.83 |
| Authors | Year | DL Model | MRI (Field/ Sequences) | Task | Metrics (AUC) |
|---|---|---|---|---|---|
| Couteaux et al. [41] | 2019 | MASK R-CNN | N/A | Tear orientation classification: medial and lateral meniscus, anterior or posterior horn, horizontal or vertical tear. | 0.906 |
| Roblot et al. [42] | 2019 | CNN, R-CNN | N/A/ T2 SAG | Tear orientation classification: medial and lateral meniscus, anterior or posterior horn, horizontal or vertical tear. | 0.90 |
| Fritz et al. [43] | 2020 | DCNN | 1.5 or 3 T/T1 STIR IWs IW Dixon COR, TRANS, SAG | Tear detection of medial and lateral meniscus | 0.961 |
| Rizk et al. [45] | 2021 | 3D CNN | 1.0 T 1.5 T 3 T/COR SAG PD FSW | Medial and lateral tear meniscal migration | MM 0.93/ LM 0.84/ |
| Tack et al. [44] | 2021 | 3D CNN | 3.0 T/DESS 3D MRI, IW TSE | Detection of lesions: anterior horn, body posterior horn of MM, and LM | MM 0.94/LM 0.93/ |
| Li et al. [46] | 2022 | Mask R-CNN | 3.0 T/ SAG PDW | Detection of normal meniscus, meniscal tear, and degenerated meniscus | 0.86 DM 0.84 |
| Li Yz et al. [47] | 2022 | 3D-Mask RCNN | 3.0 T/ SAG PDW | Detection of meniscal tear and normal meniscus | 0.907 |
| Shin et al. [48] | 2022 | CNN | 1.5 T/ FS T2 W COR SAG | Detection of MM LM tear, type of the lesion: complex, radial, horizontal, longitudinal | MM 0.889 LM 0.817 BM 0.924 |
| Bien et al. [12] | 2018 | CNN, MRNET | 1.5 T/3 T/ SAG T2 W COR T1 W Axial PDW | Detection of meniscal tears, ACL tears, and abnormalities | 0.847 |
| Pedoia et al. [13] | 2019 | 3D CNN, 2D U-NET | 3 T/ 3D FSE CUBE | Detection of meniscal tears, ACL tears, and cartilage lesions | 0.89 |
| Tsai et al. [49] | 2020 | CNN ELNET | 1.5 T/3 T/ SAG T2 W COR T1 W Axial PDW | Meniscal tear detection | 0.904 |
| Astuto et al. [50] | 2021 | 3D CNN | 3 T/ 3DFSE CUBE | Anterior and posterior horn MM, anterior and posterior LM | 0.93 |
| Authors | Initial Dataset | Preprocessing | Localization ROI | Ground Truth | Curated Dataset |
|---|---|---|---|---|---|
| Couteaux et al. [41] | 1128 images (2D) | Morphological preprocessing approximate menisci | Both menisci Identify tears in each meniscus with Mask R-CNN | Batch 1 contained 55/257 (21.4%) images with horizontal posterior tears, 46/257 (17.9%) with vertical posterior tears, 13/257 (5.1%) with horizontal anterior tears, and 8/257 (3.1%) with vertical anterior tears. Batch 2 contained 107/871 (12.3%) images with horizontal posterior tears, 60/871 (6.9%) with vertical posterior tears, 8/871 (0.9%) with horizontal anterior tears, and 3/871 (0.3%) with vertical anterior tears | 1128 images |
| Roblot et al. [42] | 1123 images (2D) | Bounding box surrounding each horn of the meniscus Labeling | Detection technique Fast RCNN and Faster RCNN | Annotation data in a CSV file 1948 normal 248 meniscal tears 183 horizontal tears 115 vertical tears | 2246 images |
| Fritz et al. [43] | 20,520 images, 100 patients (2D) | Automated selection of coronal and sagittal images by DCNN Cropping around the meniscus | Class activation map (CAM) of the last convolution layer in the CNN and maps to an axial knee image. | The ground truths (binary labels) used to train the CNN were extracted from human-produced, anonymized clinical reports belonging to the MRI studies using rule-based natural language processing (NLP) algorithm. | 18,520 images |
| Rizk et al. [45] | 11,353 Images, 10,401 patients (2D) | The content was extracted using natural language processing (NLP) algorithms. Manually annotated by two data scientists 3D bounding boxes normalized in the range [0, 1] around medial and lateral menisci | Custom localization In-house annotation tool | 8058 training 299 testing Five musculoskeletal specialists were compared to general radiologists’ reports. External validation was performed using the publicly available MRNet database | 8058 images |
| Tack et al. [44] | 2399 scans (3D) | Resampling and resizing cropped data automated preprocessing step Bounding box regression task | Bonding box crop approach for segmentation of both menisci | WORMS scores | 2399 scans |
| Li et al. [46] | 924 Patients, 18 images/ patient (2D) | Data augmentation | Mask R–CNN | The total number of labels in the training, validation, and internal testing dataset was 30,080. | 30,080 images |
| Li Yz et al. [47] | 533 Patients | Labels of meniscal tears were based on arthroscopic reports from the same group of orthopedic surgeons as a standard of reference | ROI using ITK-SNAP on the sagittal section. The meniscus was manually segmented A 3D-mask RCNN for the detection and segmentation of meniscus | Two radiologists and software based on DCNN retrospectively evaluated clinical patients’ knee MRIs to detect medial and lateral meniscus tears | 533 images |
| Shin et al. [48] | 599 cases (3D) | Assessed by two board-certified orthopedic knee specialists, intra-class correlation coefficients | n/a | 268 horizontal tears 147 complex tears 48 radial tears, 75 longitudinal tears 449 cases without meniscal tears | 1048 cases |
| Bien et al. [12] | 1370 images (17–61 slices) (2D) | Manually reviewed to curate a dataset. Histogram-based intensity standardization | Reference standard labels by internal validation. Vote of 3 practicing board-certified MSK radiologists | 1104 abnormal 319 ACL 508 MT 194 ACL+MT External validation of 917 images | 1370 images |
| Pedoia et al. [13] | 1481 images (3D) | Annotated by five board-certified radiologists | 2D-Unet 3D bounding box | WORMS scores | 1481 images |
| Tsai et al. [49] | 1370 images (17–61 slices) (2D) | Histogram-based intensity standardization Randomized data augmentations to each series | n/a | 1104 abnormal 319 ACL 508 MT 194 ACL+MT External validation of 917 images | 1370 images |
| Astuto et al. [50] | 1435 Images, 294 patients (3D) | Five board-certified radiologists graded no overlapping portions of the dataset | VNet 11 regions of interest (ROIs) | WORMS-based inference | 1435 images |
Disclaimer/Publisher’s Note: The statements, opinions and data contained in all publications are solely those of the individual author(s) and contributor(s) and not of MDPI and/or the editor(s). MDPI and/or the editor(s) disclaim responsibility for any injury to people or property resulting from any ideas, methods, instructions or products referred to in the content. |
© 2024 by the authors. Licensee MDPI, Basel, Switzerland. This article is an open access article distributed under the terms and conditions of the Creative Commons Attribution (CC BY) license (https://creativecommons.org/licenses/by/4.0/).
Share and Cite
Botnari, A.; Kadar, M.; Patrascu, J.M. A Comprehensive Evaluation of Deep Learning Models on Knee MRIs for the Diagnosis and Classification of Meniscal Tears: A Systematic Review and Meta-Analysis. Diagnostics 2024, 14, 1090. https://doi.org/10.3390/diagnostics14111090
Botnari A, Kadar M, Patrascu JM. A Comprehensive Evaluation of Deep Learning Models on Knee MRIs for the Diagnosis and Classification of Meniscal Tears: A Systematic Review and Meta-Analysis. Diagnostics. 2024; 14(11):1090. https://doi.org/10.3390/diagnostics14111090
Chicago/Turabian StyleBotnari, Alexei, Manuella Kadar, and Jenel Marian Patrascu. 2024. "A Comprehensive Evaluation of Deep Learning Models on Knee MRIs for the Diagnosis and Classification of Meniscal Tears: A Systematic Review and Meta-Analysis" Diagnostics 14, no. 11: 1090. https://doi.org/10.3390/diagnostics14111090
APA StyleBotnari, A., Kadar, M., & Patrascu, J. M. (2024). A Comprehensive Evaluation of Deep Learning Models on Knee MRIs for the Diagnosis and Classification of Meniscal Tears: A Systematic Review and Meta-Analysis. Diagnostics, 14(11), 1090. https://doi.org/10.3390/diagnostics14111090