
Aspects of Occlusal Recordings Performed with the T-Scan System and with the Medit Intraoral Scanner


 , and
, and
Abstract
1. Introduction
2. Materials and Methods
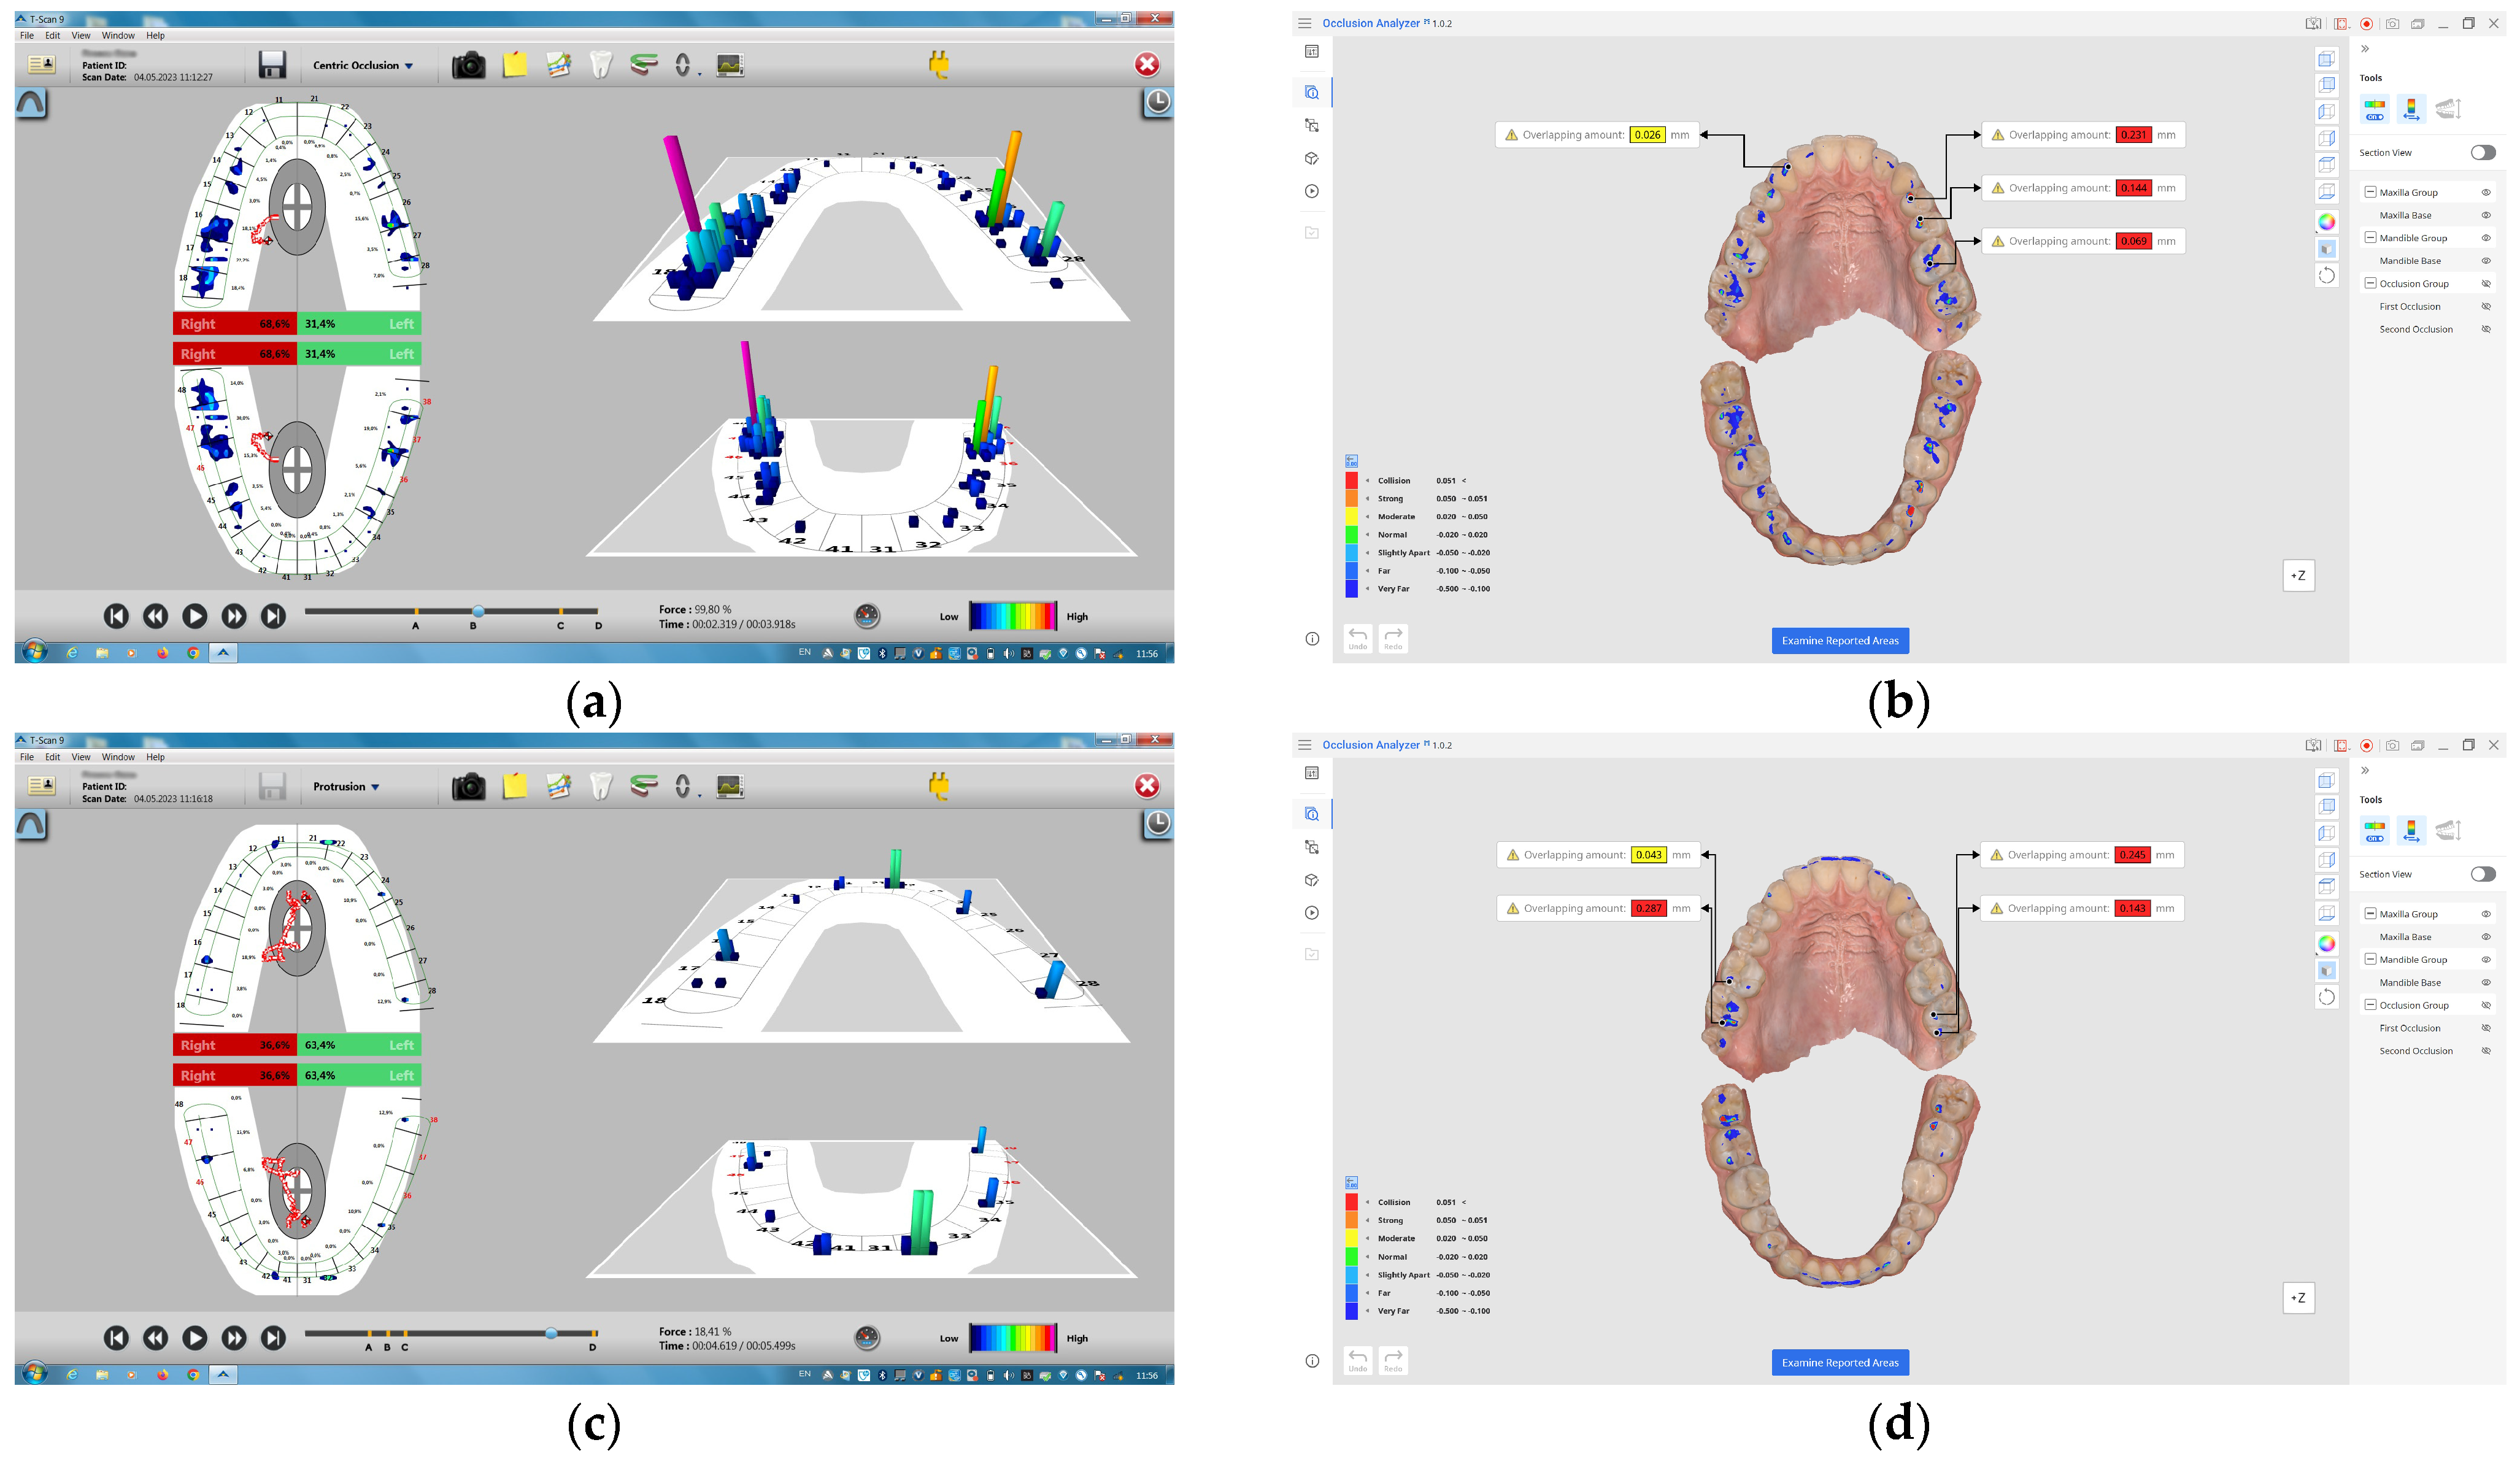
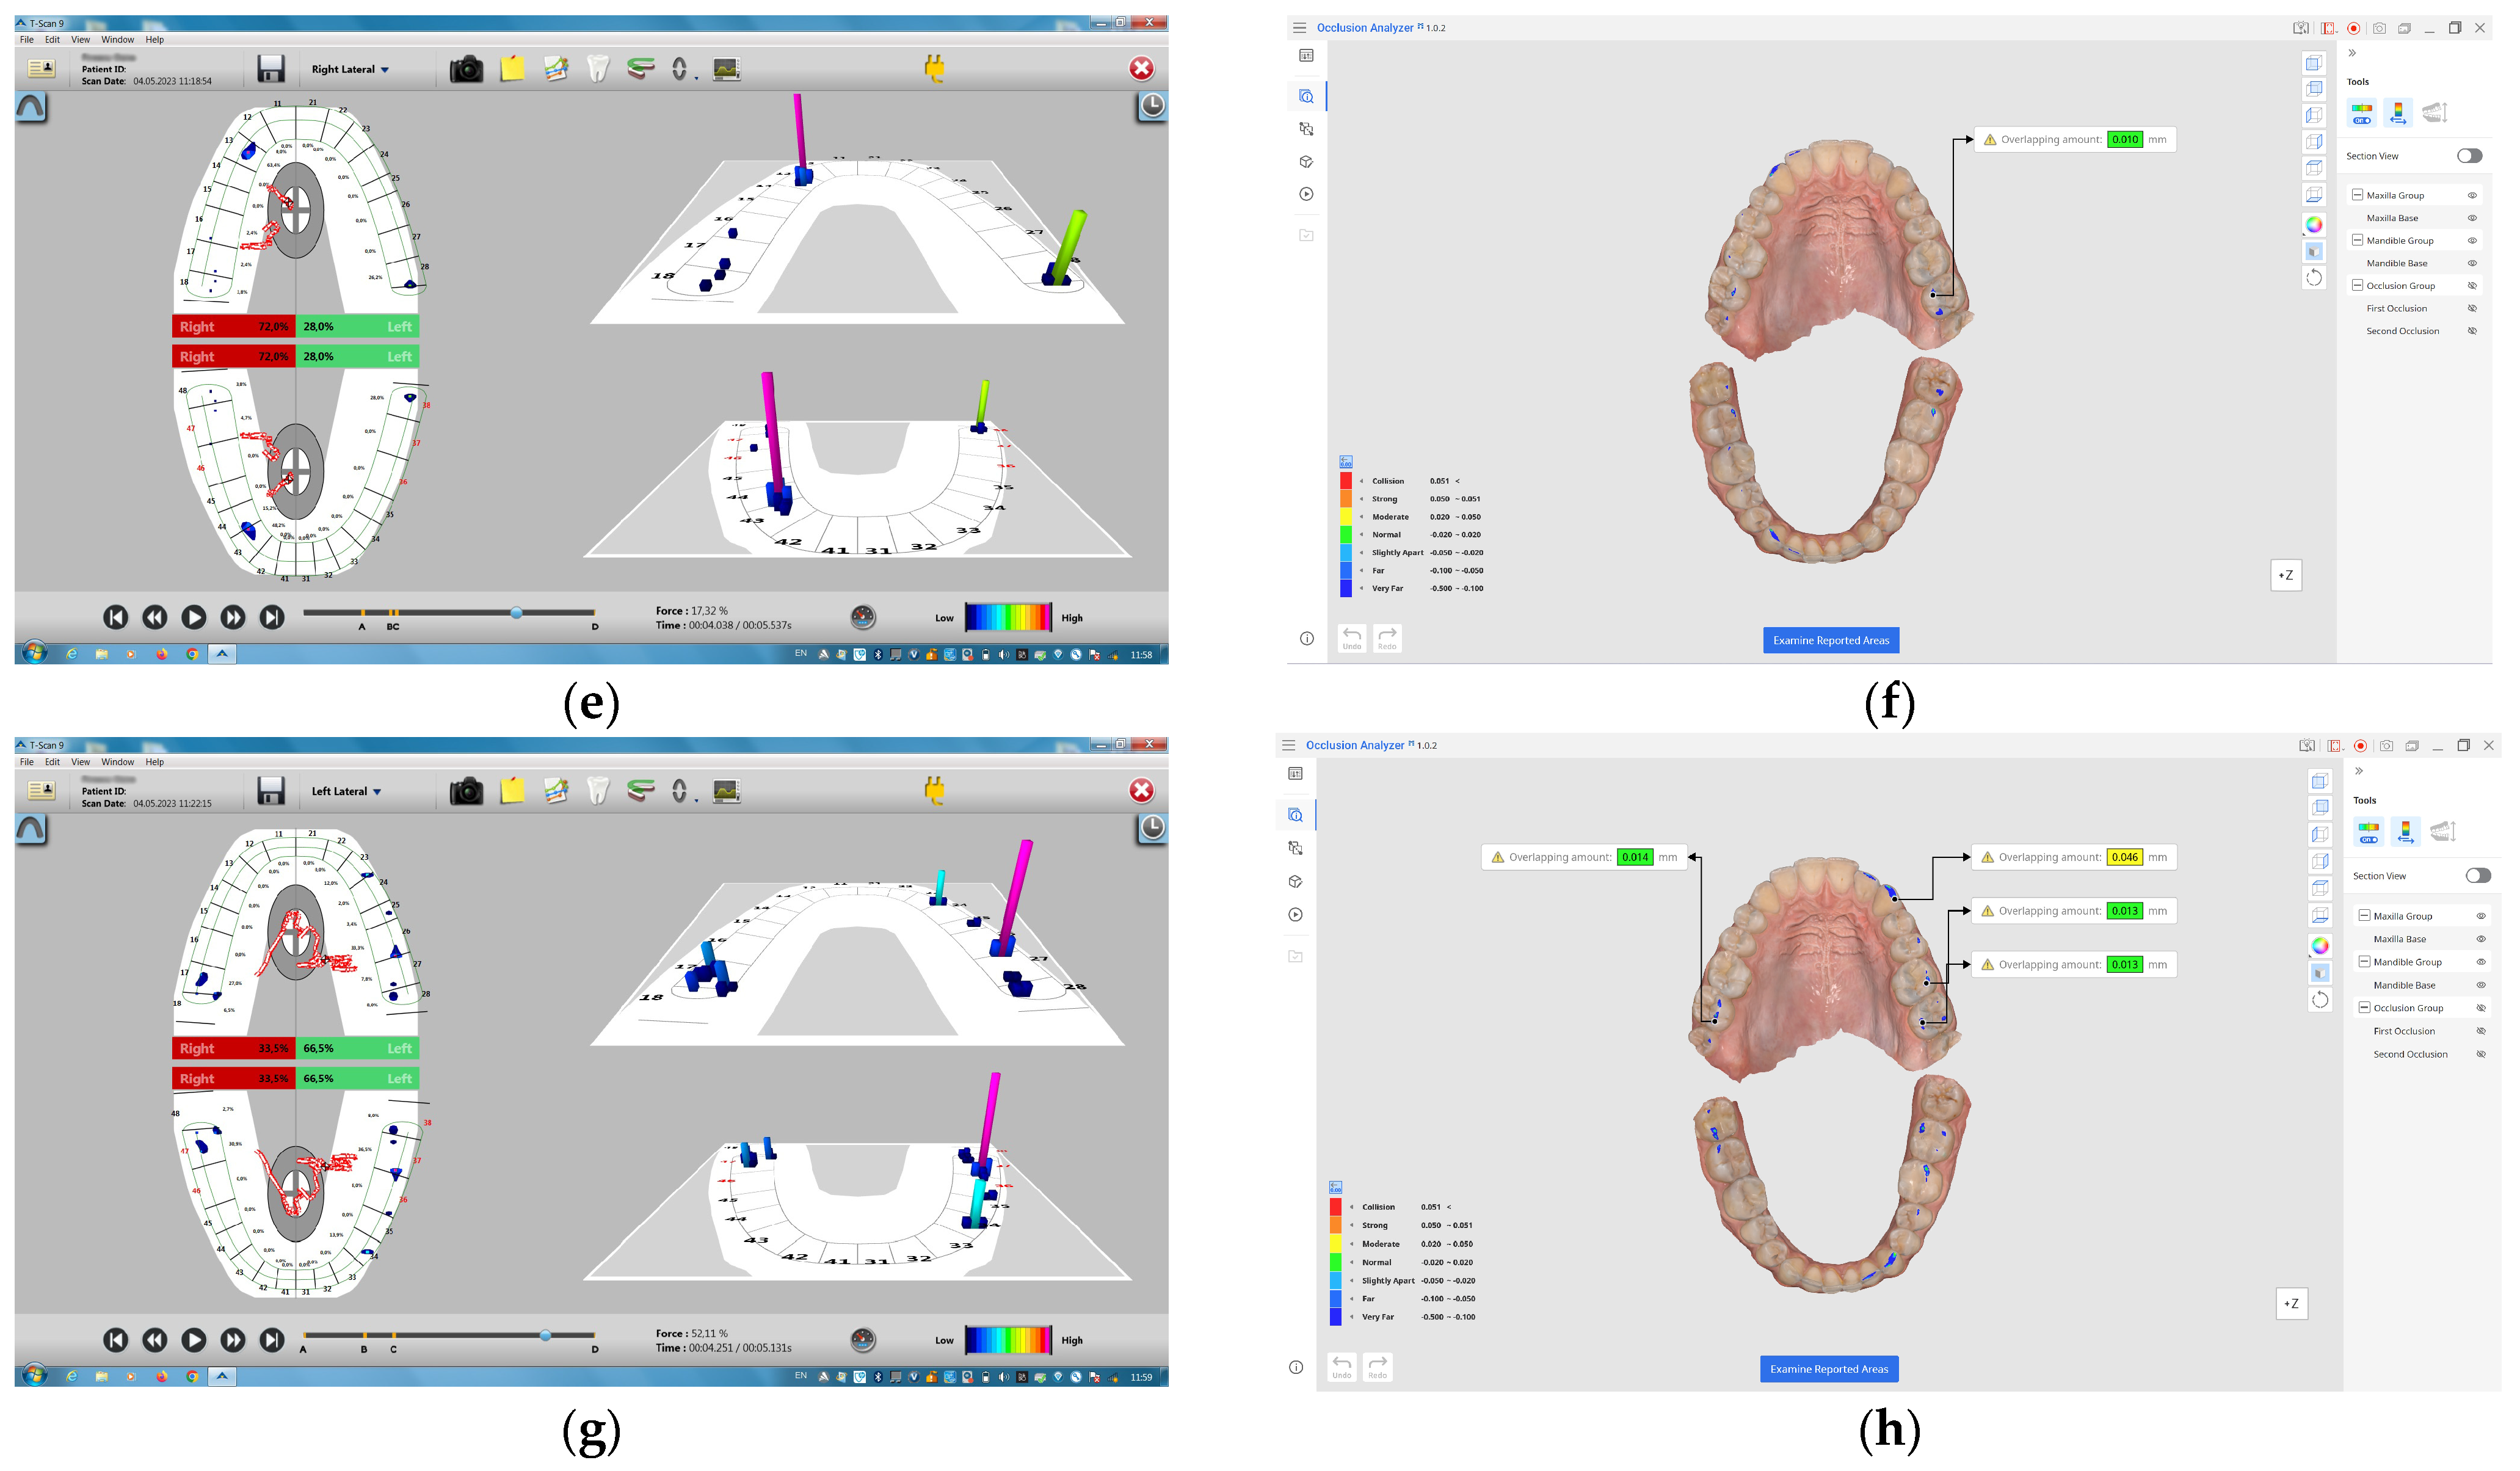
2.1. Recording Technique
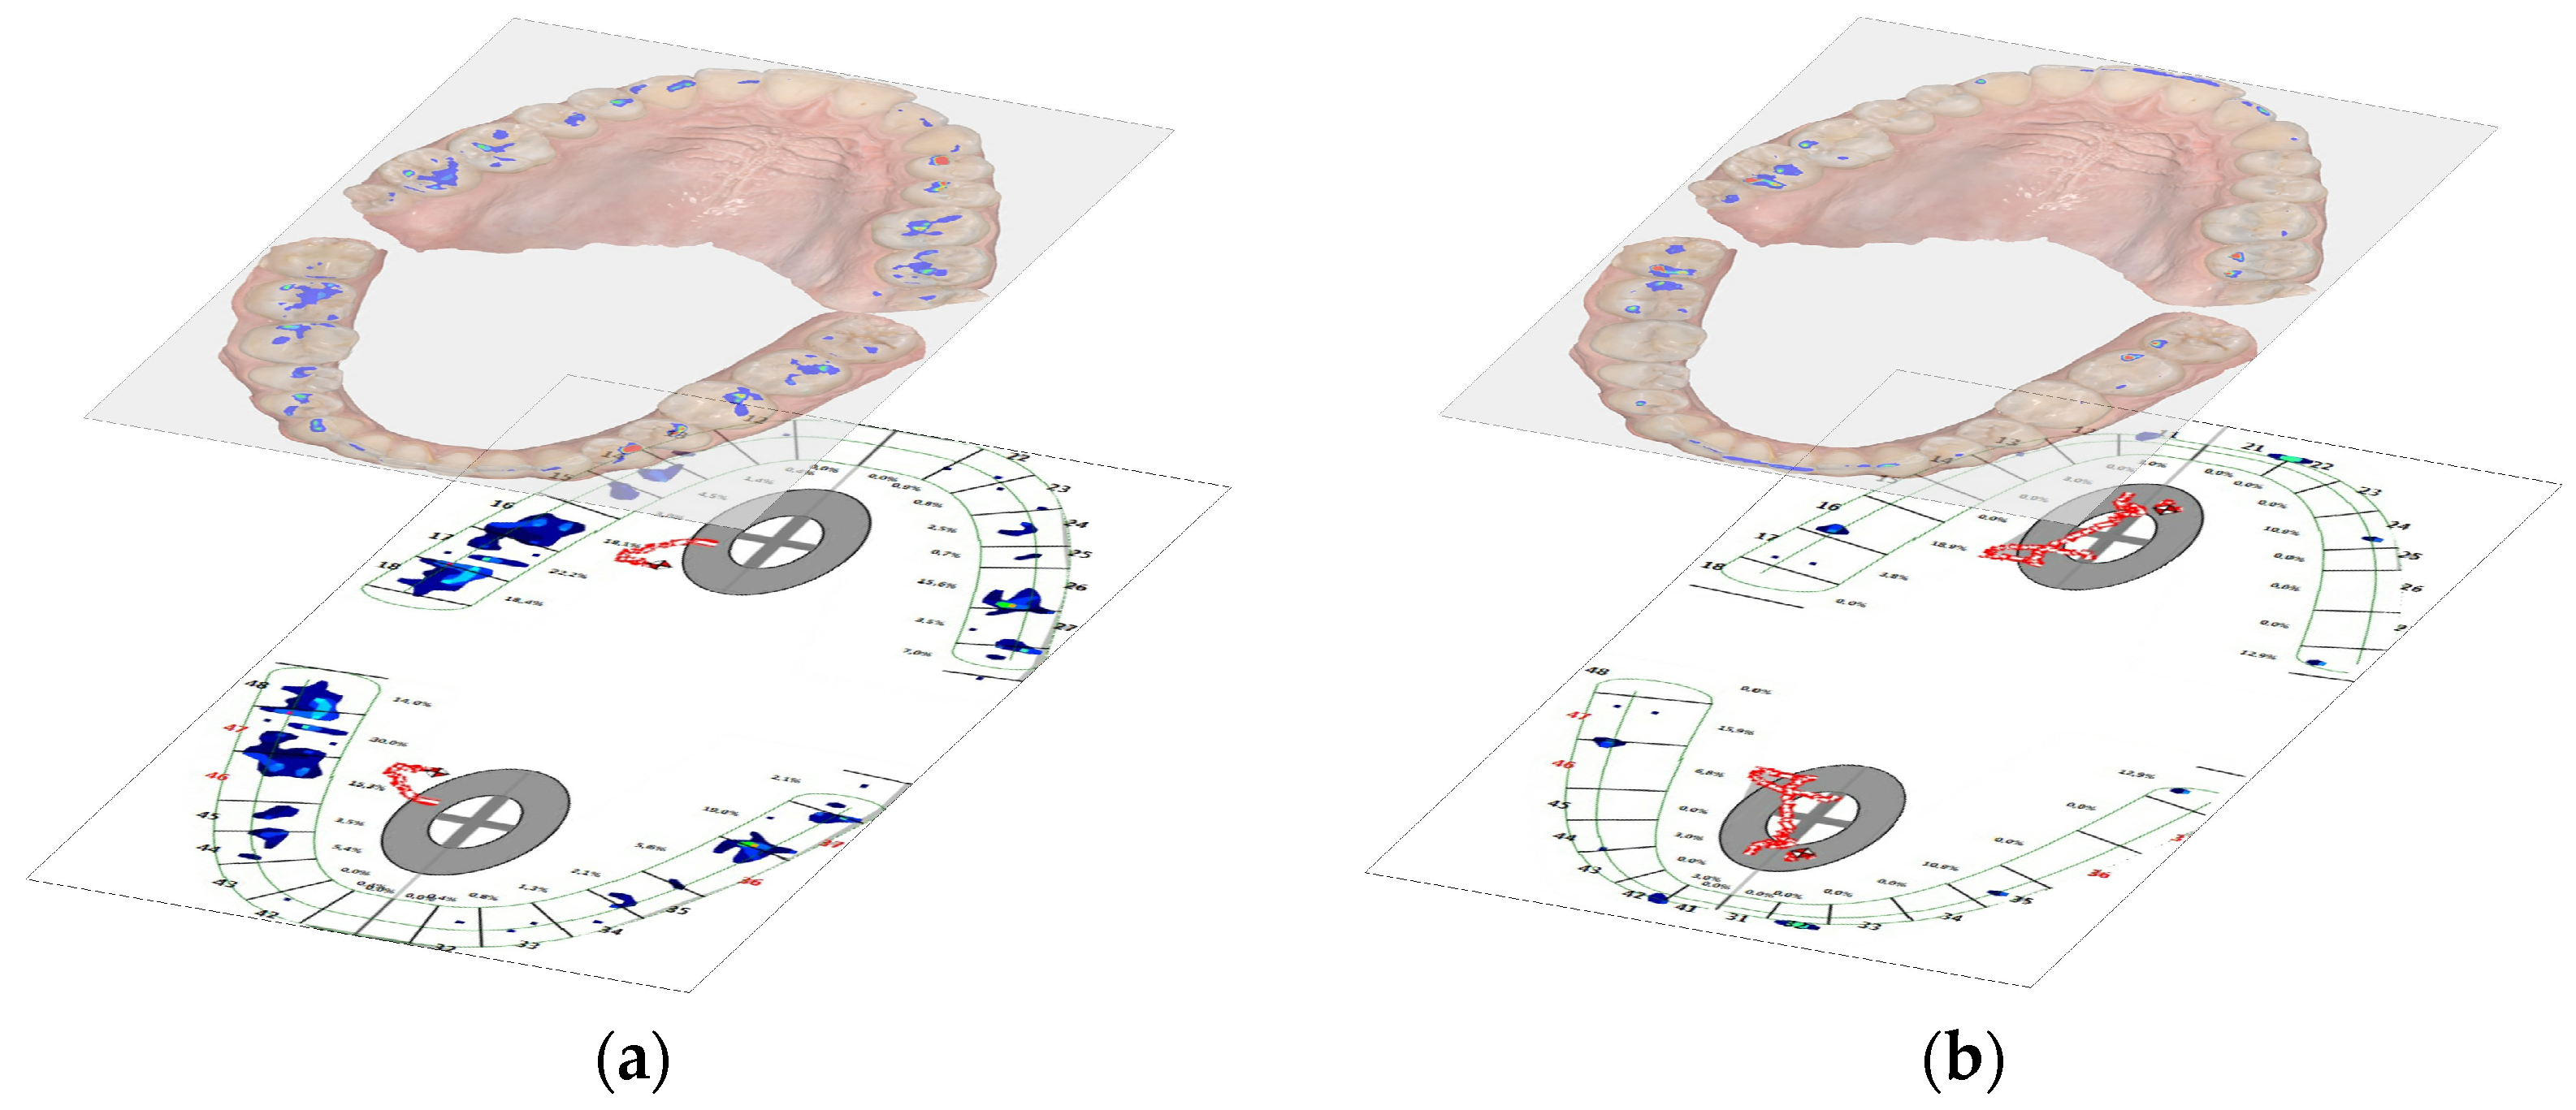
2.2. Scanning Technique
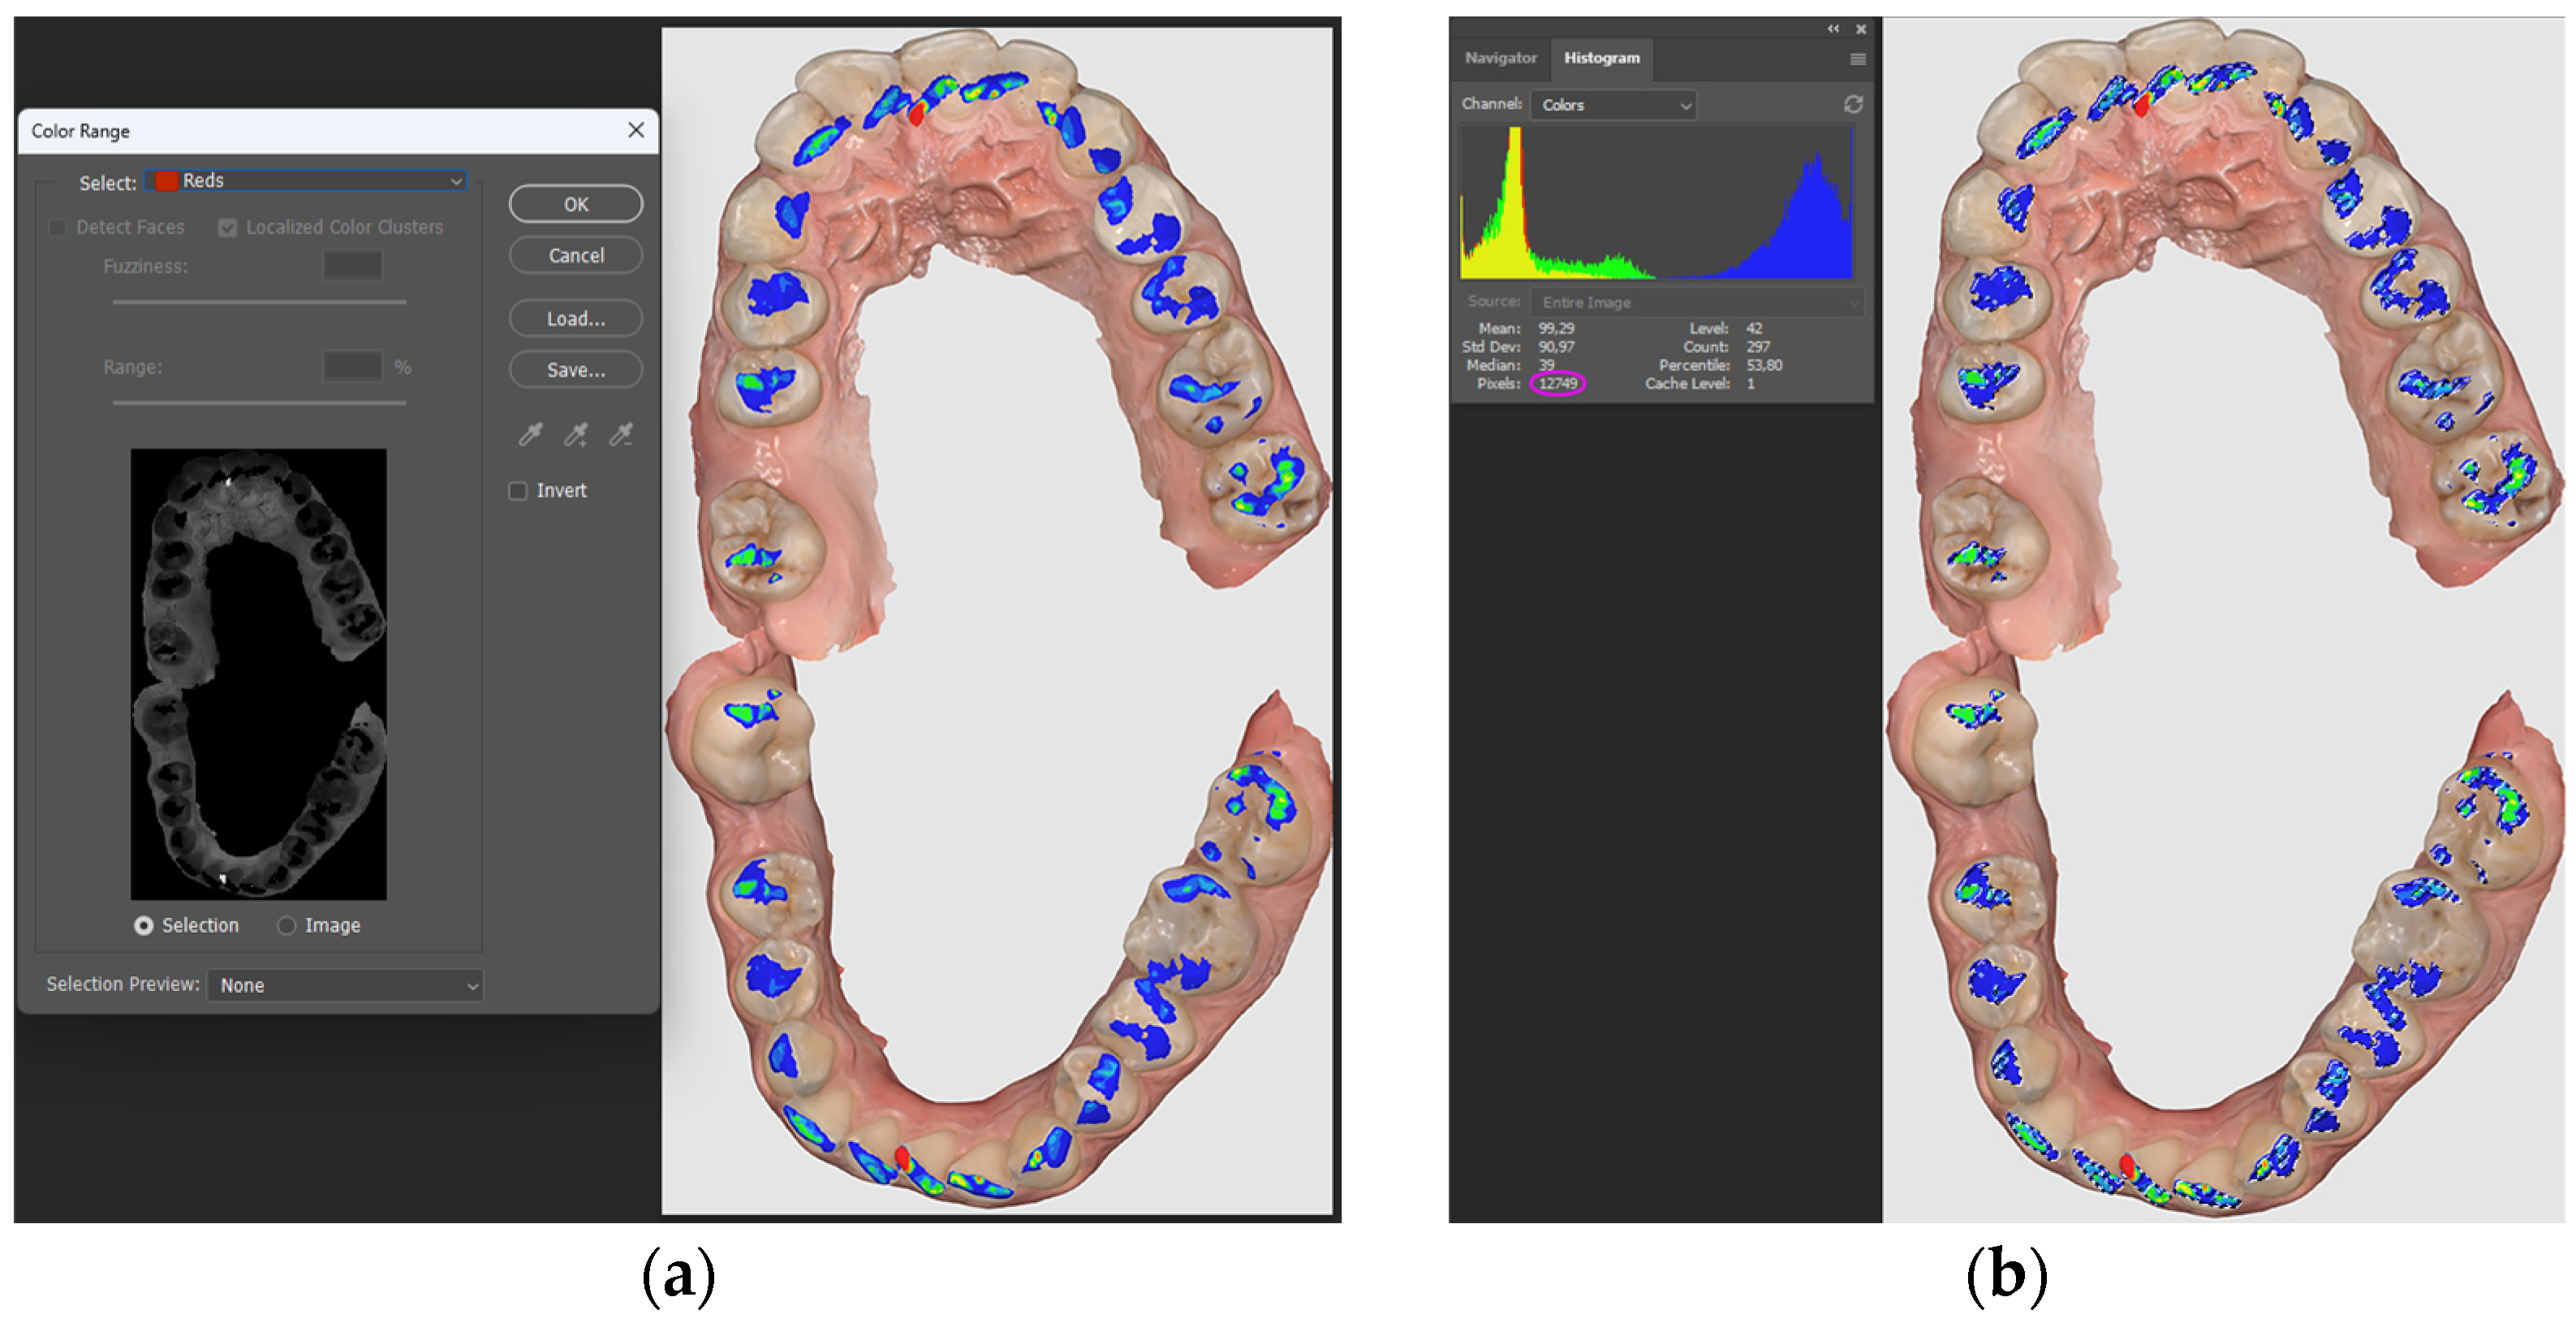
2.3. Image Processing Chain
2.4. Statistical Analysis
3. Results
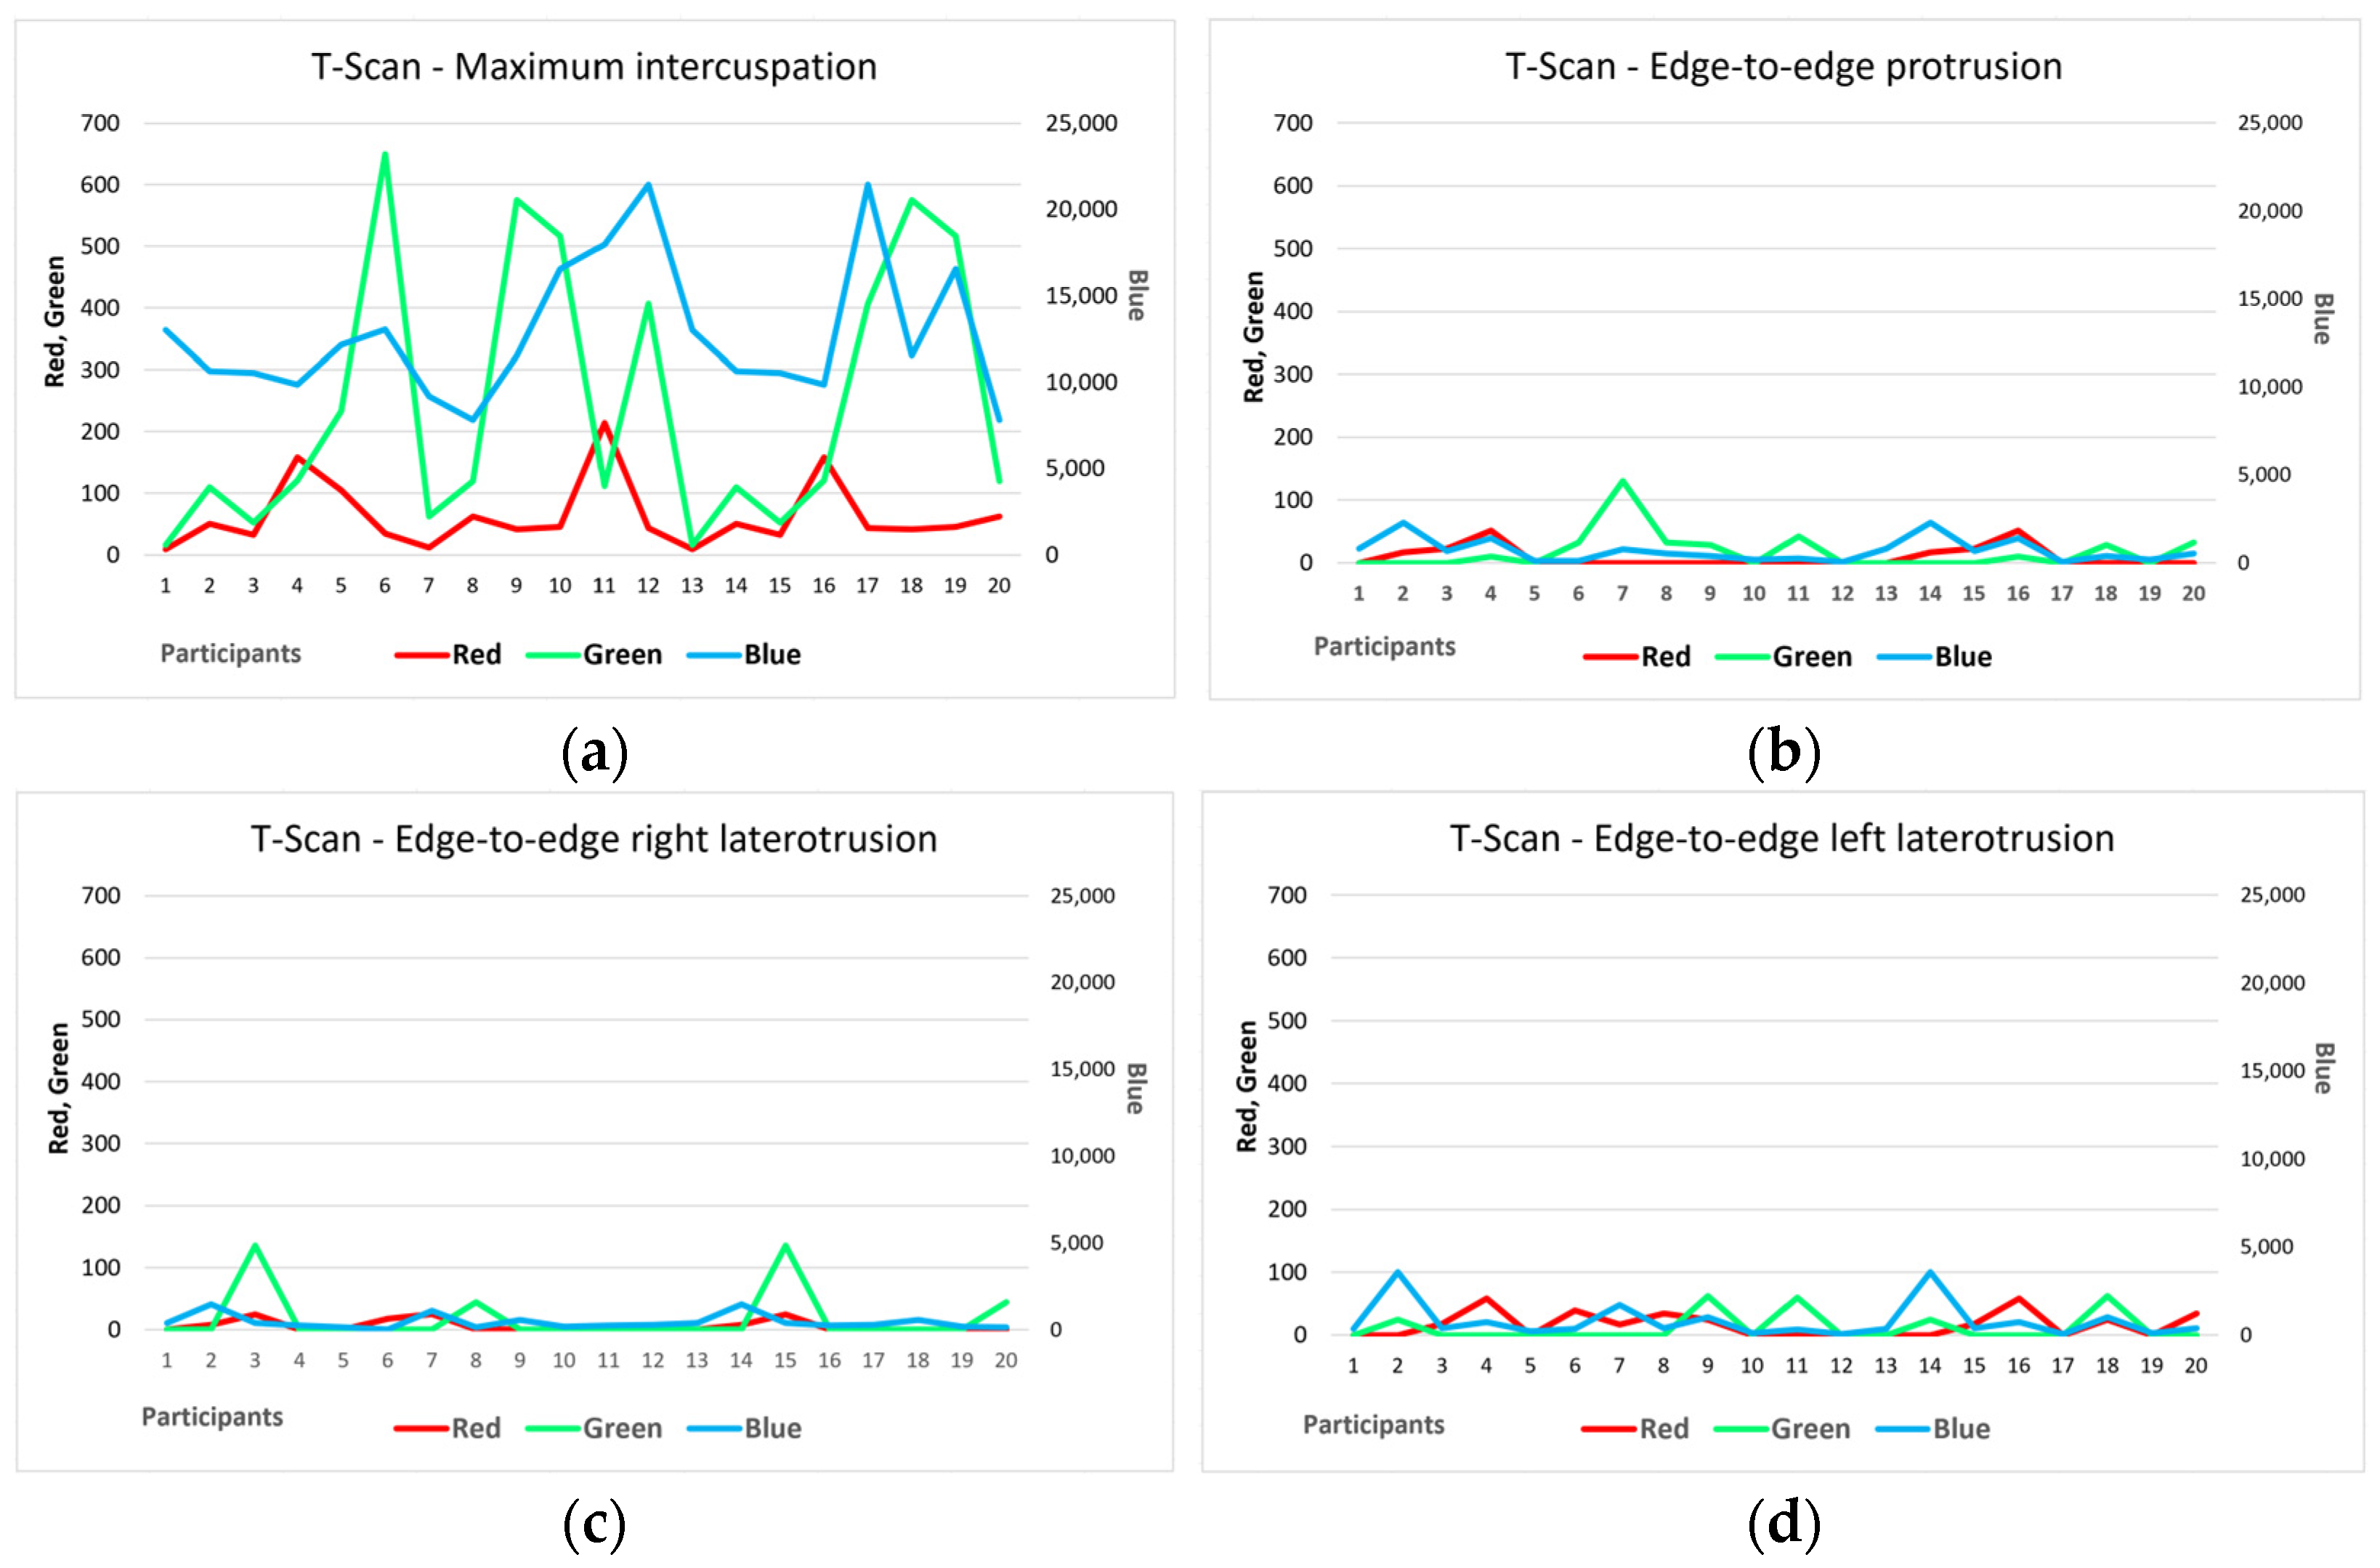
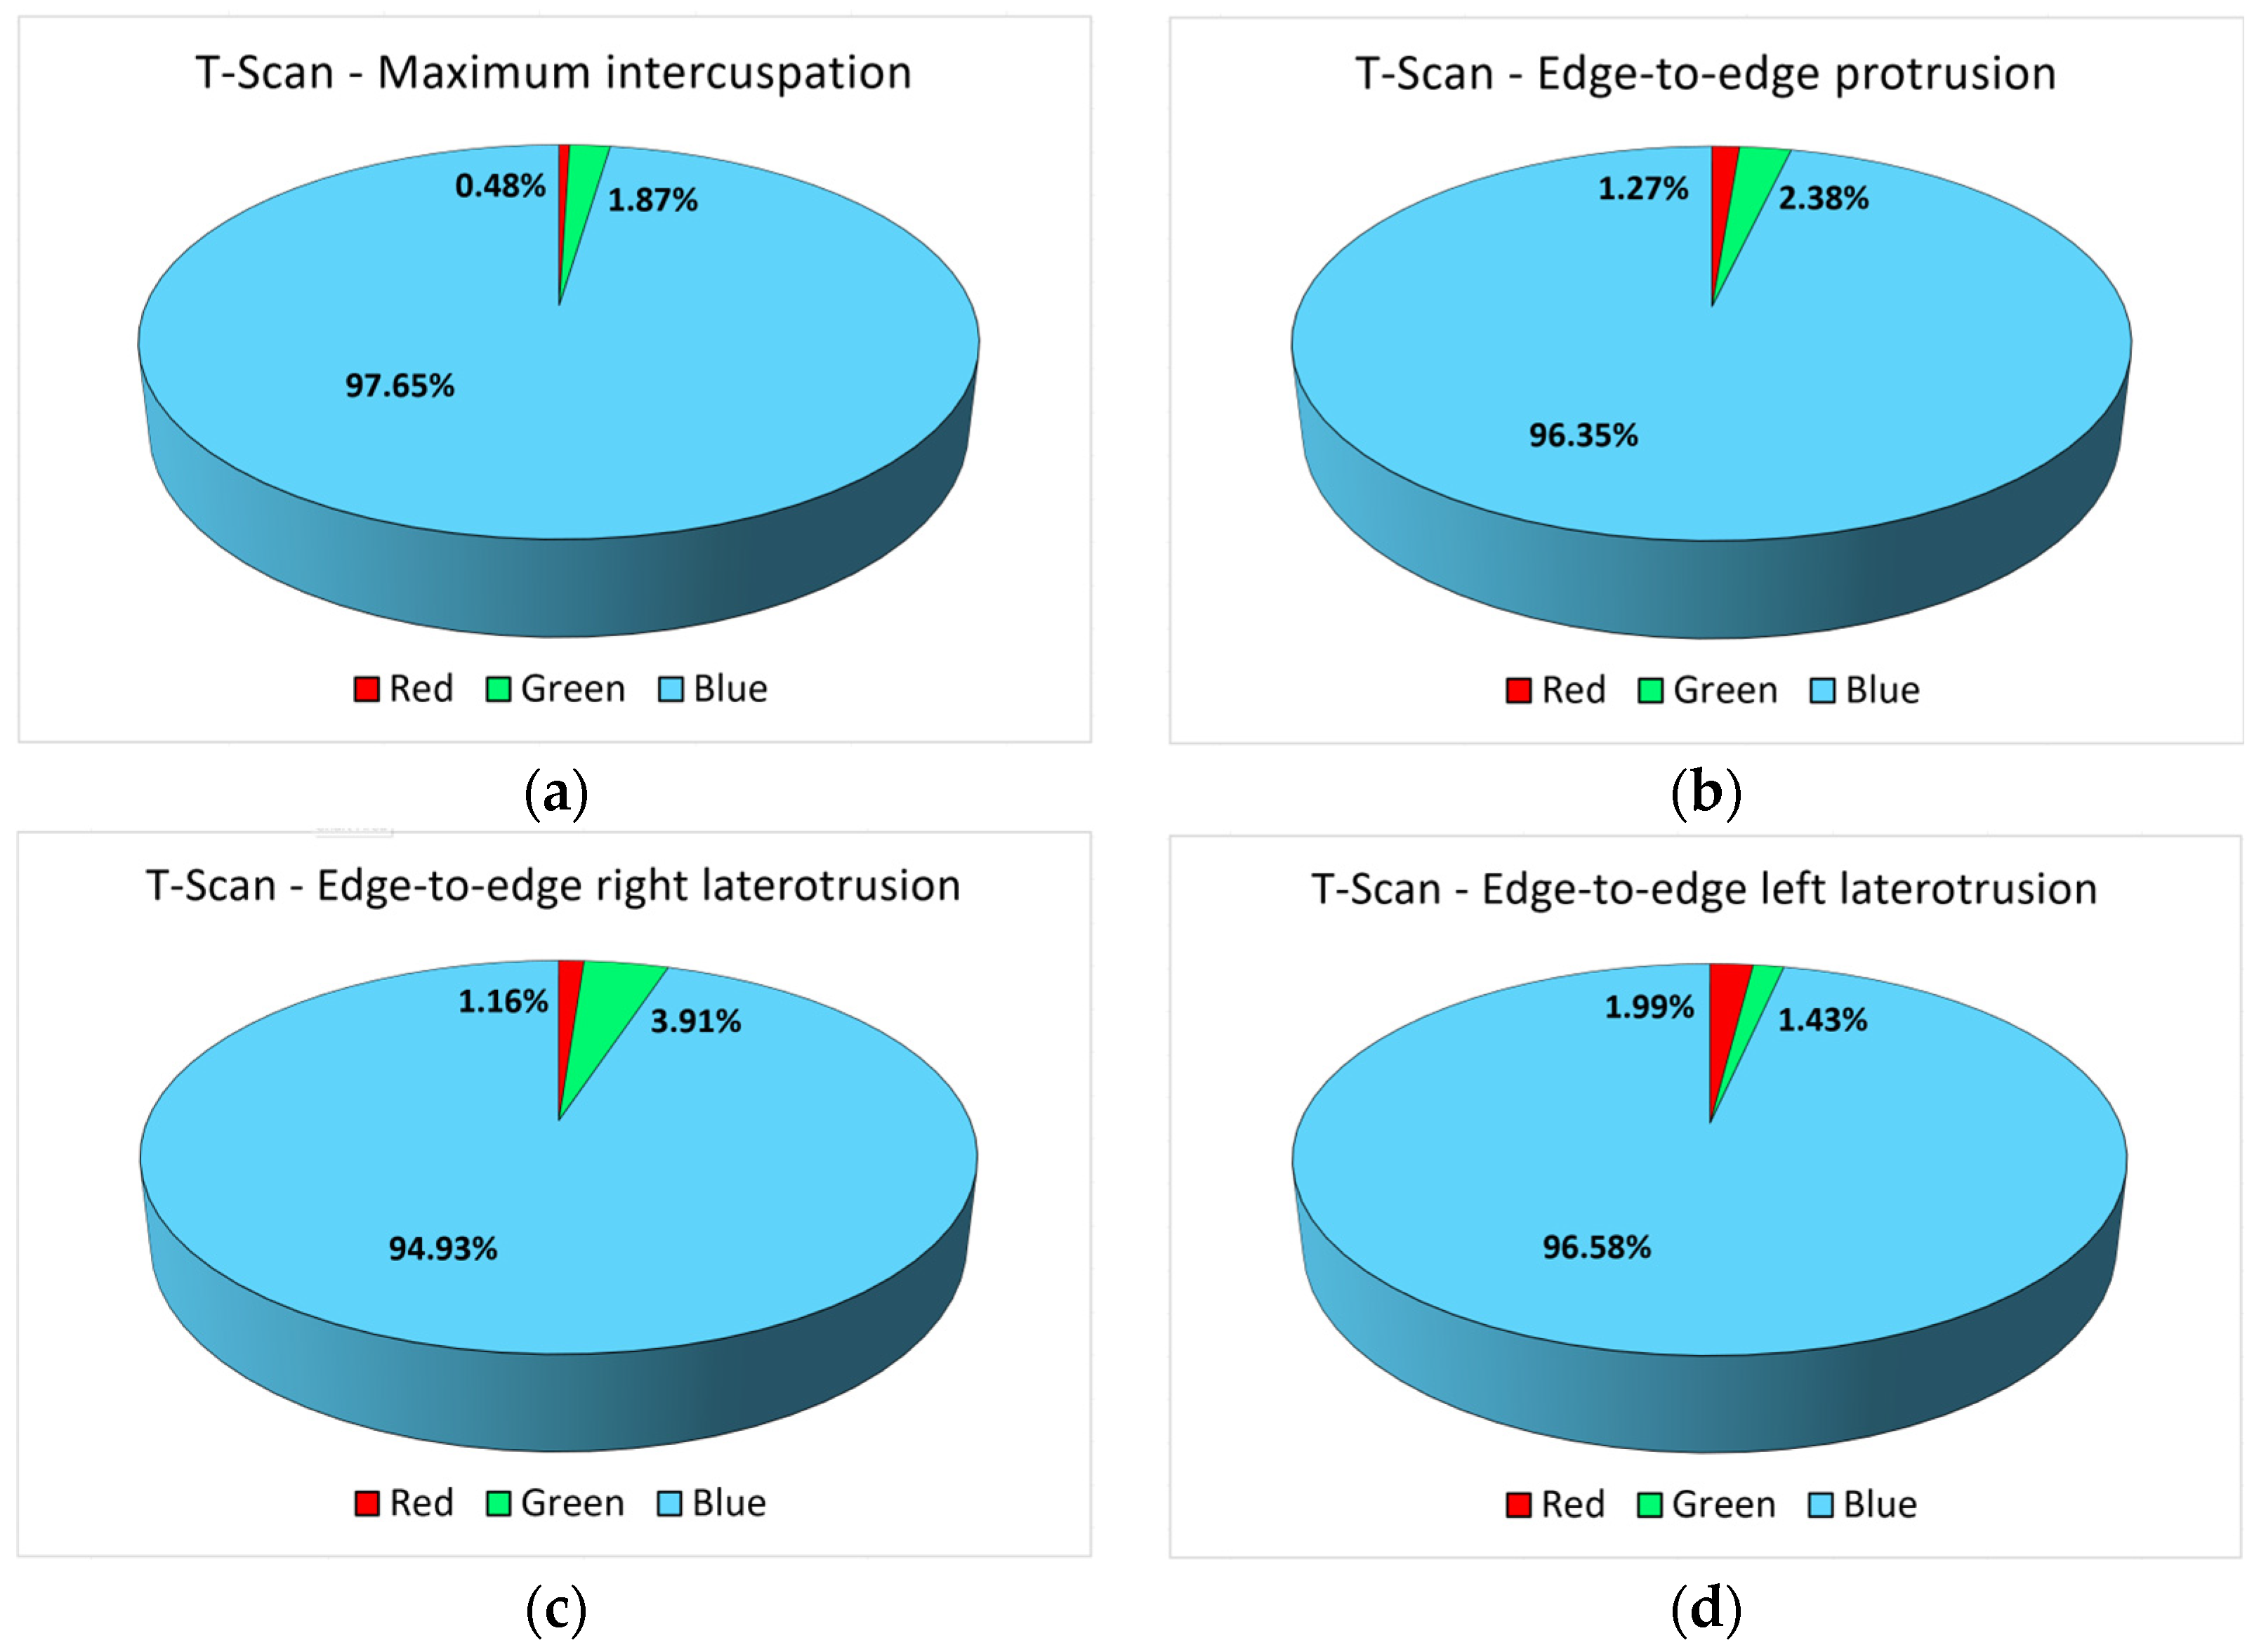
3.1. Analysis of the Results Obtained with the T-Scan III System
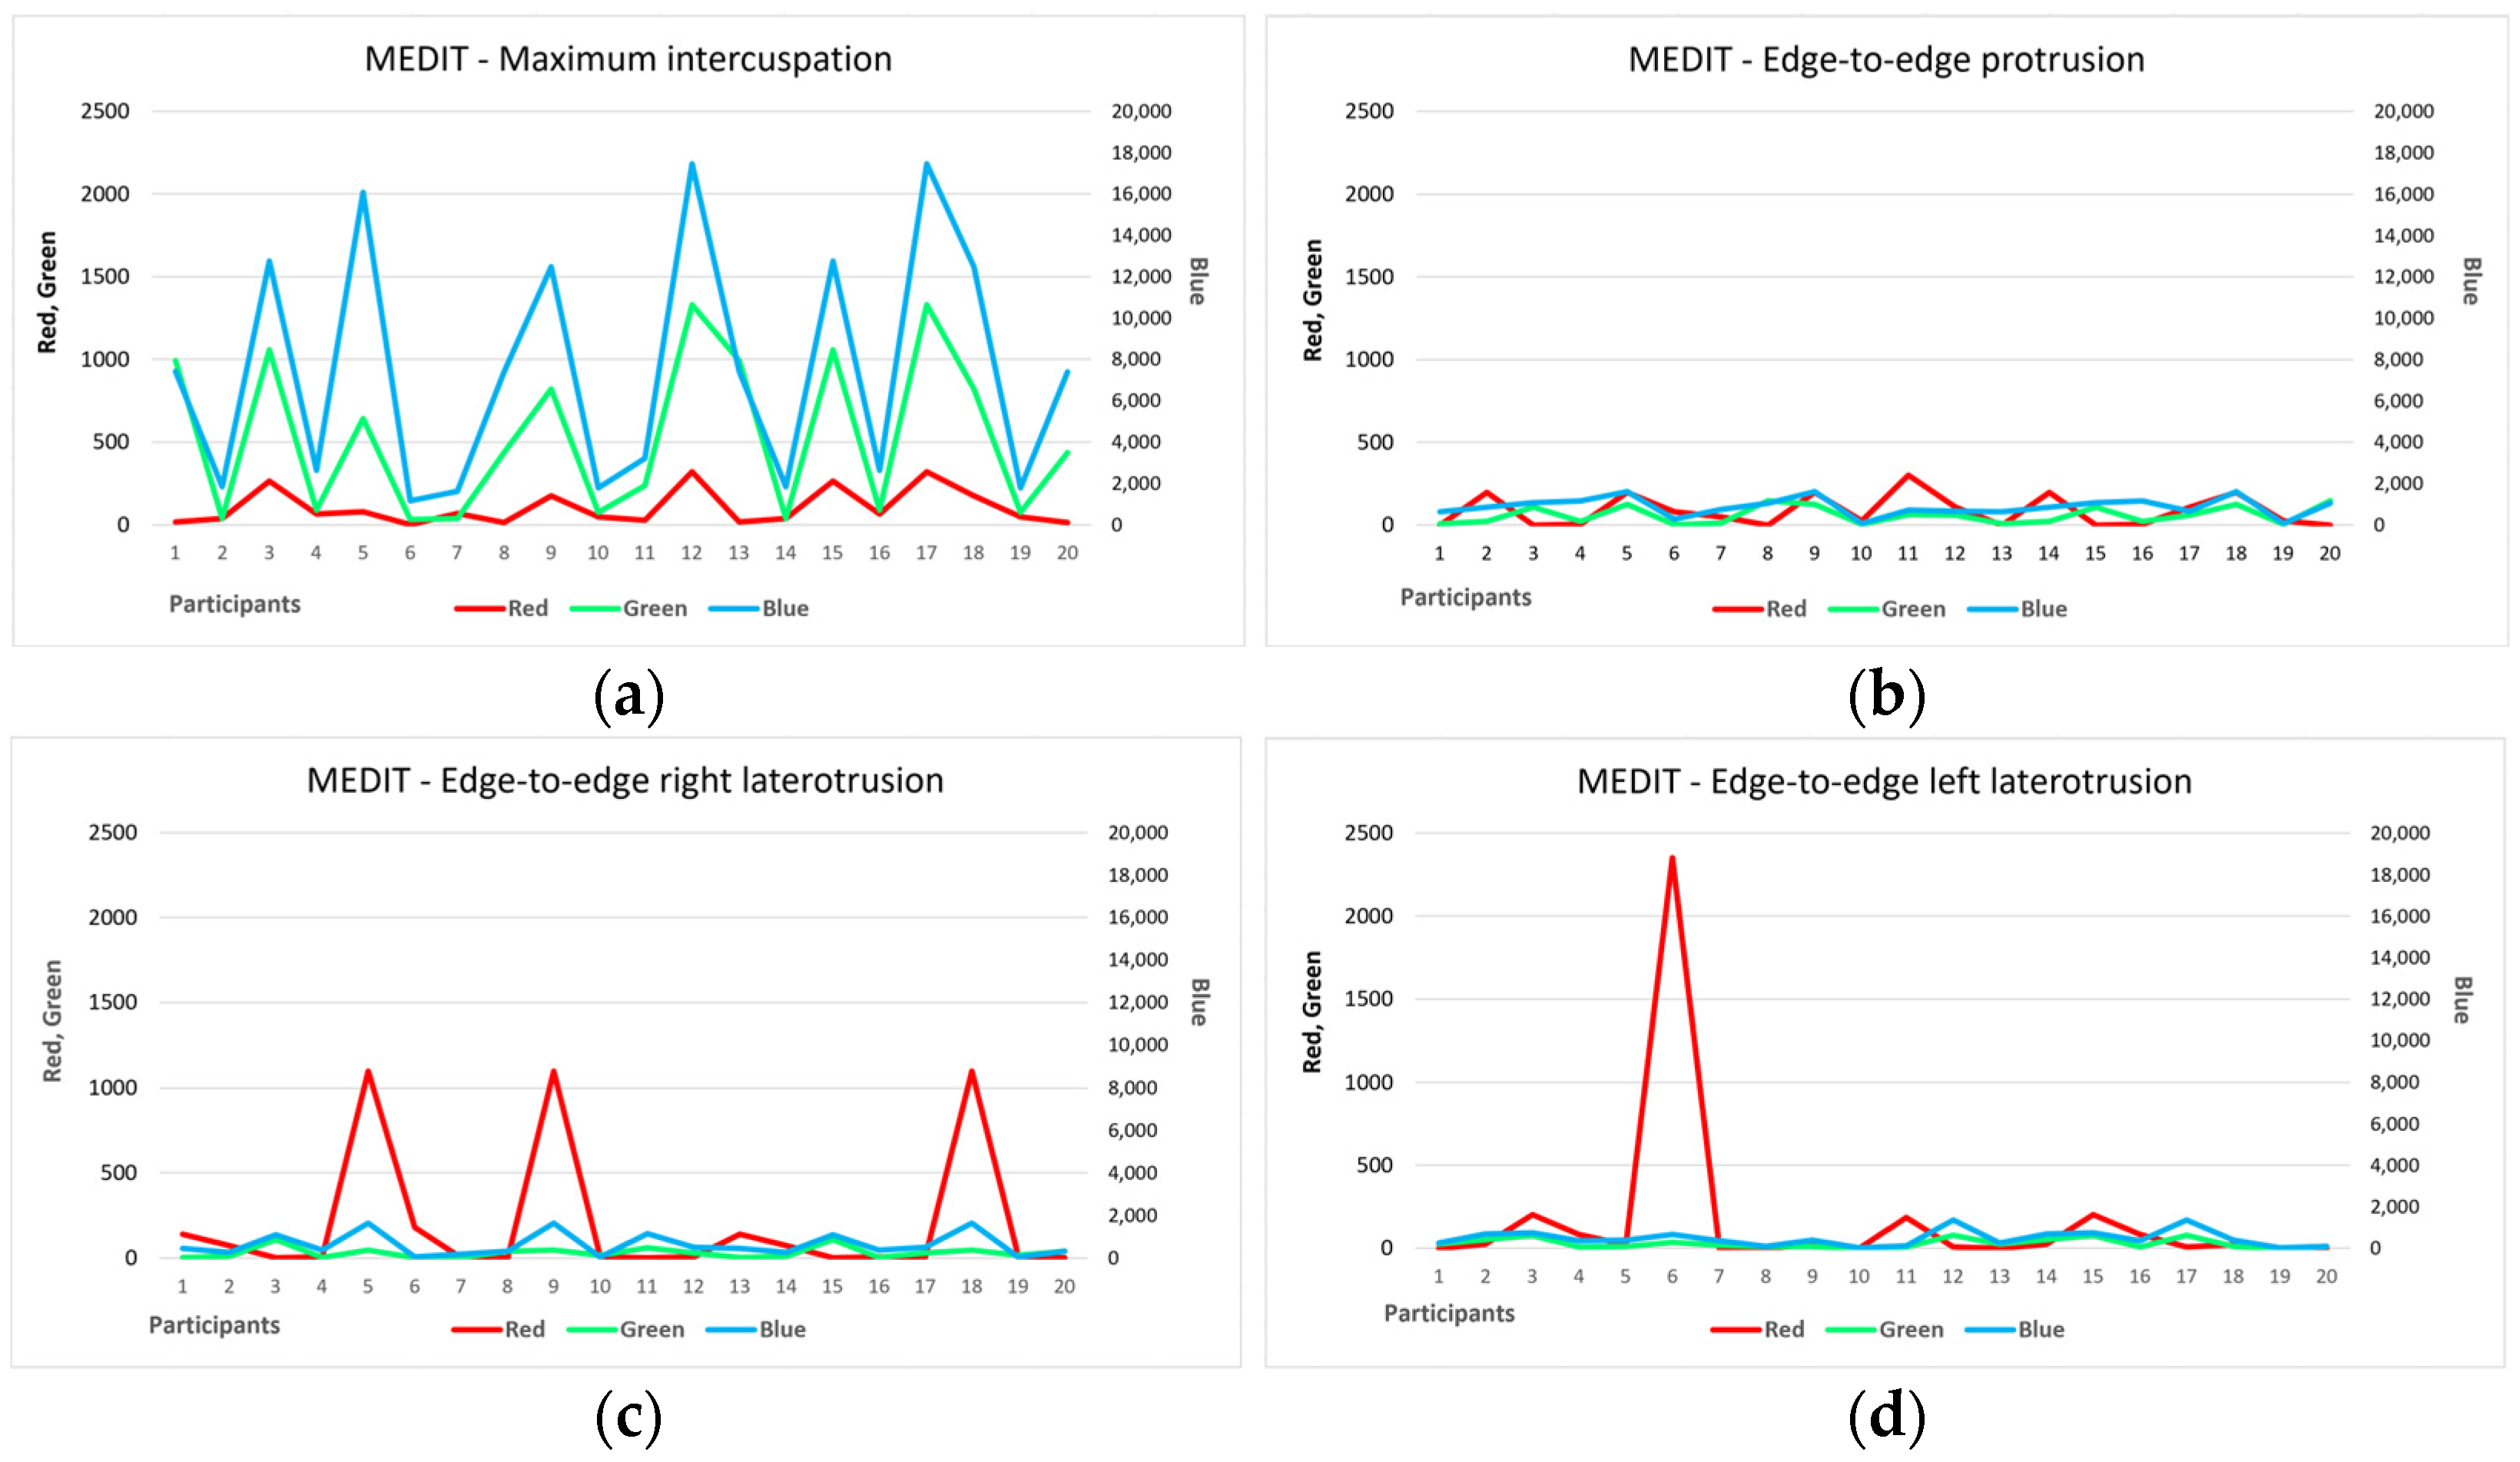
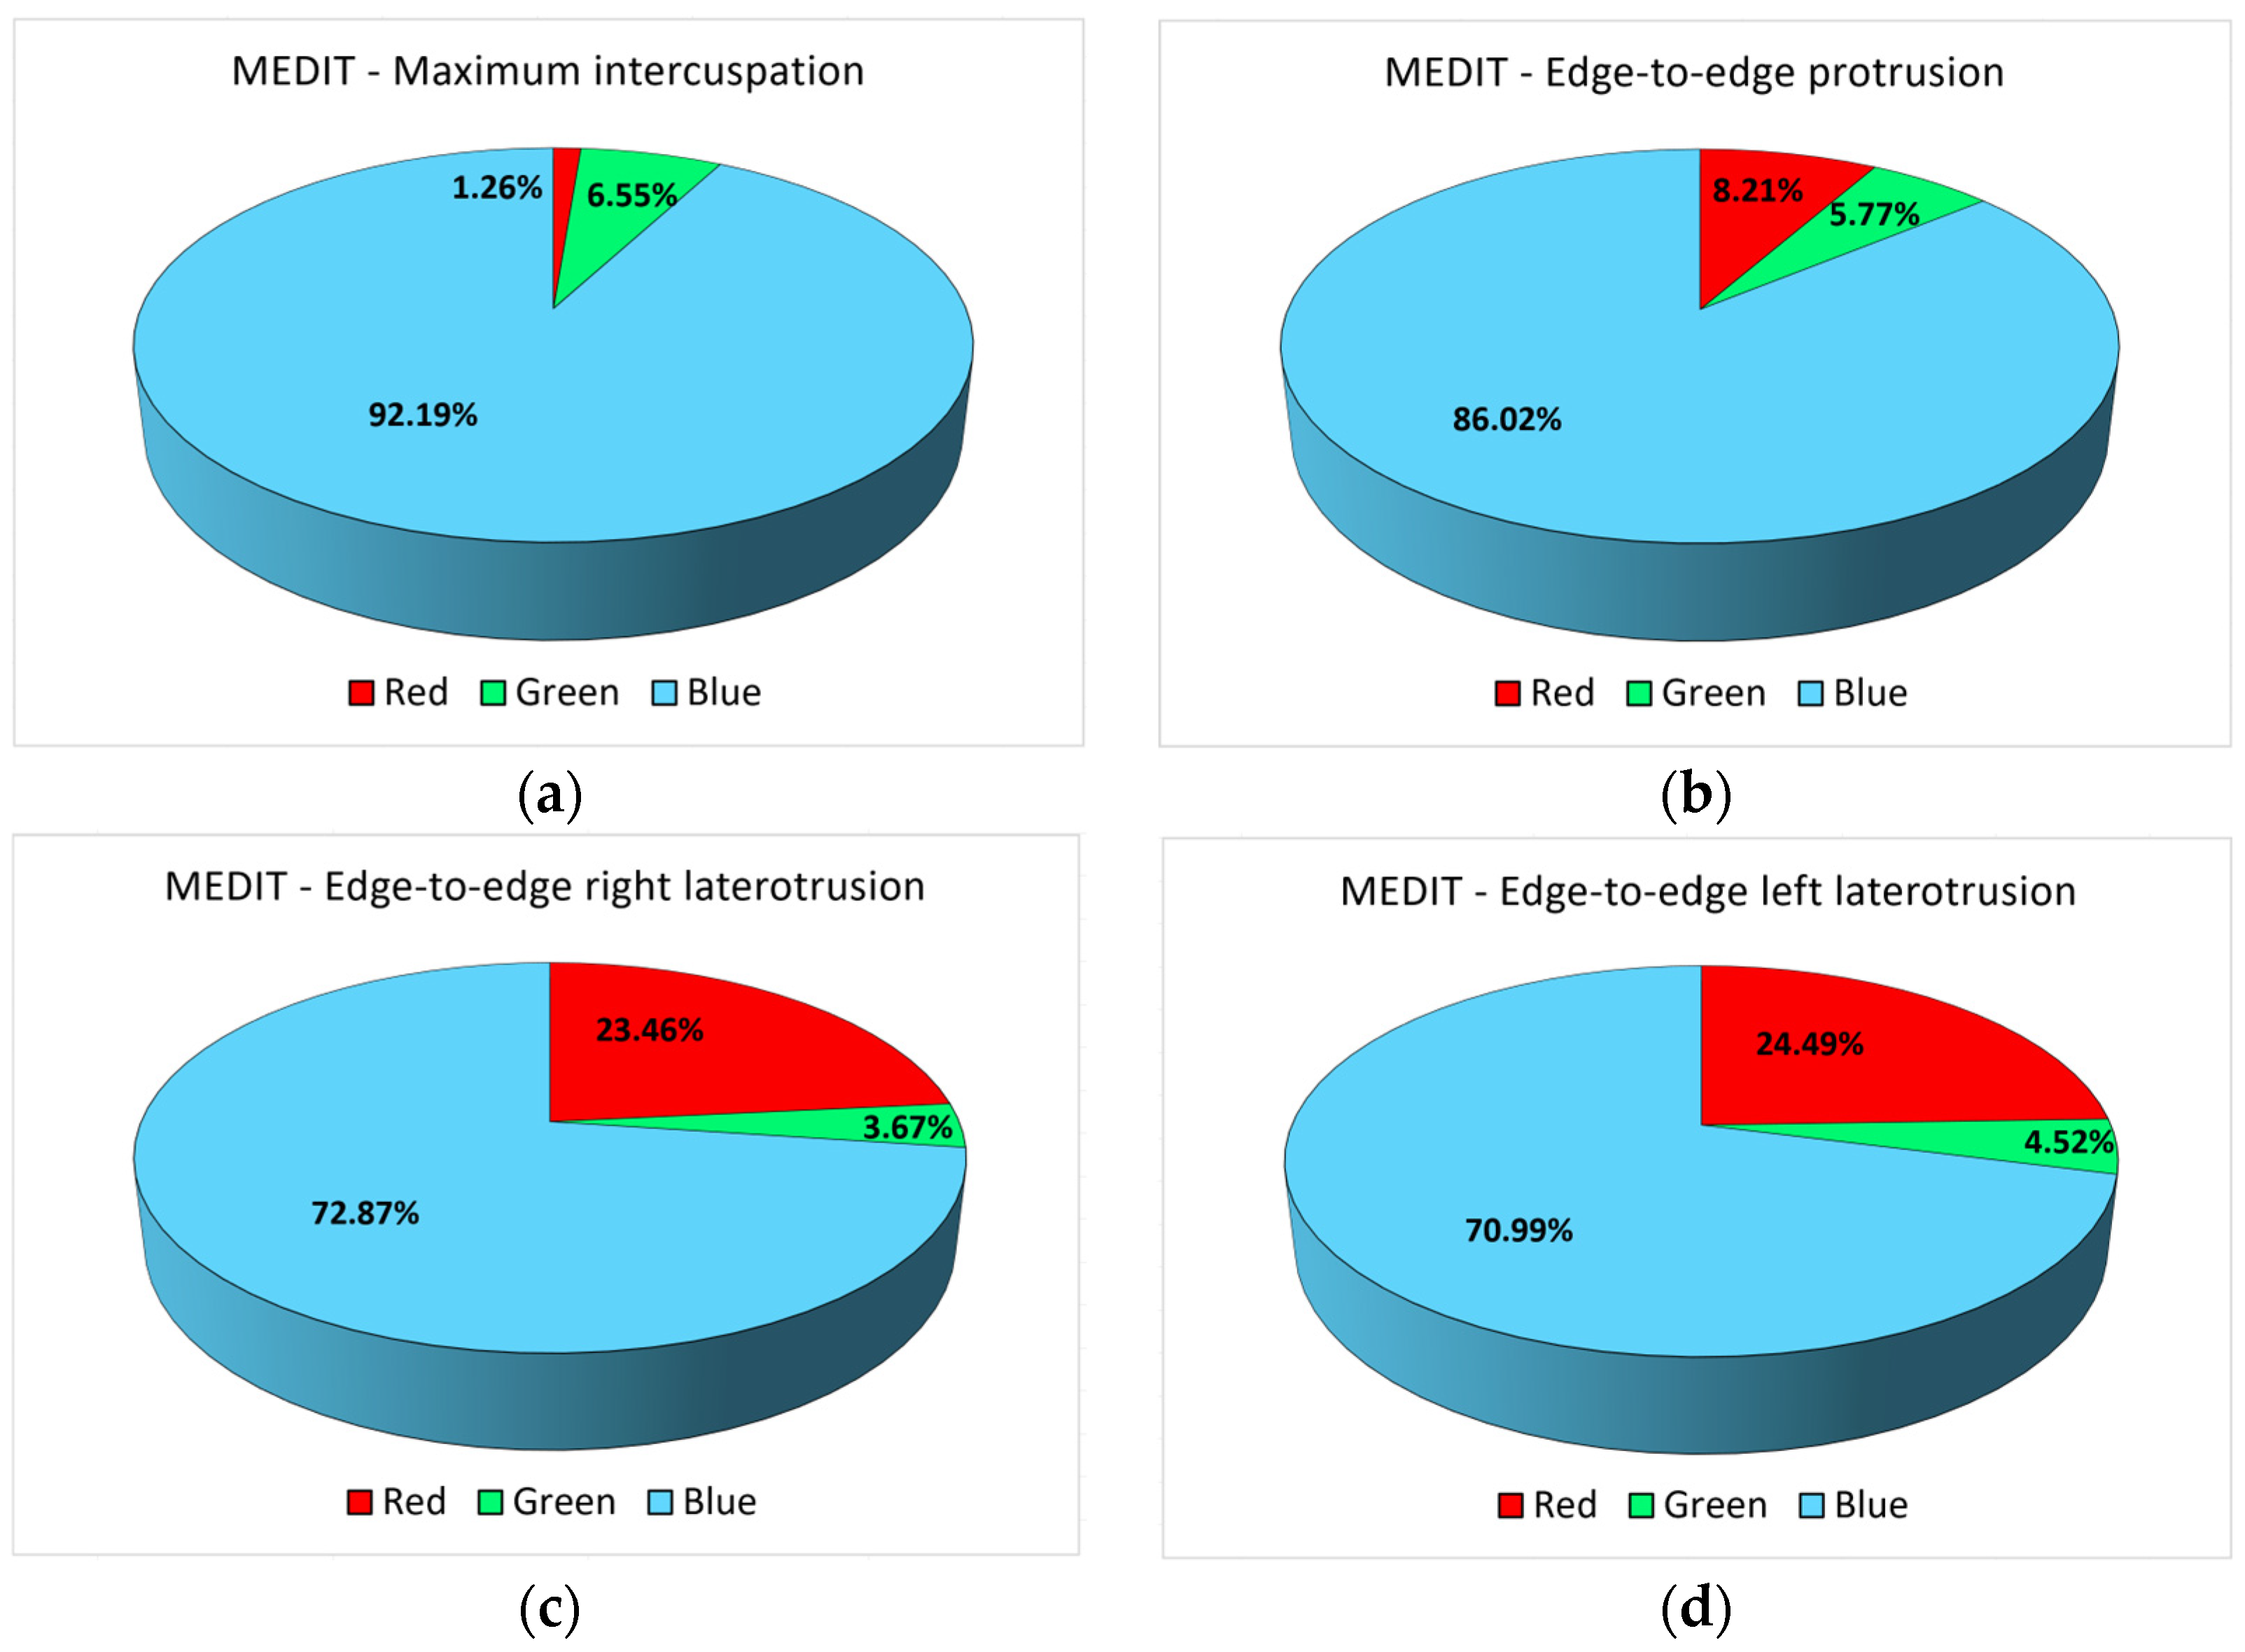
3.2. Analysis of the Results Obtained with the Medit I600 Intraoral Scanner
4. Discussion
5. Conclusions
Author Contributions
Funding
Institutional Review Board Statement
Informed Consent Statement
Data Availability Statement
Conflicts of Interest
References
- Wiens, J.P.; Priebe, J.W. Occlusal stability. Dent. Clin. N. Am. 2014, 58, 19–43. [Google Scholar] [CrossRef] [PubMed]
- Zhao, Z.; Wang, Q.; Li, J.; Zhou, M.; Tang, K.; Chen, J.; Wang, F. Construction of a novel digital method for quantitative analysis of occlusal contact and force. BMC Oral Health 2023, 23, 190. [Google Scholar] [CrossRef] [PubMed]
- Kordaß, B.; Amlang, A.; Hugger, A.; Behrendt, C.; Ruge, S. Number and localization of occlusal contact areas on natural posterior teeth without dental findings-evaluations of the regional baseline study (SHIP-1) with the Greifswald Digital Analyzing System (GEDAS). Int. J. Comput. Dent. 2022, 25, 47–56. [Google Scholar] [PubMed]
- Lee, H.S.; Ko, K.H.; Huh, Y.H.; Cho, L.R.; Park, C.J. Correlation between occlusal contact area at various levels of interocclusal thicknesses and masticatory performance. J. Oral Rehabil. 2022, 49, 522–528. [Google Scholar] [CrossRef]
- Skármeta, N.P. Occlusal stability and mandibular stability: The major part of dentistry we are still neglecting. Cranio 2017, 35, 201–203. [Google Scholar] [CrossRef] [PubMed]
- Christensen, G. Is occlusion becoming more confusing? A plea for simplicity. J. Am. Dent. Assoc. 2004, 135, 767–768. [Google Scholar] [CrossRef] [PubMed]
- Christensen, G.J. The major part of dentistry you may be neglecting. J. Am. Dent. Assoc. 2005, 136, 497–499. [Google Scholar] [CrossRef] [PubMed]
- Gu, D.A.; Miao, L.Y.; Liu, C. Application of Digital Occlusion Analysis System in Stomatological Clinical Medicine. Austin J. Dent. 2022, 9, 1164. [Google Scholar]
- Stoica, E.T.; Marcauteanu, C.; Tudor, A.; Duma, V.-F.; Amaricai, E.C.; Onofrei, R.; Suciu, O.; Negrutiu, M.L.; Sinescu, C. Influence of the text neck posture on the static dental occlusion. Medicina 2022, 58, 1303. [Google Scholar] [CrossRef] [PubMed]
- Hiroshi, S.; Marie, K.; Hanako, U.; Mako, S.; Masaoki, Y.; Kunihisa, N.; Ayano, I. Comparison of two dental prescale systems used for the measurement of occlusal force. Odontology 2020, 108, 676–680. [Google Scholar]
- Okada, Y.; Sato, Y.; Kitagawa, N.; Uchida, K.; Osawa, T.; Imamura, Y.; Terazawa, M. Occlusal status of implant superstructures at mandibular first molar immediately after setting. Int. J. Implant. Dent. 2015, 1, 16. [Google Scholar] [CrossRef] [PubMed]
- Bostancıoğlu, S.E.; Toğay, A.; Tamam, E. Comparison of two different digital occlusal analysis methods. Clin. Oral Investig. 2022, 26, 2095–2109. [Google Scholar] [CrossRef] [PubMed]
- Saracoglu, A.; Ozpinar, B. In vivo and in vitro evaluation of occlusal indicator sensitivity. J. Prosthet. Dent. 2002, 88, 522–526. [Google Scholar] [CrossRef] [PubMed]
- Michelinakis, G.; Apostolakis, D.; Tsagarakis, A.; Kourakis, G.; Pavlakis, E. A comparison of accuracy of 3 intraoral scanners: A single-blinded in vitro study. J. Prosthet. Dent. 2020, 124, 581–588. [Google Scholar] [CrossRef] [PubMed]
- Rajshekar, M.; Julian, R.D.; Williams, A.M.M.; Tennant, M.L.; Forrest, A.S.; Walsh, L.J.; Wilson, G.J.; Blizzard, L. The reliability and validity of measurements of human dental casts made by an intra-oral 3D scanner, with conventional hand-held digital callipers as the comparison measure. Forensic Sci. Int. 2017, 278, 198–204. [Google Scholar] [CrossRef] [PubMed]
- Hennen, M.V.; Blum, H.; Dammaschke, T. Accuracy and reproducibility of the visualization of occlusal contact points using analog articulating foil or digital intraoral scanners in vitro. Int. J. Comput. Dent. 2022, 25, 173–180. [Google Scholar] [PubMed]
- World Medical Association. World Medical Association Declaration of Helsinki: Ethical principles for medical research involving human subjects. JAMA 2013, 310, 2191–2194. [Google Scholar] [CrossRef] [PubMed]
- Agbaje, J.O.; Casteele, E.V.; Salem, A.S.; Anumendem, D.; Shaheen, E.; Sun, Y.; Politis, C. Assessment of occlusion with the T–Scan system in patients undergoing orthognathic surgery. Sci. Rep. 2017, 7, 5356. [Google Scholar] [CrossRef] [PubMed]
- Nalini, M.S.; Sinha, M. Role of T–Scan in Digital Occlusal Analysis—A Review. Int. J. Res. Rep. Dent. 2018, 1, 1–7. [Google Scholar]
- Idris, R.I.; Shoji, Y.; Lim, T.W. Occlusal force and occlusal contact reestablishment with resin-bonded fixed partial dental prostheses using the Dahl concept: A clinical study. J. Prosthet. Dent. 2022, 127, 737–743. [Google Scholar] [CrossRef] [PubMed]
- Wada, M.; Mameno, T.; Tsujioka, Y.; Yamashita, M.; Ikebe, K. Effective utilization of digital technology in complete denture fabrication. J. Oral Sci. 2022, 64, 172–174. [Google Scholar] [CrossRef] [PubMed]
- Wiechens, B.; Quast, A.; Klenke, D.; Brockmeyer, P.; Schliephake, H.; Meyer-Marcotty, P. Evaluation of occlusal function during orthognathic therapy: A prospective clinical trial using a digital registration method. J. Orofac. Orthop. 2022, 84, 267–277. [Google Scholar] [CrossRef] [PubMed]
- Kang, Y.F.; Ding, M.K.; Qiu, S.Y.; Cai, Z.G.; Zhang, L.; Shan, X.F. Mandibular reconstruction using iliac flap based on occlusion-driven workflow transferred by digital surgical guides. J. Oral Maxillofac. Surg. 2022, 80, 1858–1865. [Google Scholar] [CrossRef] [PubMed]
- Okeson, J.P. Management of Temporomandibular Disorders and Occlusion, 8th ed.; Elsevier Mosby: St. Louis, MO, USA, 2020. [Google Scholar]
- Devi, S.; Nallaswamy, D.; Venugopalan, S. Prosthetic Occlusal Analyzers—A Comprehensive Review. Int. J. Dent. Oral Sci. 2021, 8, 3550–3554. [Google Scholar]
- Fraile, C.; Ferreiroa, A.; Romeo Rubio, M.; Alonso, R.; Pradíes Ramiro, G. Clinical study comparing the accuracy of interocclusal records, digitally obtained by three different devices. Clin. Oral Investig. 2022, 26, 4663–4668. [Google Scholar] [CrossRef] [PubMed]
- Tokumura, K.; Yamashita, A. Study on occlusal analysis by means of ‘T–Scan system’. 1. Its accuracy for measurement. Nihon Hotetsu Shika Gakkai Zasshi 1989, 33, 1037–1043. [Google Scholar] [CrossRef] [PubMed]
- Throckmorton, G.S.; Rasmussen, J.; Caloss, R. Calibration of T–Scan sensors for recording bite forces in denture patients. J. Oral Rehabil. 2009, 36, 636–643. [Google Scholar] [CrossRef] [PubMed]
- Kerstein, R.B.; Radke, J. In-vitro consistency testing of the T–Scan 10 relative force measurement system. Adv. Dent. Technol. Tech. 2022, 4, 47–58. [Google Scholar]
- Koos, B.; Godt, A.; Schille, C.; Göz, G. Precision of an instrumentation-based method of analyzing occlusion and its resulting distribution of forces in the dental arch. J. Orofac. Orthop. 2010, 71, 403–410. [Google Scholar] [CrossRef] [PubMed]
- Bozhkova, T.P. The T–SCAN System in Evaluating Occlusal Contacts. Folia Medica 2016, 58, 122–130. [Google Scholar] [CrossRef] [PubMed]
- Vlăduțu, D.E.; Ionescu, M.; Noveri, L.; Manolea, H.O.; Scrieciu, M.; Popescu, S.M.; Turcu, A.A.; Ştefârță, A.; Lăzărescu, G.; Mercuț, V. Aspects of Dental Occlusion Assessed with the T–Scan System among a Group of Romanian Dental Students in a Cross-Sectional Study. Int. J. Environ. Res. Public Health 2023, 20, 4877. [Google Scholar] [CrossRef] [PubMed]
- Buduru, S.; Mesaros, A.; Talmaceanu, D.; Baru, O.; Ghiurca, R.; Cosgarea, R. Occlusion in the digital era: A report on 3 cases. Med. Pharm. Rep. 2019, 92 (Suppl. S3), S78–S84. [Google Scholar] [CrossRef] [PubMed]
- Kerstein, R.B. The Evolution of the T–Scan I System from 1984, to the Present Day T–Scan 10 System. In Handbook of Research on Clinical Applications of Computerized Occlusal Analysis in Dental Medicine; Kerstein, R.B., Ed.; IGI Global: Hershey, PA, USA, 2019; pp. 1–54. [Google Scholar]
- Trpevska, V.; Kovacevska, G.; Benedeti, A.; Jordanov, B. T–Scan III system diagnostic tool for digital occlusal analysis in orthodontics—A modern approach. Prilozi 2014, 35, 155–160. [Google Scholar] [CrossRef] [PubMed]
- Nedelcu, R.; Olsson, P.; Nyström, I.; Rydén, J.; Thor, A. Accuracy and precision of 3 intraoral scanners and accuracy of conventional impressions: A novel in vivo analysis method. J. Dent. 2018, 69, 110–118. [Google Scholar] [CrossRef] [PubMed]
- Wesemann, C.; Muallah, J.; Mah, J.; Bumann, A. Accuracy and efficiency of full-arch digitalization and 3D printing: A comparison between desktop model scanners, an intraoral scanner, a CBCT model scan, and stereolithographic 3D printing. Quintessence Int. 2017, 48, 41–50. [Google Scholar]
- Kakali, L.; Halazonetis, D.J. A novel method for testing accuracy of bite registration using intraoral scanners. Korean J. Orthod. 2023, 53, 254–263. [Google Scholar] [CrossRef] [PubMed]
- Rutkūnas, V.; Dirsė, J.; Bilius, V. Accuracy of an intraoral digital scanner in tooth color determination. J. Prosthet. Dent. 2019, 123, 322–329. [Google Scholar] [CrossRef]
- Maruyama, T.; Nakamura, Y.; Hayashi, T.; Kato, K. Computer-aided determination of occlusal contact points for dental 3-D CAD. Med. Biol. Eng. Comput. 2006, 44, 445–450. [Google Scholar] [CrossRef]
- Mangano, F.; Gandolfi, A.; Luongo, G.; Logozzo, S. Intraoral scanners in dentistry: A review of the current literature. BMC Oral Health 2017, 17, 149. [Google Scholar] [CrossRef]
- Abduo, J.; Elseyoufi, M. Accuracy of intraoral scanners: A systematic review of influencing factors. Eur. J. Prosthodont. Restor. Dent. 2018, 26, 101–121. [Google Scholar] [PubMed]
- Moörmann, W.H. The evolution of the CEREC system. J. Am. Dent. Assoc. 2006, 137, 7S–13S. [Google Scholar] [CrossRef]
- Beuer, F.; Schweiger, J.; Edelhoff, D. Digital Dentistry: An Overview of Recent Developments for CAD/CAM Generated Restorations. Br. Dent. J. 2008, 204, 505–511. [Google Scholar] [CrossRef] [PubMed]
- Mörmann, W.H. The Origin of the Cerec Method: A Personal Review of the First 5 Years. Int. J. Comput. Dent. 2004, 7, 11–24. [Google Scholar] [PubMed]
- ElNaghy, R.; Amin, S.; Hasanin, M. Concepts and Clinical Applications of Intraoral 3D Scanning in the Management of Patients with Orofacial Clefts. In Recent Advances in the Treatment of Orofacial Clefts; IntechOpen: Rijeka, Croatia, 2021. [Google Scholar]
- Kravitz, N.D.; Groth, C.H.; Jones, P.E.; Graham, J.W.; Redmond, W.R. Intraoral digital scanners. J. Clin. Orthod. 2014, 48, 337–347. [Google Scholar] [PubMed]
- Persson, A.S.K.; Odén, A.; Andersson, M.; Sandborgh-Englund, G. Digitization of Simulated Clinical Dental Impressions: Virtual Three-Dimensional Analysis of Exactness. Dent. Mater. 2009, 25, 929–936. [Google Scholar] [CrossRef] [PubMed]
- Giuliodori, G.; Rappelli, G.; Aquilanti, L. Intraoral Scans of Full Dental Arches: An In Vitro Measurement Study of the Accuracy of Different Intraoral Scanners. Int. J. Environ. Res. Public Health 2023, 20, 4776. [Google Scholar] [CrossRef] [PubMed]
- Zarbakhsh, A.; Jalalian, E.; Samiei, N.; Mahgoli, M.H.; Ghane, H.K. Accuracy of Digital Impression Taking Using Intraoral Scanner versus the Conventional Technique. Front. Dent. 2021, 18, 6. [Google Scholar] [CrossRef] [PubMed]
- Sutter, B.; Girouard, P.; Radke, J.; Kerstein, R.B. A review of: “Comparison between conventional and computerized methods in the assessment of an occlusal scheme”. Adv. Dent. Technol. Tech. 2020, 2, 84–89. [Google Scholar]
- Dias, R.A.B.; Rodrigues, M.J.P.; Messias, A.L.; Guerra, F.A.D.A.; Manfredini, D. Comparison between conventional and computerised methods in the assessment of an occlusal scheme. J. Oral Rehabil. 2020, 47, 221–228. [Google Scholar] [CrossRef] [PubMed]
- Revilla-León, M.; Agustín-Panadero, R.; Zeitler, J.M.; Barmak, A.B.; Yilmaz, B.; Kois, J.C.; Pérez-Barquero, J.A. Differences in maxillomandibular relationship recorded at centric relation when using a conventional method, four intraoral scanners, and a jaw tracking system: A clinical study. J. Prosthet. Dent. 2023. [Google Scholar] [CrossRef] [PubMed]
- Revilla-León, M.; Gohil, A.; Barmak, A.B.; Gómez-Polo, M.; Pérez-Barquero, J.A.; Att, W.; Kois, J.C. Influence of ambient temperature changes on intraoral scanning accuracy. J. Prosthet. Dent. 2023, 130, 755–760. [Google Scholar] [CrossRef] [PubMed]
- Revilla-León, M.; Subramanian, S.G.; Att, W.; Krishnamurthy, V.R. Analysis of Different Illuminance of the Room Lighting Condition on the Accuracy (Trueness and Precision) of An Intraoral Scanner. J. Prosthodont. 2021, 30, 157–162. [Google Scholar] [CrossRef] [PubMed]
- Medina-Sotomayor, P.; Pascual-Moscardó, A.; Camps, I. Relationship between resolution and accuracy of four intraoral scanners in complete-arch impressions. J. Clin. Exp. Dent. 2018, 10, e361–e366. [Google Scholar] [CrossRef] [PubMed]
- Revilla-León, M.; Subramanian, S.G.; Özcan, M.; Krishnamurthy, V.R. Clinical Study of the Influence of Ambient Light Scanning Conditions on the Accuracy (Trueness and Precision) of an Intraoral Scanner. J. Prosthodont. 2020, 29, 107–113. [Google Scholar] [CrossRef] [PubMed]
- Müller, P.; Ender, A.; Joda, T.; Katsoulis, J. Impact of digital intraoral scan strategies on the impression accuracy using the TRIOS Pod scanner. Quintessence Int. 2016, 47, 343–349. [Google Scholar] [PubMed]
- Kim, M.K.; Son, K.; Yu, B.Y.; Lee, K.B. Effect of the volumetric dimensions of a complete arch on the accuracy of scanners. J. Adv. Prosthodont. 2020, 12, 361–368. [Google Scholar] [CrossRef] [PubMed]
- Kim, J.; Park, J.M.; Kim, M.; Heo, S.J.; Kim, M. Comparison of experience curves between two 3-dimensional intraoral scanners. J. Prosthet. Dent. 2016, 116, 221–230. [Google Scholar] [CrossRef] [PubMed]
- Li, H.; Lyu, P.; Wang, Y.; Sun, Y. Influence of object translucency on the scanning accuracy of a powder-free intraoral scanner: A laboratory study. J. Prosthet. Dent. 2017, 117, 93–101. [Google Scholar] [CrossRef] [PubMed]
- Chen, Y.; Zhai, Z.; Li, H.; Yamada, S.; Matsuoka, T.; Ono, S.; Nakano, T. Influence of Liquid on the Tooth Surface on the Accuracy of Intraoral Scanners: An In Vitro Study. J. Prosthodont. 2022, 31, 59–64. [Google Scholar] [CrossRef] [PubMed]
- Song, J.; Kim, M. Accuracy on scanned images of full arch models with orthodontic brackets by various intraoral scanners in the presence of artificial saliva. BioMed Res. Int. 2020, 2020, 2920804. [Google Scholar] [CrossRef] [PubMed]
- Shopova, D.; Yaneva, A.; Bakova, D.; Mihaylova, A.; Yordanova, M.; Yordanova, S. T–Scan Novus System Application-Digital Occlusion Analysis of 3D Printed Orthodontics Retainers. Appl. Sci. 2023, 13, 8111. [Google Scholar] [CrossRef]
- Warreth, A.; Elkareimi, Y. All-ceramic restorations: A review of the literature. Saudi Dent. J. 2020, 32, 365–372. [Google Scholar] [CrossRef] [PubMed]

| No | Maximum Intercuspation | Protrusion | Right Laterotrusion | Left Laterotrusion | ||||||||||||||||||||
|---|---|---|---|---|---|---|---|---|---|---|---|---|---|---|---|---|---|---|---|---|---|---|---|---|
| Red | Green | Blue | Red | Green | Blue | Red | Green | Blue | Red | Green | Blue | |||||||||||||
| T-Scan | Medit | T-Scan | Medit | T-Scan | Medit | T-Scan | Medit | T-Scan | Medit | T-Scan | Medit | T-Scan | Medit | T-Scan | Medit | T-Scan | Medit | T-Scan | Medit | T-Scan | Medit | T-Scan | Medit | |
| 1 | 9 | 16 | 16 | 993 | 12,995 | 7403 | 0 | 0 | 0 | 9 | 812 | 636 | 0 | 140 | 0 | 3 | 365 | 448 | 0 | 0 | 0 | 25 | 340 | 260 |
| 2 | 50 | 36 | 110 | 36 | 10,638 | 1829 | 17 | 198 | 0 | 21 | 2285 | 861 | 8 | 73 | 0 | 10 | 1467 | 256 | 0 | 26 | 24 | 51 | 3567 | 680 |
| 3 | 33 | 265 | 52 | 1058 | 10,519 | 12,755 | 23 | 0 | 0 | 107 | 662 | 1088 | 24 | 0 | 136 | 108 | 389 | 1088 | 18 | 204 | 0 | 77 | 385 | 757 |
| 4 | 158 | 64 | 121 | 89 | 9856 | 2646 | 51 | 3 | 10 | 22 | 1413 | 1150 | 0 | 5 | 0 | 62 | 255 | 365 | 58 | 84 | 0 | 7 | 734 | 373 |
| 5 | 105 | 77 | 234 | 642 | 12,169 | 16,074 | 0 | 197 | 0 | 126 | 113 | 1621 | 0 | 1098 | 0 | 47 | 141 | 1628 | 0 | 21 | 0 | 13 | 213 | 385 |
| 6 | 35 | 0 | 650 | 30 | 13,034 | 1165 | 0 | 81 | 32 | 3 | 121 | 284 | 18 | 179 | 0 | 56 | 0 | 46 | 39 | 2352 | 0 | 36 | 336 | 661 |
| 7 | 12 | 69 | 62 | 36 | 9197 | 1618 | 0 | 50 | 130 | 11 | 777 | 759 | 25 | 0 | 0 | 21 | 1096 | 180 | 17 | 0 | 0 | 19 | 1708 | 366 |
| 8 | 62 | 12 | 120 | 436 | 7807 | 7383 | 0 | 0 | 32 | 145 | 540 | 1050 | 0 | 0 | 44 | 40 | 151 | 304 | 34 | 0 | 0 | 11 | 395 | 97 |
| 9 | 42 | 175 | 575 | 821 | 11,542 | 12,473 | 0 | 197 | 28 | 126 | 396 | 1621 | 0 | 1098 | 0 | 47 | 564 | 1628 | 24 | 21 | 62 | 13 | 1004 | 385 |
| 10 | 46 | 48 | 517 | 75 | 16,536 | 1786 | 0 | 25 | 0 | 4 | 171 | 83 | 0 | 5 | 0 | 36 | 163 | 27 | 0 | 0 | 0 | 0 | 109 | 20 |
| 11 | 214 | 26 | 112 | 236 | 17,975 | 3209 | 0 | 300 | 42 | 61 | 257 | 714 | 0 | 0 | 0 | 59 | 228 | 1141 | 0 | 185 | 60 | 7 | 301 | 114 |
| 12 | 44 | 321 | 407 | 1329 | 21,441 | 17,464 | 0 | 106 | 0 | 59 | 37 | 658 | 0 | 7 | 0 | 28 | 282 | 496 | 0 | 9 | 0 | 78 | 41 | 1370 |
| 13 | 9 | 16 | 16 | 993 | 12,995 | 7403 | 0 | 0 | 0 | 9 | 812 | 636 | 0 | 140 | 0 | 33 | 365 | 448 | 0 | 0 | 0 | 25 | 340 | 260 |
| 14 | 50 | 36 | 110 | 36 | 10,638 | 1829 | 17 | 198 | 0 | 21 | 2285 | 861 | 8 | 73 | 0 | 10 | 1467 | 256 | 0 | 26 | 24 | 51 | 3567 | 680 |
| 15 | 33 | 265 | 52 | 1058 | 10,519 | 12,755 | 23 | 0 | 0 | 107 | 662 | 1088 | 24 | 0 | 136 | 108 | 389 | 1088 | 18 | 204 | 0 | 77 | 385 | 757 |
| 16 | 158 | 64 | 121 | 89 | 9856 | 2646 | 51 | 3 | 10 | 22 | 1413 | 1150 | 0 | 5 | 0 | 22 | 255 | 365 | 58 | 84 | 0 | 7 | 734 | 373 |
| 17 | 44 | 321 | 407 | 1329 | 21,441 | 17,464 | 0 | 106 | 0 | 59 | 37 | 658 | 0 | 7 | 0 | 48 | 282 | 496 | 0 | 9 | 0 | 78 | 41 | 1370 |
| 18 | 42 | 175 | 575 | 821 | 11,542 | 12,473 | 0 | 197 | 28 | 126 | 396 | 1621 | 0 | 1098 | 0 | 47 | 564 | 1628 | 24 | 21 | 62 | 13 | 1004 | 385 |
| 19 | 46 | 48 | 517 | 75 | 16,536 | 1786 | 0 | 25 | 0 | 4 | 171 | 83 | 0 | 5 | 0 | 16 | 163 | 27 | 0 | 0 | 0 | 0 | 109 | 20 |
| 20 | 62 | 12 | 120 | 436 | 7807 | 7383 | 0 | 0 | 32 | 145 | 540 | 1050 | 0 | 0 | 44 | 40 | 151 | 304 | 34 | 0 | 0 | 11 | 395 | 97 |
| Coeff/ p * | −0.132/ 0.432 | −0.077/ 0.646 | 0.110/ 0.513 | −0.094/ 0.622 | 0.235/ 0.195 | 0.144/ 0.394 | −0.191 0.323 | 0.358/ 0.060 | 0.188/ 0.265 | 0.245/ 0.185 | −0.025/ 0.897 | 0.099/ 0.555 | ||||||||||||
| Variable | Pixel | Minimum | Maximum | Mean ± SD | Median |
|---|---|---|---|---|---|
| MI position | Red | 9 | 214 | 62.7 + 54.36 | 45 |
| Green | 16 | 650 | 244.7 + 219.02 | 120.5 | |
| Blue | 7807 | 21,441 | 12,752.15 + 4023.67 | 11,542 | |
| Edge-to-edge protrusion position | Red | 0 | 51 | 9.1 + 16.51 | 0 |
| Green Blue | 0 37 | 130 2285 | 17.2 + 30.42 695 + 673.78 | 0 540 | |
| Edge-to-edge right laterotrusion position | Red | 0 | 25 | 5.35 + 9.34 | 0 |
| Green | 0 | 136 | 18 + 42.54 | 0 | |
| Blue | 0 | 1467 | 436.85 + 420.13 | 282 | |
| Edge-to-edge left laterotrusion position | Red | 0 | 58 | 16.2 + 19.74 | 8.5 |
| Green Blue | 0 41 | 62 3567 | 11.6 + 22.65 785.4 + 1032.02 | 0 385 |
| Variable | Pixel | Minimum | Maximum | Mean ± SD | Median |
|---|---|---|---|---|---|
| MI position | Red | 0 | 321 | 102.3 + 109.07 | 56 |
| Green | 30 | 1329 | 530.9 + 477.62 | 436 | |
| Blue | 1165 | 17,464 | 7477.2 + 5834.06 | 7383 | |
| Edge-to-edge protrusion position | Red | 0 | 300 | 84.3 + 96.11 | 37.5 |
| Green Blue | 3 83 | 145 1621 | 59.35 + 53.8 883.6 + 448.58 | 40.5 861 | |
| Edge-to-edge right laterotrusion position | Red | 0 | 1098 | 196.65 + 392.39 | 6 |
| Green | 1 | 108 | 30.8 + 32.42 | 22 | |
| Blue | 27 | 1628 | 610.95 + 546.14 | 406.5 | |
| Edge-to-edge left laterotrusion position | Red | 0 | 2352 | 162.3 + 520.1 | 21 |
| Green Blue | 0 20 | 78 1370 | 29.95 + 28.18 470.5 + 387.9 | 16 379 |
Disclaimer/Publisher’s Note: The statements, opinions and data contained in all publications are solely those of the individual author(s) and contributor(s) and not of MDPI and/or the editor(s). MDPI and/or the editor(s) disclaim responsibility for any injury to people or property resulting from any ideas, methods, instructions or products referred to in the content. |
© 2024 by the authors. Licensee MDPI, Basel, Switzerland. This article is an open access article distributed under the terms and conditions of the Creative Commons Attribution (CC BY) license (https://creativecommons.org/licenses/by/4.0/).
Share and Cite
Popa, A.D.; Vlăduțu, D.E.; Turcu, A.A.; Târtea, D.A.; Ionescu, M.; Păunescu, C.; Stan, R.S.; Mercuț, V. Aspects of Occlusal Recordings Performed with the T-Scan System and with the Medit Intraoral Scanner. Diagnostics 2024, 14, 1457. https://doi.org/10.3390/diagnostics14131457
Popa AD, Vlăduțu DE, Turcu AA, Târtea DA, Ionescu M, Păunescu C, Stan RS, Mercuț V. Aspects of Occlusal Recordings Performed with the T-Scan System and with the Medit Intraoral Scanner. Diagnostics. 2024; 14(13):1457. https://doi.org/10.3390/diagnostics14131457
Chicago/Turabian StylePopa, Angelica Diana, Diana Elena Vlăduțu, Adina Andreea Turcu, Daniel Adrian Târtea, Mihaela Ionescu, Cătălin Păunescu, Răzvan Sabin Stan, and Veronica Mercuț. 2024. "Aspects of Occlusal Recordings Performed with the T-Scan System and with the Medit Intraoral Scanner" Diagnostics 14, no. 13: 1457. https://doi.org/10.3390/diagnostics14131457
APA StylePopa, A. D., Vlăduțu, D. E., Turcu, A. A., Târtea, D. A., Ionescu, M., Păunescu, C., Stan, R. S., & Mercuț, V. (2024). Aspects of Occlusal Recordings Performed with the T-Scan System and with the Medit Intraoral Scanner. Diagnostics, 14(13), 1457. https://doi.org/10.3390/diagnostics14131457