
From Phantoms to Patients: Improved Fusion and Voxel-Wise Analysis of Diffusion-Weighted Imaging and FDG-Positron Emission Tomography in Positron Emission Tomography/Magnetic Resonance Imaging for Combined Metabolic–Diffusivity Index (cDMI)
 , , , , , and
Abstract
:1. Introduction
2. Materials and Methods
2.1. Phantom Generation
2.2. Sector Phantom
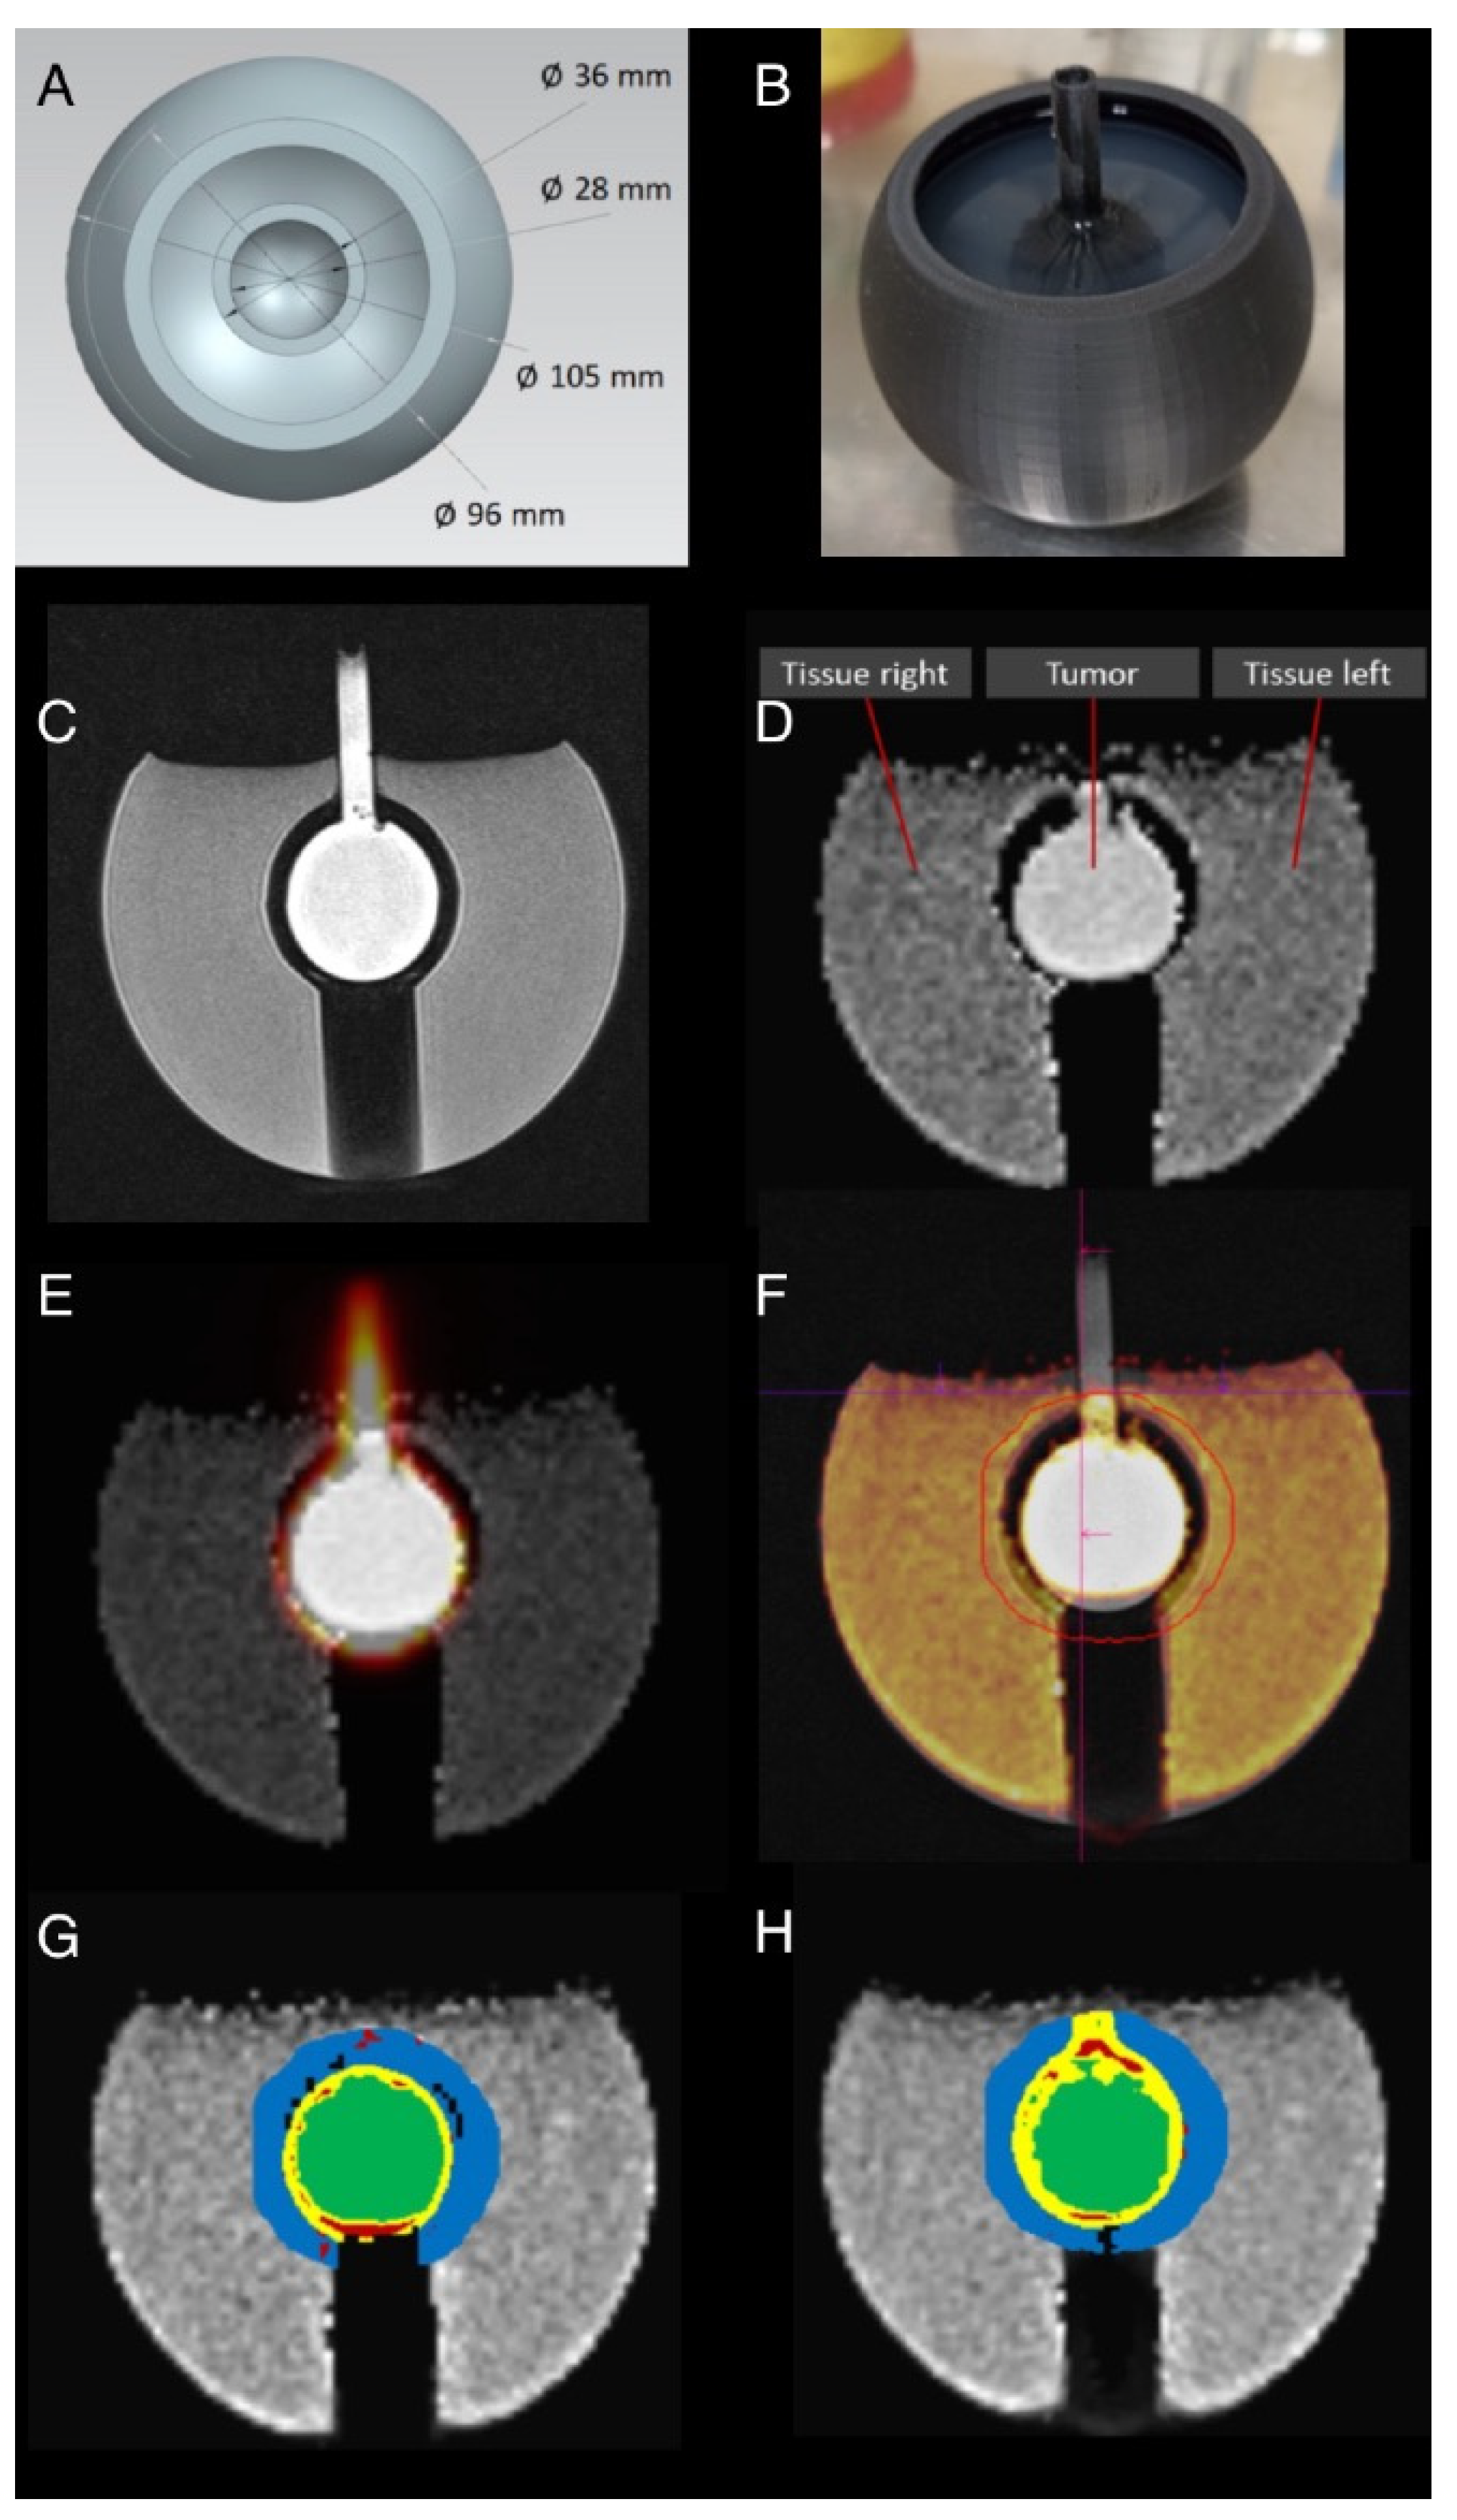
2.3. Tumor Phantom
2.4. Phantom MR and PET Measurements
2.5. Patients
2.6. PET/MR Examinations
2.7. Data Preparation and Co-Registration
2.8. Image Evaluation
2.9. DWI and PET Registration
2.10. Evaluation of Registered Datasets
- -
- ADC < 300 mm2/s in combination with an SUVbw > 4.
- -
- ADC > 1600 mm2/s in combination with an SUVbw > 4.
- -
- ADC > 300 mm2/s and < 1600 mm2/s in combination with an SUVbw < 1.
2.11. Statistics
3. Results
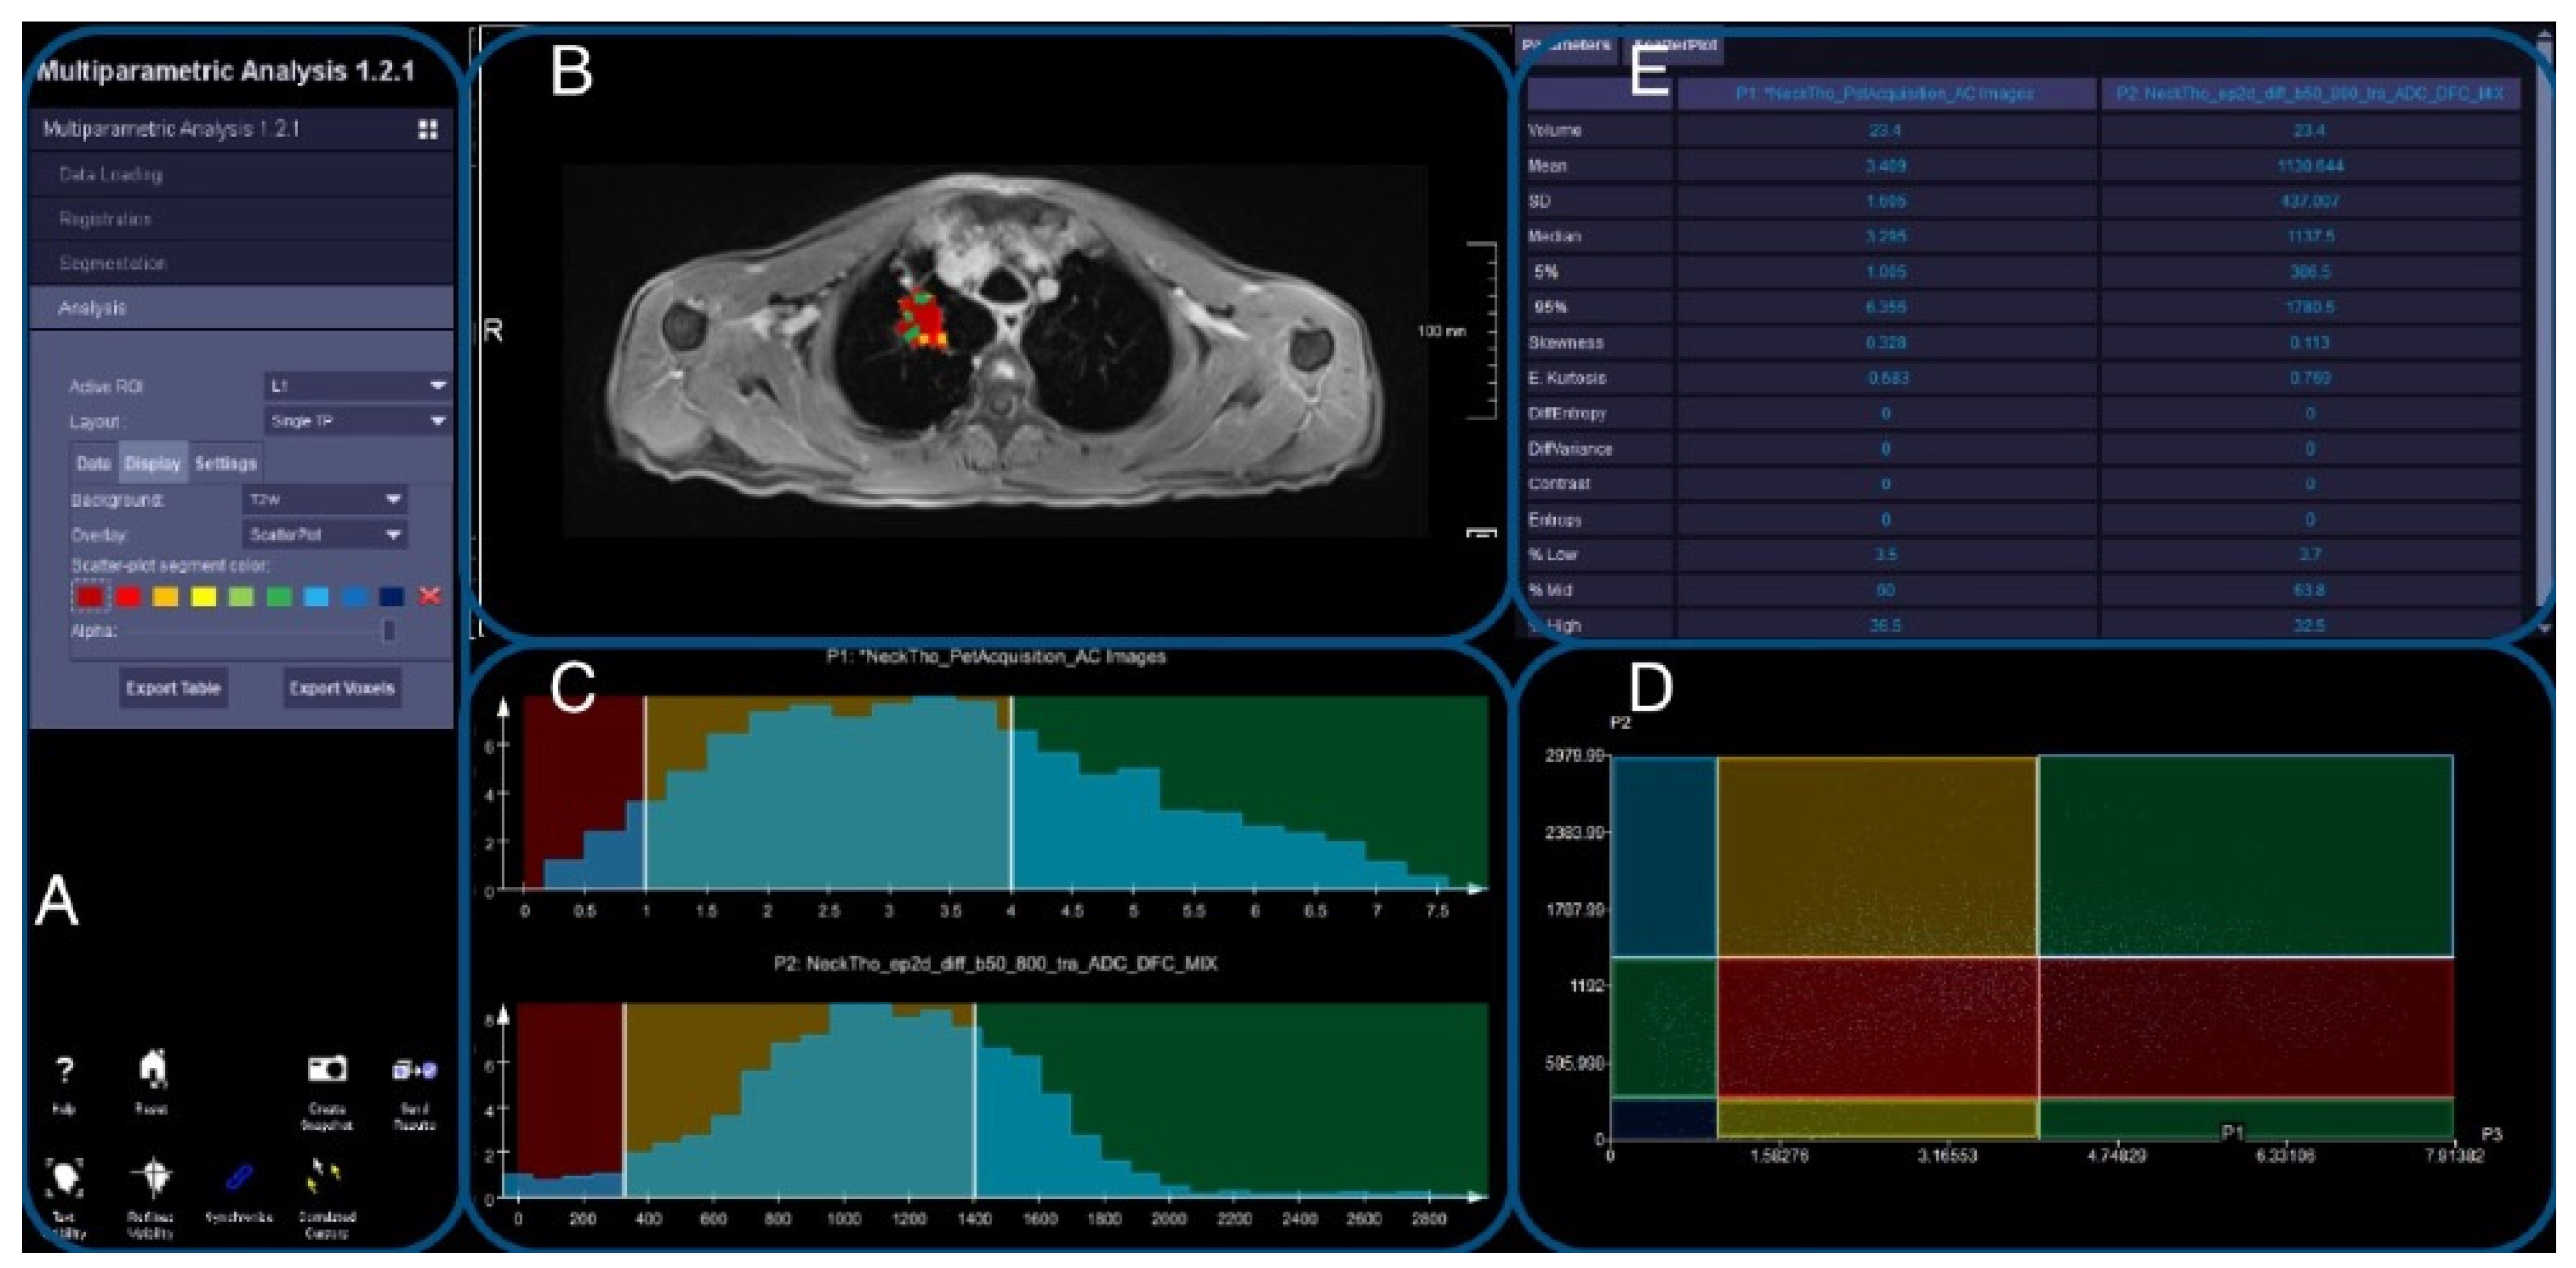
3.1. Workflow
3.2. Sector Phantom
3.3. Sphere and Tumor Phantoms
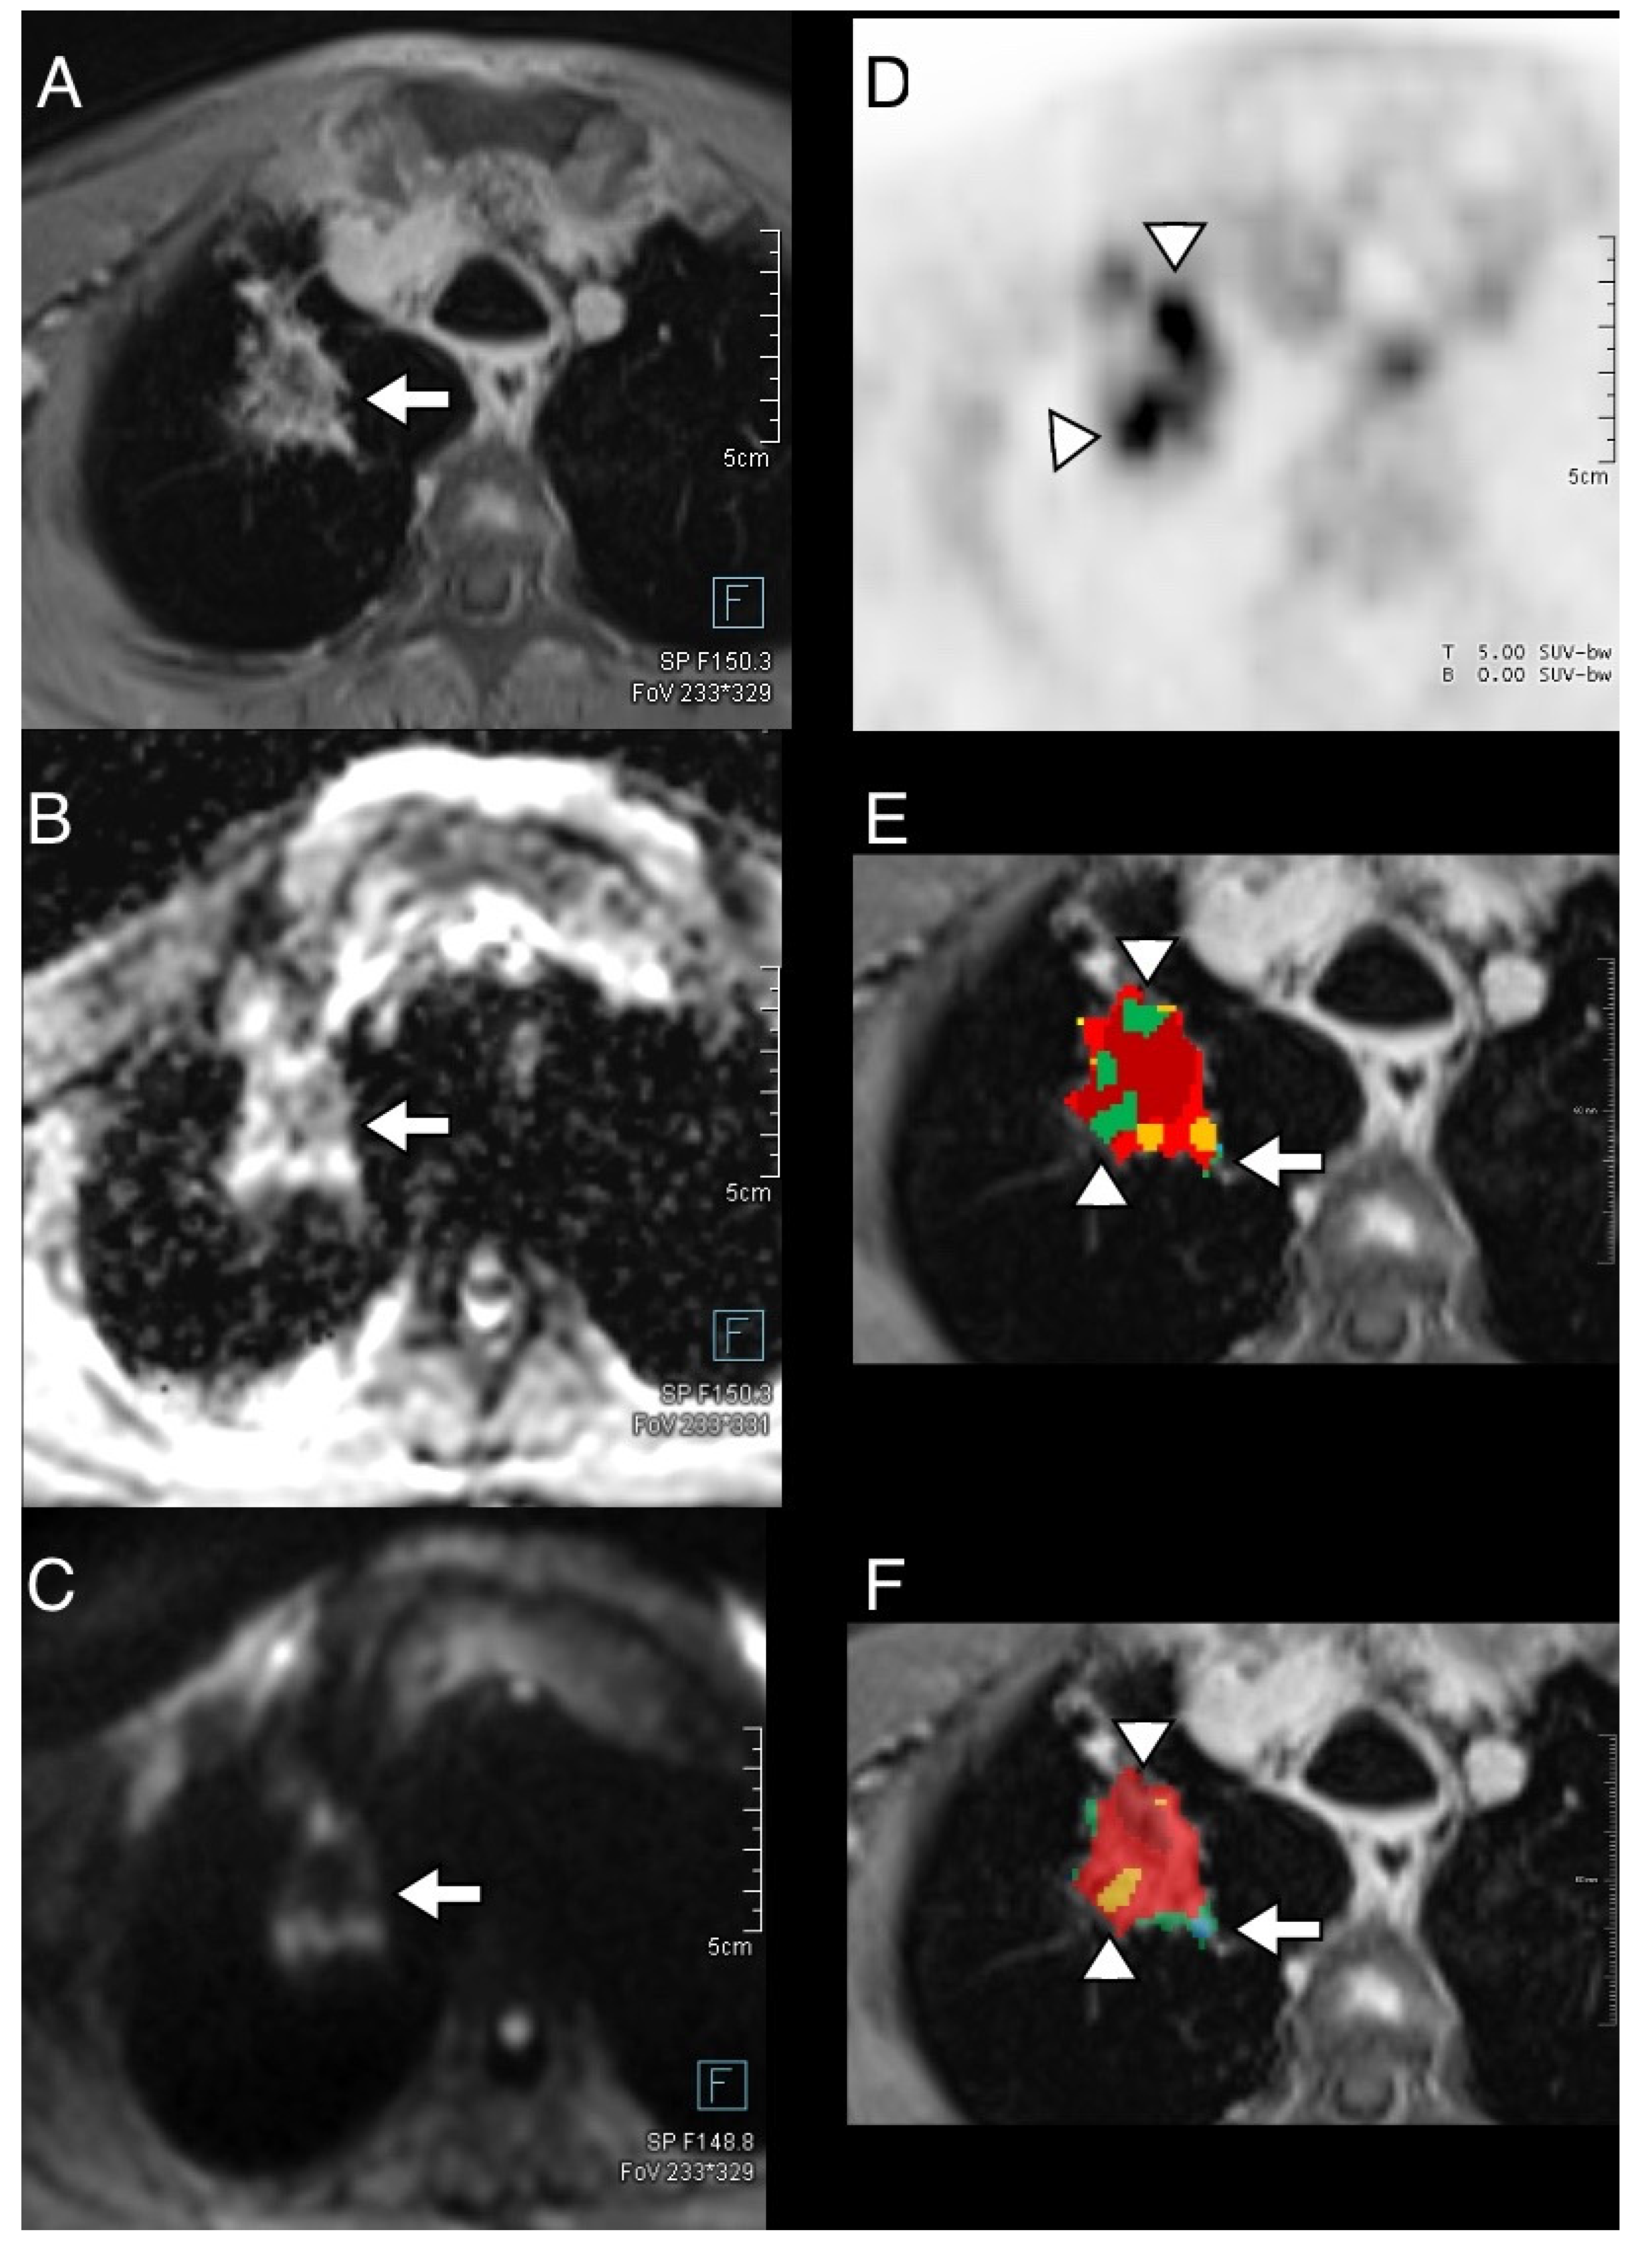
3.4. Thoracic Tumor Segmentation and Registration
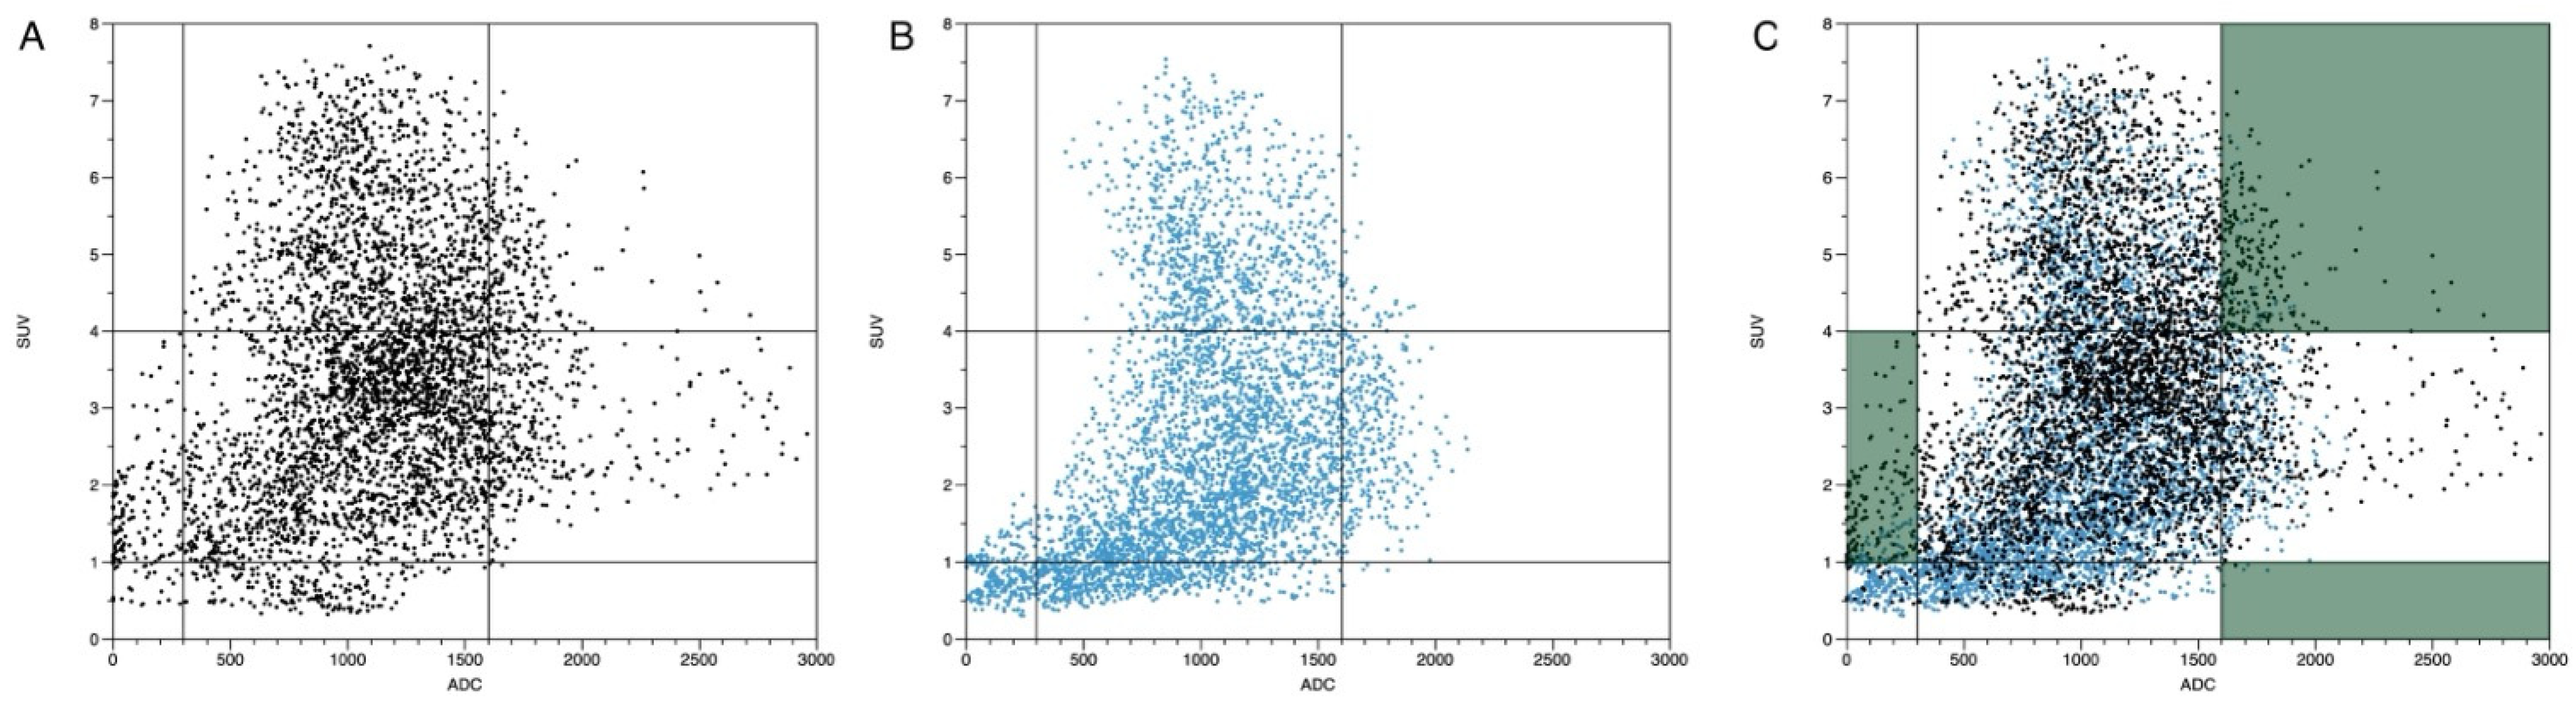
3.5. Plausibility of DWI and PET Images
4. Discussion
5. Conclusions
Supplementary Materials
Author Contributions
Funding
Institutional Review Board Statement
Informed Consent Statement
Data Availability Statement
Acknowledgments
Conflicts of Interest
References
- Grover, V.P.B.; Tognarelli, J.M.; Crossey, M.M.E.; Cox, I.J.; Taylor-Robinson, S.D.; McPhail, M.J.W. Magnetic Resonance Imaging: Principles and Techniques: Lessons for Clinicians. J. Clin. Exp. Hepatol. 2015, 5, 246–255. [Google Scholar] [CrossRef] [PubMed]
- Messina, C.; Bignone, R.; Bruno, A.; Bruno, A.; Bruno, F.; Calandri, M.; Caruso, D.; Coppolino, P.; Robertis, R.D.; Gentili, F.; et al. Diffusion-Weighted Imaging in Oncology: An Update. Cancers 2020, 12, 1493. [Google Scholar] [CrossRef] [PubMed]
- Parikh, T.; Drew, S.J.; Lee, V.S.; Wong, S.; Hecht, E.M.; Babb, J.S.; Taouli, B. Focal Liver Lesion Detection and Characterization with Diffusion-Weighted MR Imaging: Comparison with Standard Breath-Hold T2-Weighted Imaging. Radiology 2008, 246, 812–822. [Google Scholar] [CrossRef] [PubMed]
- Siegelman, E.S.; Chauhan, A. MR Characterization of Focal Liver Lesions: Pearls and Pitfalls. Magn. Reson. Imaging Clin. N. Am. 2014, 22, 295–313. [Google Scholar] [CrossRef] [PubMed]
- Morone, M.; Bali, M.A.; Tunariu, N.; Messiou, C.; Blackledge, M.; Grazioli, L.; Koh, D.-M. Whole-Body MRI: Current Applications in Oncology. AJR Am. J. Roentgenol. 2017, 209, W336–W349. [Google Scholar] [CrossRef] [PubMed]
- Taffel, M.T.; Johnson, E.J.; Chandarana, H. Diffusion Quantification in Body Imaging. Top. Magn. Reson. Imaging TMRI 2017, 26, 243–249. [Google Scholar] [CrossRef] [PubMed]
- Becker, J.; Schwarzenböck, S.M.; Krause, B.J. FDG PET Hybrid Imaging. Mol. Imaging Oncol. 2020, 216, 625–667. [Google Scholar] [CrossRef]
- Kostakoglu, L.; Agress, H.; Goldsmith, S.J. Clinical Role of FDG PET in Evaluation of Cancer Patients. Radiogr. Rev. Publ. Radiol. Soc. N. Am. Inc 2003, 23, 315–340. [Google Scholar] [CrossRef] [PubMed]
- Pichler, B.J.; Kolb, A.; Nägele, T.; Schlemmer, H.-P. PET/MRI: Paving the Way for the Next Generation of Clinical Multimodality Imaging Applications. J. Nucl. Med. 2010, 51, 333–336. [Google Scholar] [CrossRef]
- Mannheim, J.G.; Schmid, A.M.; Schwenck, J.; Katiyar, P.; Herfert, K.; Pichler, B.J.; Disselhorst, J.A. PET/MRI Hybrid Systems. Semin. Nucl. Med. 2018, 48, 332–347. [Google Scholar] [CrossRef]
- Antoch, G.; Bockisch, A. Combined PET/MRI: A New Dimension in Whole-Body Oncology Imaging? Eur. J. Nucl. Med. Mol. Imaging 2009, 36 (Suppl. S1), S113–S120. [Google Scholar] [CrossRef] [PubMed]
- Hicks, R.J.; Lau, E.W.F. PET/MRI: A Different Spin from under the Rim. Eur. J. Nucl. Med. Mol. Imaging 2009, 36 (Suppl. S1), S10–S14. [Google Scholar] [CrossRef]
- Schmidt, H.; Brendle, C.; Schraml, C.; Martirosian, P.; Bezrukov, I.; Hetzel, J.; Müller, M.; Sauter, A.; Claussen, C.D.; Pfannenberg, C.; et al. Correlation of Simultaneously Acquired Diffusion-Weighted Imaging and 2-Deoxy-[18F] Fluoro-2-D-Glucose Positron Emission Tomography of Pulmonary Lesions in a Dedicated Whole-Body Magnetic Resonance/Positron Emission Tomography System. Investig. Radiol. 2013, 48, 247–255. [Google Scholar] [CrossRef] [PubMed]
- Kong, E.; Chun, K.A.; Cho, I.H. Quantitative Assessment of Simultaneous F-18 FDG PET/MRI in Patients with Various Types of Hepatic Tumors: Correlation between Glucose Metabolism and Apparent Diffusion Coefficient. PLoS ONE 2017, 12, e0180184. [Google Scholar] [CrossRef] [PubMed]
- Brandmaier, P.; Purz, S.; Bremicker, K.; Höckel, M.; Barthel, H.; Kluge, R.; Kahn, T.; Sabri, O.; Stumpp, P. Simultaneous [18F]FDG-PET/MRI: Correlation of Apparent Diffusion Coefficient (ADC) and Standardized Uptake Value (SUV) in Primary and Recurrent Cervical Cancer. PLoS ONE 2015, 10, e0141684. [Google Scholar] [CrossRef]
- Sauter, A.W.; Stieltjes, B.; Weikert, T.; Gatidis, S.; Wiese, M.; Klarhöfer, M.; Wild, D.; Lardinois, D.; Bremerich, J.; Sommer, G. The Spatial Relationship between Apparent Diffusion Coefficient and Standardized Uptake Value of 18F-Fluorodeoxyglucose Has a Crucial Influence on the Numeric Correlation of Both Parameters in PET/MRI of Lung Tumors. Contrast Media Mol. Imaging 2017, 2017, 8650853. [Google Scholar] [CrossRef]
- Kiefer, A.; Kuwert, T.; Hahn, D.; Hornegger, J.; Uder, M.; Ritt, P. Anatomical Accuracy of Abdominal Lesion Localization. Retrospective Automatic Rigid Image Registration between FDG-PET and MRI. Nukl. Nucl. Med. 2011, 50, 147–154. [Google Scholar] [CrossRef] [PubMed]
- Borggreve, A.S.; Goense, L.; van Rossum, P.S.N.; Heethuis, S.E.; van Hillegersberg, R.; Lagendijk, J.J.W.; Lam, M.G.E.H.; van Lier, A.L.H.M.W.; Mook, S.; Ruurda, J.P.; et al. Preoperative Prediction of Pathologic Response to Neoadjuvant Chemoradiotherapy in Patients with Esophageal Cancer Using 18F-FDG PET/CT and DW-MRI: A Prospective Multicenter Study. Int. J. Radiat. Oncol. Biol. Phys. 2020, 106, 998–1009. [Google Scholar] [CrossRef]
- Chen, B.-B.; Tien, Y.-W.; Chang, M.-C.; Cheng, M.-F.; Chang, Y.-T.; Wu, C.-H.; Chen, X.-J.; Kuo, T.-C.; Yang, S.-H.; Shih, I.-L.; et al. PET/MRI in Pancreatic and Periampullary Cancer: Correlating Diffusion-Weighted Imaging, MR Spectroscopy and Glucose Metabolic Activity with Clinical Stage and Prognosis. Eur. J. Nucl. Med. Mol. Imaging 2016, 43, 1753–1764. [Google Scholar] [CrossRef]
- Shih, I.-L.; Yen, R.-F.; Chen, C.-A.; Chen, B.-B.; Wei, S.-Y.; Chang, W.-C.; Sheu, B.-C.; Cheng, W.-F.; Tseng, Y.-H.; Chen, X.-J.; et al. Standardized Uptake Value and Apparent Diffusion Coefficient of Endometrial Cancer Evaluated with Integrated Whole-Body PET/MR: Correlation with Pathological Prognostic Factors. J. Magn. Reson. Imaging JMRI 2015, 42, 1723–1732. [Google Scholar] [CrossRef]
- Schwenzer, N.F.; Schmidt, H.; Gatidis, S.; Brendle, C.; Müller, M.; Königsrainer, I.; Claussen, C.D.; Pfannenberg, A.C.; Schraml, C. Measurement of Apparent Diffusion Coefficient with Simultaneous MR/Positron Emission Tomography in Patients with Peritoneal Carcinomatosis: Comparison with 18F-FDG-PET. J. Magn. Reson. Imaging JMRI 2014, 40, 1121–1128. [Google Scholar] [CrossRef] [PubMed]
- Byun, B.H.; Noh, W.C.; Lim, I.; Lee, S.S.; Cho, A.R.; Park, J.A.; Kim, K.M.; Kim, H.-A.; Kim, E.-K.; Kim, B.I.; et al. A New Method for Apparent Diffusion Coefficient Measurement Using Sequential (18)F-FDG PET and MRI: Correlation with Histological Grade of Invasive Ductal Carcinoma of the Breast. Ann. Nucl. Med. 2013, 27, 720–728. [Google Scholar] [CrossRef]
- Wongsa, P.; Nantasuk, M.; Singhnoi, S.; Pawano, P.; Jantarato, A.; Siripongsatian, D.; Lerdsirisuk, P.; Phonlakrai, M. Assessing the Variability and Correlation between SUV and ADC Parameters of Head and Neck Cancers Derived from Simultaneous PET/MRI: A Single-Center Study. J. Appl. Clin. Med. Phys. 2023, 24, e13928. [Google Scholar] [CrossRef] [PubMed]
- Chaika, M.; Männlin, S.; Gassenmaier, S.; Tsiflikas, I.; Dittmann, H.; Flaadt, T.; Warmann, S.; Gückel, B.; Schäfer, J.F. Combined Metabolic and Functional Tumor Volumes on [18F]FDG-PET/MRI in Neuroblastoma Using Voxel-Wise Analysis. J. Clin. Med. 2023, 12, 5976. [Google Scholar] [CrossRef]
- Maennlin, S.; Chaika, M.; Gassenmaier, S.; Grimm, R.; Sparber-Sauer, M.; Fuchs, J.; Schmidt, A.; Ebinger, M.; Hettmer, S.; Gatidids, S.; et al. Evaluation of Functional and Metabolic Tumor Volume Using Voxel-Wise Analysis in Childhood Rhabdomyosarcoma. Pediatr. Radiol. 2023, 53, 438–449. [Google Scholar] [CrossRef]
- Laubach, H.J.; Jakob, P.M.; Loevblad, K.O.; Baird, A.E.; Bovo, M.P.; Edelman, R.R.; Warach, S. A Phantom for Diffusion-Weighted Imaging of Acute Stroke. J. Magn. Reson. Imaging JMRI 1998, 8, 1349–1354. [Google Scholar] [CrossRef]
- Hofmann, M.; Bezrukov, I.; Mantlik, F.; Aschoff, P.; Steinke, F.; Beyer, T.; Pichler, B.J.; Schölkopf, B. MRI-Based Attenuation Correction for Whole-Body PET/MRI: Quantitative Evaluation of Segmentation- and Atlas-Based Methods. J. Nucl. Med. Off. Publ. Soc. Nucl. Med. 2011, 52, 1392–1399. [Google Scholar] [CrossRef] [PubMed]
- Paulus, D.H.; Quick, H.H.; Geppert, C.; Fenchel, M.; Zhan, Y.; Hermosillo, G.; Faul, D.; Boada, F.; Friedman, K.P.; Koesters, T. Whole-Body PET/MR Imaging: Quantitative Evaluation of a Novel Model-Based MR Attenuation Correction Method Including Bone. J. Nucl. Med. 2015, 56, 1061–1066. [Google Scholar] [CrossRef]
- Saddi, K.A.; Chefd’hotel, C.; Cheriet, F. Large Deformation Registration of Contrast-Enhanced Images with Volume-Preserving Constraint. In Proceedings of the Medical Imaging 2007: Image Processing, San Diego, CA, USA, 17–22 February 2007; p. 651203. [Google Scholar]
- Chefd’Hotel, C.; Hermosillo, G.; Faugeras, O. A Variational Approach to Multi-Modal Image Matching. In Proceedings of the Proceedings IEEE Workshop on Variational and Level Set Methods in Computer Vision, Vancouver, BC, Canada, 13–13 July 2001; pp. 21–28. [Google Scholar]
- Hermosillo, G.; Chefd’Hotel, C.; Faugeras, O. Variational Methods for Multimodal Image Matching. Int. J. Comput. Vis. 2002, 50, 329–343. [Google Scholar] [CrossRef]
- Chan, S.-C.; Yeh, C.-H.; Ng, S.-H.; Lin, C.-Y.; Wang, J.-H.; Chang, J.T.-C.; Cheng, N.-M.; Chang, K.-P.; Hsieh, J.C.-H. Prospective Investigation of 18FDG-PET/MRI with Intravoxel Incoherent Motion Diffusion-Weighted Imaging to Assess Survival in Patients with Oropharyngeal or Hypopharyngeal Carcinoma. Cancers 2022, 14, 6104. [Google Scholar] [CrossRef]
- Chodyla, M.; Demircioglu, A.; Schaarschmidt, B.M.; Bertram, S.; Bruckmann, N.M.; Haferkamp, J.; Li, Y.; Bauer, S.; Podleska, L.; Rischpler, C.; et al. Evaluation of 18F-FDG PET and DWI Datasets for Predicting Therapy Response of Soft-Tissue Sarcomas Under Neoadjuvant Isolated Limb Perfusion. J. Nucl. Med. Off. Publ. Soc. Nucl. Med. 2021, 62, 348–353. [Google Scholar] [CrossRef]
- Bruckmann, N.M.; Kirchner, J.; Grueneisen, J.; Li, Y.; McCutcheon, A.; Aigner, C.; Rischpler, C.; Sawicki, L.M.; Herrmann, K.; Umutlu, L.; et al. Correlation of the Apparent Diffusion Coefficient (ADC) and Standardized Uptake Values (SUV) with Overall Survival in Patients with Primary Non-Small Cell Lung Cancer (NSCLC) Using 18F-FDG PET/MRI. Eur. J. Radiol. 2021, 134, 109422. [Google Scholar] [CrossRef]
- Rakheja, R.; Chandarana, H.; DeMello, L.; Jackson, K.; Geppert, C.; Faul, D.; Glielmi, C.; Friedman, K.P. Correlation between Standardized Uptake Value and Apparent Diffusion Coefficient of Neoplastic Lesions Evaluated with Whole-Body Simultaneous Hybrid PET/MRI. AJR Am. J. Roentgenol. 2013, 201, 1115–1119. [Google Scholar] [CrossRef] [PubMed]
- Heusch, P.; Köhler, J.; Wittsack, H.-J.; Heusner, T.A.; Buchbender, C.; Poeppel, T.D.; Nensa, F.; Wetter, A.; Gauler, T.; Hartung, V.; et al. Hybrid [18F]-FDG PET/MRI Including Non-Gaussian Diffusion-Weighted Imaging (DWI): Preliminary Results in Non-Small Cell Lung Cancer (NSCLC). Eur. J. Radiol. 2013, 82, 2055–2060. [Google Scholar] [CrossRef] [PubMed]
- Heusch, P.; Buchbender, C.; Köhler, J.; Nensa, F.; Beiderwellen, K.; Kühl, H.; Lanzman, R.S.; Wittsack, H.J.; Gomez, B.; Gauler, T.; et al. Correlation of the Apparent Diffusion Coefficient (ADC) with the Standardized Uptake Value (SUV) in Hybrid 18F-FDG PET/MRI in Non-Small Cell Lung Cancer (NSCLC) Lesions: Initial Results. ROFO. Fortschr. Geb. Rontgenstr. Nuklearmed. 2013, 185, 1056–1062. [Google Scholar] [CrossRef]
- Martin, O.; Bruckmann, N.-M.; Kirchner, J.; Ullrich, T.; Ingenwerth, M.; Bogner, S.; Eze, C.; Nensa, F.; Herrmann, K.; Umutlu, L.; et al. Is There a Connection between Immunohistochemical Markers and Grading of Lung Cancer with Apparent Diffusion Coefficient (ADC) and Standardised Uptake Values (SUV) of Hybrid 18F-FDG-PET/MRI? J. Med. Imaging Radiat. Oncol. 2020, 64, 779–786. [Google Scholar] [CrossRef]
- Zhang, F.; Zhou, Z.; Tang, D.; Zheng, D.; Cheng, J.; Lin, L.; Xu, J.; Zhao, X.; Wu, H. Diffusion-Weighted MRI in Solitary Pulmonary Lesions: Associations between Apparent Diffusion Coefficient and Multiple Histopathological Parameters. Sci. Rep. 2018, 8, 11248. [Google Scholar] [CrossRef]
- Virtanen, P.; Gommers, R.; Oliphant, T.E.; Haberland, M.; Reddy, T.; Cournapeau, D.; Burovski, E.; Peterson, P.; Weckesser, W.; Bright, J.; et al. SciPy 1.0: Fundamental Algorithms for Scientific Computing in Python. Nat. Methods 2020, 17, 261–272. [Google Scholar] [CrossRef]
- Orsatti, G.; Zucchetta, P.; Varotto, A.; Crimì, F.; Weber, M.; Cecchin, D.; Bisogno, G.; Spimpolo, A.; Giraudo, C.; Stramare, R. Volumetric Histograms-Based Analysis of Apparent Diffusion Coefficients and Standard Uptake Values for the Assessment of Pediatric Sarcoma at Staging: Preliminary Results of a PET/MRI Study. Radiol. Med. (Torino) 2021, 126, 878–885. [Google Scholar] [CrossRef] [PubMed]
- Meyer, H.-J.; Purz, S.; Sabri, O.; Surov, A. Cervical Cancer: Associations between Metabolic Parameters and Whole Lesion Histogram Analysis Derived from Simultaneous 18F-FDG-PET/MRI. Contrast Media Mol. Imaging 2018, 2018, 5063285. [Google Scholar] [CrossRef]
- Reynolds, H.M.; Williams, S.; Zhang, A.; Chakravorty, R.; Rawlinson, D.; Ong, C.S.; Esteva, M.; Mitchell, C.; Parameswaran, B.; Finnegan, M.; et al. Development of a Registration Framework to Validate MRI with Histology for Prostate Focal Therapy. Med. Phys. 2015, 42, 7078–7089. [Google Scholar] [CrossRef]
- Reynolds, H.M.; Williams, S.; Jackson, P.; Mitchell, C.; Hofman, M.S.; Hicks, R.J.; Murphy, D.G.; Haworth, A. Voxel-Wise Correlation of Positron Emission Tomography/Computed Tomography with Multiparametric Magnetic Resonance Imaging and Histology of the Prostate Using a Sophisticated Registration Framework. BJU Int. 2019, 123, 1020–1030. [Google Scholar] [CrossRef] [PubMed]
- Megyesfalvi, Z.; Gay, C.M.; Popper, H.; Pirker, R.; Ostoros, G.; Heeke, S.; Lang, C.; Hoetzenecker, K.; Schwendenwein, A.; Boettiger, K.; et al. Clinical Insights into Small Cell Lung Cancer: Tumor Heterogeneity, Diagnosis, Therapy, and Future Directions. CA. Cancer J. Clin. 2023, 73, 620–652. [Google Scholar] [CrossRef] [PubMed]
- Mayer, J.; Brown, R.; Thielemans, K.; Ovtchinnikov, E.; Pasca, E.; Atkinson, D.; Gillman, A.; Marsden, P.; Ippoliti, M.; Makowski, M.; et al. Flexible Numerical Simulation Framework for Dynamic PET-MR Data. Phys. Med. Biol. 2020, 65, 145003. [Google Scholar] [CrossRef] [PubMed]


| Sector | Area [cm2] | Area [cm2] ± SD Unregistered | Area [cm2] ± SD Registered | Expected ADC [mm2/s] ± SD | Unregistered ADC [mm2/s] ± SD | Registered ADC [mm2/s] ± SD |
|---|---|---|---|---|---|---|
| 1 | 16.2 | 15.6 ± 1.6 | 15.1 ± 1.6 | 800 ± 130 | 730 ± 80 | 660 ± 70 |
| 2 | 16.2 | 21.2 ± 2.2 | 14.7 ± 1.5 | 1400 ± 100 | 1310 ± 140 | 1330 ± 70 |
| 3 | 16.2 | 22.6 ± 2.3 | 13.0 ± 1.4 | 1110 ± 110 | 1120 ± 120 | 1130 ± 70 |
| 4 | 16.2 | 21.1 ± 2.2 | 14.9 ± 1.5 | 800 ± 130 | 550 ± 200 | 530 ± 100 |
| 5 | 16.2 | 15.1 ± 1.6 | 16.5 ± 1.7 | 1400 ± 100 | 1370 ± 80 | 1350 ± 40 |
| 6 | 16.2 | 9.8 ± 1.0 | 17.1 ±1.8 | 1110 ± 110 | 1260 ± 180 | 1230 ± 80 |
Disclaimer/Publisher’s Note: The statements, opinions and data contained in all publications are solely those of the individual author(s) and contributor(s) and not of MDPI and/or the editor(s). MDPI and/or the editor(s) disclaim responsibility for any injury to people or property resulting from any ideas, methods, instructions or products referred to in the content. |
© 2024 by the authors. Licensee MDPI, Basel, Switzerland. This article is an open access article distributed under the terms and conditions of the Creative Commons Attribution (CC BY) license (https://creativecommons.org/licenses/by/4.0/).
Share and Cite
Deininger, K.; Korf, P.; Lauber, L.; Grimm, R.; Strecker, R.; Steinacker, J.; Lisson, C.S.; Mühling, B.M.; Schmidtke-Schrezenmeier, G.; Rasche, V.; et al. From Phantoms to Patients: Improved Fusion and Voxel-Wise Analysis of Diffusion-Weighted Imaging and FDG-Positron Emission Tomography in Positron Emission Tomography/Magnetic Resonance Imaging for Combined Metabolic–Diffusivity Index (cDMI). Diagnostics 2024, 14, 1787. https://doi.org/10.3390/diagnostics14161787
Deininger K, Korf P, Lauber L, Grimm R, Strecker R, Steinacker J, Lisson CS, Mühling BM, Schmidtke-Schrezenmeier G, Rasche V, et al. From Phantoms to Patients: Improved Fusion and Voxel-Wise Analysis of Diffusion-Weighted Imaging and FDG-Positron Emission Tomography in Positron Emission Tomography/Magnetic Resonance Imaging for Combined Metabolic–Diffusivity Index (cDMI). Diagnostics. 2024; 14(16):1787. https://doi.org/10.3390/diagnostics14161787
Chicago/Turabian StyleDeininger, Katharina, Patrick Korf, Leonard Lauber, Robert Grimm, Ralph Strecker, Jochen Steinacker, Catharina S. Lisson, Bernd M. Mühling, Gerlinde Schmidtke-Schrezenmeier, Volker Rasche, and et al. 2024. "From Phantoms to Patients: Improved Fusion and Voxel-Wise Analysis of Diffusion-Weighted Imaging and FDG-Positron Emission Tomography in Positron Emission Tomography/Magnetic Resonance Imaging for Combined Metabolic–Diffusivity Index (cDMI)" Diagnostics 14, no. 16: 1787. https://doi.org/10.3390/diagnostics14161787