
Cardiovascular Aging and Risk Assessment: How Multimodality Imaging Can Help

Abstract
:1. Introduction
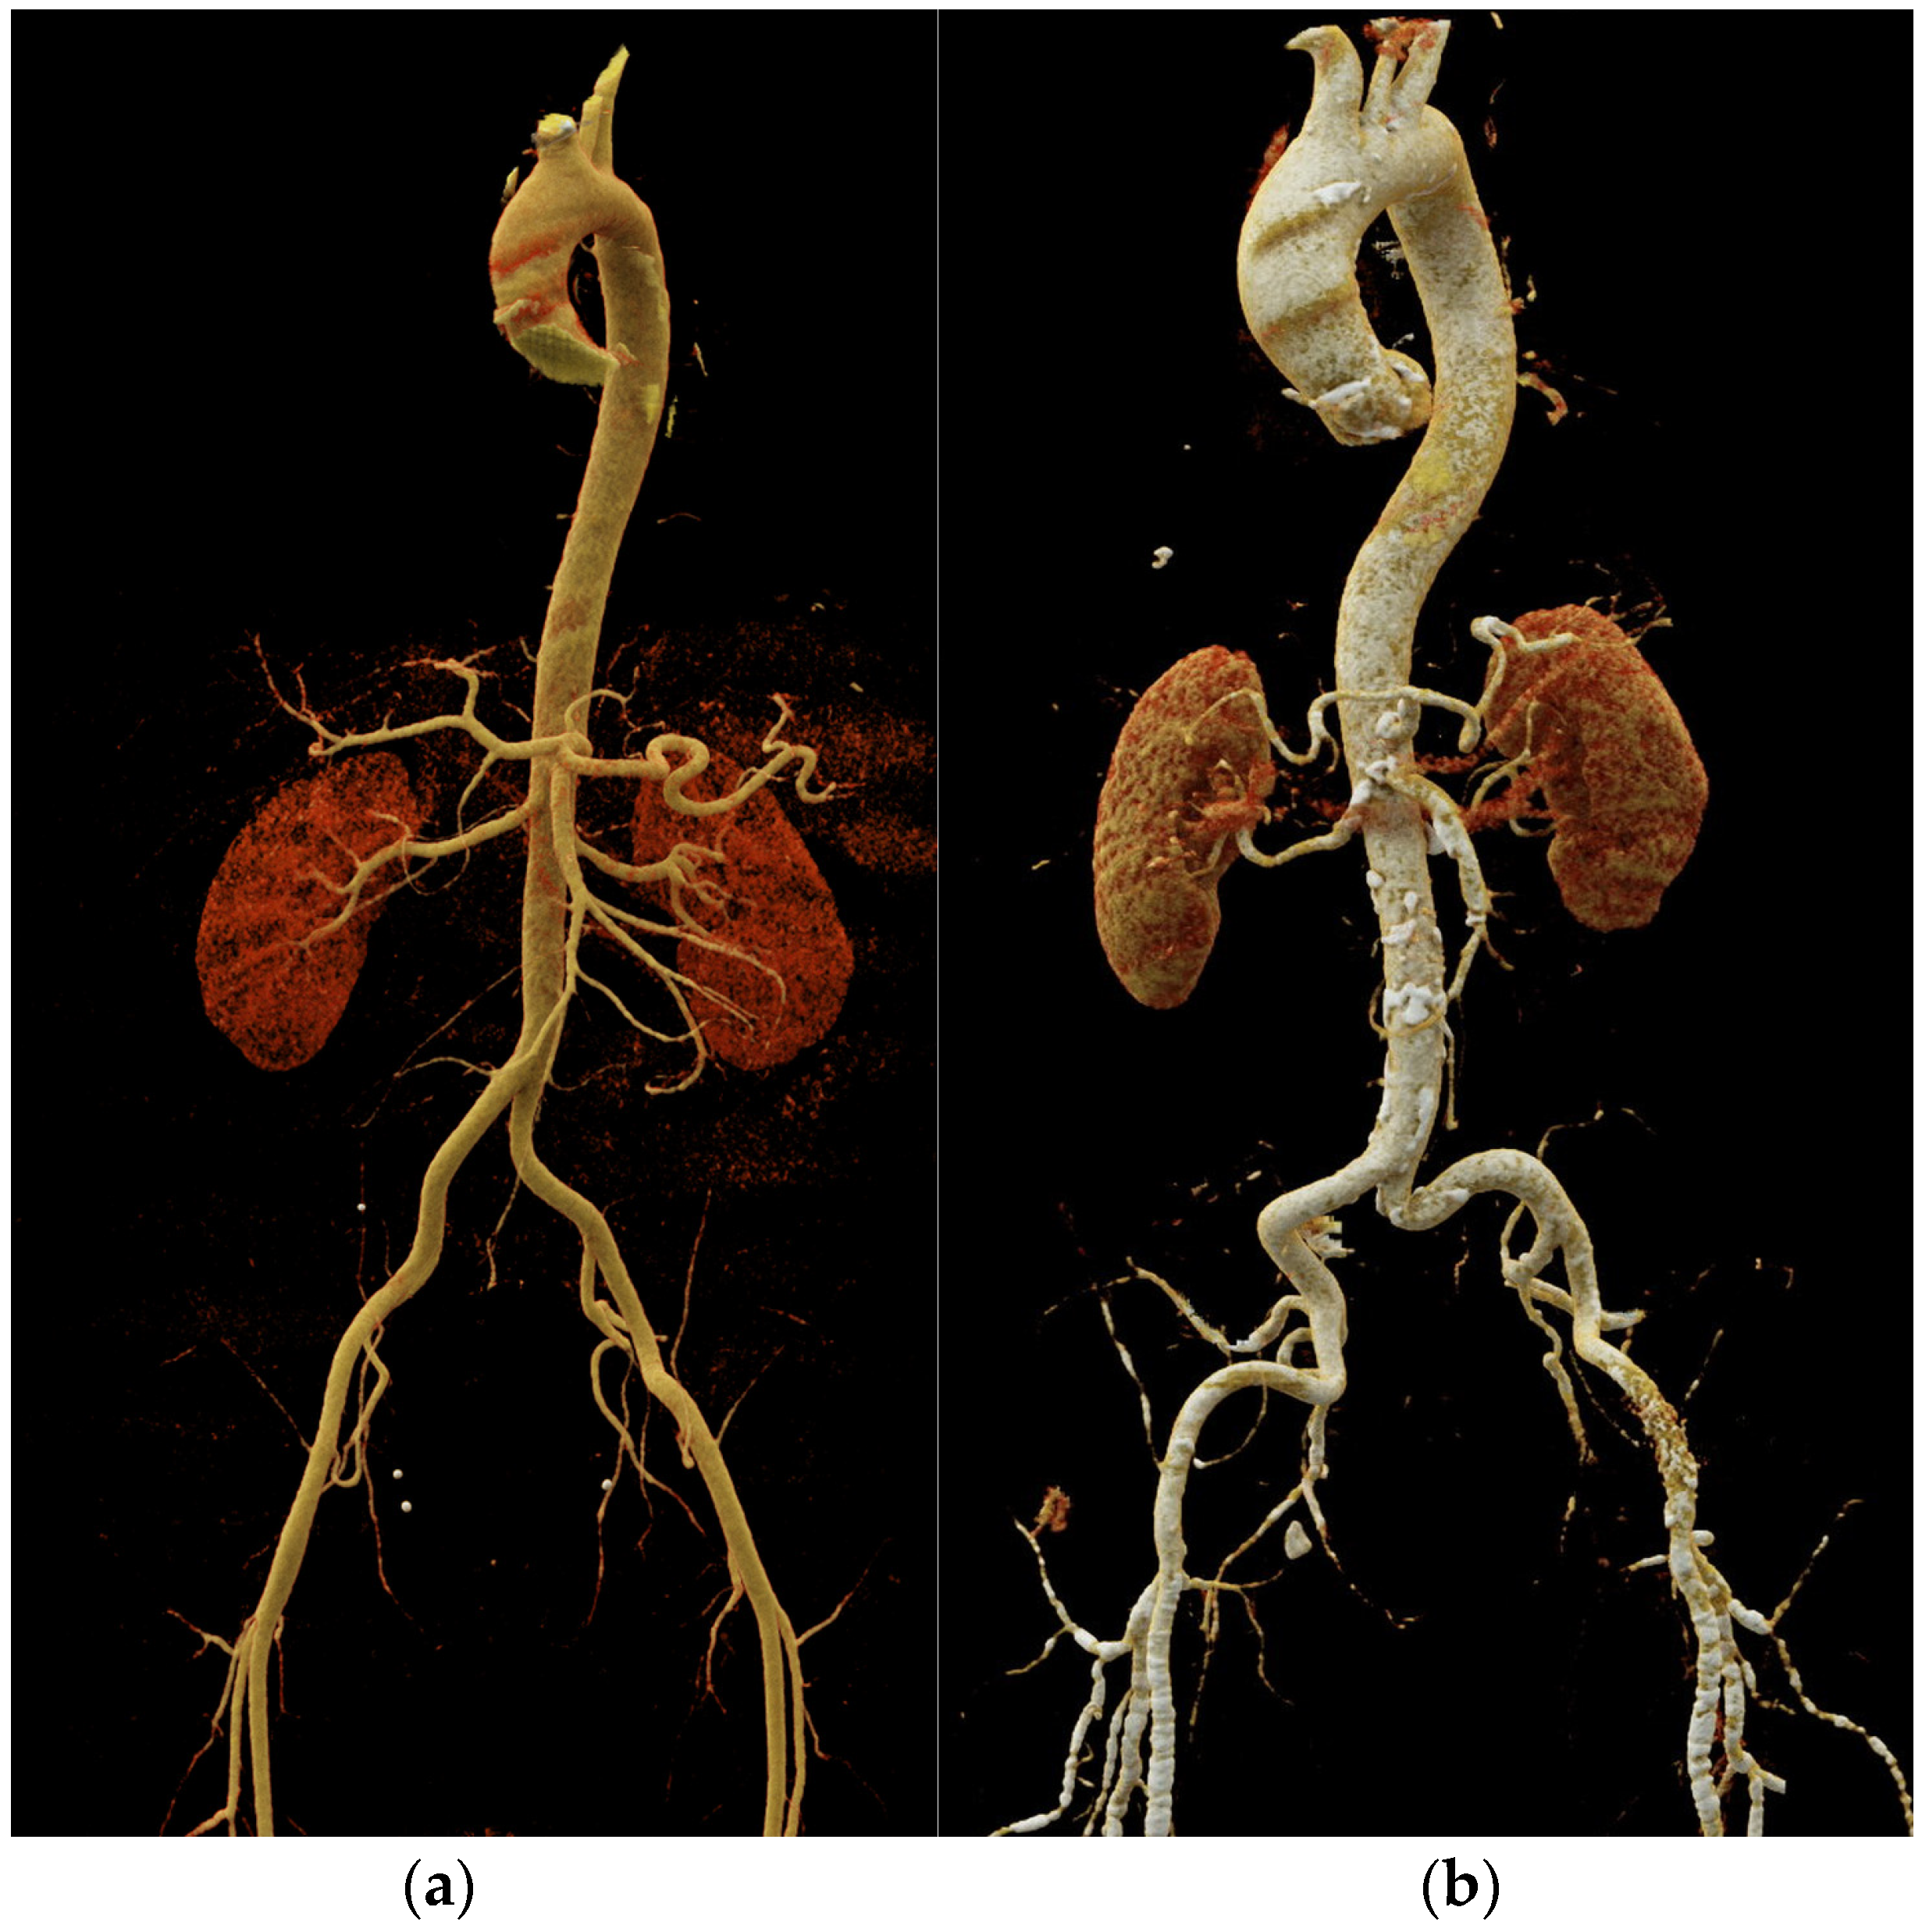
2. Vascular Aging
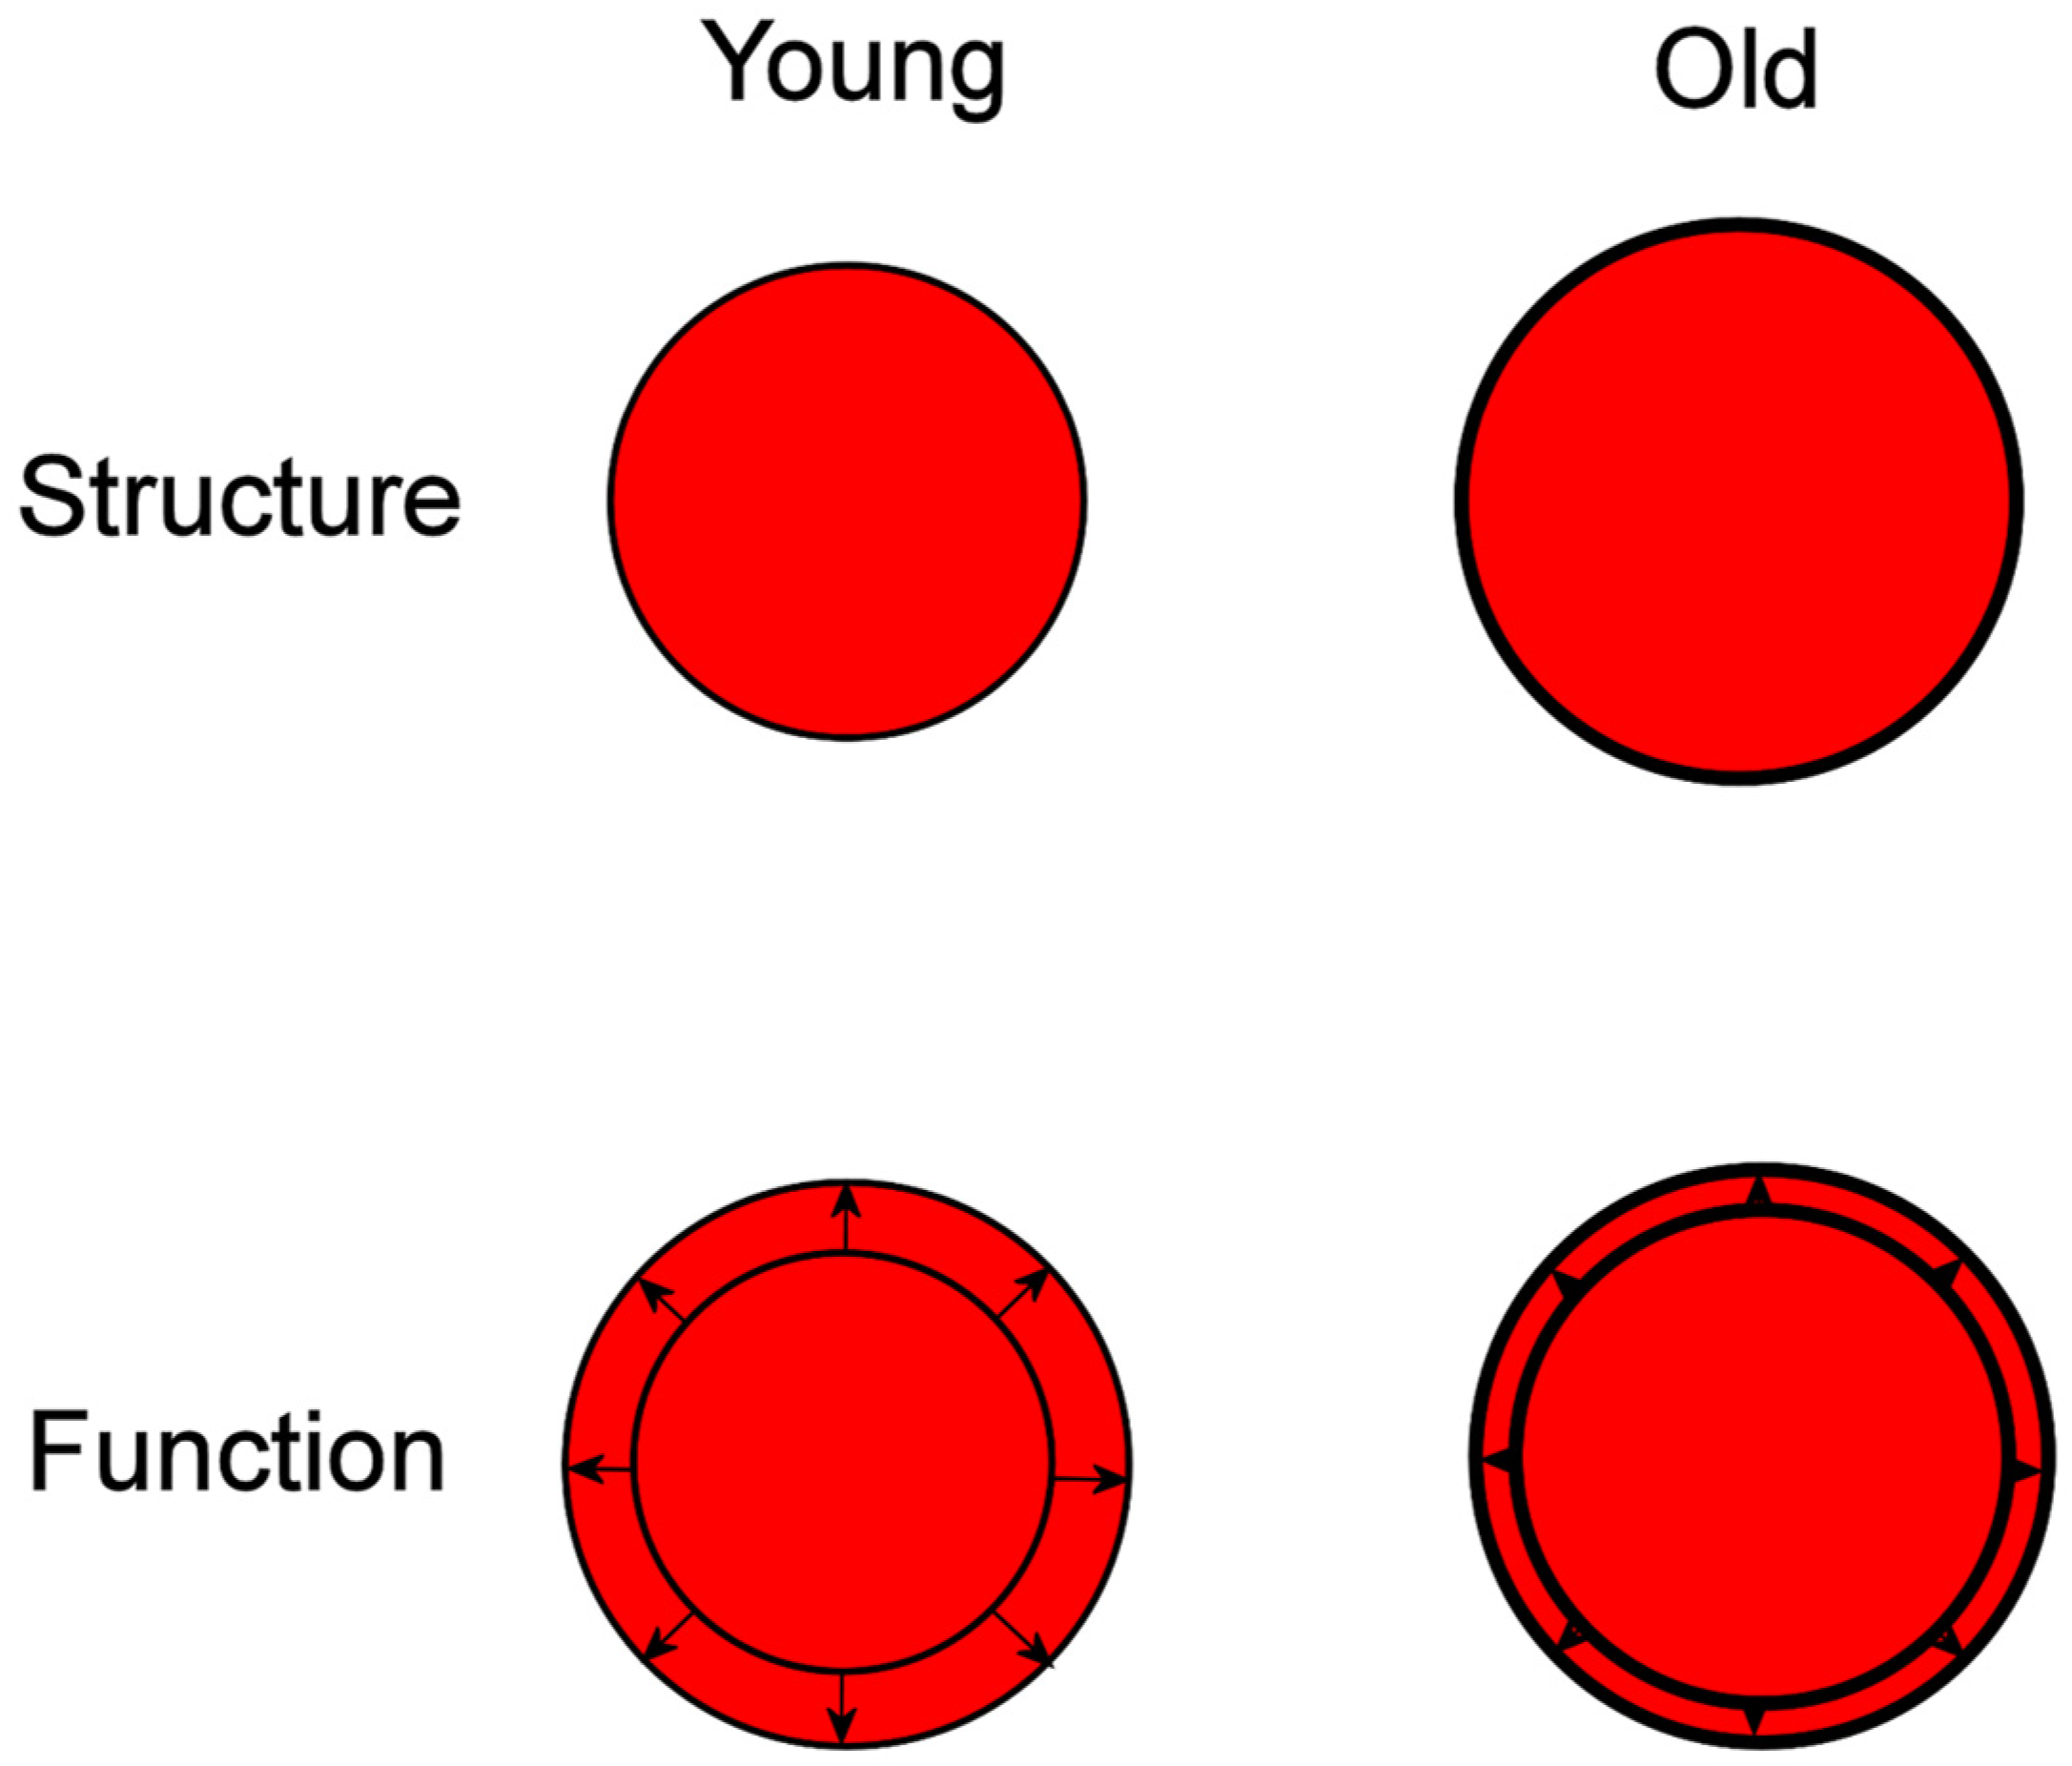
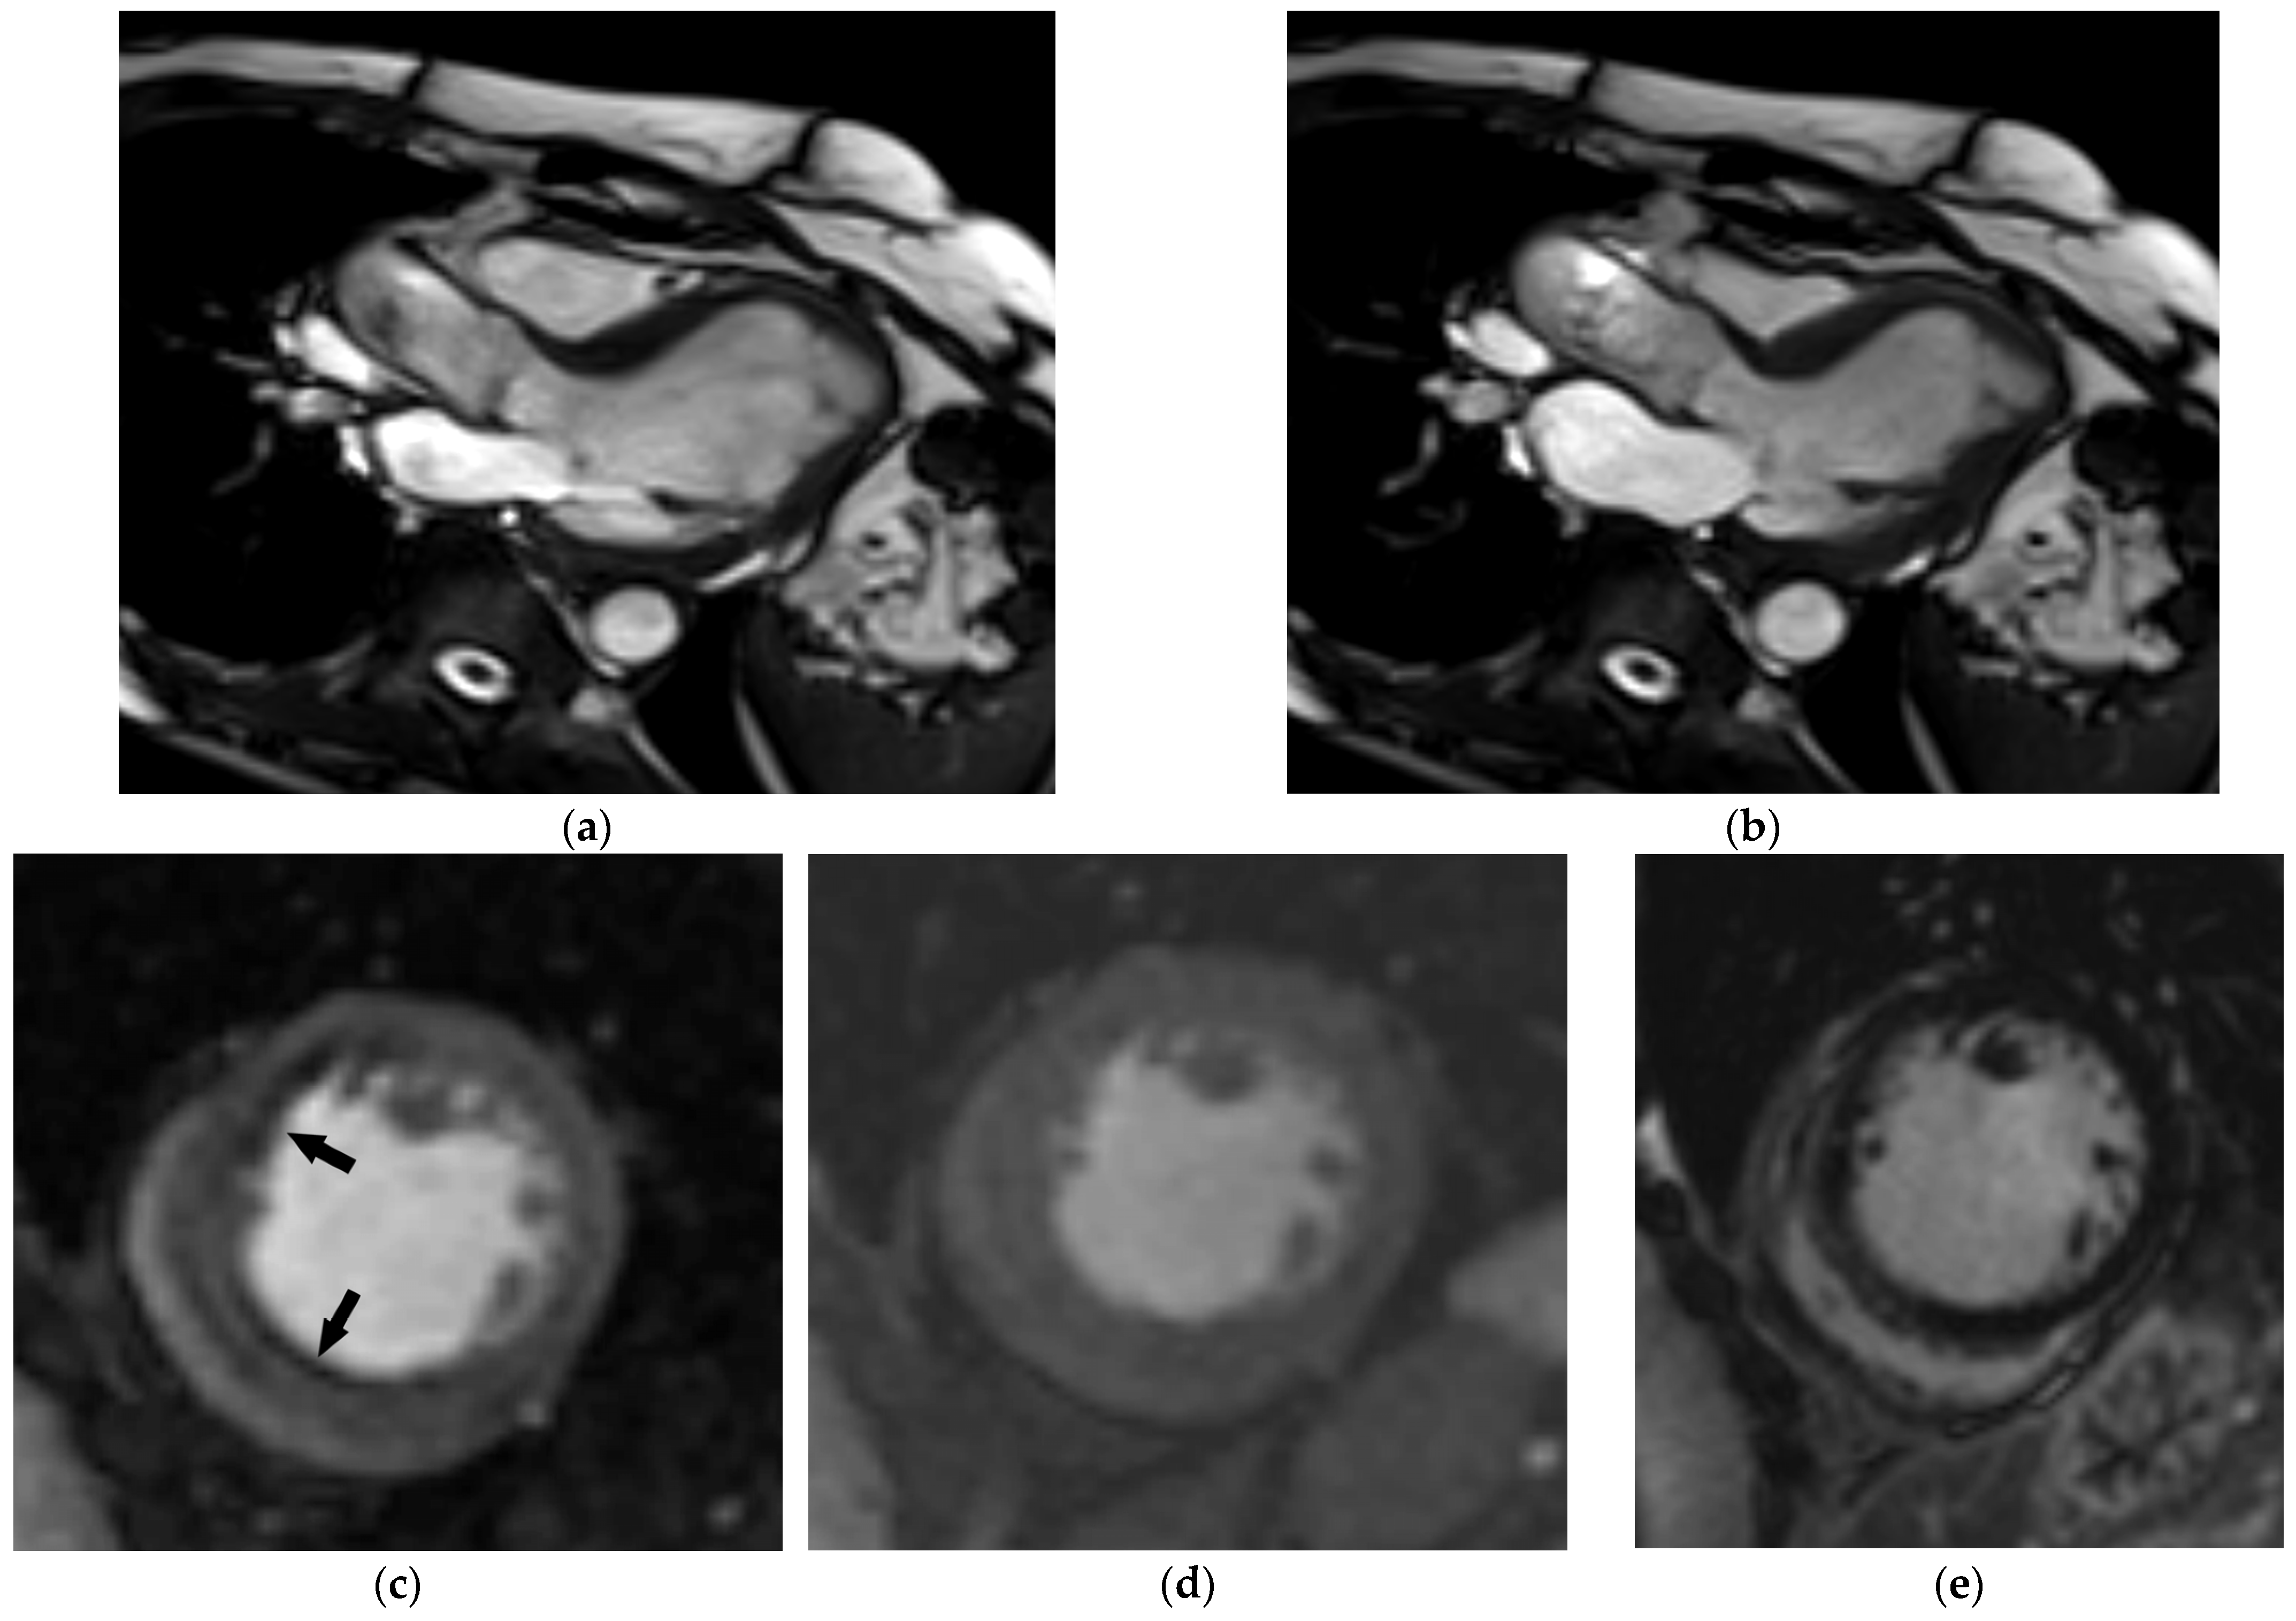
3. Cardiac Aging
4. Standard Cardiovascular Risk Assessment
5. Multimodality Imaging of Cardiovascular Aging with Advanced CVD Risk Assessment
5.1. Ultrasonography and Echocardiography
5.2. Computed Tomography
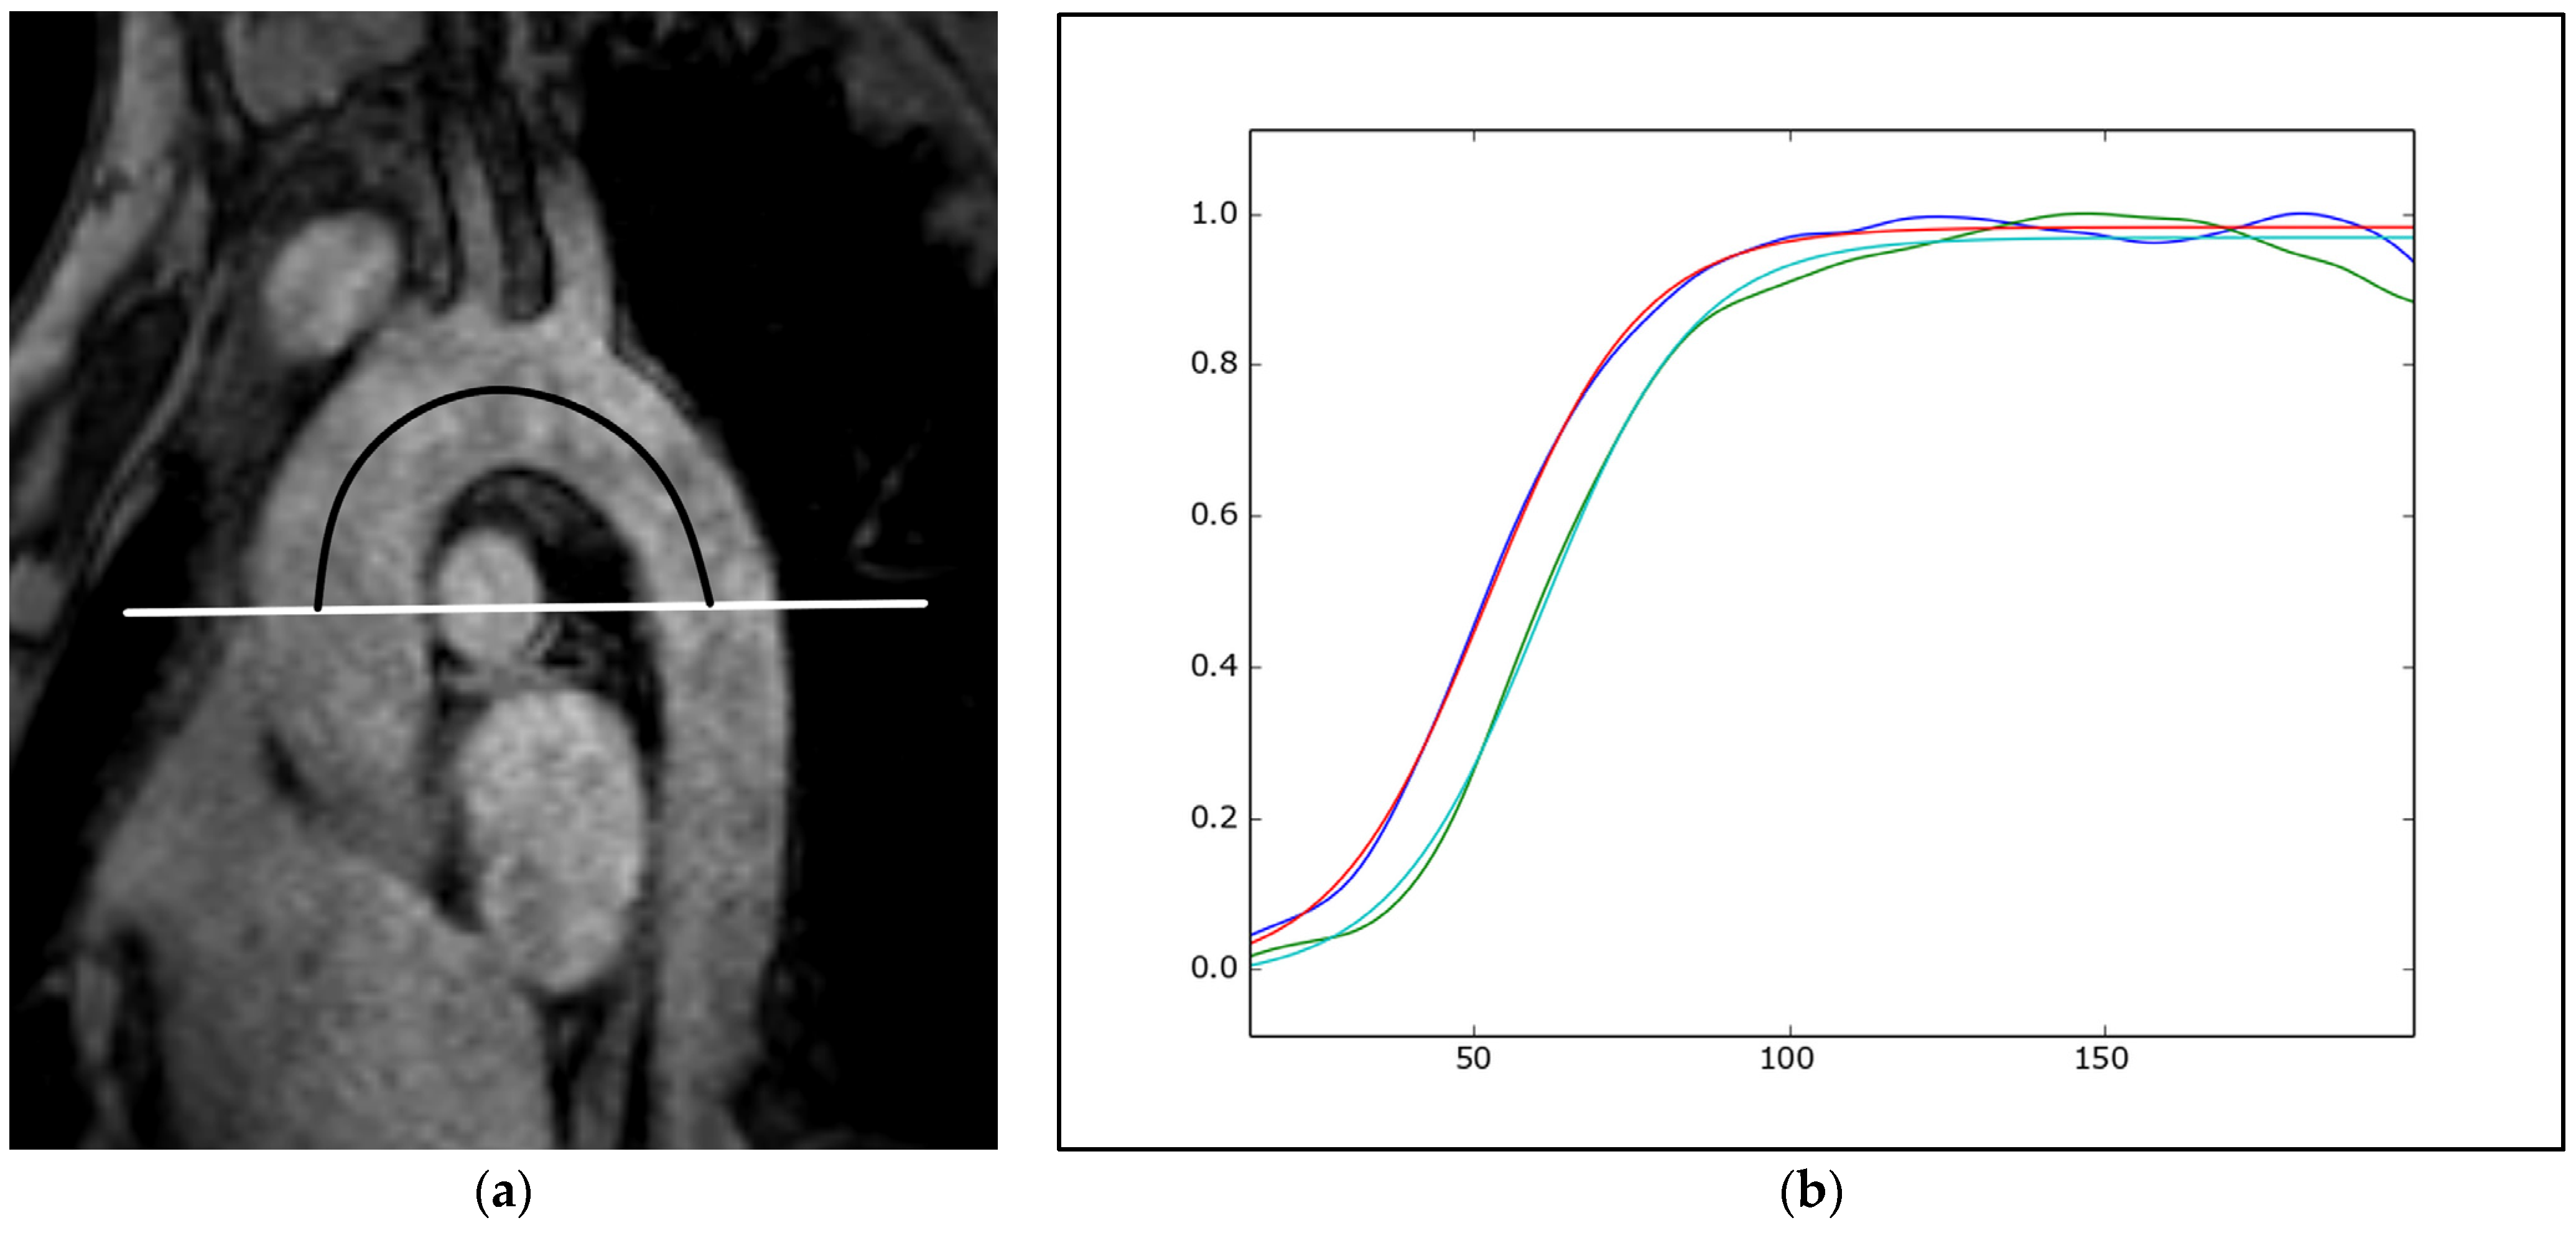
5.3. Magnetic Resonance Imaging

6. Conclusions
7. Future Directions
Author Contributions
Funding
Institutional Review Board Statement
Informed Consent Statement
Data Availability Statement
Conflicts of Interest
References
- Cagigas, M.L.; Twigg, S.M.; Fontana, L. Ten tips for promoting cardiometabolic health and slowing cardiovascular aging. Eur. Heart J. 2024, 45, 1094–1097. [Google Scholar] [CrossRef] [PubMed]
- Tabaei, B.P.; Chamany, S.; Perlman, S.; Thorpe, L.; Bartley, K.; Wu, W.Y. Heart Age, Cardiovascular Disease Risk, and Disparities by Sex and Race/Ethnicity Among New York City Adults. Public Health Rep. 2019, 134, 404–416. [Google Scholar] [CrossRef] [PubMed]
- Visseren, F.L.J.; Mach, F.; Smulders, Y.M.; Carballo, D.; Koskinas, K.C.; Bäck, M.; Benetos, A.; Biffi, A.; Boavida, J.M.; Capodanno, D.; et al. 2021 ESC Guidelines on cardiovascular disease prevention in clinical practice. Eur. Heart J. 2021, 42, 3227–3337. [Google Scholar] [CrossRef] [PubMed]
- Terentes-Printzios, D.; Vlachopoulos, C.; Xaplanteris, P.; Ioakeimidis, N.; Aznaouridis, K.; Baou, K.; Kardara, D.; Georgiopoulos, G.; Georgakopoulos, C.; Tousoulis, D. Cardiovascular Risk Factors Accelerate Progression of Vascular Aging in the General Population: Results From the CRAVE Study (Cardiovascular Risk Factors Affecting Vascular Age). Hypertension 2017, 70, 1057–1064. [Google Scholar] [CrossRef] [PubMed]
- World Health Organization. Ageing and Health. Available online: https://www.who.int/news-room/fact-sheets/detail/ageing-and-health (accessed on 20 June 2024).
- Abdellatif, M.; Rainer, P.P.; Sedej, S.; Kroemer, G. Hallmarks of cardiovascular ageing. Nat. Rev. Cardiol. 2023, 20, 754–777. [Google Scholar] [CrossRef]
- Raisi-Estabragh, Z.; Szabo, L.; Schuermans, A.; Salih, A.M.; Chin, C.W.L.; Vágó, H.; Altmann, A.; Ng, F.S.; Garg, P.; Pavanello, S.; et al. Noninvasive Techniques for Tracking Biological Aging of the Cardiovascular System: JACC Family Series. JACC Cardiovasc. Imaging 2024, 17, 533–551. [Google Scholar] [CrossRef]
- Knuuti, J.; Wijns, W.; Saraste, A.; Capodanno, D.; Barbato, E.; Funck-Brentano, C.; Prescott, E.; Storey, R.F.; Deaton, C.; Cuisset, T.; et al. 2019 ESC Guidelines for the diagnosis and management of chronic coronary syndromes. Eur. Heart J. 2020, 41, 407–477. [Google Scholar] [CrossRef]
- Gulati, M.; Levy, P.D.; Mukherjee, D.; Amsterdam, E.; Bhatt, D.L.; Birtcher, K.K.; Blankstein, R.; Boyd, J.; Bullock-Palmer, R.P.; Conejo, T.; et al. 2021 AHA/ACC/ASE/CHEST/SAEM/SCCT/SCMR Guideline for the Evaluation and Diagnosis of Chest Pain: A Report of the American College of Cardiology/American Heart Association Joint Committee on Clinical Practice Guidelines. Circulation 2021, 144, e368–e454. [Google Scholar] [CrossRef]
- Peralta, C.A.; Adeney, K.L.; Shlipak, M.G.; Jacobs, D., Jr.; Duprez, D.; Bluemke, D.; Polak, J.; Psaty, B.; Kestenbaum, B.R. Structural and functional vascular alterations and incident hypertension in normotensive adults: The Multi-Ethnic Study of Atherosclerosis. Am. J. Epidemiol. 2010, 171, 63–71. [Google Scholar] [CrossRef]
- Bruno, R.M.; Bianchini, E.; Faita, F.; Taddei, S.; Ghiadoni, L. Intima media thickness, pulse wave velocity, and flow mediated dilation. Cardiovasc. Ultrasound 2014, 12, 34. [Google Scholar] [CrossRef]
- Lakatta, E.G. So! What’s aging? Is cardiovascular aging a disease? J. Mol. Cell. Cardiol. 2015, 83, 1–13. [Google Scholar] [CrossRef] [PubMed]
- Lakatta, E.G.; Levy, D. Arterial and cardiac aging: Major shareholders in cardiovascular disease enterprises: Part I: Aging arteries: A “set up” for vascular disease. Circulation 2003, 107, 139–146. [Google Scholar] [CrossRef] [PubMed]
- Kozakova, M.; Palombo, C. Vascular Ageing and Aerobic Exercise. Int. J. Environ. Res. Public Health 2021, 18, 10666. [Google Scholar] [CrossRef]
- Lan, Y.S.; Khong, T.K.; Yusof, A. Effect of Exercise on Arterial Stiffness in Healthy Young, Middle-Aged and Older Women: A Systematic Review. Nutrients 2023, 15, 308. [Google Scholar] [CrossRef] [PubMed]
- Kobayashi, R.; Asaki, K.; Hashiguchi, T.; Negoro, H. Effect of aerobic exercise training frequency on arterial stiffness in middle-aged and elderly females. J. Phys. Ther. Sci. 2022, 34, 347–352. [Google Scholar] [CrossRef]
- O’Rourke, M.; Farnsworth, A.; O’Rourke, J. Aortic dimensions and stiffness in normal adults. JACC Cardiovasc. Imaging 2008, 1, 749–751. [Google Scholar] [CrossRef]
- O’Rourke, M.F.; Nichols, W.W. Aortic diameter, aortic stiffness, and wave reflection increase with age and isolated systolic hypertension. Hypertension 2005, 45, 652–658. [Google Scholar] [CrossRef]
- Sugawara, J.; Hayashi, K.; Yokoi, T.; Tanaka, H. Age-associated elongation of the ascending aorta in adults. JACC Cardiovasc. Imaging 2008, 1, 739–748. [Google Scholar] [CrossRef]
- Adriaans, B.P.; Heuts, S.; Gerretsen, S.; Cheriex, E.C.; Vos, R.; Natour, E.; Maessen, J.G.; Sardari Nia, P.; Crijns, H.J.G.M.; Wildberger, J.E.; et al. Aortic elongation part I: The normal aortic ageing process. Heart 2018, 104, 1772–1777. [Google Scholar] [CrossRef]
- O’Rourke, M.F.; Hashimoto, J. Mechanical factors in arterial aging: A clinical perspective. J. Am. Coll. Cardiol. 2007, 50, 1–13. [Google Scholar] [CrossRef]
- Lanzer, P.; Boehm, M.; Sorribas, V.; Thiriet, M.; Janzen, J.; Zeller, T.; St Hilaire, C.; Shanahan, C. Medial vascular calcification revisited: Review and perspectives. Eur. Heart J. 2014, 35, 1515–1525. [Google Scholar] [CrossRef] [PubMed]
- Oberoi, S.; Schoepf, U.J.; Meyer, M.; Henzler, T.; Rowe, G.W.; Costello, P.; Nance, J.W. Progression of arterial stiffness and coronary atherosclerosis: Longitudinal evaluation by cardiac CT. AJR Am. J. Roentgenol. 2013, 200, 798–804. [Google Scholar] [CrossRef]
- Cheng, D.C.Y.; Climie, R.E.; Shu, M.; Grieve, S.M.; Kozor, R.; Figtree, G.A. Vascular aging and cardiovascular disease: Pathophysiology and measurement in the coronary arteries. Front. Cardiovasc. Med. 2023, 10, 1206156. [Google Scholar] [CrossRef] [PubMed]
- Laurent, S.; Boutouyrie, P.; Cunha, P.G.; Lacolley, P.; Nilsson, P.M. Concept of Extremes in Vascular Aging. Hypertension 2019, 74, 218–228. [Google Scholar] [CrossRef] [PubMed]
- Wilkinson, I.B.; Mäki-Petäjä, K.M.; Mitchell, G.F. Uses of Arterial Stiffness in Clinical Practice. Arter. Thromb. Vasc. Biol. 2020, 40, 1063–1067. [Google Scholar] [CrossRef] [PubMed]
- Mancia, G.; Kreutz, R.; Brunström, M.; Burnier, M.; Grassi, G.; Januszewicz, A.; Muiesan, M.L.; Tsioufis, K.; Agabiti-Rosei, E.; Algharably, E.A.E.; et al. 2023 ESH Guidelines for the management of arterial hypertension the Task Force for the management of arterial hypertension of the European Society of Hypertension: Endorsed by the International Society of Hypertension (ISH) and the European Renal Association (ERA). J. Hypertens. 2023, 41, 1874–2071. [Google Scholar] [CrossRef]
- Arnett, D.K.; Blumenthal, R.S.; Albert, M.A.; Buroker, A.B.; Goldberger, Z.D.; Hahn, E.J.; Himmelfarb, C.D.; Khera, A.; Lloyd-Jones, D.; McEvoy, J.W.; et al. 2019 ACC/AHA Guideline on the Primary Prevention of Cardiovascular Disease: A Report of the American College of Cardiology/American Heart Association Task Force on Clinical Practice Guidelines. Circulation 2019, 140, e596–e646. [Google Scholar] [CrossRef]
- Parikh, J.D.; Hollingsworth, K.G.; Kunadian, V.; Blamire, A.; MacGowan, G.A. Measurement of pulse wave velocity in normal ageing: Comparison of Vicorder and magnetic resonance phase contrast imaging. BMC Cardiovasc. Disord. 2016, 16, 50. [Google Scholar] [CrossRef]
- Baier, D.; Teren, A.; Wirkner, K.; Loeffler, M.; Scholz, M. Parameters of pulse wave velocity: Determinants and reference values assessed in the population-based study LIFE-Adult. Clin. Res. Cardiol. 2018, 107, 1050–1061. [Google Scholar] [CrossRef]
- Díaz, A.; Galli, C.; Tringler, M.; Ramírez, A.; Cabrera Fischer, E.I. Reference values of pulse wave velocity in healthy people from an urban and rural argentinean population. Int. J. Hypertens. 2014, 2014, 653239. [Google Scholar] [CrossRef]
- van Hout, M.J.; Dekkers, I.A.; Westenberg, J.J.; Schalij, M.J.; Widya, R.L.; de Mutsert, R.; Rosendaal, F.R.; de Roos, A.; Jukema, J.W.; Scholte, A.J.; et al. Normal and reference values for cardiovascular magnetic resonance-based pulse wave velocity in the middle-aged general population. J. Cardiovasc. Magn. Reason. 2021, 23, 46. [Google Scholar] [CrossRef]
- Kwak, H.B. Effects of aging and exercise training on apoptosis in the heart. J. Exerc. Rehabil. 2013, 9, 212–219. [Google Scholar] [CrossRef]
- Pokharel, P.; Bella, J.N. Regression of left ventricular hypertrophy: Lessons from clinical trials. OA Evid.-Based Med. 2013, 1, 13. [Google Scholar] [CrossRef]
- Lakatta, E.G.; Levy, D. Arterial and cardiac aging: Major shareholders in cardiovascular disease enterprises: Part II: The aging heart in health: Links to heart disease. Circulation 2003, 107, 346–354. [Google Scholar] [CrossRef]
- Shioi, T.; Inuzuka, Y. Aging as a substrate of heart failure. J. Cardiol. 2012, 60, 423–428. [Google Scholar] [CrossRef] [PubMed]
- Forman, D.E.; de Lemos, J.A.; Shaw, L.J.; Reuben, D.B.; Lyubarova, R.; Peterson, E.D.; Spertus, J.A.; Zieman, S.; Salive, M.E.; Rich, M.W.; et al. Cardiovascular Biomarkers and Imaging in Older Adults: JACC Council Perspectives. J. Am. Coll. Cardiol. 2020, 76, 1577–1594. [Google Scholar] [CrossRef]
- Lloyd-Jones, D.M.; Wang, T.J.; Leip, E.P.; Larson, M.G.; Levy, D.; Vasan, R.S.; D’Agostino, R.B.; Massaro, J.M.; Beiser, A.; Wolf, P.A.; et al. Lifetime risk for development of atrial fibrillation: The Framingham Heart Study. Circulation 2004, 110, 1042–1046. [Google Scholar] [CrossRef] [PubMed]
- Ji, H.; Kwan, A.C.; Chen, M.T.; Ouyang, D.; Ebinger, J.E.; Bell, S.P.; Niiranen, T.J.; Bello, N.A.; Cheng, S. Sex Differences in Myocardial and Vascular Aging. Circ. Res. 2022, 130, 566–577. [Google Scholar] [CrossRef] [PubMed]
- Kuklina, E.V. Assessing and managing risk for cardiovascular disease: A worldwide perspective. N. Am. J. Med. Sci. 2010, 3, 94–103. [Google Scholar] [CrossRef]
- Rajendran, A.; Minhas, A.S.; Kazzi, B.; Varma, B.; Choi, E.; Thakkar, A.; Michos, E.D. Sex-specific differences in cardiovascular risk factors and implications for cardiovascular disease prevention in women. Atherosclerosis 2023, 384, 117269. [Google Scholar] [CrossRef]
- Jeffers, A.M.; Glantz, S.; Byers, A.L.; Keyhani, S. Association of Cannabis Use With Cardiovascular Outcomes Among US Adults. J. Am. Heart Assoc. 2024, 13, e030178. [Google Scholar] [CrossRef]
- Hageman, S.H.J.; Petitjaen, C.; Pennells, L.; Kaptoge, S.; Pajouheshnia, R.; Tillmann, T.; Blaha, M.J.; McClelland, R.L.; Matsushita, K.; Nambi, V.; et al. Improving 10-year cardiovascular risk prediction in apparently healthy people: Flexible addition of risk modifiers on top of SCORE2. Eur. J. Prev. Cardiol. 2023, 30, 1705–1714. [Google Scholar] [CrossRef] [PubMed]
- Vecsey-Nagy, M.; Szilveszter, B.; Kolossváry, M.; Boussoussou, M.; Vattay, B.; Merkely, B.; Maurovich-Horvat, P.; Radovits, T.; Nemcsik, J. Correlation between Coronary Artery Calcium- and Different Cardiovascular Risk Score-Based Methods for the Estimation of Vascular Age in Caucasian Patients. J. Clin. Med. 2022, 11, 1111. [Google Scholar] [CrossRef]
- Li, C.; Liu, X.; Shen, P.; Sun, Y.; Zhou, T.; Chen, W.; Chen, Q.; Lin, H.; Tang, X.; Gao, P. Improving cardiovascular risk prediction through machine learning modelling of irregularly repeated electronic health records. Eur. Heart J. Digit. Health 2024, 5, 30–40. [Google Scholar] [CrossRef] [PubMed]
- Stein, J.H.; Korcarz, C.E.; Hurst, R.T.; Lonn, E.; Kendall, C.B.; Mohler, E.R.; Najjar, S.S.; Rembold, C.M.; Post, W.S.; American Society of Echocardiography Carotid Intima-Media Thickness Task Force. Use of carotid ultrasound to identify subclinical vascular disease and evaluate cardiovascular disease risk: A consensus statement from the American Society of Echocardiography Carotid Intima-Media Thickness Task Force. Endorsed by the Society for Vascular Medicine. J. Am. Soc. Echocardiogr. 2008, 21, 93–111, quiz 189–190. [Google Scholar] [CrossRef] [PubMed]
- Folsom, A.R.; Kronmal, R.A.; Detrano, R.C.; O’Leary, D.H.; Bild, D.E.; Bluemke, D.A.; Budoff, M.J.; Liu, K.; Shea, S.; Szklo, M.; et al. Coronary artery calcification compared with carotid intima-media thickness in the prediction of cardiovascular disease incidence: The Multi-Ethnic Study of Atherosclerosis (MESA). Arch. Intern. Med. 2008, 168, 1333–1339. [Google Scholar] [CrossRef]
- Den Ruijter, H.M.; Peters, S.A.; Anderson, T.J.; Britton, A.R.; Dekker, J.M.; Eijkemans, M.J.; Engstrom, G.; Evans, G.W.; de Graaf, J.; Grobbee, D.E.; et al. Common carotid intima-media thickness measurements in cardiovascular risk prediction: A meta-analysis. JAMA 2012, 308, 796–803. [Google Scholar] [CrossRef]
- Raitakari, O.T.; Magnussen, C.G.; Juonala, M.; Kartiosuo, N.; Pahkala, K.; Rovio, S.; Koskinen, J.S.; Mykkänen, J.; Laitinen, T.P.; Kähönen, M.; et al. Subclinical atherosclerosis in young adults predicting cardiovascular disease: The Cardiovascular Risk in Young Finns Study. Atherosclerosis 2024, 393, 117515. [Google Scholar] [CrossRef] [PubMed]
- Ganau, A.; Orrù, M.; Floris, M.; Saba, P.S.; Loi, F.; Sanna, G.D.; Marongiu, M.; Balaci, L.; Curreli, N.; Ferreli, L.A.P.; et al. Echocardiographic heart ageing patterns predict cardiovascular and non-cardiovascular events and reflect biological age: The SardiNIA study. Eur. J. Prev. Cardiol. 2024, 31, 677–685. [Google Scholar] [CrossRef]
- Leong, D.P.; Delgado, V.; Bax, J.J. Imaging for atrial fibrillation. Curr. Probl. Cardiol. 2012, 37, 7–33. [Google Scholar] [CrossRef]
- Cho, J.Y.; Kim, K.H. Evaluation of Arterial Stiffness by Echocardiography: Methodological Aspects. Chonnam Med. J. 2016, 52, 101–106. [Google Scholar] [CrossRef]
- Agatston, A.S.; Janowitz, W.R.; Hildner, F.J.; Zusmer, N.R.; Viamonte, M.; Detrano, R. Quantification of coronary artery calcium using ultrafast computed tomography. J. Am. Coll. Cardiol. 1990, 15, 827–832. [Google Scholar] [CrossRef]
- Budoff, M.J.; Achenbach, S.; Blumenthal, R.S.; Carr, J.J.; Goldin, J.G.; Greenland, P.; Guerci, A.D.; Lima, J.A.; Rader, D.J.; Rubin, G.D.; et al. Assessment of coronary artery disease by cardiac computed tomography: A scientific statement from the American Heart Association Committee on Cardiovascular Imaging and Intervention, Council on Cardiovascular Radiology and Intervention, and Committee on Cardiac Imaging, Council on Clinical Cardiology. Circulation 2006, 114, 1761–1791. [Google Scholar] [CrossRef] [PubMed]
- Alluri, K.; Joshi, P.H.; Henry, T.S.; Blumenthal, R.S.; Nasir, K.; Blaha, M.J. Scoring of coronary artery calcium scans: History, assumptions, current limitations, and future directions. Atherosclerosis 2015, 239, 109–117. [Google Scholar] [CrossRef] [PubMed]
- Hecht, H.S.; Blaha, M.J.; Kazerooni, E.A.; Cury, R.C.; Budoff, M.; Leipsic, J.; Shaw, L. CAC-DRS: Coronary Artery Calcium Data and Reporting System. An expert consensus document of the Society of Cardiovascular Computed Tomography (SCCT). J. Cardiovasc. Comput. Tomogr. 2018, 12, 185–191. [Google Scholar] [CrossRef]
- Greenland, P.; Alpert, J.S.; Beller, G.A.; Benjamin, E.J.; Budoff, M.J.; Fayad, Z.A.; Foster, E.; Hlatky, M.A.; Hodgson, J.M.; Kushner, F.G.; et al. 2010 ACCF/AHA guideline for assessment of cardiovascular risk in asymptomatic adults: A report of the American College of Cardiology Foundation/American Heart Association Task Force on Practice Guidelines. Circulation 2010, 122, e584–e636. [Google Scholar] [CrossRef] [PubMed]
- Alani, A.; Budoff, M.J. Coronary calcium scoring and computed tomography angiography: Current indications, future applications. Coron. Artery Dis. 2014, 25, 529–539. [Google Scholar] [CrossRef]
- van Praagh, G.D.; Wang, J.; van der Werf, N.R.; Greuter, M.J.W.; Mastrodicasa, D.; Nieman, K.; van Hamersvelt, R.W.; Oostveen, L.J.; de Lange, F.; Slart, R.H.J.A.; et al. Coronary Artery Calcium Scoring: Toward a New Standard. Investig. Radiol. 2022, 57, 13–22. [Google Scholar] [CrossRef]
- Shah, N.R.; Coulter, S.A. An evidence-based guide for coronary calcium scoring in asymptomatic patients without coronary heart disease. Tex. Heart Inst. J. 2012, 39, 240–242. [Google Scholar] [PubMed]
- Greenland, P.; Bonow, R.O.; Brundage, B.H.; Budoff, M.J.; Eisenberg, M.J.; Grundy, S.M.; Lauer, M.S.; Post, W.S.; Raggi, P.; Redberg, R.F.; et al. ACCF/AHA 2007 clinical expert consensus document on coronary artery calcium scoring by computed tomography in global cardiovascular risk assessment and in evaluation of patients with chest pain: A report of the American College of Cardiology Foundation Clinical Expert Consensus Task Force (ACCF/AHA Writing Committee to Update the 2000 Expert Consensus Document on Electron Beam Computed Tomography). Circulation 2007, 115, 402–426. [Google Scholar] [CrossRef]
- Sheppard, J.P.; Lakshmanan, S.; Lichtenstein, S.J.; Budoff, M.J.; Roy, S.K. Age and the power of zero CAC in cardiac risk assessment: Overview of the literature and a cautionary case. Br. J. Cardiol. 2022, 29, 23. [Google Scholar] [CrossRef] [PubMed]
- Grandhi, G.R.; Mirbolouk, M.; Dardari, Z.A.; Al-Mallah, M.H.; Rumberger, J.A.; Shaw, L.J.; Blankstein, R.; Miedema, M.D.; Berman, D.S.; Budoff, M.J.; et al. Interplay of Coronary Artery Calcium and Risk Factors for Predicting CVD/CHD Mortality: The CAC Consortium. JACC Cardiovasc. Imaging 2020, 13, 1175–1186. [Google Scholar] [CrossRef]
- Whelton, S.P.; Blaha, M.J. Coronary artery calcium: From risk prediction to treatment allocation and clinical trials. Heart 2023, 109, 1714–1721. [Google Scholar] [CrossRef] [PubMed]
- Polonsky, T.S.; McClelland, R.L.; Jorgensen, N.W.; Bild, D.E.; Burke, G.L.; Guerci, A.D.; Greenland, P. Coronary artery calcium score and risk classification for coronary heart disease prediction. JAMA 2010, 303, 1610–1616. [Google Scholar] [CrossRef] [PubMed]
- Sandoval, Y.; Bielinski, S.J.; Daniels, L.B.; Blaha, M.J.; Michos, E.D.; DeFilippis, A.P.; Szklo, M.; deFilippi, C.; Larson, N.B.; Decker, P.A.; et al. Atherosclerotic Cardiovascular Disease Risk Stratification Based on Measurements of Troponin and Coronary Artery Calcium. J. Am. Coll. Cardiol. 2020, 76, 357–370. [Google Scholar] [CrossRef]
- Miname, M.H.; Bittencourt, M.S.; Pereira, A.C.; Jannes, C.E.; Krieger, J.E.; Nasir, K.; Santos, R.D. Vascular age derived from coronary artery calcium score on the risk stratification of individuals with heterozygous familial hypercholesterolaemia. Eur. Heart J. Cardiovasc. Imaging 2020, 21, 251–257. [Google Scholar] [CrossRef]
- Mamudu, H.M.; Paul, T.K.; Veeranki, S.P.; Budoff, M. The effects of coronary artery calcium screening on behavioral modification, risk perception, and medication adherence among asymptomatic adults: A systematic review. Atherosclerosis 2014, 236, 338–350. [Google Scholar] [CrossRef]
- Peters, S.A.; den Ruijter, H.M.; Bots, M.L.; Moons, K.G. Improvements in risk stratification for the occurrence of cardiovascular disease by imaging subclinical atherosclerosis: A systematic review. Heart 2012, 98, 177–184. [Google Scholar] [CrossRef]
- Golub, I.S.; Termeie, O.G.; Kristo, S.; Schroeder, L.P.; Lakshmanan, S.; Shafter, A.M.; Hussein, L.; Verghese, D.; Aldana-Bitar, J.; Manubolu, V.S.; et al. Major Global Coronary Artery Calcium Guidelines. JACC Cardiovasc. Imaging 2023, 16, 98–117. [Google Scholar] [CrossRef]
- MESA Risk Score and Coronary Age Calculator. Available online: http://www.mesa-nhlbi.org/Calcium/ArterialAge.aspx (accessed on 22 June 2024).
- Onnis, C.; Muscogiuri, G.; Cademartiri, F.; Fanni, D.; Faa, G.; Gerosa, C.; Mannelli, L.; Suri, J.S.; Sironi, S.; Montisci, R.; et al. Non-invasive coronary imaging in elderly population. Eur. J. Radiol. 2023, 162, 110794. [Google Scholar] [CrossRef]
- Cho, I.; Al’Aref, S.J.; Berger, A.; Hartaigh, B.Ó.; Gransar, H.; Valenti, V.; Lin, F.Y.; Achenbach, S.; Berman, D.S.; Budoff, M.J.; et al. Prognostic value of coronary computed tomographic angiography findings in asymptomatic individuals: A 6-year follow-up from the prospective multicentre international CONFIRM study. Eur. Heart J. 2018, 39, 934–941. [Google Scholar] [CrossRef]
- Meah, M.N.; Maurovich-Horvat, P.; Williams, M.C.; Newby, D.E. Debates in cardiac CT: Coronary CT angiography is the best test in asymptomatic patients. J. Cardiovasc. Comput. Tomogr. 2022, 16, 290–293. [Google Scholar] [CrossRef]
- Dell’Aversana, S.; Ascione, R.; De Giorgi, M.; De Lucia, D.R.; Cuocolo, R.; Boccalatte, M.; Sibilio, G.; Napolitano, G.; Muscogiuri, G.; Sironi, S.; et al. Dual-Energy CT of the Heart: A Review. J. Imaging 2022, 8, 236. [Google Scholar] [CrossRef] [PubMed]
- Cetin, T.; Kantarci, M.; Irgul, B.; Aydin, S.; Aydin, F.; Koseturk, T.; Levent, A. Quadruple-Rule-Out Computed Tomography Angiography (QRO-CT): A Novel Dual-Energy Computed Tomography Technique for the Diagnostic Work-Up of Acute Chest Pain. Diagnostics 2023, 13, 2799. [Google Scholar] [CrossRef] [PubMed]
- Pack, J.D.; Xu, M.; Wang, G.; Baskaran, L.; Min, J.; De Man, B. Cardiac CT blooming artifacts: Clinical significance, root causes and potential solutions. Vis. Comput. Ind. Biomed. Art. 2022, 5, 29. [Google Scholar] [CrossRef]
- Tonet, E.; Amantea, V.; Lapolla, D.; Assabbi, P.; Boccadoro, A.; Berloni, M.L.; Micillo, M.; Marchini, F.; Chiarello, S.; Cossu, A.; et al. Cardiac Computed Tomography in Monitoring Revascularization. J. Clin. Med. 2023, 12, 7104. [Google Scholar] [CrossRef] [PubMed]
- Bianchini, E.; Lønnebakken, M.T.; Wohlfahrt, P.; Piskin, S.; Terentes-Printzios, D.; Alastruey, J.; Guala, A. Magnetic Resonance Imaging and Computed Tomography for the Noninvasive Assessment of Arterial Aging: A Review by the VascAgeNet COST Action. J. Am. Heart Assoc. 2023, 12, e027414. [Google Scholar] [CrossRef]
- Mileto, A.; Heye, T.J.; Makar, R.A.; Hurwitz, L.M.; Marin, D.; Boll, D.T. Regional Mapping of Aortic Wall Stress by Using Deformable, Motion-coherent Modeling based on Electrocardiography-gated Multidetector CT Angiography: Feasibility Study. Radiology 2016, 280, 230–236. [Google Scholar] [CrossRef]
- Kersten, J.; Hackenbroch, C.; Bouly, M.; Tyl, B.; Bernhardt, P. What Is Normal for an Aging Heart?: A Prospective CMR Cohort Study. J. Cardiovasc. Imaging 2022, 30, 202–211. [Google Scholar] [CrossRef]
- Paterson, I.; Mielniczuk, L.M.; O’Meara, E.; So, A.; White, J.A. Imaging heart failure: Current and future applications. Can. J. Cardiol. 2013, 29, 317–328. [Google Scholar] [CrossRef]
- Armstrong, A.C.; Gidding, S.; Gjesdal, O.; Wu, C.; Bluemke, D.A.; Lima, J.A. LV mass assessed by echocardiography and CMR, cardiovascular outcomes, and medical practice. JACC Cardiovasc. Imaging 2012, 5, 837–848. [Google Scholar] [CrossRef] [PubMed]
- Raisi-Estabragh, Z.; Salih, A.; Gkontra, P.; Atehortúa, A.; Radeva, P.; Boscolo Galazzo, I.; Menegaz, G.; Harvey, N.C.; Lekadir, K.; Petersen, S.E. Estimation of biological heart age using cardiovascular magnetic resonance radiomics. Sci. Rep. 2022, 12, 12805. [Google Scholar] [CrossRef]
- Shah, M.; de A Inácio, M.H.; Lu, C.; Schiratti, P.R.; Zheng, S.L.; Clement, A.; de Marvao, A.; Bai, W.; King, A.P.; Ware, J.S.; et al. Environmental and genetic predictors of human cardiovascular ageing. Nat. Commun. 2023, 14, 4941. [Google Scholar] [CrossRef]
- Koh, A.S.; Gao, F.; Leng, S.; Kovalik, J.P.; Zhao, X.; Tan, R.S.; Fridianto, K.T.; Ching, J.; Chua, S.J.; Yuan, J.M.; et al. Dissecting Clinical and Metabolomics Associations of Left Atrial Phasic Function by Cardiac Magnetic Resonance Feature Tracking. Sci. Rep. 2018, 8, 8138. [Google Scholar] [CrossRef]
- Salih, A.M.; Pujadas, E.R.; Campello, V.M.; McCracken, C.; Harvey, N.C.; Neubauer, S.; Lekadir, K.; Nichols, T.E.; Petersen, S.E.; Raisi-Estabragh, Z. Image-Based Biological Heart Age Estimation Reveals Differential Aging Patterns Across Cardiac Chambers. J. Magn. Reson. Imaging 2023, 58, 1797–1812. [Google Scholar] [CrossRef] [PubMed]
- Rosmini, S.; Bulluck, H.; Captur, G.; Treibel, T.A.; Abdel-Gadir, A.; Bhuva, A.N.; Culotta, V.; Merghani, A.; Fontana, M.; Maestrini, V.; et al. Myocardial native T1 and extracellular volume with healthy ageing and gender. Eur. Heart J. Cardiovasc. Imaging 2018, 19, 615–621. [Google Scholar] [CrossRef] [PubMed]
- Neilan, T.G.; Coelho-Filho, O.R.; Shah, R.V.; Abbasi, S.A.; Heydari, B.; Watanabe, E.; Chen, Y.; Mandry, D.; Pierre-Mongeon, F.; Blankstein, R.; et al. Myocardial extracellular volume fraction from T1 measurements in healthy volunteers and mice: Relationship to aging and cardiac dimensions. JACC Cardiovasc. Imaging 2013, 6, 672–683. [Google Scholar] [CrossRef]
- Liu, C.Y.; Liu, Y.C.; Wu, C.; Armstrong, A.; Volpe, G.J.; van der Geest, R.J.; Liu, Y.; Hundley, W.G.; Gomes, A.S.; Liu, S.; et al. Evaluation of age-related interstitial myocardial fibrosis with cardiac magnetic resonance contrast-enhanced T1 mapping: MESA (Multi-Ethnic Study of Atherosclerosis). J. Am. Coll. Cardiol. 2013, 62, 1280–1287. [Google Scholar] [CrossRef]
- Gilstrap, L.G.; Dominici, F.; Wang, Y.; El-Sady, M.S.; Singh, A.; Di Carli, M.F.; Falk, R.H.; Dorbala, S. Epidemiology of Cardiac Amyloidosis-Associated Heart Failure Hospitalizations Among Fee-for-Service Medicare Beneficiaries in the United States. Circ. Heart Fail. 2019, 12, e005407. [Google Scholar] [CrossRef]
- Li, W.; Uppal, D.; Wang, Y.C.; Xu, X.; Kokkinidis, D.G.; Travin, M.I.; Tauras, J.M. Nuclear Imaging for the Diagnosis of Cardiac Amyloidosis in 2021. Diagnostics 2021, 11, 996. [Google Scholar] [CrossRef]
- Marwick, T.H.; Raman, S.V.; Carrio, I.; Bax, J.J. Recent developments in heart failure imaging. JACC Cardiovasc. Imaging 2010, 3, 429–439. [Google Scholar] [CrossRef]
- Dogui, A.; Redheuil, A.; Lefort, M.; DeCesare, A.; Kachenoura, N.; Herment, A.; Mousseaux, E. Measurement of aortic arch pulse wave velocity in cardiovascular MR: Comparison of transit time estimators and description of a new approach. J. Magn. Reson. Imaging 2011, 33, 1321–1329. [Google Scholar] [CrossRef]
- Soulat, G.; Gencer, U.; Kachenoura, N.; Villemain, O.; Messas, E.; Boutouyrie, P.; Laurent, S.; Mousseaux, E. Changes in segmental pulse wave velocity of the thoracic aorta with age and left ventricular remodelling. An MRI 4D flow study. J. Hypertens. 2020, 38, 118–126. [Google Scholar] [CrossRef]
- Loose, S.; Solou, D.; Strecker, C.; Hennemuth, A.; Hüllebrand, M.; Grundmann, S.; Asmussen, A.; Treppner, M.; Urbach, H.; Harloff, A. Characterization of aortic aging using 3D multi-parametric MRI-long-term follow-up in a population study. Sci. Rep. 2023, 13, 6285. [Google Scholar] [CrossRef] [PubMed]
- Redheuil, A.; Kachenoura, N.; Bollache, E.; Yu, W.C.; Opdahl, A.; Decesare, A.; Mousseaux, E.; Bluemke, D.; Lima, J.A.C. Left ventricular and proximal aorta coupling in magnetic resonance imaging: Aging together? Am. J. Physiol. Heart Circ. Physiol. 2019, 317, H300–H307. [Google Scholar] [CrossRef]
- Garrido-Oliver, J.; Aviles, J.; Córdova, M.M.; Dux-Santoy, L.; Ruiz-Muñoz, A.; Teixido-Tura, G.; Maso Talou, G.D.; Morales Ferez, X.; Jiménez, G.; Evangelista, A.; et al. Machine learning for the automatic assessment of aortic rotational flow and wall shear stress from 4D flow cardiac magnetic resonance imaging. Eur. Radiol. 2022, 32, 7117–7127. [Google Scholar] [CrossRef] [PubMed]
- Cecelja, M.; Ruijsink, B.; Puyol-Antón, E.; Li, Y.; Godwin, H.; King, A.P.; Razavi, R.; Chowienczyk, P. Aortic Distensibility Measured by Automated Analysis of Magnetic Resonance Imaging Predicts Adverse Cardiovascular Events in UK Biobank. J. Am. Heart Assoc. 2022, 11, e026361. [Google Scholar] [CrossRef] [PubMed]
- Hrabak-Paar, M.; Kircher, A.; Al Sayari, S.; Kopp, S.; Santini, F.; Schmieder, R.E.; Kachenoura, N.; Yates, D.; Langenickel, T.; Bremerich, J.; et al. Variability of MRI Aortic Stiffness Measurements in a Multicenter Clinical Trial Setting: Intraobserver, Interobserver, and Intracenter Variability of Pulse Wave Velocity and Aortic Strain Measurement. Radiol. Cardiothorac. Imaging 2020, 2, e190090. [Google Scholar] [CrossRef]
- Spronck, B.; Terentes-Printzios, D.; Avolio, A.P.; Boutouyrie, P.; Guala, A.; Jerončić, A.; Laurent, S.; Barbosa, E.C.D.; Baulmann, J.; Chen, C.H.; et al. 2024 Recommendations for Validation of Noninvasive Arterial Pulse Wave Velocity Measurement Devices. Hypertension 2024, 81, 183–192. [Google Scholar] [CrossRef]
- Herment, A.; Kachenoura, N.; Lefort, M.; Bensalah, M.; Dogui, A.; Frouin, F.; Mousseaux, E.; De Cesare, A. Automated segmentation of the aorta from phase contrast MR images: Validation against expert tracing in healthy volunteers and in patients with a dilated aorta. J. Magn. Reson. Imaging 2010, 31, 881–888. [Google Scholar] [CrossRef]
- Xiang, S.; Li, N.; Wang, Y.; Zhou, S.; Wei, J.; Li, S. Automatic Delineation of the 3D Left Atrium From LGE-MRI: Actor-Critic Based Detection and Semi-Supervised Segmentation. IEEE J. Biomed. Health Inform. 2024, 28, 3545–3556. [Google Scholar] [CrossRef] [PubMed]
- Li, J.; Wu, Q.; Wang, Y.; Zhou, S.; Zhang, L.; Wei, J.; Zhao, D. DiffCAS: Diffusion based multi-attention network for segmentation of 3D coronary artery from CT angiography. Signal Image Video Process. 2024, 18, 7487–7498. [Google Scholar] [CrossRef]
- Zhao, C.; Xiang, S.; Wang, Y.; Cai, Z.; Shen, J.; Zhou, S.; Zhao, D.; Su, W.; Guo, S.; Li, S. Context-aware network fusing transformer and V-Net for semi-supervised segmentation of 3D left atrium. Expert Syst. Appl. 2023, 214, 119105. [Google Scholar] [CrossRef]


| Study | Parikh et al., 2016 [29] a | Baier et al., 2018 [30] b | Díaz et al., 2014 [31] | Parikh et al., 2016 [29] a | van Hout et al., 2021 [32] b |
|---|---|---|---|---|---|
| PWV technique | Vicorder device | Vicorder device | Institution-developed technique using silicon piezoresistive pressure sensors | MRI | MRI |
| Number of participants | 80 | 8509 | 780 | 80 | 397 |
| PWV (m/s) according to age group | |||||
| 10–19 years | NA | NA | 5.04 ± 0.72 [4.92–5.15] | NA | NA |
| 20–29 years | 6.7 ± 0.9 | 7.2 [5.0–13.1] (age range: 18–29) | 5.86 ± 0.92 [5.68–6.03] | 4.5 ± 1.5 | NA |
| 30–39 years | 6.9 ± 1.0 | 7.8 [5.5–14.0] | 6.32 ± 0.82 [6.16–6.47] | 5.1 ± 0.8 | NA |
| 40–49 years | 7.5 ± 1.2 | 8.9 [6.0–15.2] | 6.85 ± 0.91 [6.68–7.03] | 6.5 ± 1.7 | 5.4 [5.3–5.6] (age range: 40–49) |
| 50–59 years | 8.0 ± 1.7 | 9.4 [6.1–16.1] | 8.15 ± 1.17 [7.97–8.33] | 6.2 ± 1.6 | 5.8 [5.6–5.9] (age range: 50–54) |
| 6.1 [5.8–6.5] (age range: 55–59) | |||||
| 60–69 years | 8.1 ± 1.2 | 10.1 [6.4–18.8] | 8.47 ± 1.09 [8.25–8.68] | 6.8 ± 2.1 | 6.8 [6.5–7.0] (age range: 60–64) |
| ≥70 years | 9.5 ± 1.4 (age range: 70–79) | 10.5 [6.3–18.1] | 9.01 ± 2.00 [8.27–9.76] | 7.9 ± 1.5 (age range: 70–79) | NA |
| Vascular aging | |
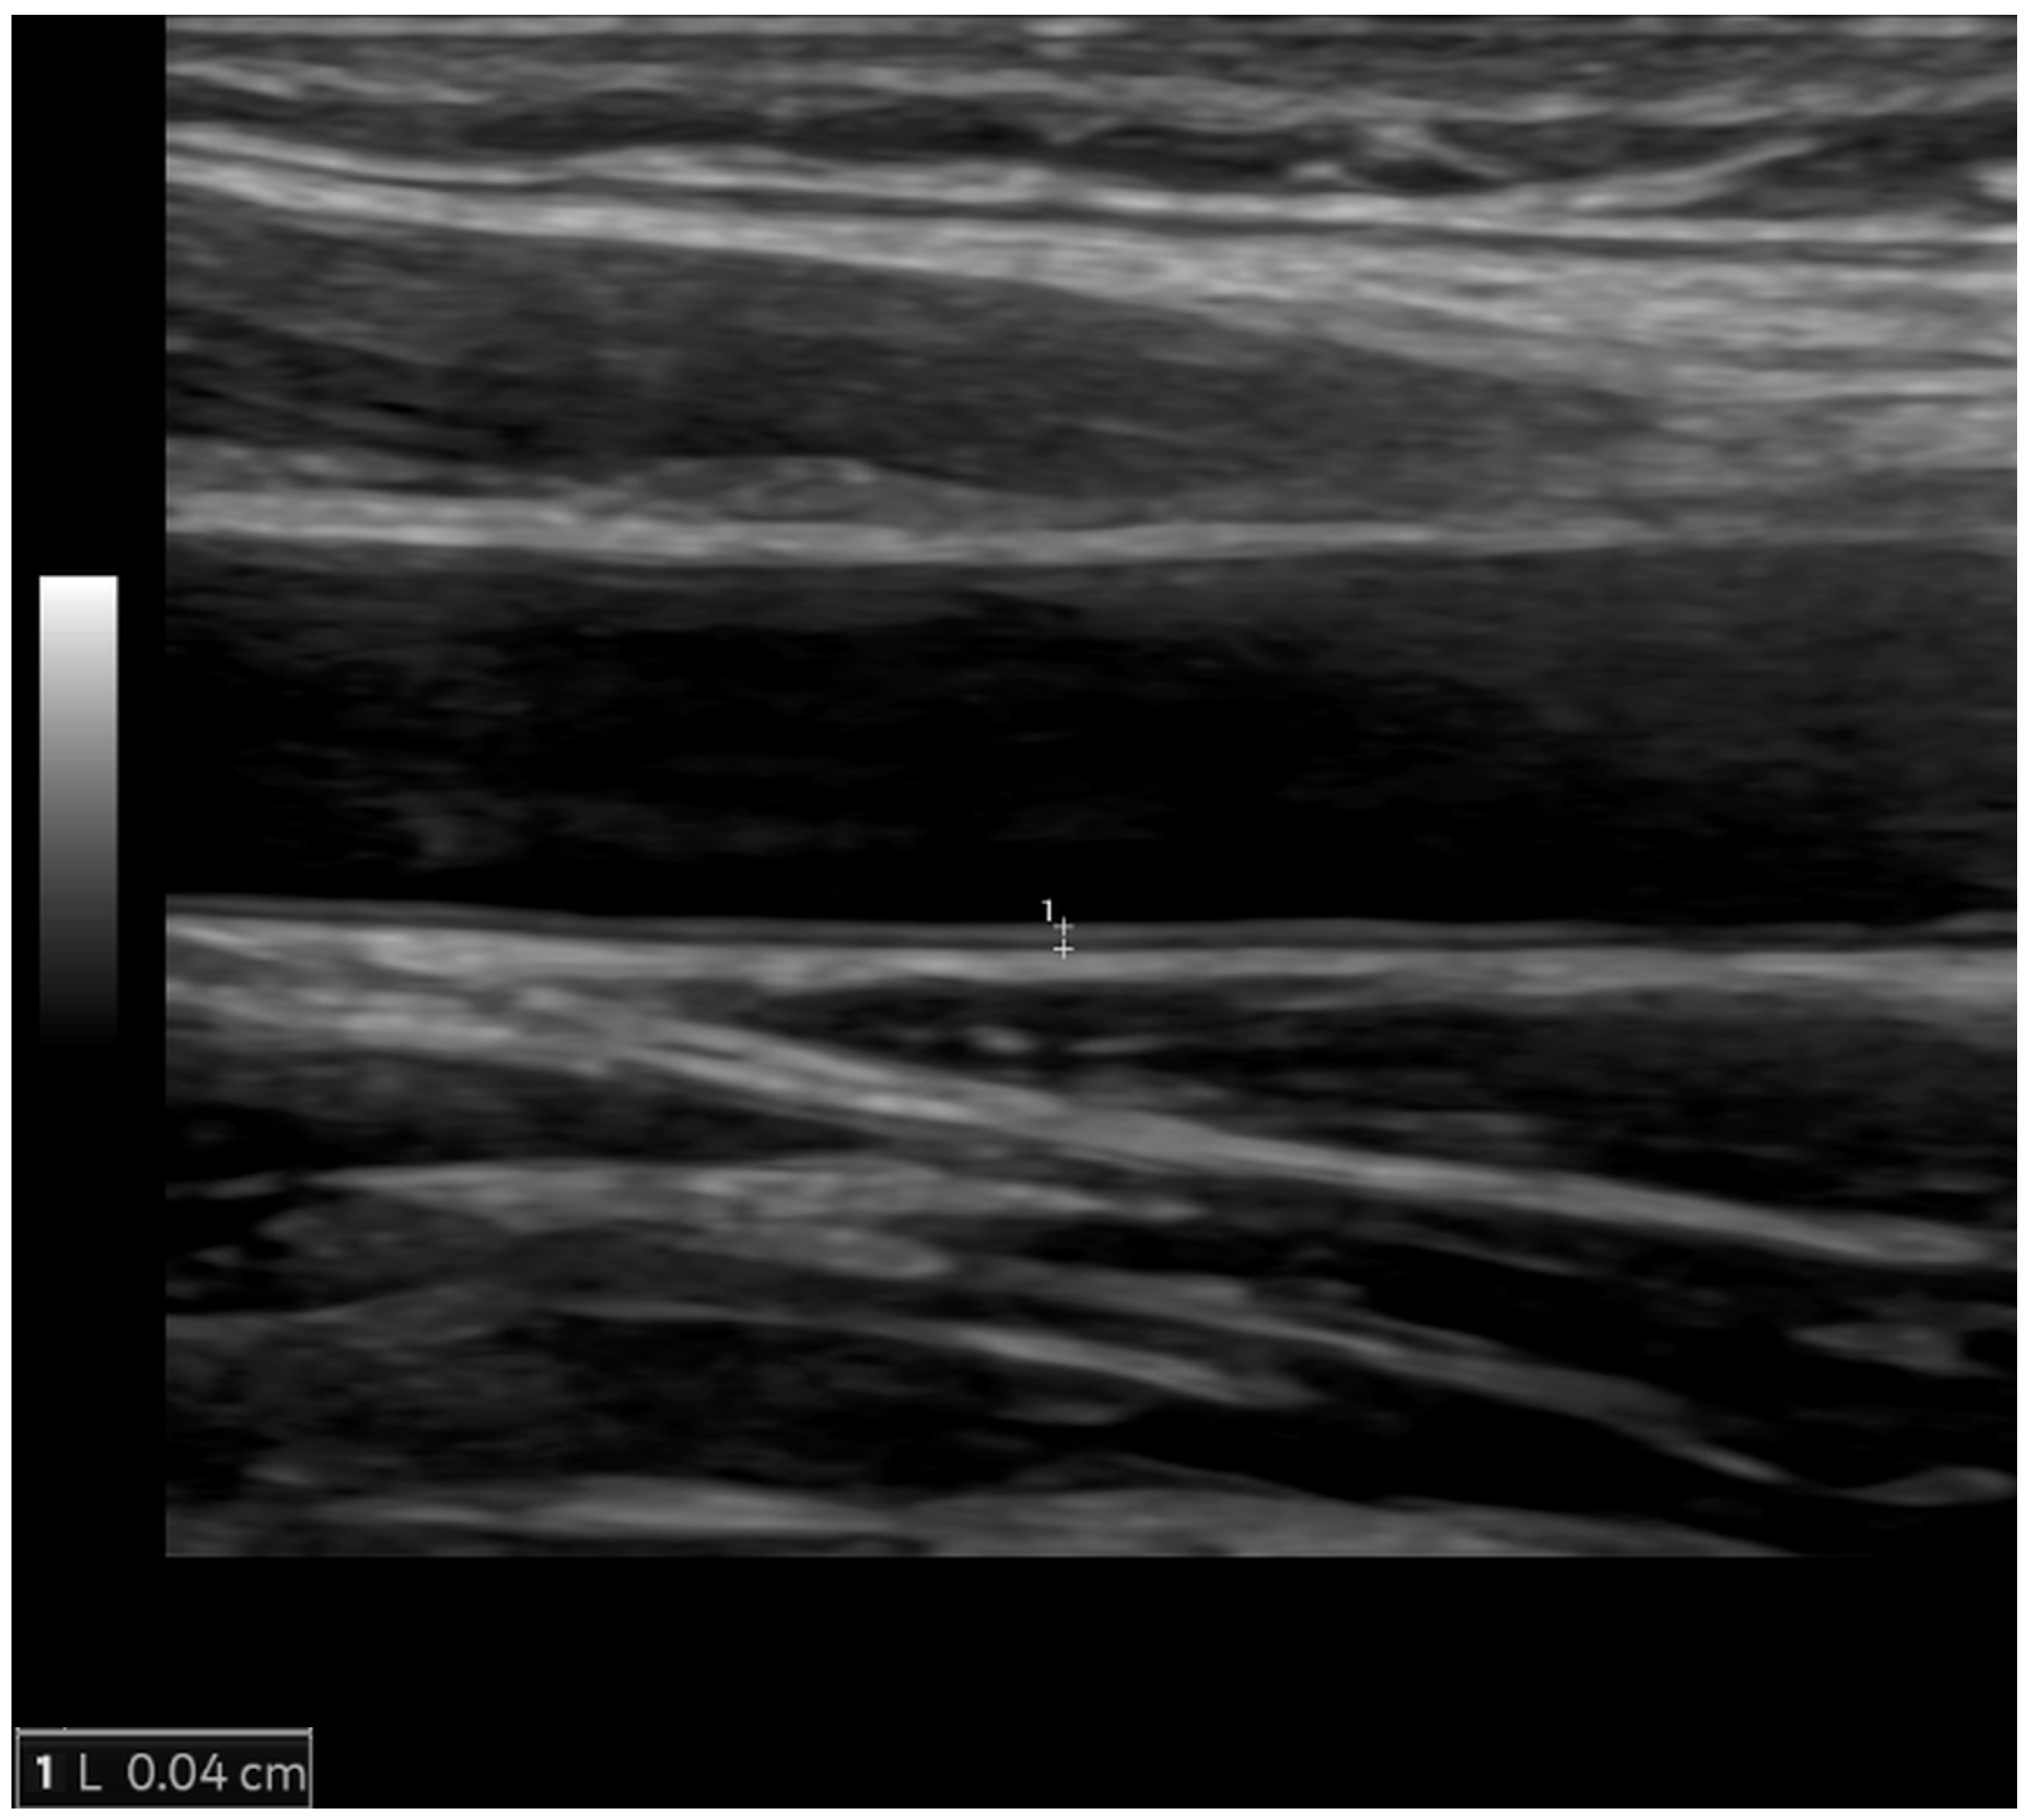
| Arterial wall thickening | Increased carotid intima-media thickness |
| Arterial wall stiffening | Reduced aortic strain and distensibility, increased pulse–wave velocity |
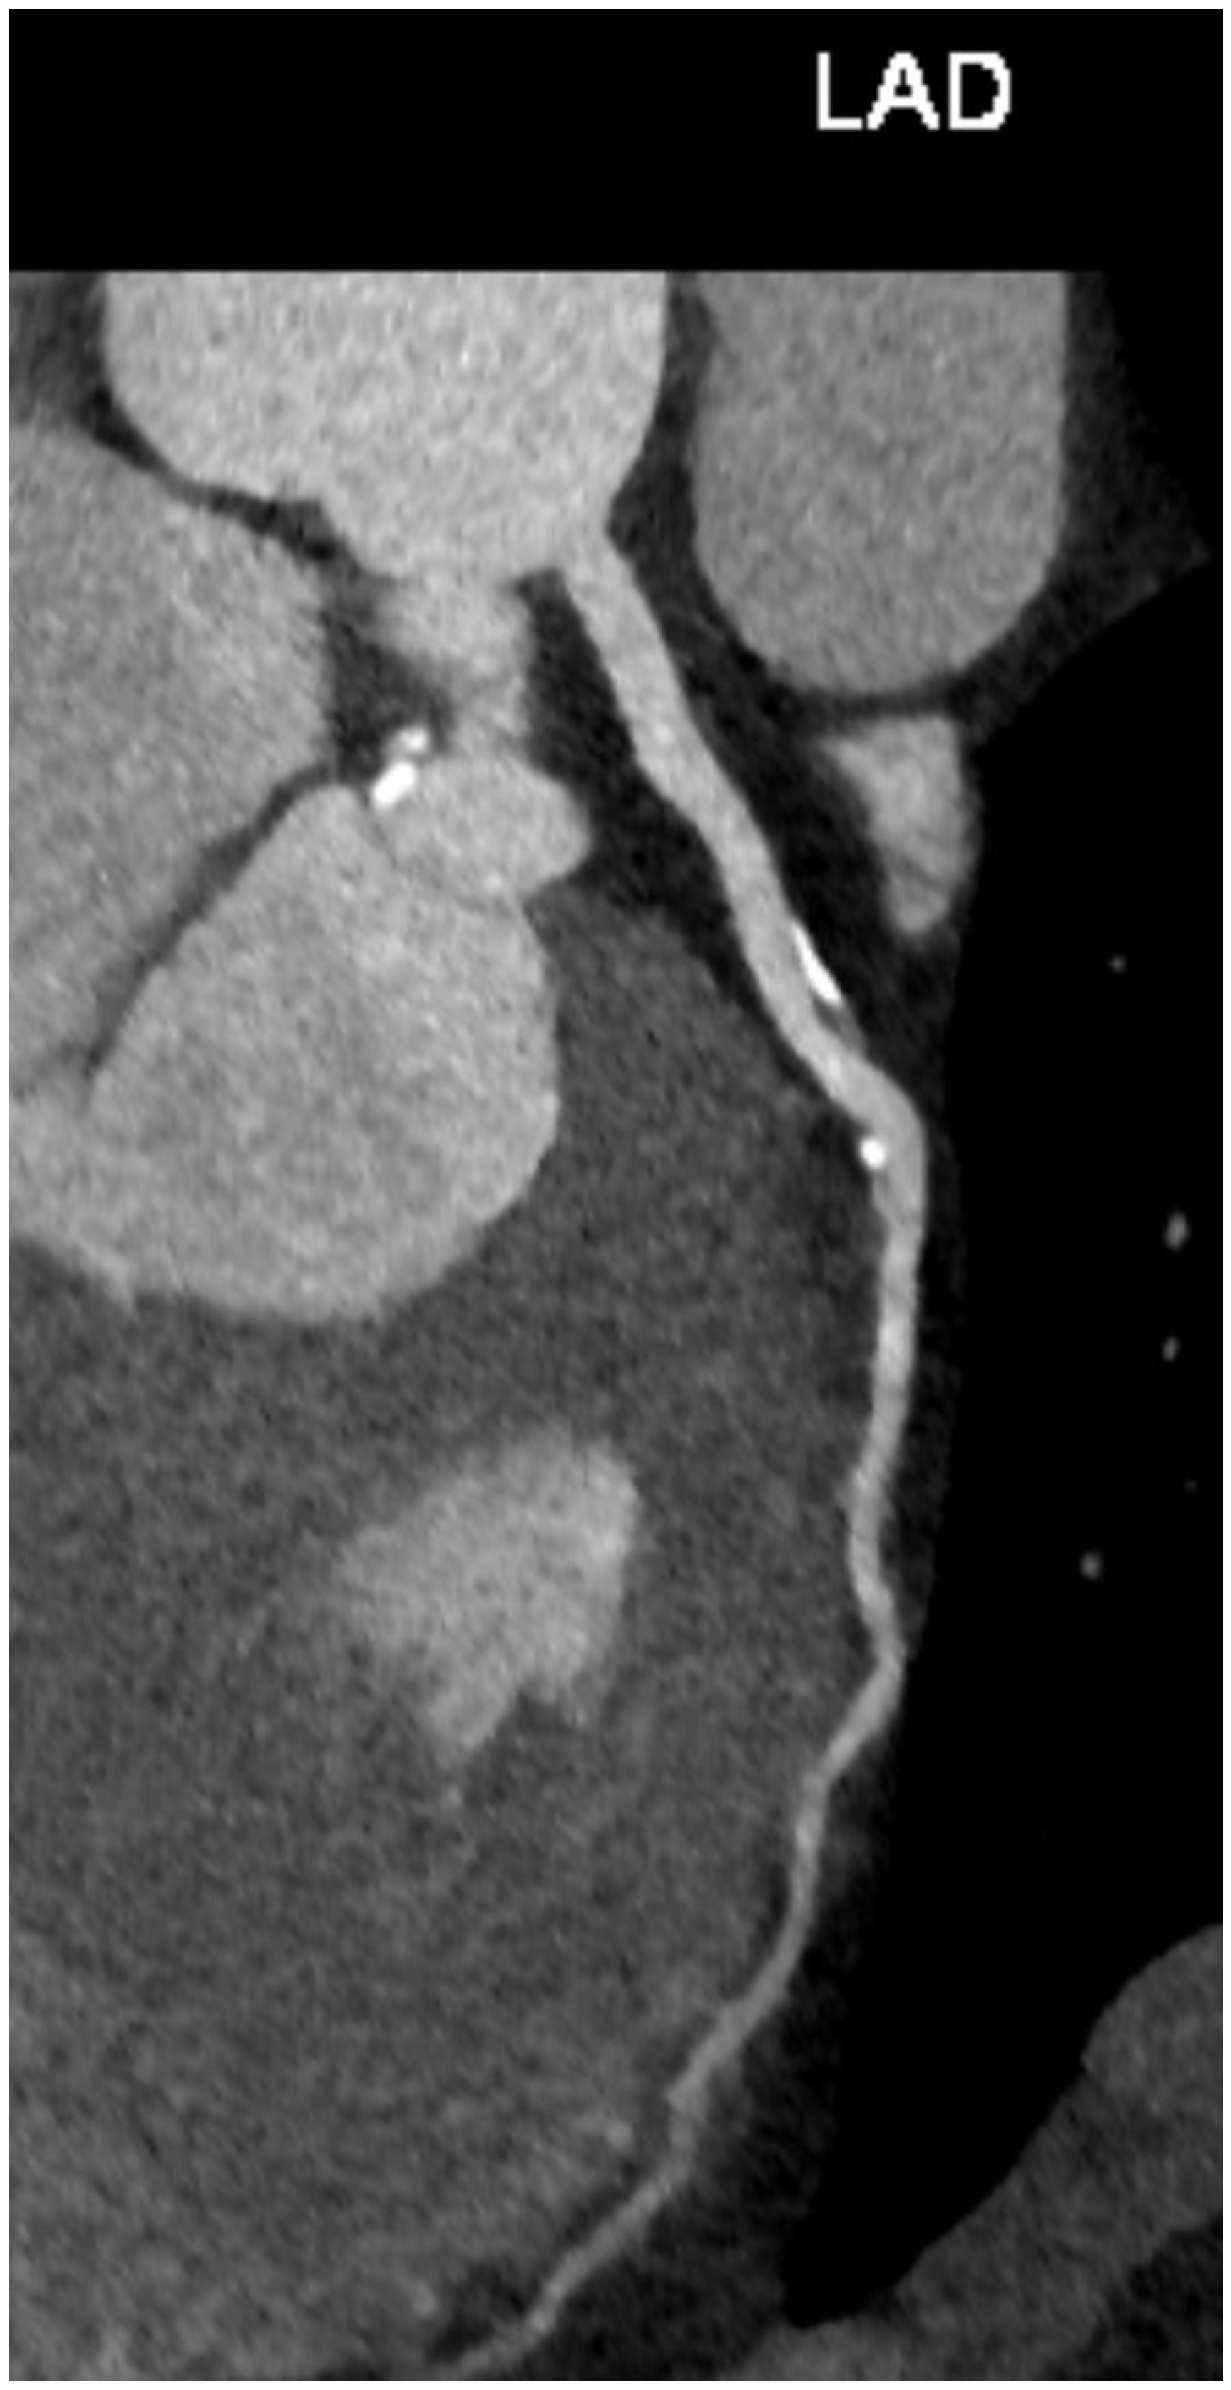
| Atherosclerosis | Non-calcified and calcified atherosclerotic plaques |
| Arterial dilatation and elongation | Arterial tortuosity, increased diameter and length |
| Cardiac aging | |
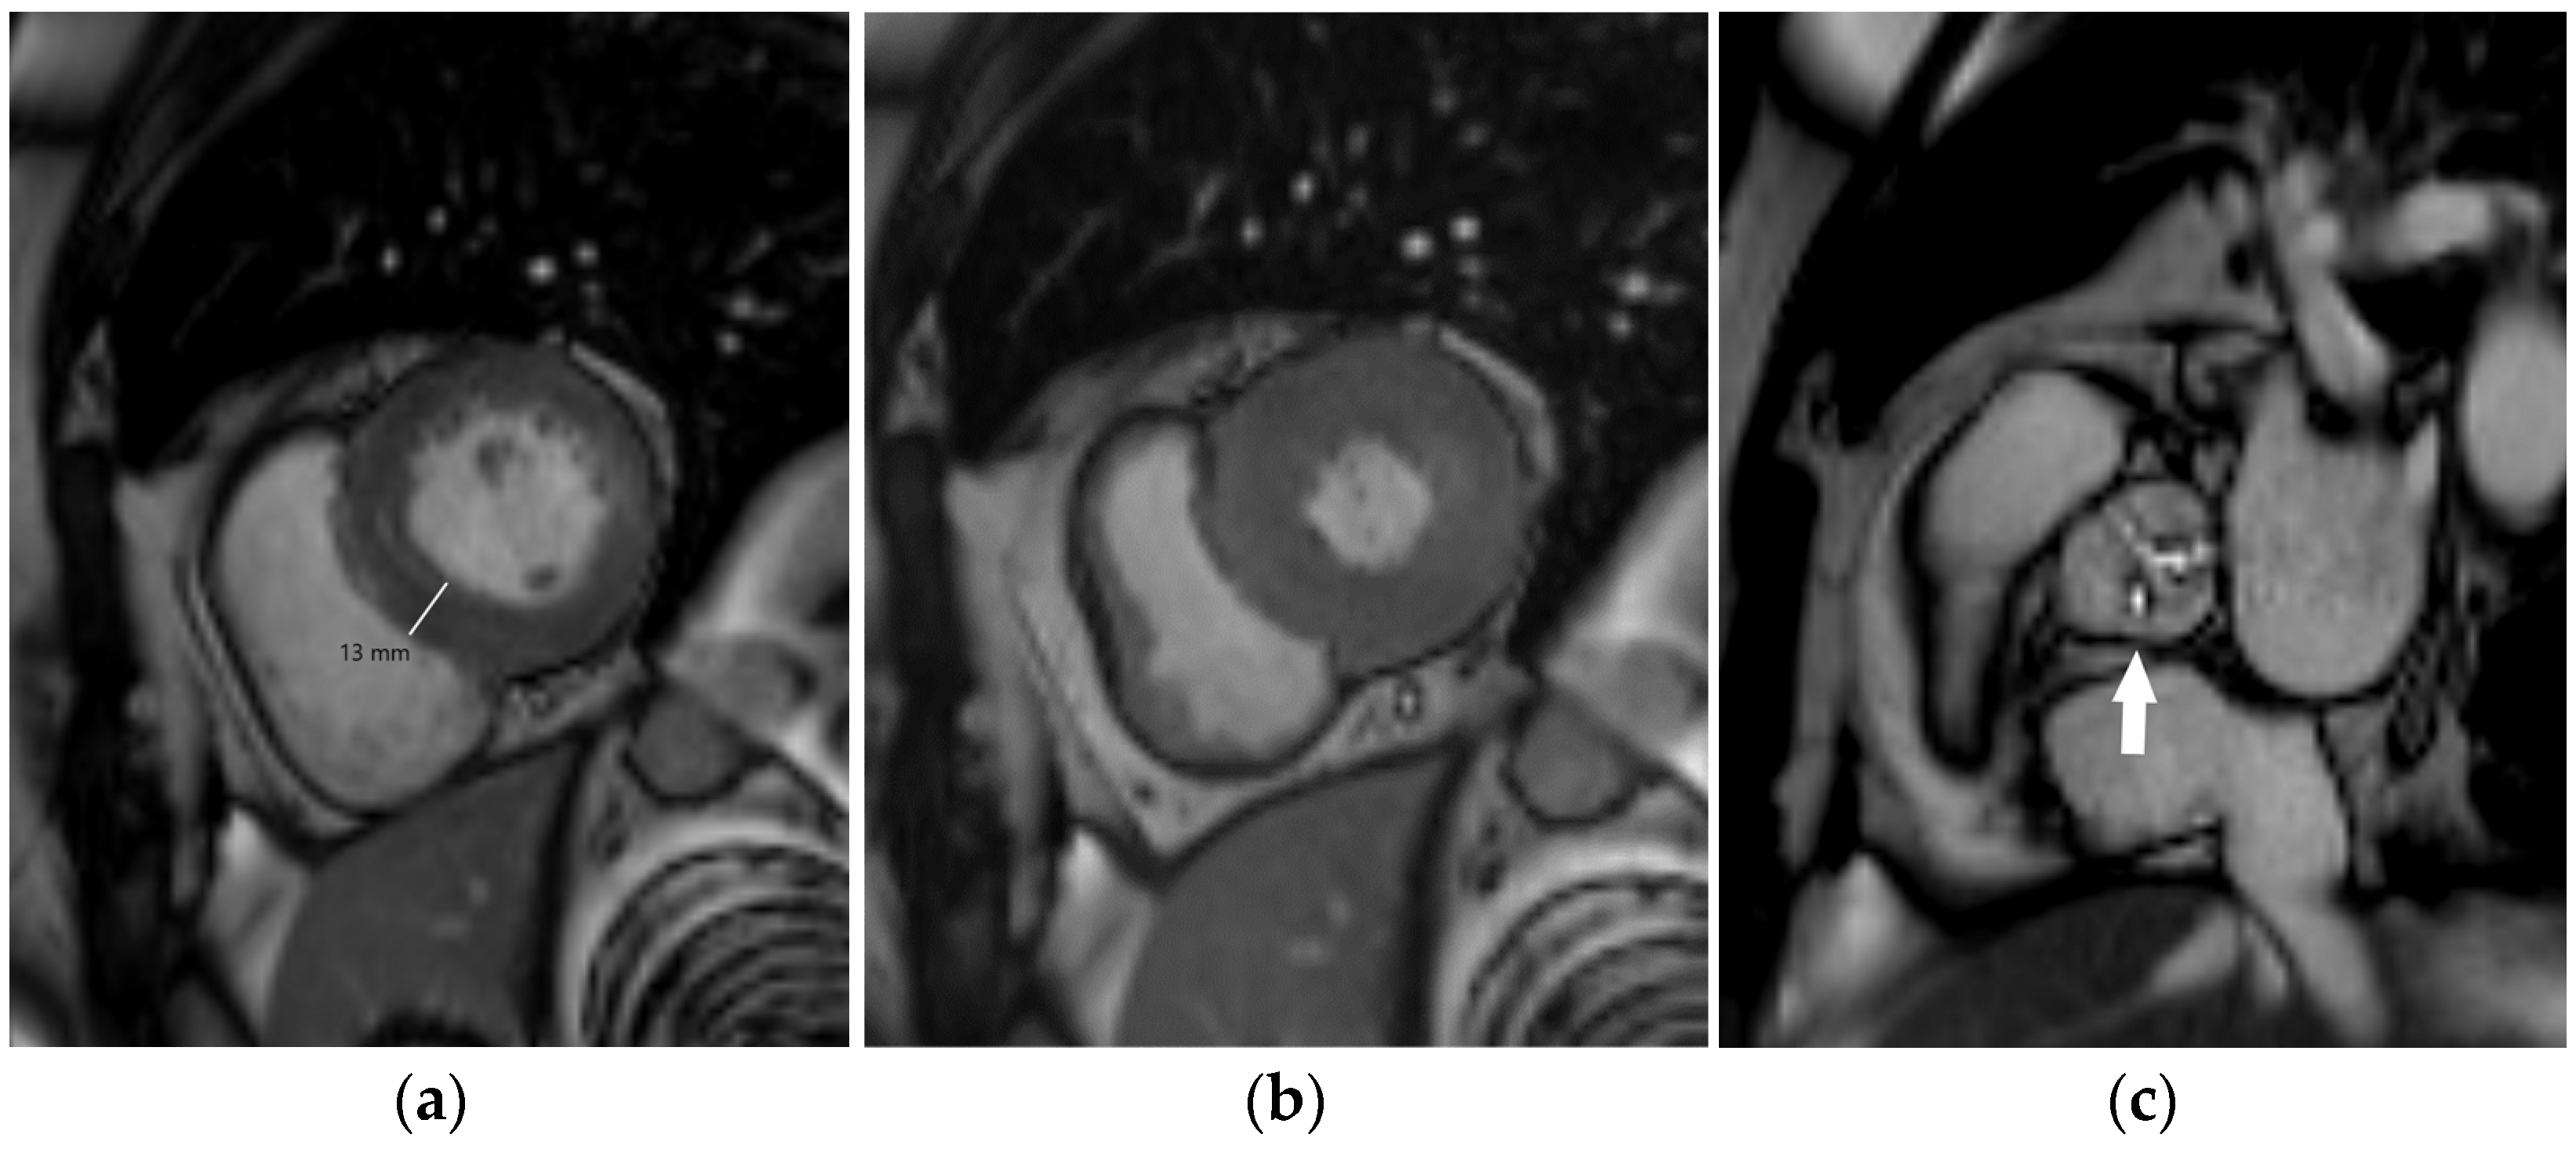
| Myocardial hypertrophy | Increased left ventricular myocardial thickness and mass |
| Myocardial fibrosis | MRI tissue characterization required: prolonged myocardial T1 relaxation time, increased myocardial extracellular volume, late gadolinium enhancement |
| Valvular degeneration | Cusp thickening, stiffening, and calcification with reduced mobility |
| Diastolic dysfunction | Abnormal myocardial relaxation with impaired left ventricular filling |
| Coronary artery disease | CT: coronary artery calcification, coronary artery plaques with or without high-risk features, coronary artery stenosis |
| MRI: myocardial ischemia (stress testing), regional wall motion abnormalities (cine imaging), ischemic pattern of late gadolinium enhancement |
| Imaging Features | Indications | Advantages | Disadvantages and Restrictions | |
|---|---|---|---|---|
| Ultrasonography and echocardiography | Carotid imaging (carotid intima-media thickness, atherosclerotic plaques) Cardiac morphology and function Aortic stiffness (pulse wave velocity, aortic strain, and distensibility) | First-line imaging modality for assessment of carotid arteries First-line imaging modality for cardiac morphology and function assessment | Inexpensive Easily available Portable No ionizing radiation | Limited acoustic window Very limited possibilities for myocardial tissue characterization |
| Computed tomography | Coronary artery calcium (CAC) scoring Coronary CT angiography (CCTA): coronary stenosis and plaque assessment Aortic morphology and stiffness (aortic strain and distensibility) | Improvements in risk classification around treatment decision thresholds (CAC scoring) First-line imaging modality in patients with suspicious chronic coronary syndrome (CCTA) First-line imaging modality for acute aortic syndrome, commonly used for follow-up of aortic diseases (especially in older individuals) | Fast performance Detailed depiction of coronary anatomy (plaque morphology, luminal stenosis) and valvular morphology Method of choice for planning aortic interventional or surgical procedures | Ionizing radiation Use of iodine contrast agents High costs Imaging artifacts (motion artifacts, blooming artifacts) Limited functional information |
| Magnetic resonance imaging | Cardiac morphology and function Aortic morphology and stiffness (pulse wave velocity, aortic strain, and distensibility) | Imaging modality of choice for advanced assessment of cardiac morphology and function Non-invasive myocardial ischemia testing (stress test) Commonly used for follow-up of aortic diseases (especially in children and younger individuals) | Non-invasive myocardial tissue characterization Image acquisition in any desired plane The gold standard for assessment of myocardial mass, ventricular volumes, and ejection fraction | High costs Limited availability Long-lasting examinations Contraindications (ferromagnetic foreign bodies, non-conditional cardiac implantable electronic devices) |
Disclaimer/Publisher’s Note: The statements, opinions and data contained in all publications are solely those of the individual author(s) and contributor(s) and not of MDPI and/or the editor(s). MDPI and/or the editor(s) disclaim responsibility for any injury to people or property resulting from any ideas, methods, instructions or products referred to in the content. |
© 2024 by the authors. Licensee MDPI, Basel, Switzerland. This article is an open access article distributed under the terms and conditions of the Creative Commons Attribution (CC BY) license (https://creativecommons.org/licenses/by/4.0/).
Share and Cite
Hrabak Paar, M.; Muršić, M.; Bremerich, J.; Heye, T. Cardiovascular Aging and Risk Assessment: How Multimodality Imaging Can Help. Diagnostics 2024, 14, 1947. https://doi.org/10.3390/diagnostics14171947
Hrabak Paar M, Muršić M, Bremerich J, Heye T. Cardiovascular Aging and Risk Assessment: How Multimodality Imaging Can Help. Diagnostics. 2024; 14(17):1947. https://doi.org/10.3390/diagnostics14171947
Chicago/Turabian StyleHrabak Paar, Maja, Miroslav Muršić, Jens Bremerich, and Tobias Heye. 2024. "Cardiovascular Aging and Risk Assessment: How Multimodality Imaging Can Help" Diagnostics 14, no. 17: 1947. https://doi.org/10.3390/diagnostics14171947