
A Quantitative Measurement Method for Nuclear-Pleomorphism Scoring in Breast Cancer

 ,
,
Abstract
1. Introduction
2. Related Works
3. Methods
3.1. Theoretical Framework and Mathematical Modelling
3.2. Methodology Pipeline
- Pre-processing: Extract the H-channel of the input breast histopathology images by converting the RGB input images into optical density space via singular value decomposition [29].
- Nucleus segmentation: Segment the nucleus using CellProfiler 3.0 [30].
- Post-processing: If necessary, manual intervention from an expert is involved, such that the cell boundary (pixel-based) is manually edited under the expert’s supervision.
- Calculation: Calculate the , , and , using the Equations (2) to (4), respectively.
- Measurement of nuclear pleomorphism: Quantify and measure the nuclear pleomorphism of a nucleus using the HM equation (Equation (5)).
4. Dataset, Results, and Discussions
4.1. Dataset
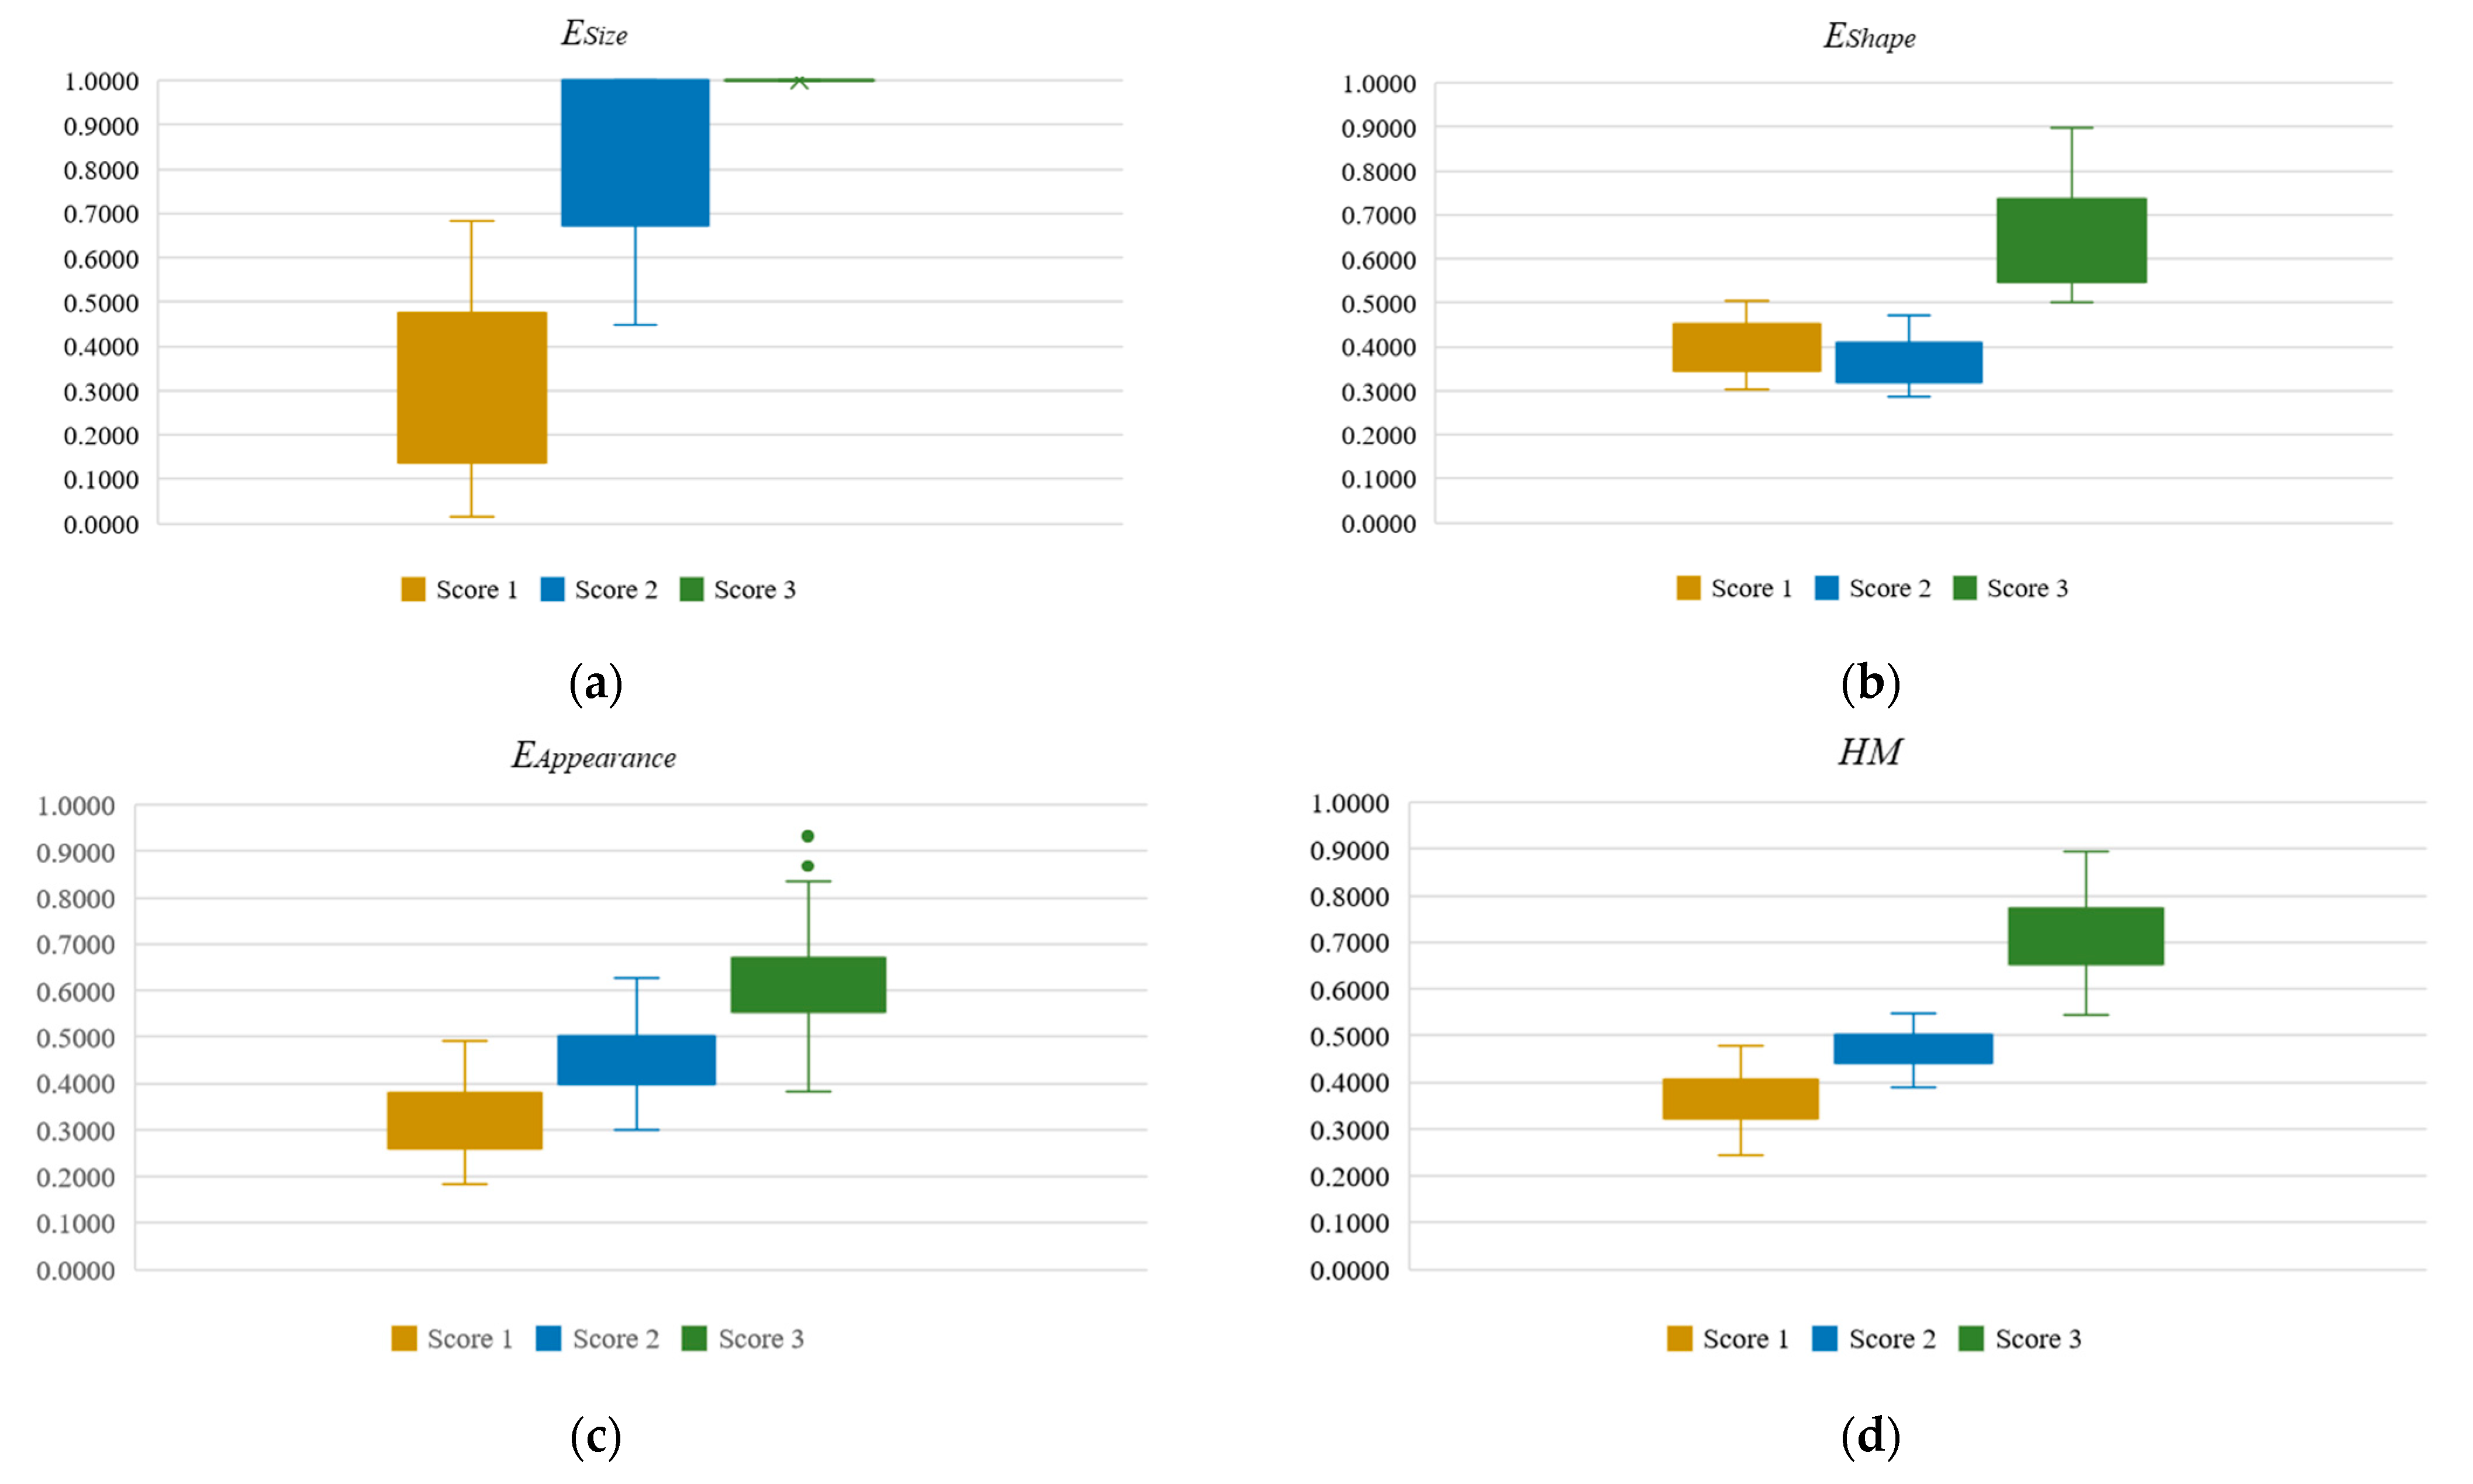
4.2. Analysis on the Outputs of , , , and HM
4.3. Measurement Outputs
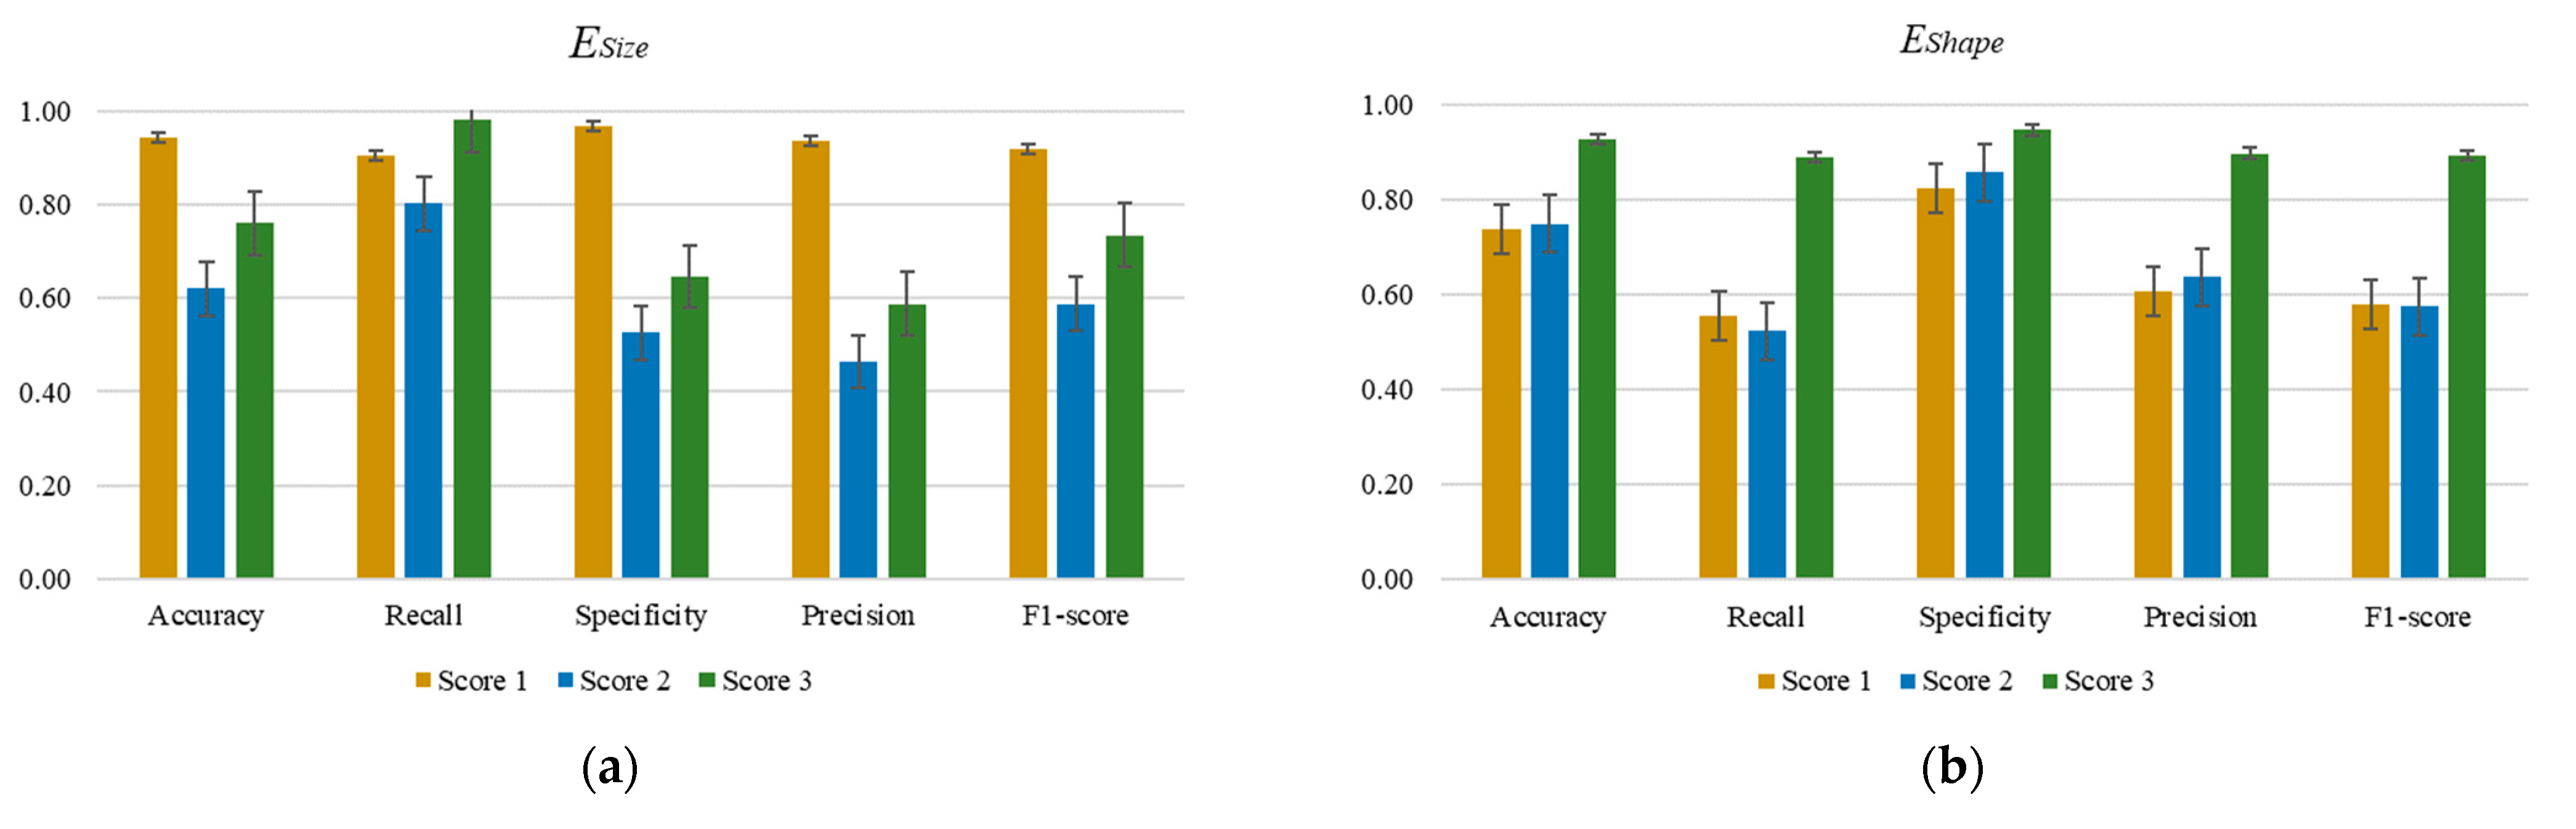
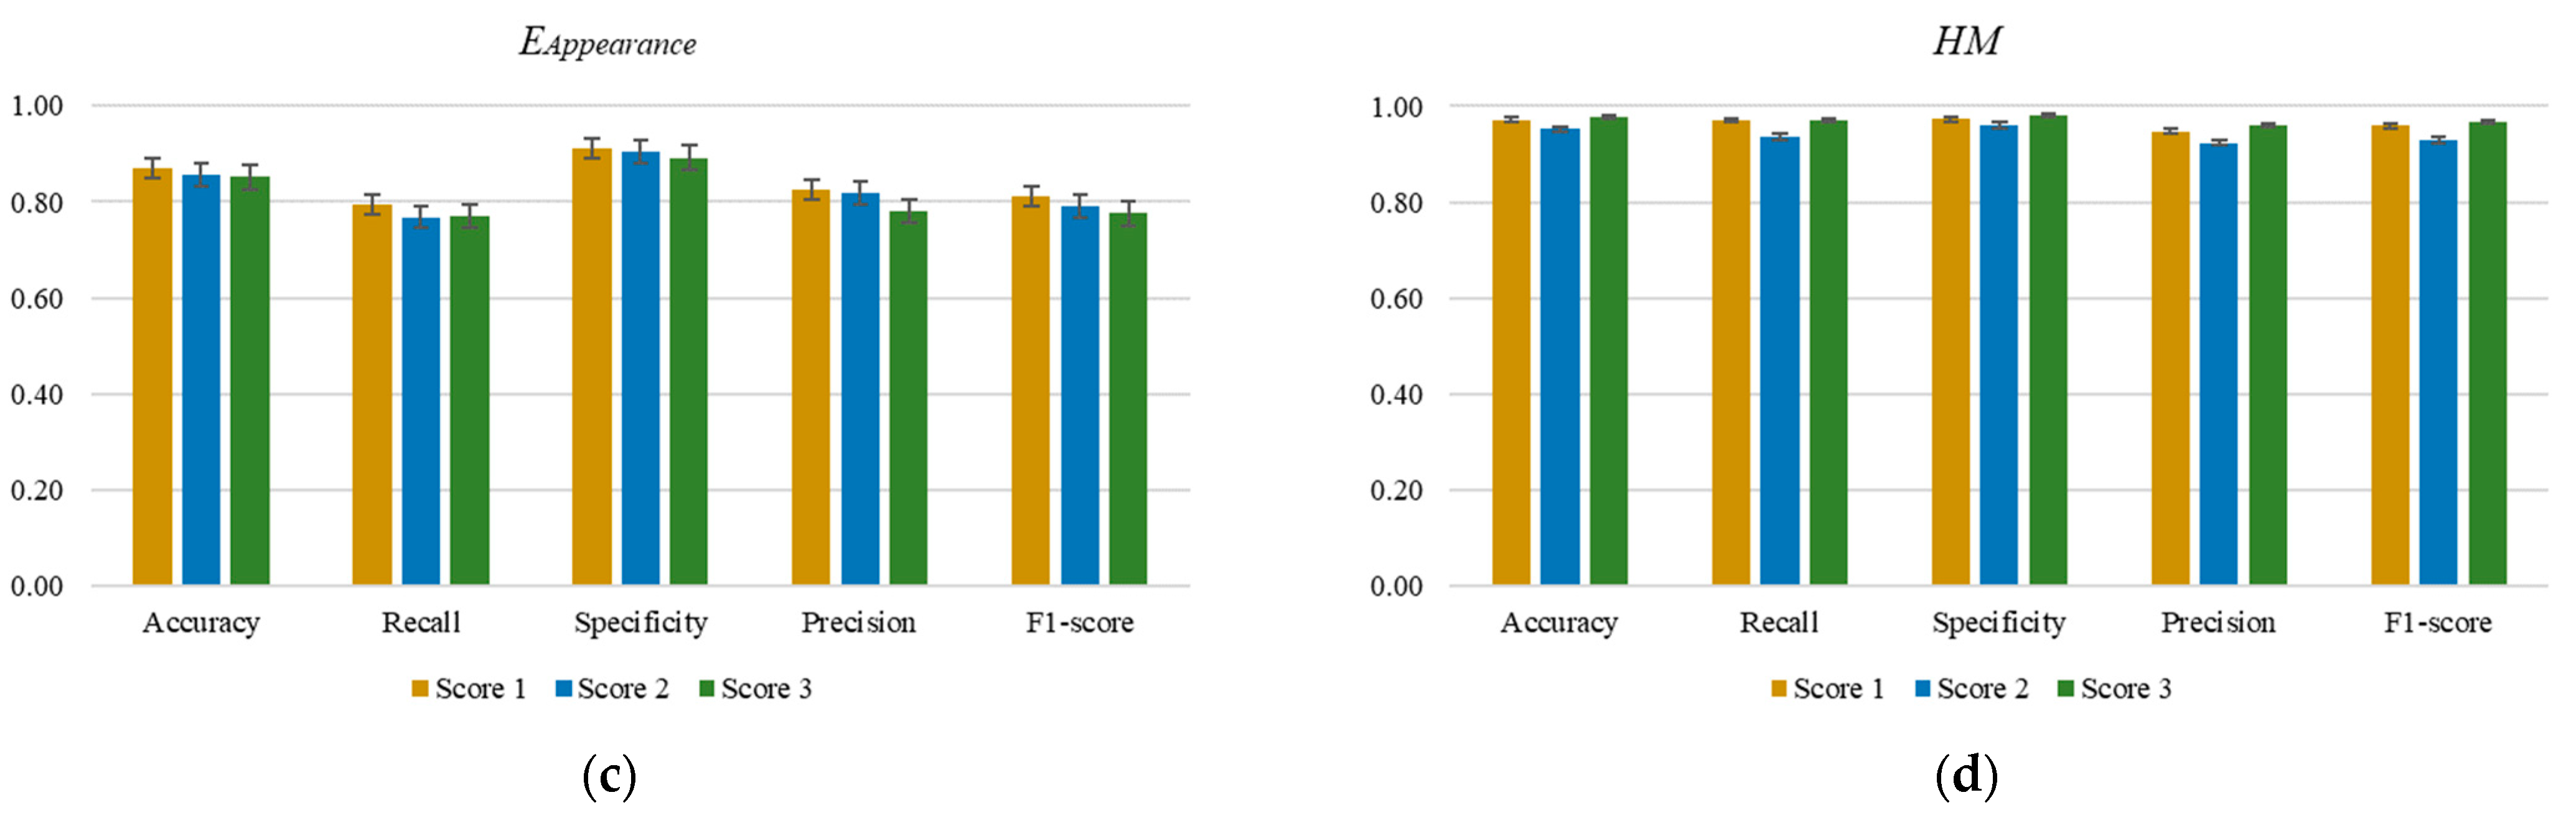
4.4. Classification Outputs
4.5. Ablation Study
4.6. Benchmarking with Existing Quantitative Features
5. Limitations and Future Works
6. Conclusions
Author Contributions
Funding
Institutional Review Board Statement
Informed Consent Statement
Data Availability Statement
Conflicts of Interest
References
- Wilkinson, L.; Gathani, T. Understanding breast cancer as a global health concern. Br. J. Radiol. 2022, 95, 20211033. [Google Scholar] [CrossRef]
- Tan, X.J.; Cheor, W.L.; Lim, L.L.; Ab Rahman, K.S.; Bakrin, I.H. Artificial Intelligence (AI) in Breast Imaging: A Scientometric Umbrella Review. Diagnostics 2022, 12, 3111. [Google Scholar] [CrossRef] [PubMed]
- Flavia, Z.F.; Rodney, H.; Richard, K.; Zodwa, D. Breast cancer in low-middle income countries: Abnormality in splicing and lack of targeted treatment options. Am. J. Cancer Res. 2020, 10, 1568–1591. [Google Scholar] [PubMed]
- Tan, X.J.; Cheor, W.L.; Cheng, E.M.; Ab Rahman, K.S.; Wan Muhamad, W.Z.A.; Leow, W.Z. Breast cancer status, grading system, etiology, and challenges in Asia: An updated review. Oncologie 2023, 25, 99–110. [Google Scholar] [CrossRef]
- Bray, F.; Laversanne, M.; Sung, H.; Ferlay, J.; Siegel, R.L.; Soerjomataram, I.; Jemal, A. Global cancer statistics 2022: GLOBOCAN estimates of incidence and mortality worldwide for 36 cancers in 185 countries. CA Cancer J. Clin. 2024, 74, 229–263. [Google Scholar] [CrossRef]
- Amat, S.; Penault-Llorca, F.; Cure, H.; Le Bouedec, G.; Achard, J.-L.; Van Praagh, I.; Feillel, V.; Mouret-Reynier, M.-A.; Dauplat, J.; Chollet, P. Scarff-Bloom-Richardson (SBR) grading: A pleiotropic marker of chemosensitivity in invasive ductal breast carcinomas treated by neoadjuvant chemotherapy. Int. J. Oncol. 2002, 20, 791–796. [Google Scholar] [CrossRef]
- Lakhani, S.R.; Ellis, I.O.; Schnitt, S.J.; Tan, P.H.; Van de Vijver, M.J. (Eds.) WHO Classification of Tumours of the Breast, 4th ed.; International Agency for Research on Cancer (IARC): Lyon, France, 2012. [Google Scholar]
- Tan, X.J.; Mustafa, N.; Mashor, M.Y.; Ab Rahman, K.S. Automated knowledge-assisted mitosis cells detection framework in breast histopathology images. Math. Biosci. Eng. 2022, 19, 1721–1745. [Google Scholar] [CrossRef]
- Das, A.; Nair, M.S.; Peter, D.S. Batch Mode Active Learning on the Riemannian Manifold for Automated Scoring of Nuclear Pleomorphism in Breast Cancer. Artif. Intell. Med. 2020, 103, 101805. [Google Scholar] [CrossRef]
- Das, A.; Nair, M.S.; Peter, S.D. Kernel-based Fisher discriminant analysis on the Riemannian manifold for nuclear atypia scoring of breast cancer. Biocybern. Biomed. Eng. 2019, 39, 728–741. [Google Scholar] [CrossRef]
- Das, A.; Nair, M.S.; Peter, S.D. Sparse representation over learned dictionaries on the riemannian manifold for automated grading of nuclear pleomorphism in breast cancer. IEEE Trans. Image Process. 2019, 28, 1248–1260. [Google Scholar] [CrossRef]
- Salahuddin, T.; Haouari, F.; Islam, F.; Ali, R.; Al-Rasbi, S.; Aboueata, N.; Rezk, E.; Jaoua, A. Breast cancer image classification using pattern-based Hyper Conceptual Sampling method. Inform. Med. Unlocked 2018, 13, 176–185. [Google Scholar] [CrossRef]
- Wan, T.; Cao, J.; Chen, J.; Qin, Z. Automated grading of breast cancer histopathology using cascaded ensemble with combination of multi-level image features. Neurocomputing 2017, 229, 34–44. [Google Scholar] [CrossRef]
- Faridi, P.; Danyali, H.; Helfroush, M.S.; Jahromi, M.A. Cancerous Nuclei Detection and Scoring in Breast Cancer Histopathological Images. arXiv 2016, arXiv:1612.01237. [Google Scholar]
- Maqlin, P.; Thamburaj, R.; Mammen, J.J.; Manipadam, M.T. Automated nuclear pleomorphism scoring in breast cancer histopathology images using deep neural networks. In Mining Intelligence and Knowledge Exploration; Springer: Cham, Switzerland, 2015; Volume 9468, pp. 269–276. [Google Scholar] [CrossRef]
- Han, Z.; Wei, B.; Zheng, Y.; Yin, Y.; Li, K.; Li, S. Breast Cancer Multi-classification from Histopathological Images with Structured Deep Learning Model. Sci. Rep. 2017, 7, 4172. [Google Scholar] [CrossRef] [PubMed]
- Wollmann, T.; Rohr, K. Automatic breast cancer grading in lymph nodes using a deep neural network. arXiv 2017, arXiv:1707.07565. [Google Scholar]
- Vang, Y.S.; Chen, Z.; Xie, X. Deep Learning Framework for Multi-class Breast Cancer Histology Image Classification. In Image Analysis and Recognition; Springer: Cham, Switzerland, 2018; Volume 10882, pp. 914–922. [Google Scholar] [CrossRef]
- Alom, M.Z.; Yakopcic, C.; Nasrin, M.S.; Taha, T.M.; Asari, V.K. Breast Cancer Classification from Histopathological Images with Inception Recurrent Residual Convolutional Neural Network. J. Digit. Imaging 2019, 32, 605–617. [Google Scholar] [CrossRef] [PubMed]
- Jiang, Y.; Chen, L.; Zhang, H.; Xiao, X. Breast cancer histopathological image classification using convolutional neural networks with small SE-ResNet module. PLoS ONE 2019, 14, e0214587. [Google Scholar] [CrossRef]
- Das, A.; Devarampati, V.K.; Nair, M.S. NAS-SGAN: A Semi-Supervised Generative Adversarial Network Model for Atypia Scoring of Breast Cancer Histopathological Images. IEEE J. Biomed. Health Inform. 2022, 26, 2276–2287. [Google Scholar] [CrossRef]
- Karimi Jafarbigloo, S.; Danyali, H. Nuclear atypia grading in breast cancer histopathological images based on CNN feature extraction and LSTM classification. CAAI Trans. Intell. Technol. 2021, 6, 426–439. [Google Scholar] [CrossRef]
- Rakhlin, A.; Shvets, A.; Iglovikov, V.; Kalinin, A.A. Deep Convolutional Neural Networks for Breast Cancer Histology Image Analysis. In Image Analysis and Recognition; Springer: Cham, Switzerland, 2018; Volume 10882, pp. 737–744. [Google Scholar] [CrossRef]
- Faruk Topaloğlu, Ö.; Koplay, M.; Kılınçer, A.; Örgül, G.; Sedat Durmaz, M. Quantitative measurements and morphological evaluation of fetal cardiovascular structures with fetal cardiac MRI. Eur. J. Radiol. 2023, 163, 110828. [Google Scholar] [CrossRef]
- Tan, X.J.; Mustafa, N.; Mashor, M.Y.; Ab Rahman, K.S. A novel quantitative measurement method for irregular tubules in breast carcinoma. Eng. Sci. Technol. Int. J. 2022, 31, 101051. [Google Scholar] [CrossRef]
- Park, H.U.; Chung, K.B.; Kim, D.Y. Quantitative measurement of hair diameter diversity as a diagnostic indicator of androgenetic alopecia in Korean males: A cross-sectional study. JAAD Int. 2024, 15, 121–126. [Google Scholar] [CrossRef]
- Starshinova, A.; Osipov, N.; Dovgalyk, I.; Kulpina, A.; Belyaeva, E.; Kudlay, D. COVID-19 and Tuberculosis: Mathematical Modeling of Infection Spread Taking into Account Reduced Screening. Diagnostics 2024, 14, 698. [Google Scholar] [CrossRef]
- Albarova-Corral, I.; Segovia- Burillo, J.; Malo-Urries, M.; Rios-Asin, I.; Asin, J.; Castillo-Mateo, J.; Gracia-Tabuenca, Z.; Morales-Hernandez, M.M. A New Quantitative Tool for the Ultrasonographic Assessment of Tendons: A Reliability and Validity Study on the Patellar Tendon. Diagnostics 2024, 14, 1067. [Google Scholar] [CrossRef]
- Macenko, M.; Niethammer, M.; Marron, J.S.; Borland, D.; Woosley, T.; Guan, X.; Schmitt, C.; Thomas, N.E. A method for normalizing histology slides for quantitative analysis. In Proceedings of the 2009 IEEE International Symposium on Biomedical Imaging: Macro to Nano, Boston, MA, USA, 18 June–1 July 2009; pp. 1107–1110. [Google Scholar] [CrossRef]
- McQuin, C.; Goodman, A.; Chernyshev, V.; Kamentsky, L.; Cimini, B.A.; Karhohs, K.W.; Doan, M.; Ding, L.; Rafelski, S.M.; Thirstrup, D.; et al. CellProfiler 3.0: Next-generation image processing for biology. PLoS Biol. 2018, 16, e2005970. [Google Scholar] [CrossRef]
- Basu, A.; Senapati, P.; Deb, M.; Rai, R.; Dhal, K.G. A survey on recent trends in deep learning for nucleus segmentation from histopathology images. Evol. Syst. 2024, 15, 203–248. [Google Scholar] [CrossRef]
- Tan, X.J.; Mustafa, N.; Mashor, M.Y.; Ab Rahman, K.S. Hyperchromatic nucleus segmentation on breast histopathological images for mitosis detection. J. Telecommun. Electron. Comput. Eng. 2018, 10, 1–16. [Google Scholar]
- Abunassar, N.; Alas, M.; Ali, S.I.A. Prediction of Compressive Strength in Self-compacting Concrete Containing Fly Ash and Silica Fume Using ANN and SVM. Arab J. Sci. Eng. 2023, 48, 5171–5184. [Google Scholar] [CrossRef]
- Nehra, P.; Nagaraju, A. Host utilization prediction using hybrid kernel based support vector regression in cloud data centers. J. King Saud Univ.-Comput. Inf. Sci. 2022, 34, 6481–6490. [Google Scholar] [CrossRef]
- Cosatto, E.; Miller, M.; Graf, H.P.; Meyer, J.S. Grading nuclear pleomorphism on histological micrographs. In Proceedings of the ICPR 2008 19th International Conference on Pattern Recognition, Tampa, FL, USA, 8–11 December 2008; pp. 8–11. [Google Scholar] [CrossRef]
- Petushi, S.; Katsinis, C.; Coward, C.; Garcia, F.; Tozeren, A. Automated identification of microstructures on histology slides. In Proceedings of the 2004 2nd IEEE International Symposium on Biomedical Imaging: Macro to Nano, Arlington, VA, USA, 15–18 April 2004; Volume 1, pp. 424–427. [Google Scholar] [CrossRef]
- Gao, Z.; Wang, L.; Zhou, L.; Zhang, J. HEp-2 cell image classification with deep convolutional neural networks. IEEE J. Biomed. Health Inform. 2017, 21, 416–428. [Google Scholar] [CrossRef]
- Tripathi, S.; Singh, S.K. Cell Nuclei Classification in Histopathological Images using Hybrid Olconvnet. ACM Trans. Multimed. Comput. Commun. Appl. 2020, 16, 1–22. [Google Scholar] [CrossRef]
- Geuenich, M.J.; Gong, D.W.; Campbell, K.R. The impacts of active and self-supervised learning on efficient annotation of single-cell expression data. Nat. Commun. 2024, 15, 1014. [Google Scholar] [CrossRef]
- Lin, Y.; Qu, Z.; Chen, H.; Gao, Z.; Li, Y.; Xia, L.; Ma, K.; Zheng, Y.; Cheng, K.-T. Nuclei segmentation with point annotations from pathology images via self-supervised learning and co-training. Med. Image Anal. 2023, 89, 102933. [Google Scholar] [CrossRef]
- Amgad, M.; Atteya, L.A.; Hussein, H.; Mohammed, K.H.; Hafiz, E.; Elsebaie, M.A.T.; Alhusseiny, A.M.; AlMoslemany, M.A.; Elmatboly, A.M.; Pappalardo, P.A.; et al. NuCLS: A scalable crowdsourcing approach and dataset for nucleus classification and segmentation in breast cancer. Gigascience 2022, 11, giac037. [Google Scholar] [CrossRef]


| Description of Nuclear Pleomorphism | Scores |
|---|---|
| Score-1 nuclei are very similar in size to the nuclei of benign pre-existing epithelial cells (<1.5 times the size), and they show minimal pleomorphism, and an even chromatin pattern, as well as nucleoli that are either not visible or very inconspicuous. | 1 |
| Score-2 nuclei are larger (1.5–2 times the size of benign epithelial cell nuclei), with mild to moderate pleomorphism and visible, but small and inconspicuous, nucleoli. | 2 |
| Score-3 nuclei are even larger (>2 times the size of benign epithelial cell nuclei), with vesicular chromatin; they vary markedly in size and shape and often show prominent nucleoli. | 3 |
| Metrics | Equations |
|---|---|
| Accuracy | |
| Recall | |
| Specificity | |
| Precision | |
| F1-score |
| Nuclear Pleomorphism | HM | ||||
|---|---|---|---|---|---|
| Original Input | Segmentation Outputs * | ||||
| Score 1 | |||||
 |  | 0.3993 | 0.3661 | 0.2912 | 0.3244 |
 |  | 0.5034 | 0.3407 | 0.3270 | 0.3759 |
 |  | 0.0863 | 0.4715 | 0.4093 | 0.4382 |
| Score 2 | |||||
 |  | 0.7694 | 0.3861 | 0.4274 | 0.4816 |
 |  | 0.5669 | 0.4360 | 0.5139 | 0.4997 |
 |  | 0.6449 | 0.4153 | 0.4855 | 0.4985 |
| Score 3 | |||||
 |  | 1.0000 | 0.6479 | 0.6973 | 0.7542 |
 |  | 1.0000 | 0.5269 | 0.5881 | 0.6524 |
 |  | 1.0000 | 0.7049 | 0.8687 | 0.8404 |
| Feature(s) Included | F1-Score | |||
|---|---|---|---|---|
| Score 1 | Score 2 | Score 3 | Overall | |
| 0.92 | 0.59 | 0.74 | 0.75 | |
| 0.58 | 0.57 | 0.89 | 0.68 | |
| 0.81 | 0.79 | 0.78 | 0.79 | |
| + | 0.67 | 0.51 | 0.70 | 0.63 |
| + | 0.83 | 0.64 | 0.71 | 0.73 |
| + | 0.66 | 0.61 | 0.81 | 0.69 |
| HM ( + + ) | 0.96 | 0.93 | 0.97 | 0.95 |
Disclaimer/Publisher’s Note: The statements, opinions and data contained in all publications are solely those of the individual author(s) and contributor(s) and not of MDPI and/or the editor(s). MDPI and/or the editor(s) disclaim responsibility for any injury to people or property resulting from any ideas, methods, instructions or products referred to in the content. |
© 2024 by the authors. Licensee MDPI, Basel, Switzerland. This article is an open access article distributed under the terms and conditions of the Creative Commons Attribution (CC BY) license (https://creativecommons.org/licenses/by/4.0/).
Share and Cite
Teoh, C.L.; Tan, X.J.; Ab Rahman, K.S.; Bakrin, I.H.; Goh, K.M.; Siet, J.J.W.; Wan Muhamad, W.Z.A. A Quantitative Measurement Method for Nuclear-Pleomorphism Scoring in Breast Cancer. Diagnostics 2024, 14, 2045. https://doi.org/10.3390/diagnostics14182045
Teoh CL, Tan XJ, Ab Rahman KS, Bakrin IH, Goh KM, Siet JJW, Wan Muhamad WZA. A Quantitative Measurement Method for Nuclear-Pleomorphism Scoring in Breast Cancer. Diagnostics. 2024; 14(18):2045. https://doi.org/10.3390/diagnostics14182045
Chicago/Turabian StyleTeoh, Chai Ling, Xiao Jian Tan, Khairul Shakir Ab Rahman, Ikmal Hisyam Bakrin, Kam Meng Goh, Joseph Jiun Wen Siet, and Wan Zuki Azman Wan Muhamad. 2024. "A Quantitative Measurement Method for Nuclear-Pleomorphism Scoring in Breast Cancer" Diagnostics 14, no. 18: 2045. https://doi.org/10.3390/diagnostics14182045
APA StyleTeoh, C. L., Tan, X. J., Ab Rahman, K. S., Bakrin, I. H., Goh, K. M., Siet, J. J. W., & Wan Muhamad, W. Z. A. (2024). A Quantitative Measurement Method for Nuclear-Pleomorphism Scoring in Breast Cancer. Diagnostics, 14(18), 2045. https://doi.org/10.3390/diagnostics14182045