
RDAG U-Net: An Advanced AI Model for Efficient and Accurate CT Scan Analysis of SARS-CoV-2 Pneumonia Lesions

 ,
,
Abstract
1. Introduction
- Improved training time and accuracy in lesion identification without the need for contrast agents;
- Identification of the most suitable model for pneumonia diagnosis among Attention Res U-Net, Attention U-Net, and Residual-Dense-Attention Gates U-Net (RDAG U-Net) through comparative analysis;
- Compared to the Attention Res U-Net and Attention U-Net models, RDAG U-Net converges to high accuracy more quickly, significantly shortening the training time (up to 45%).
2. Methods
- (1)
- Training parameters;
- (2)
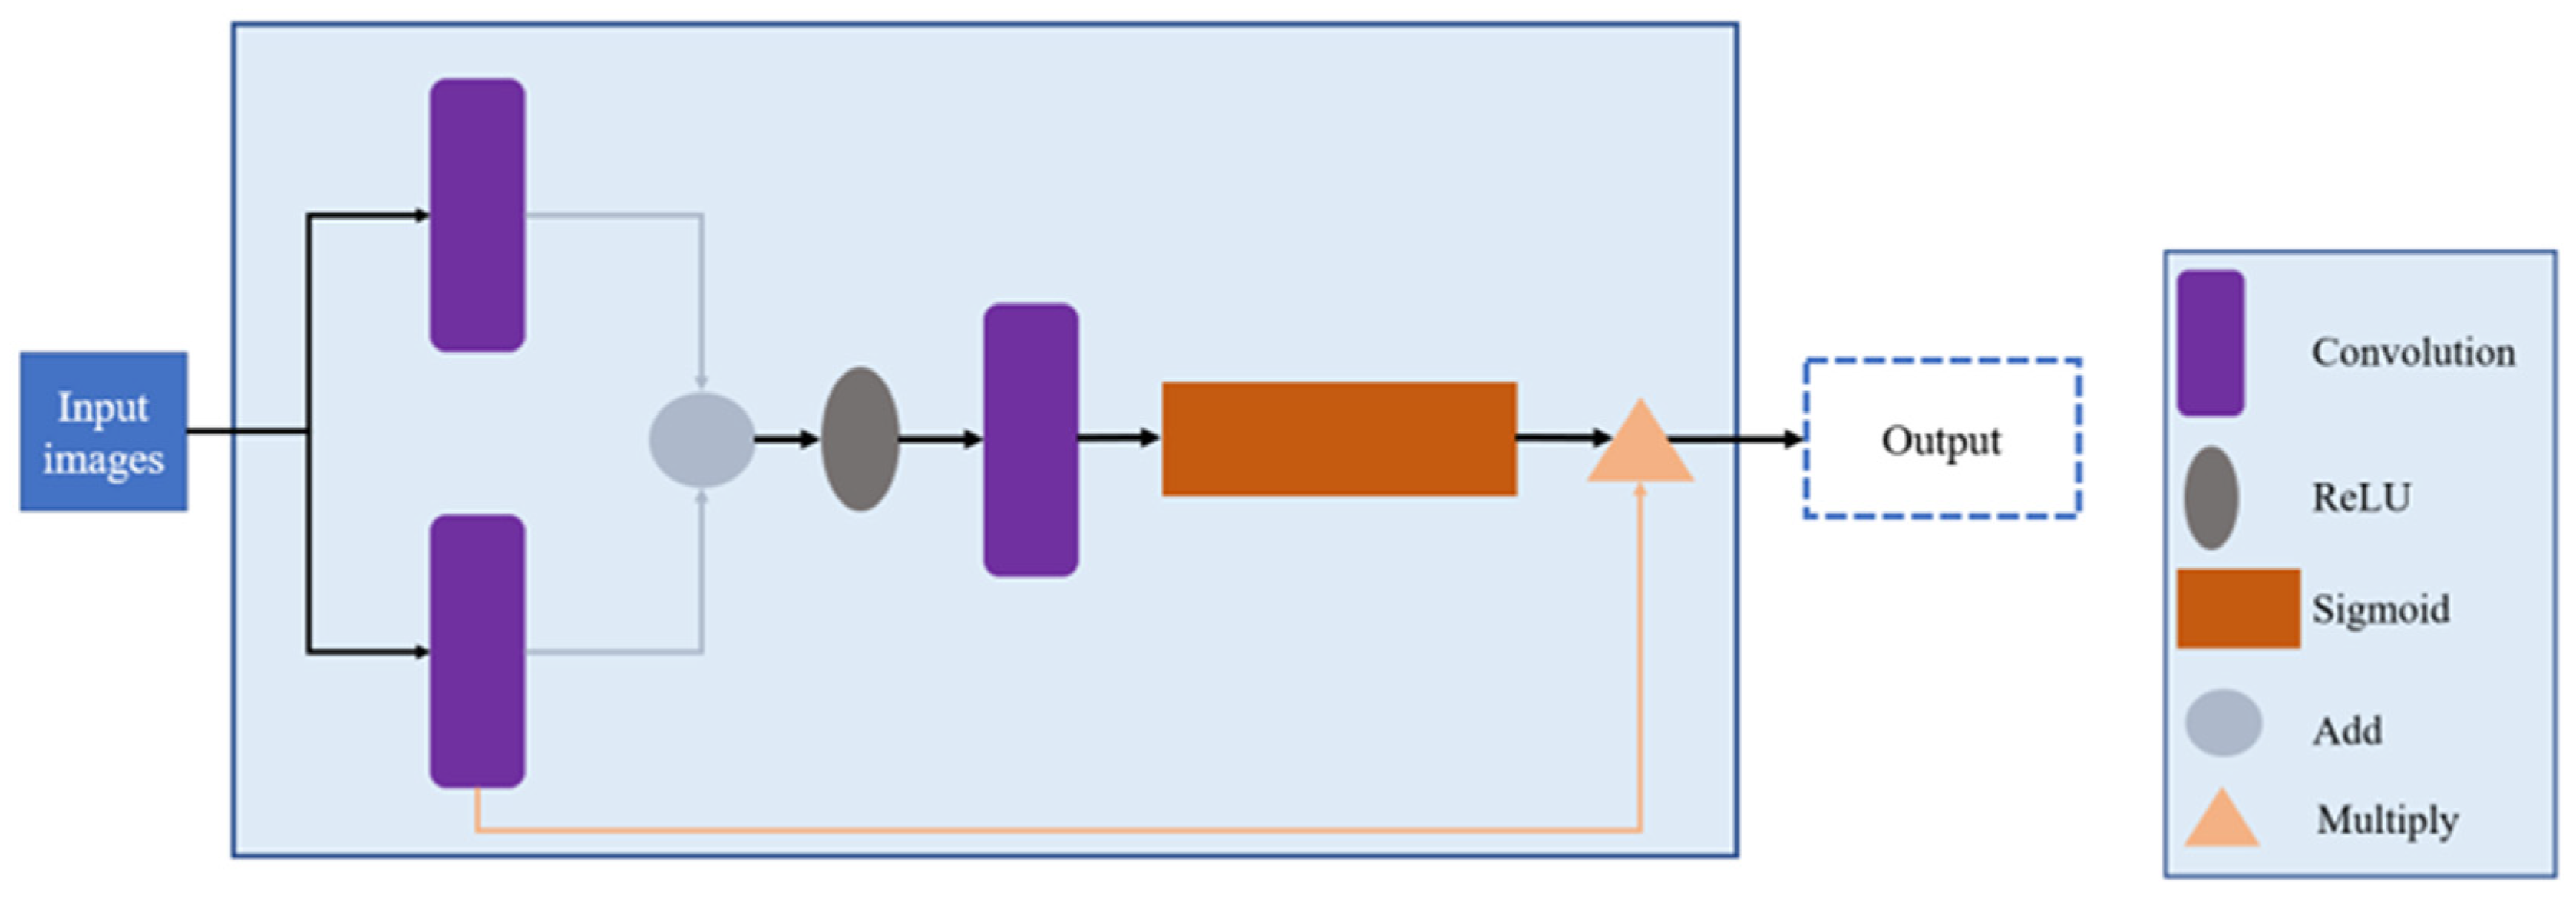
- Module adjustments;
- (3)
- Model architecture.
2.1. Training Parameters
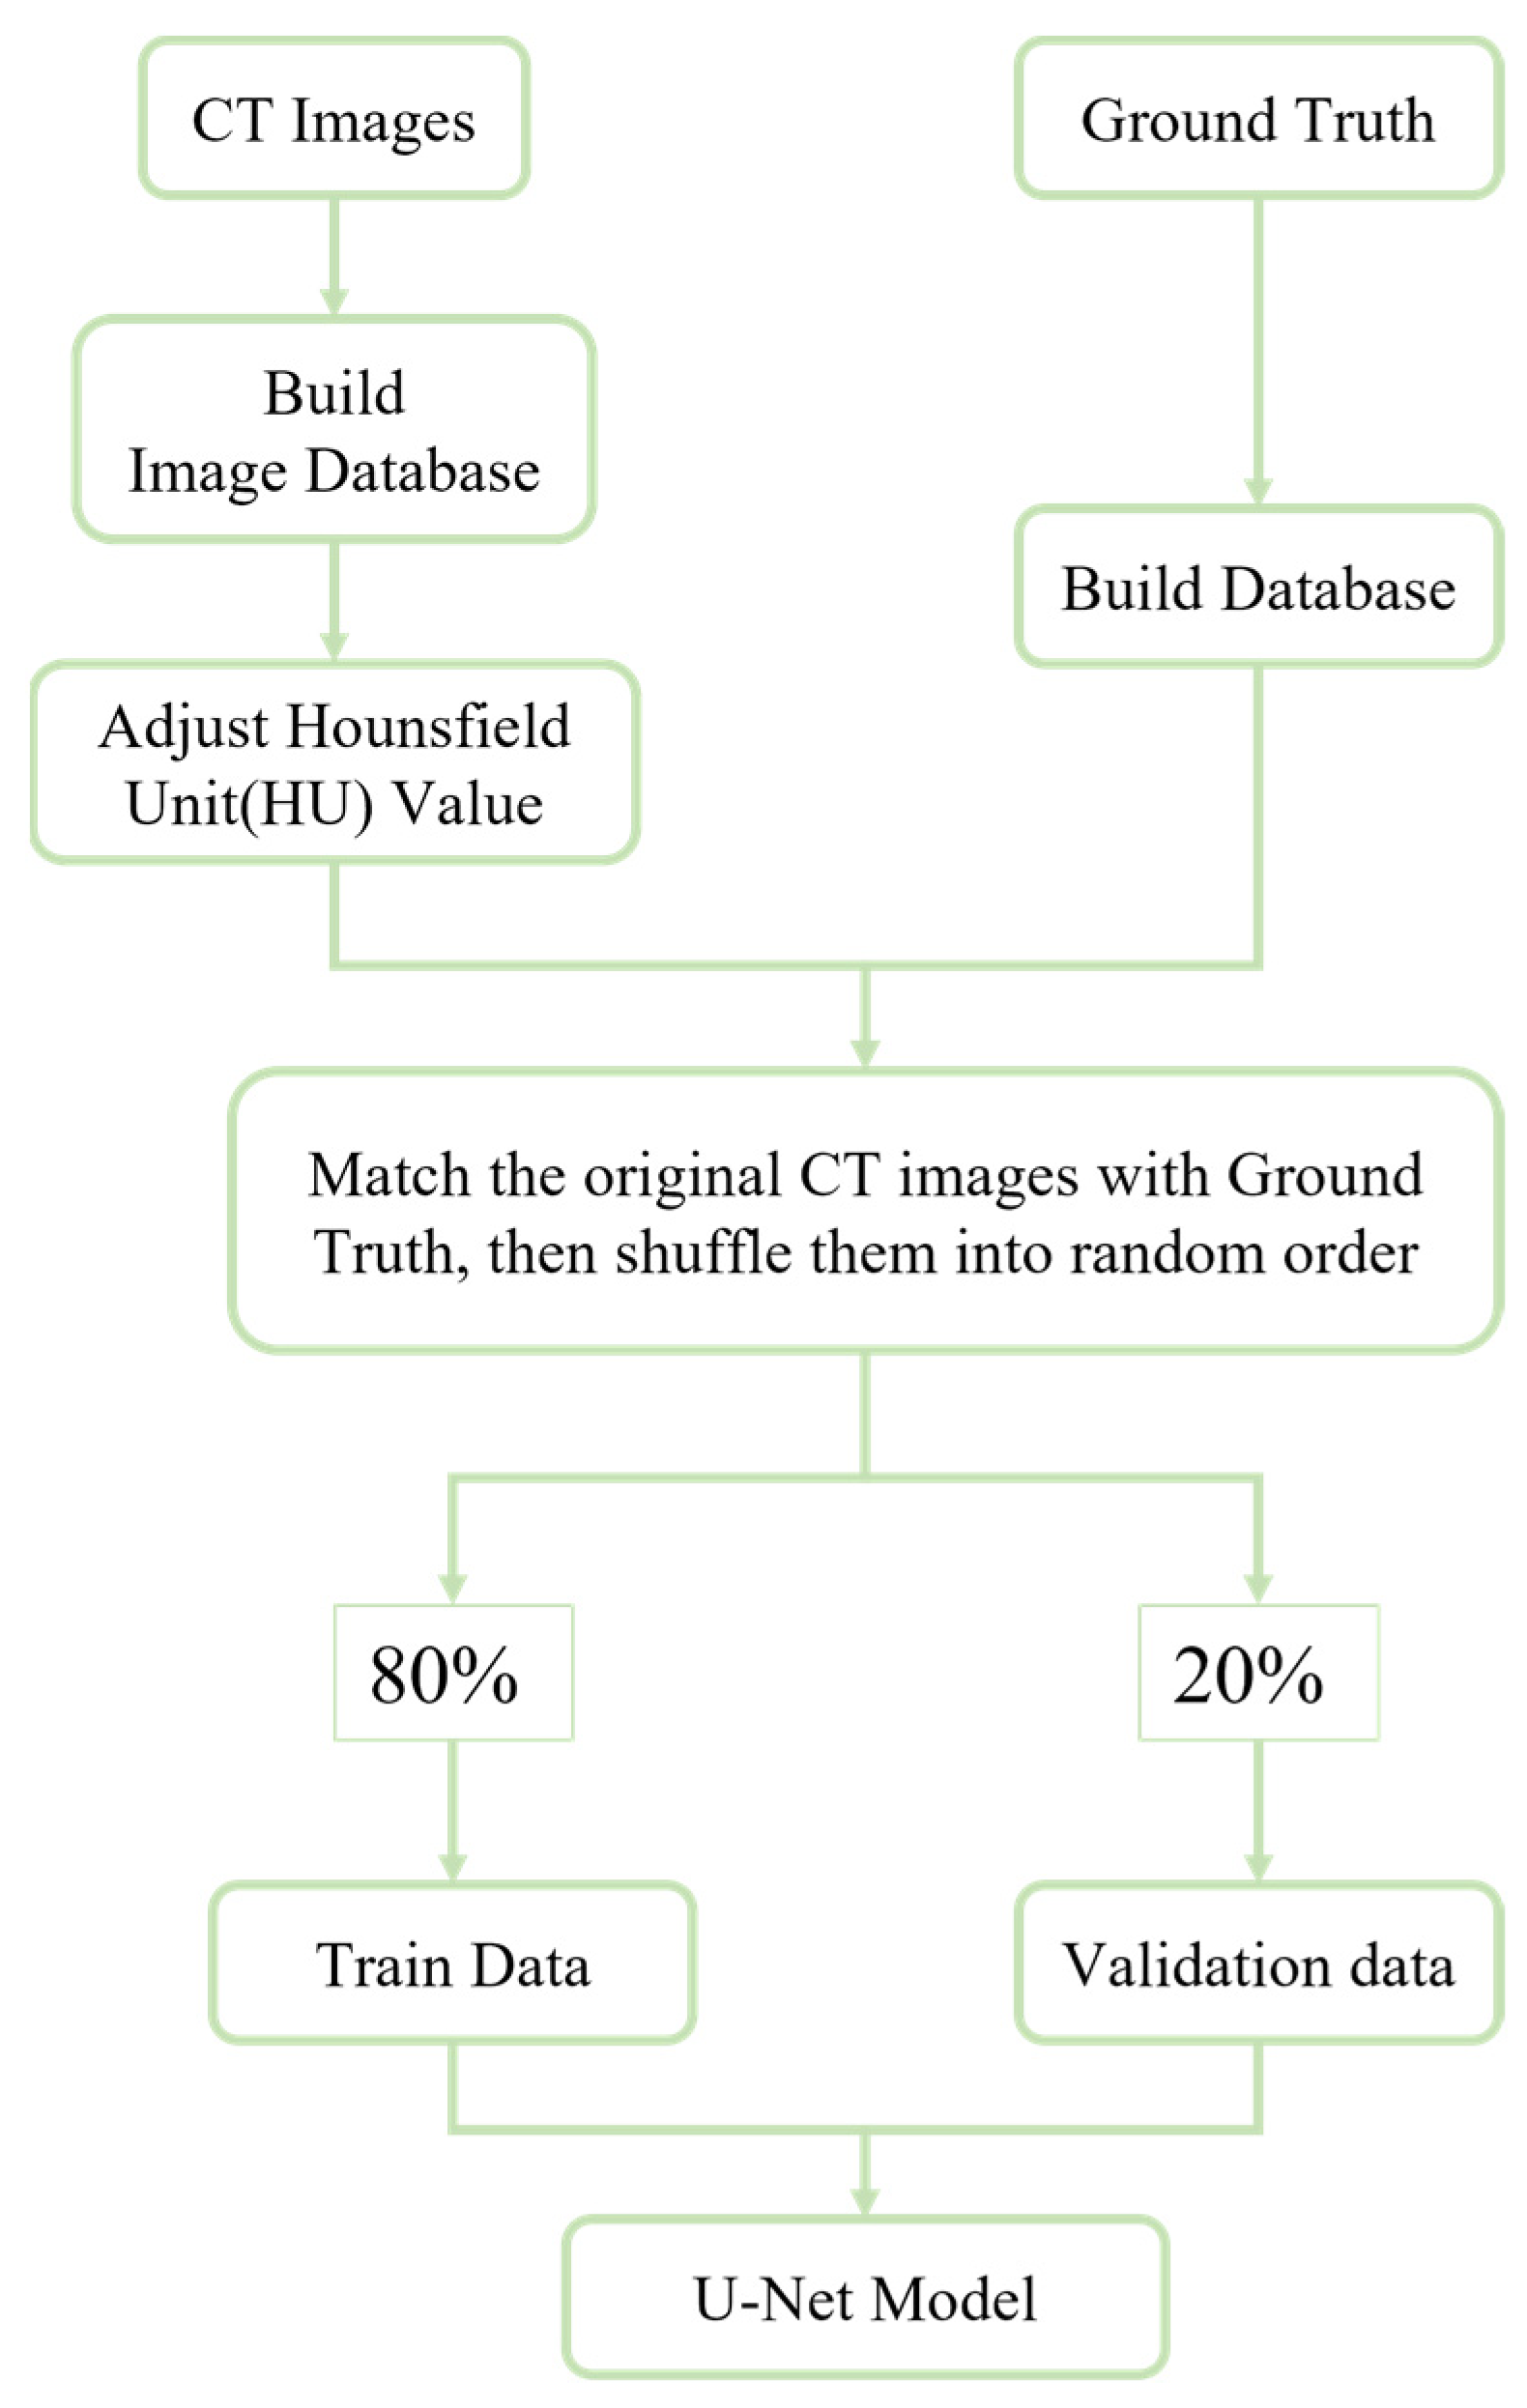
2.2. Data Set Creation and Image Processing
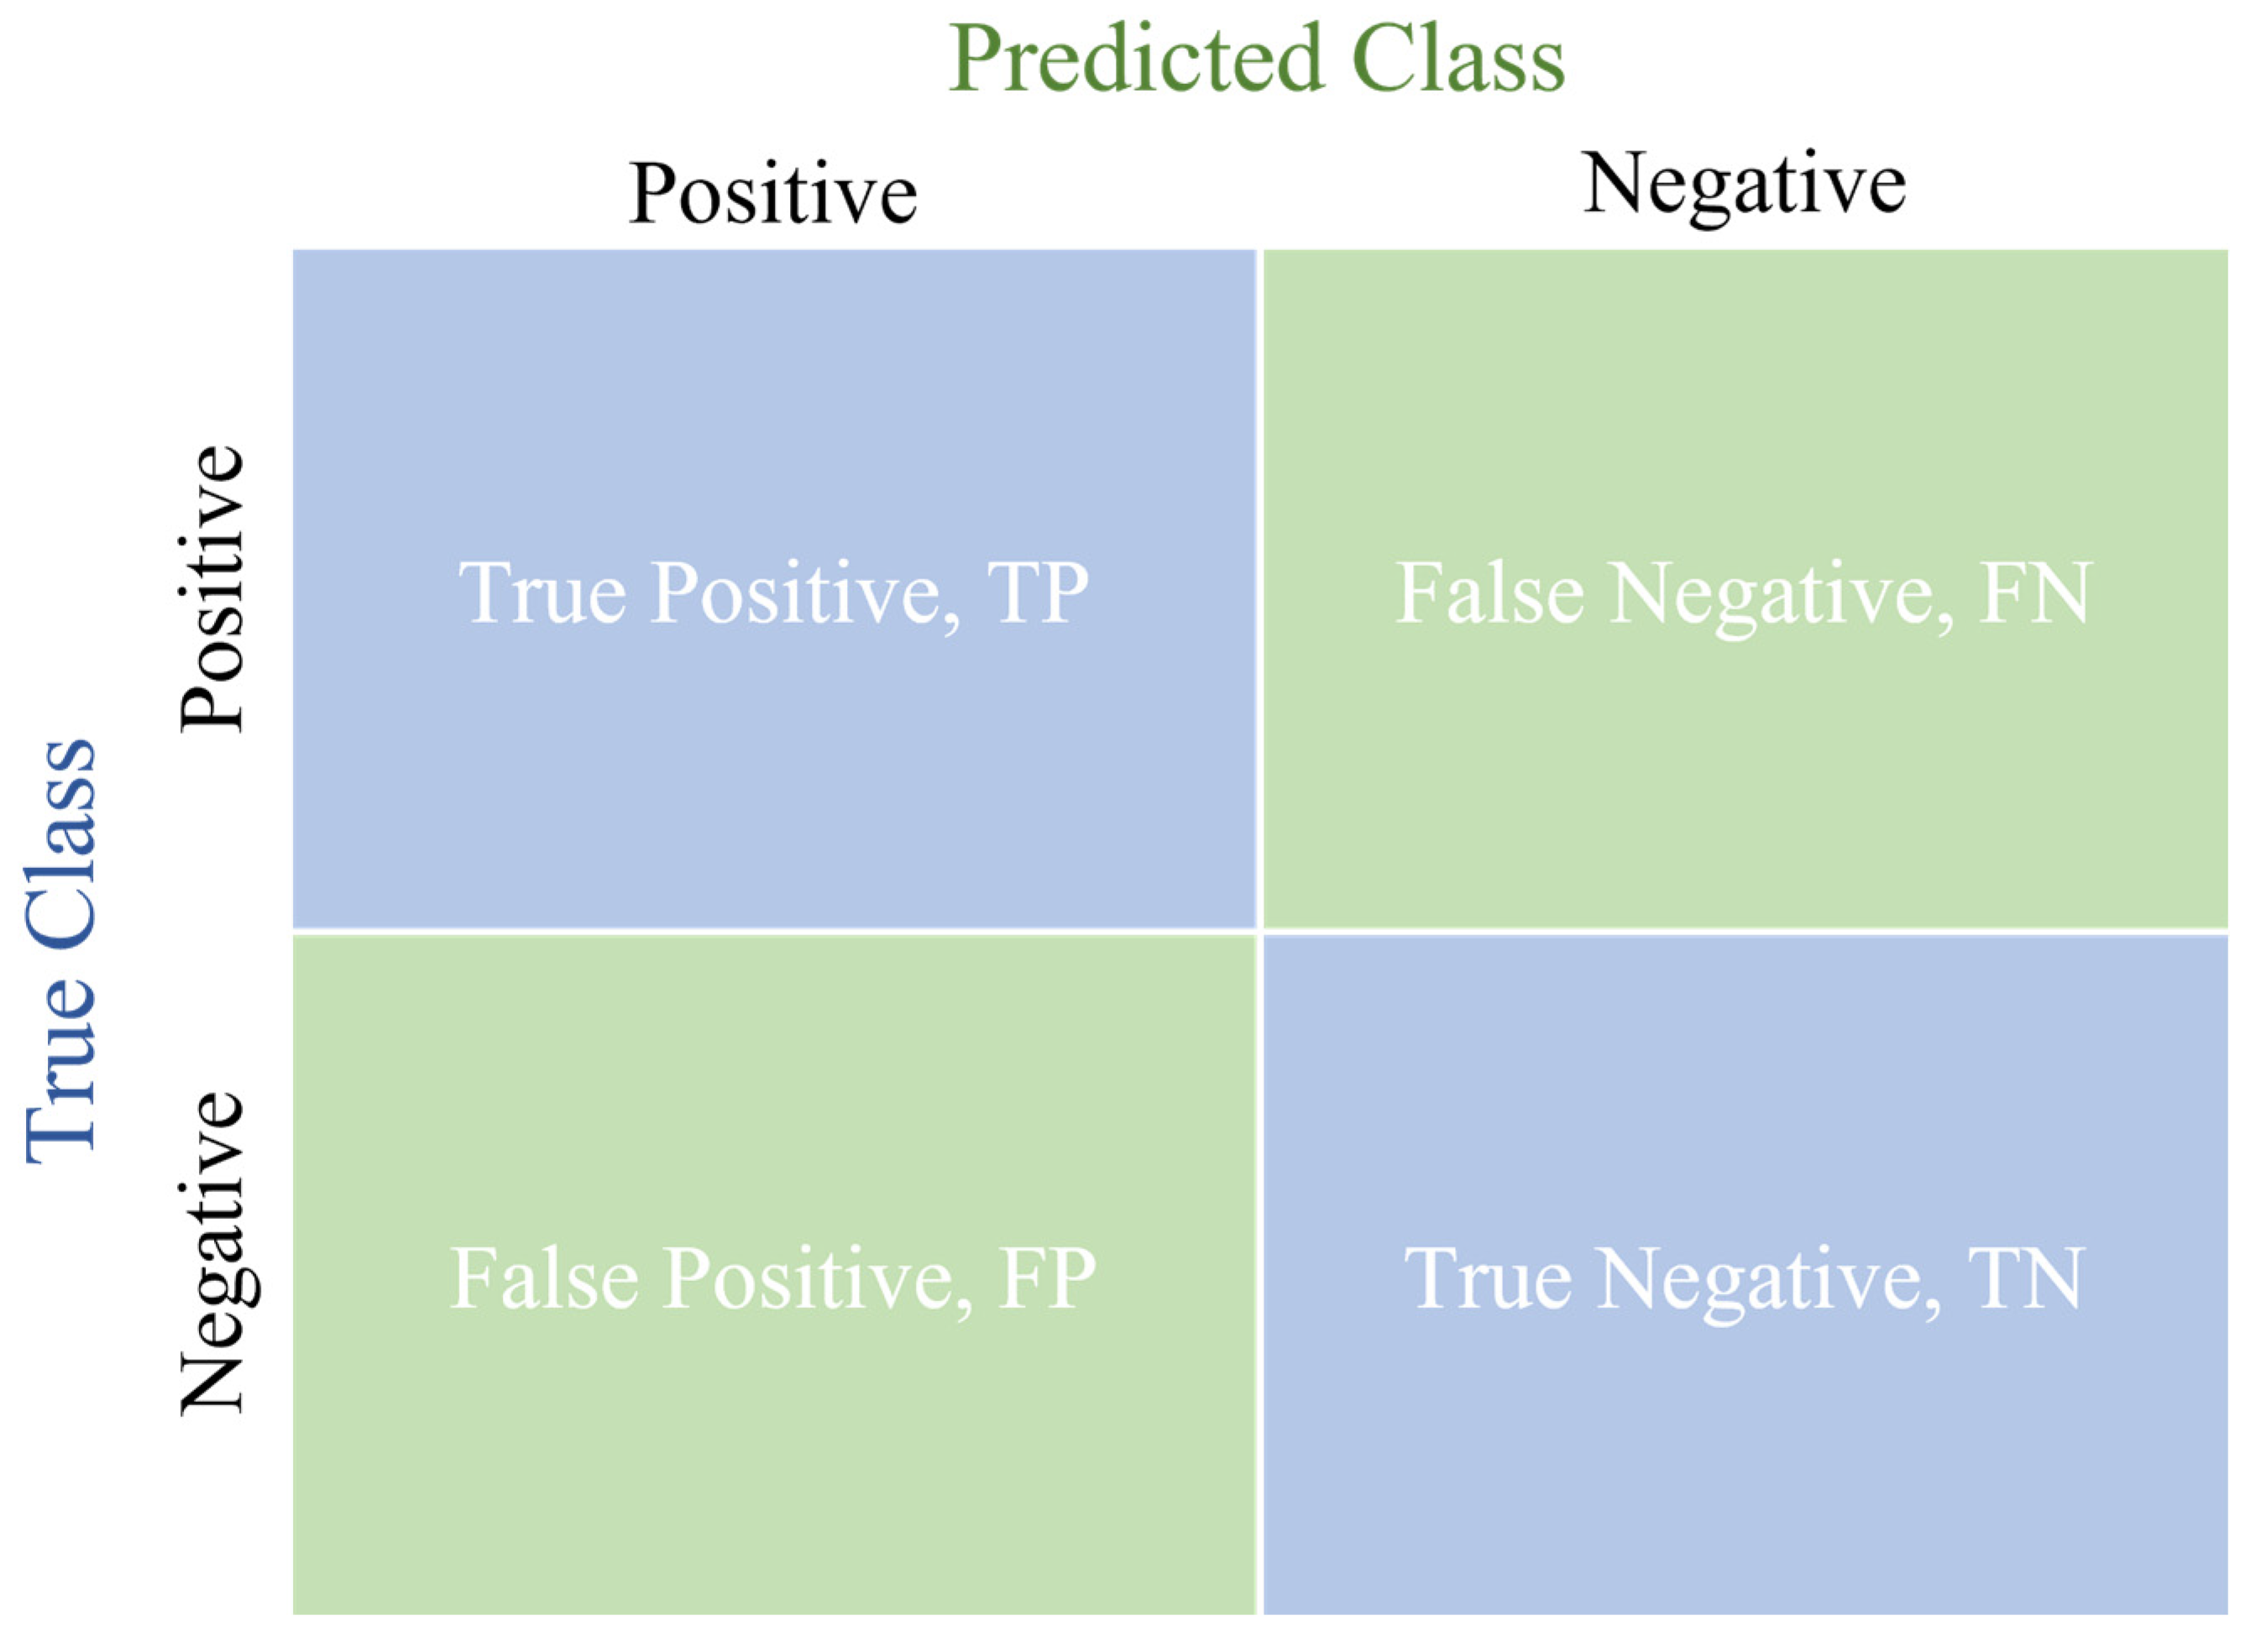
2.3. Evaluation Standards for Experimental Results
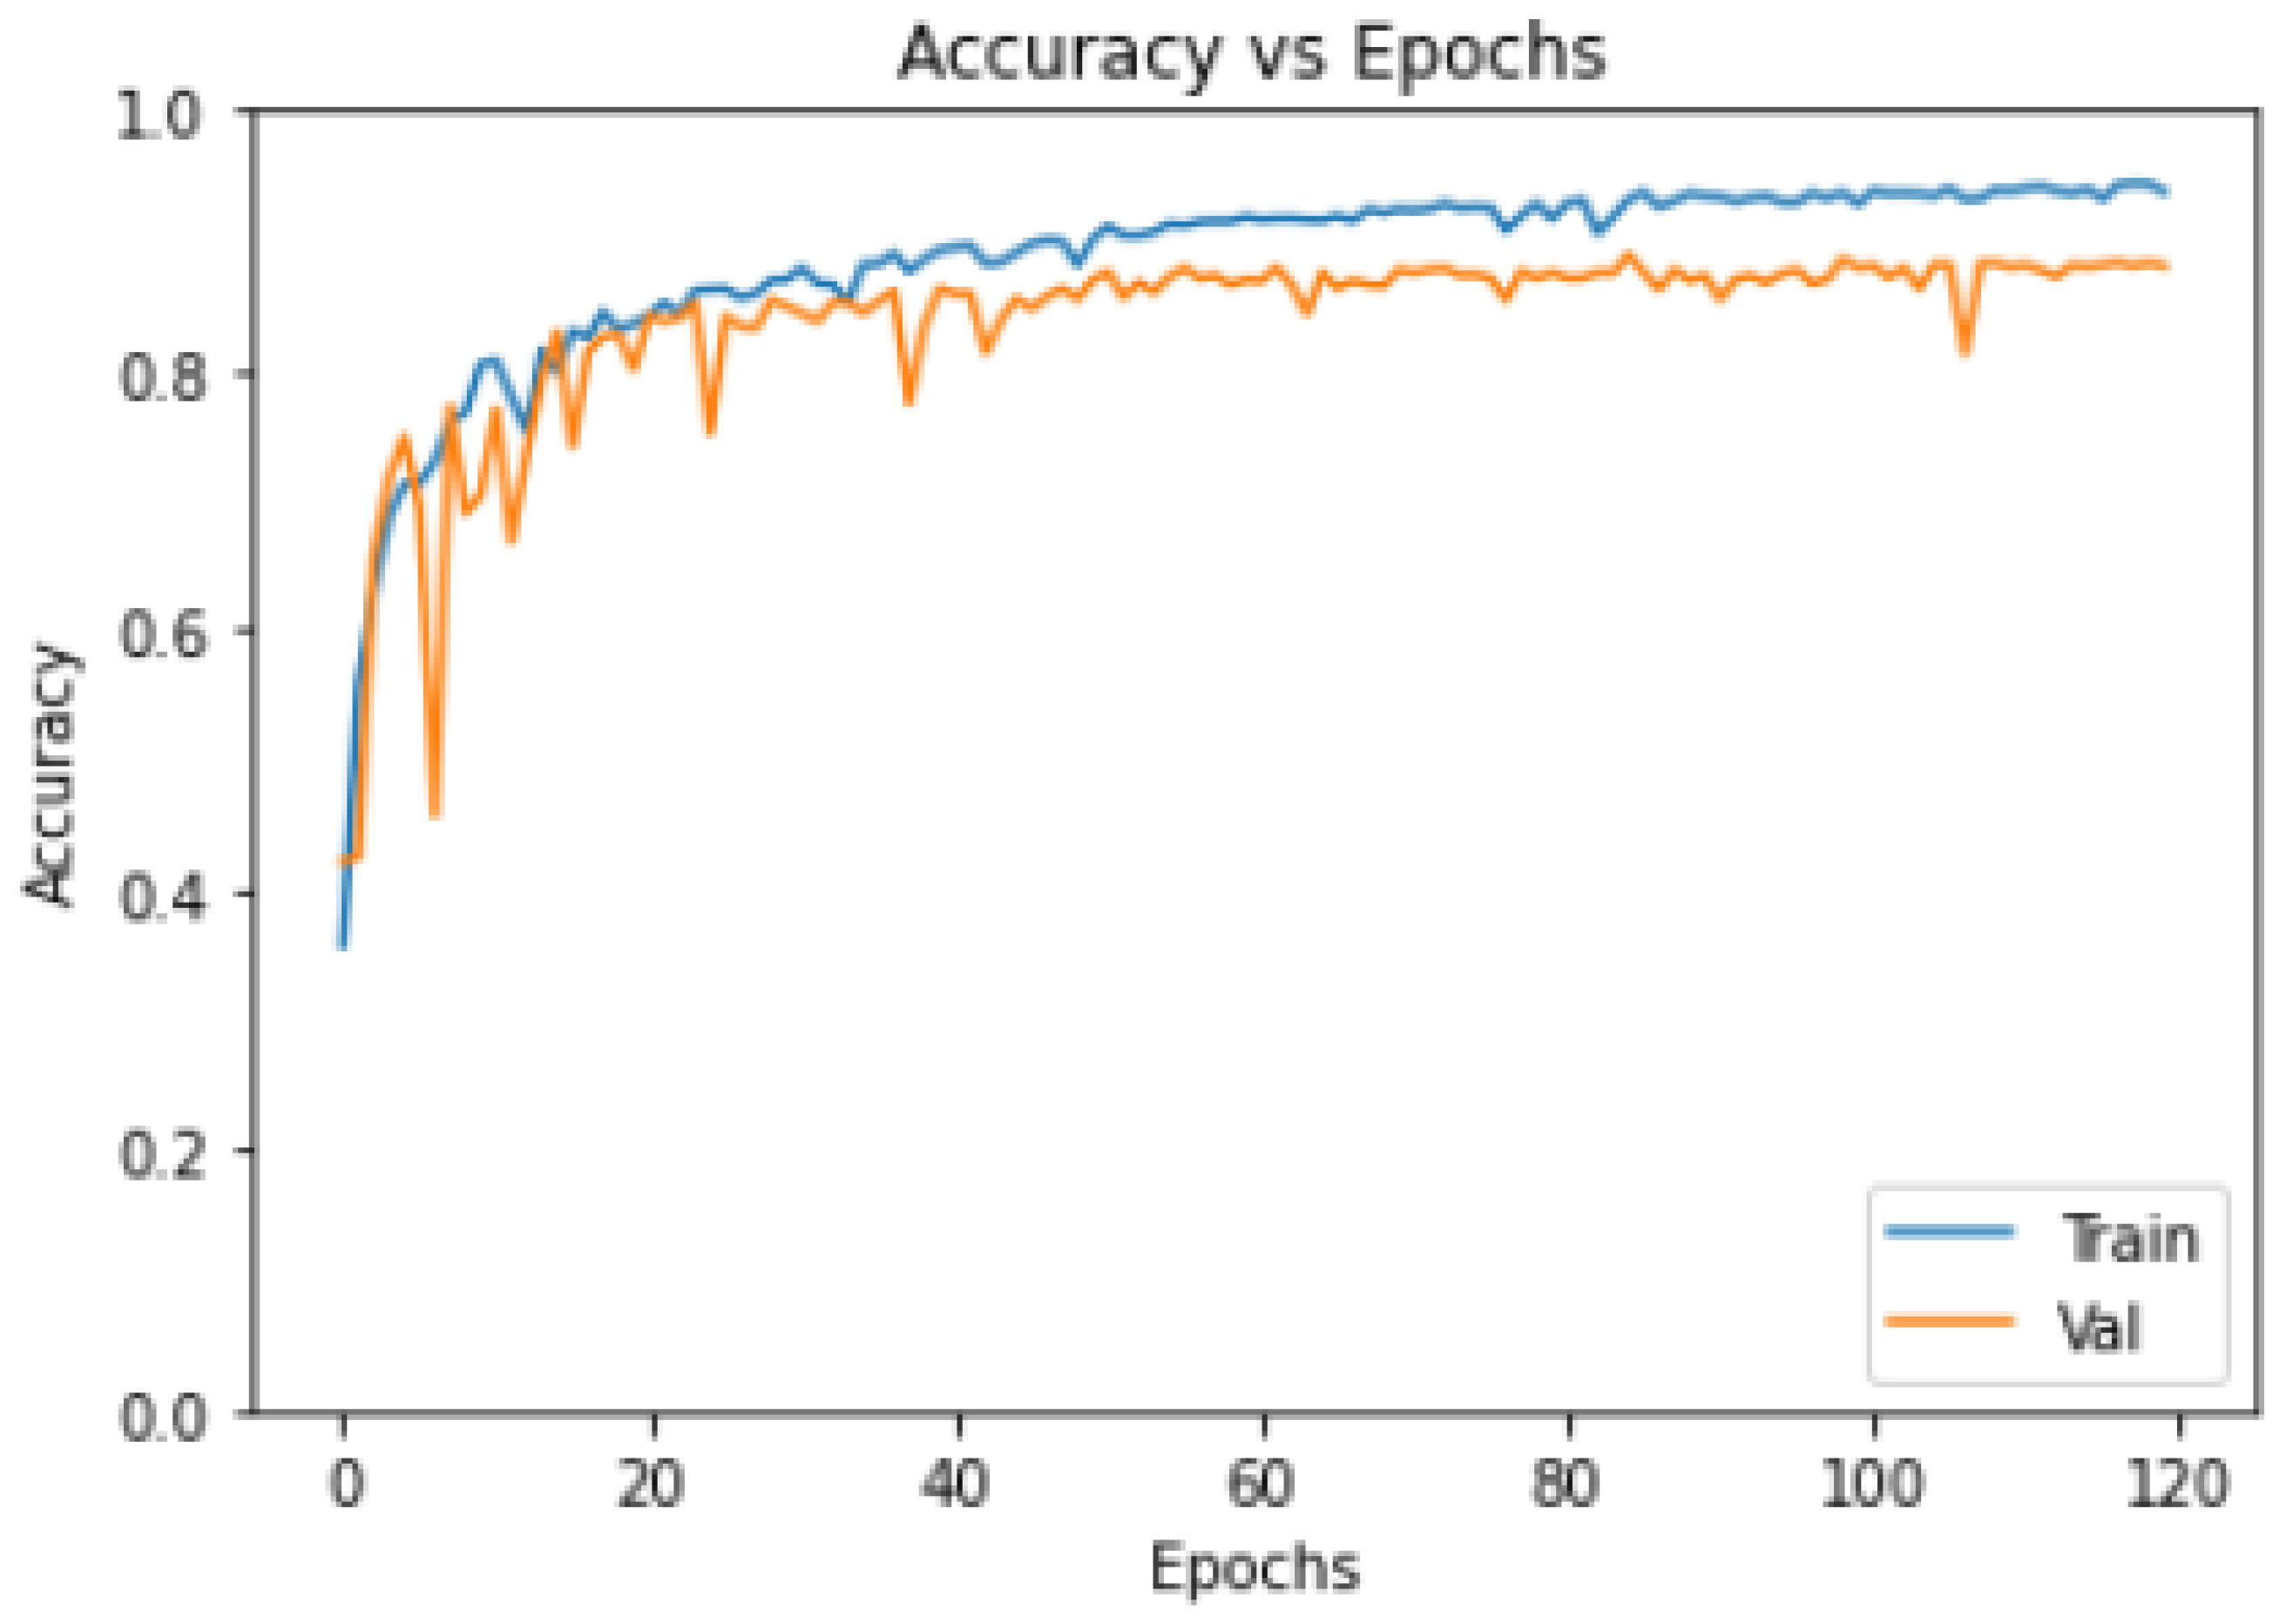
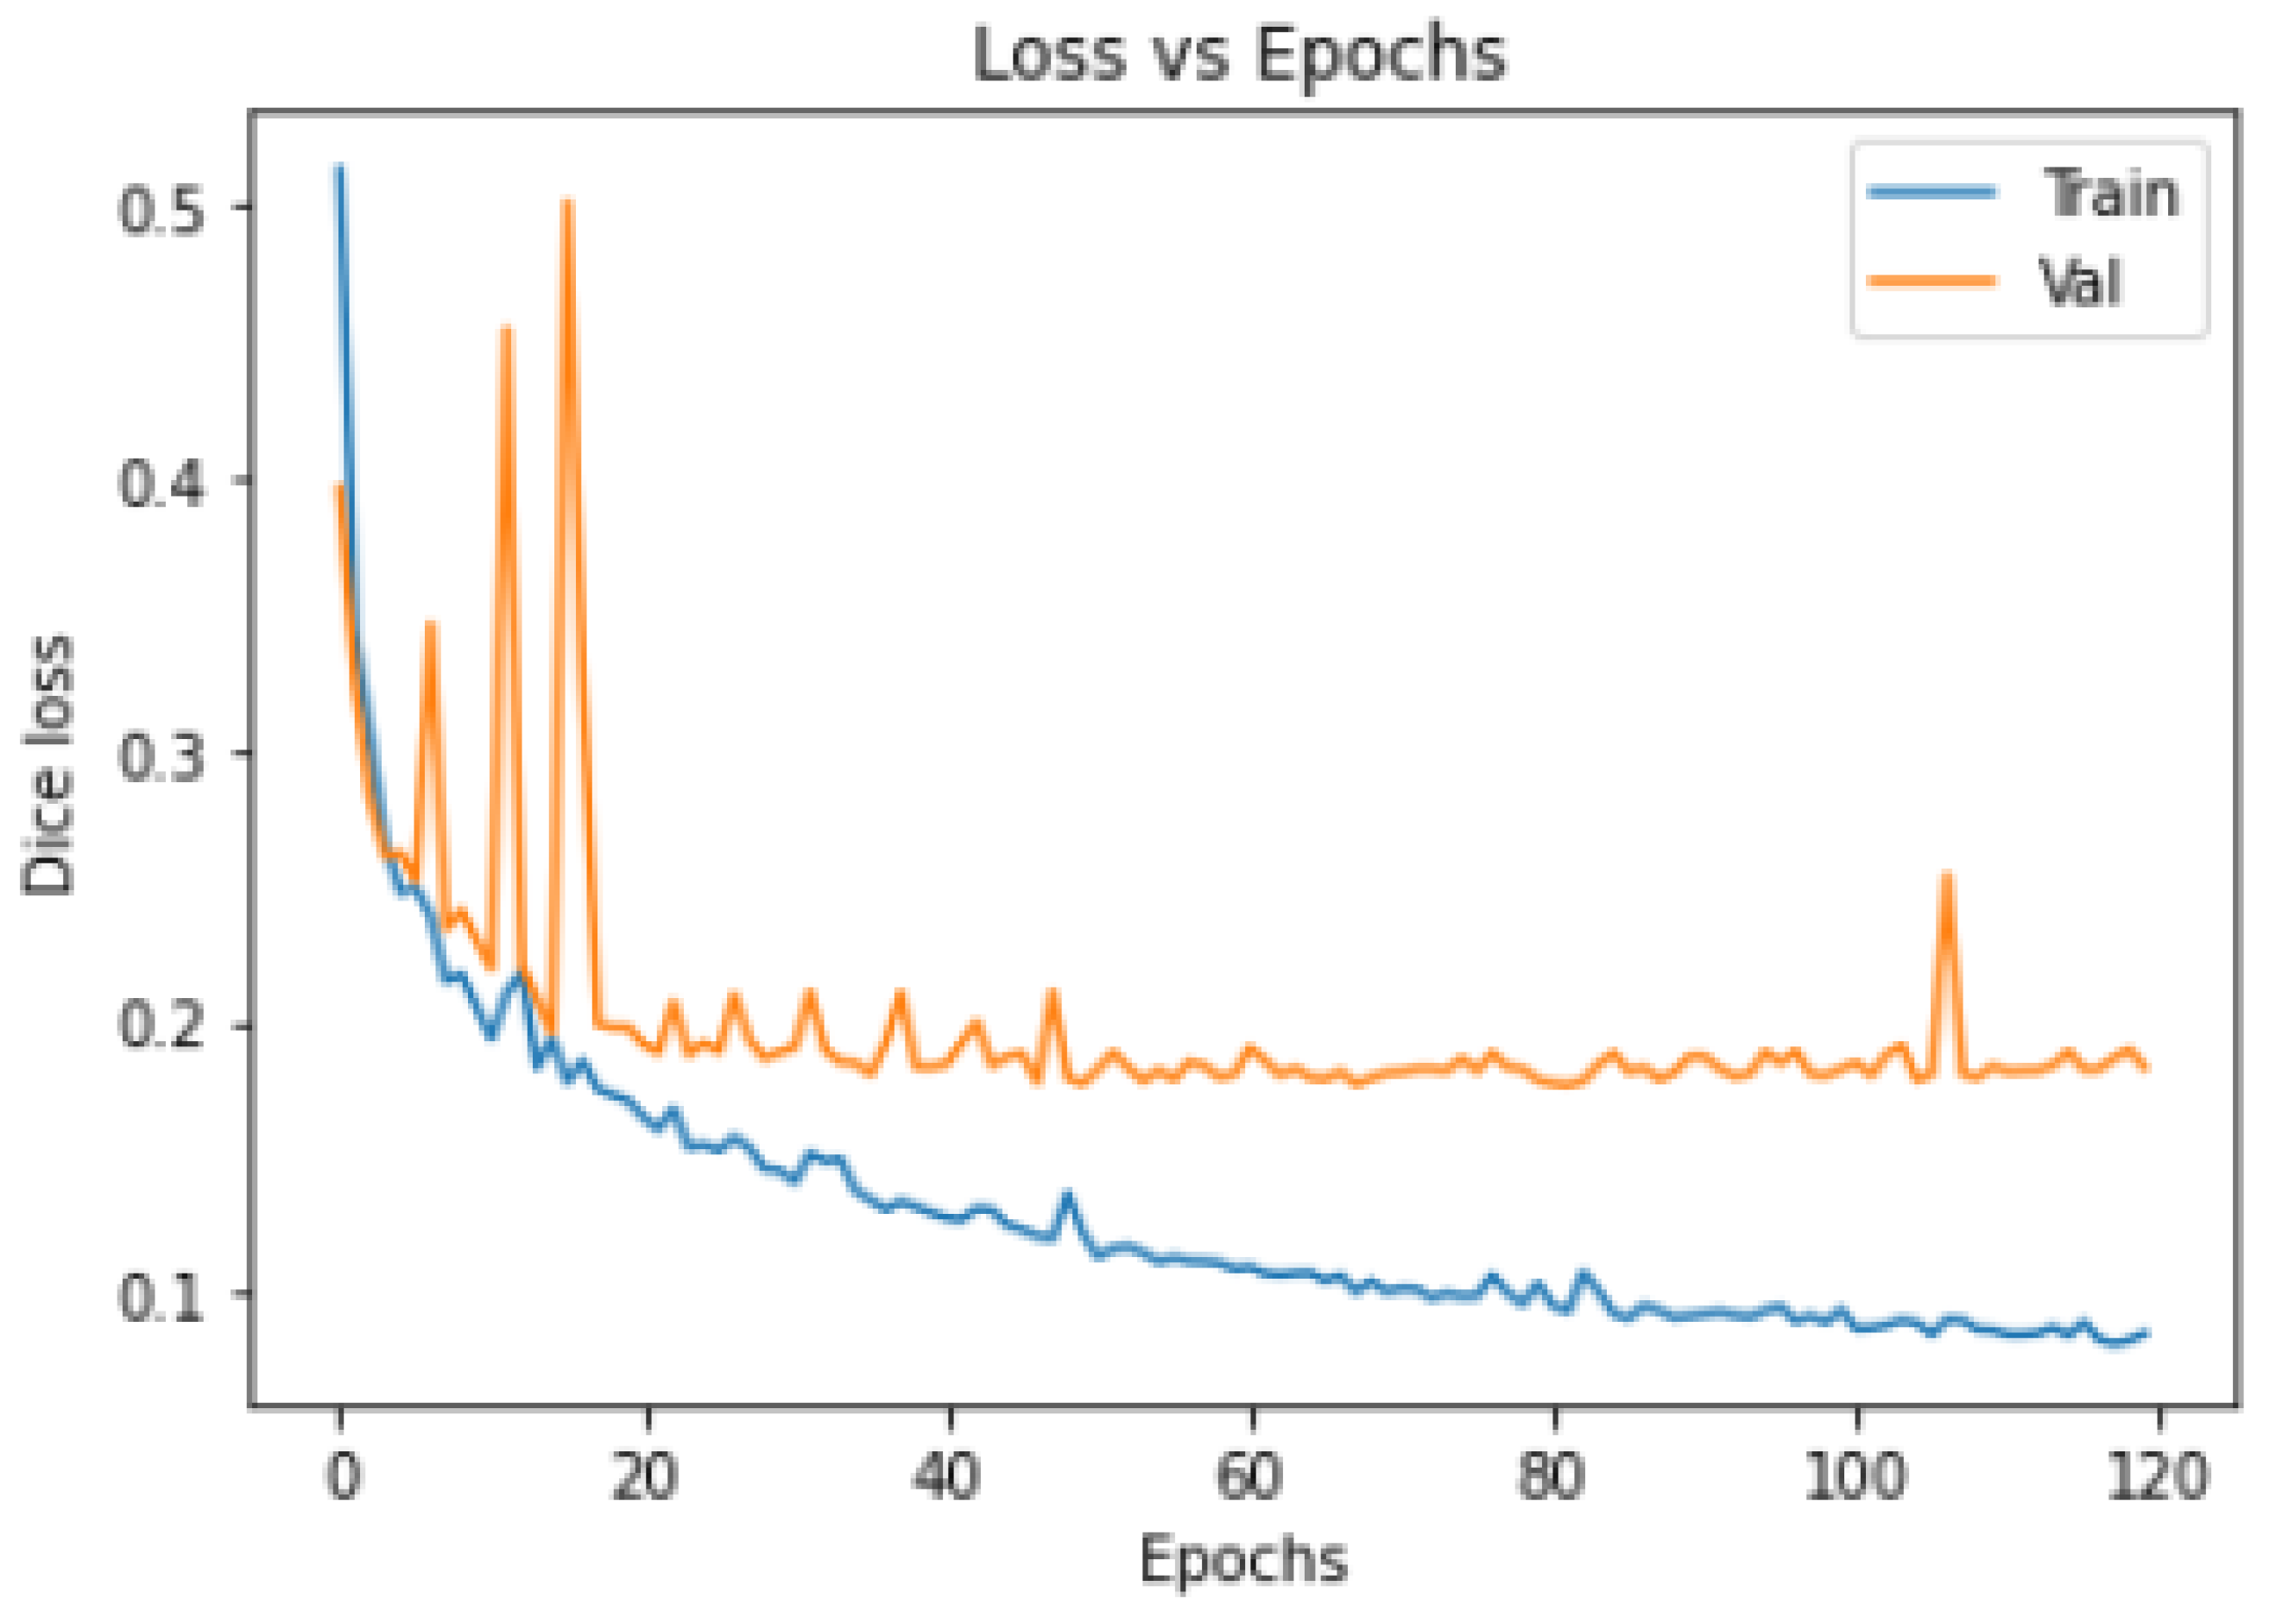
- Model Training Loss–Epochs/Accuracy–Epochs Curves:
- 2.
- Quantitative Metrics for Model Evaluation:
- 3.
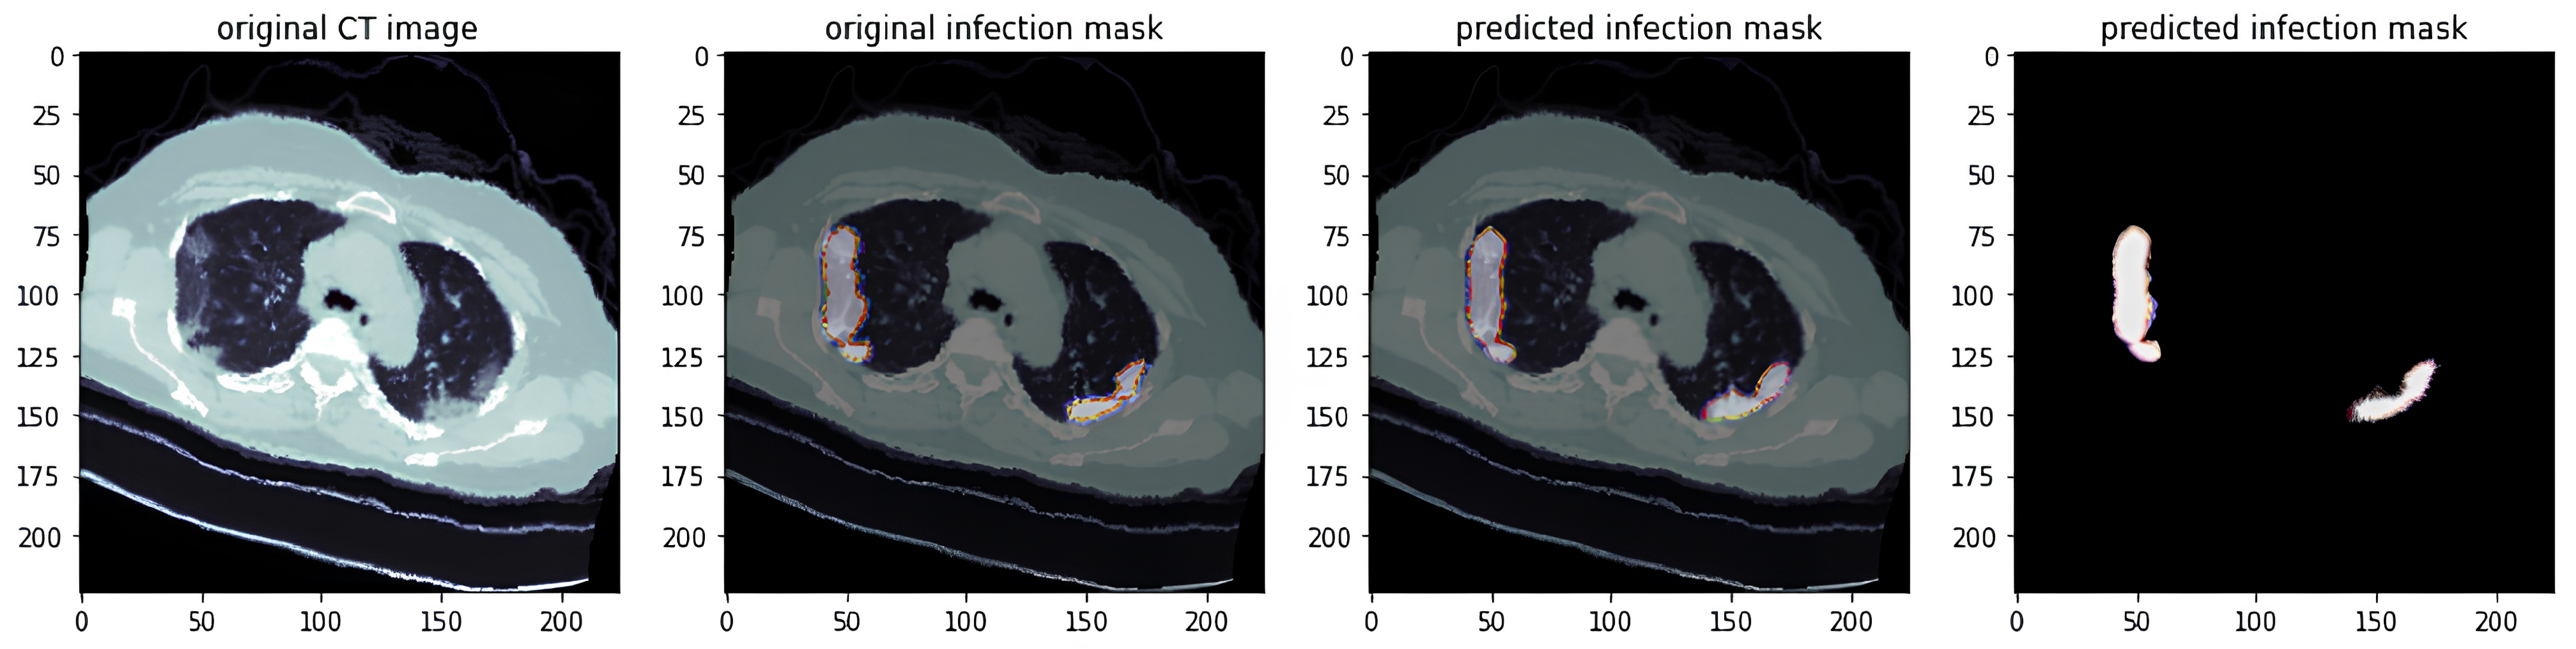
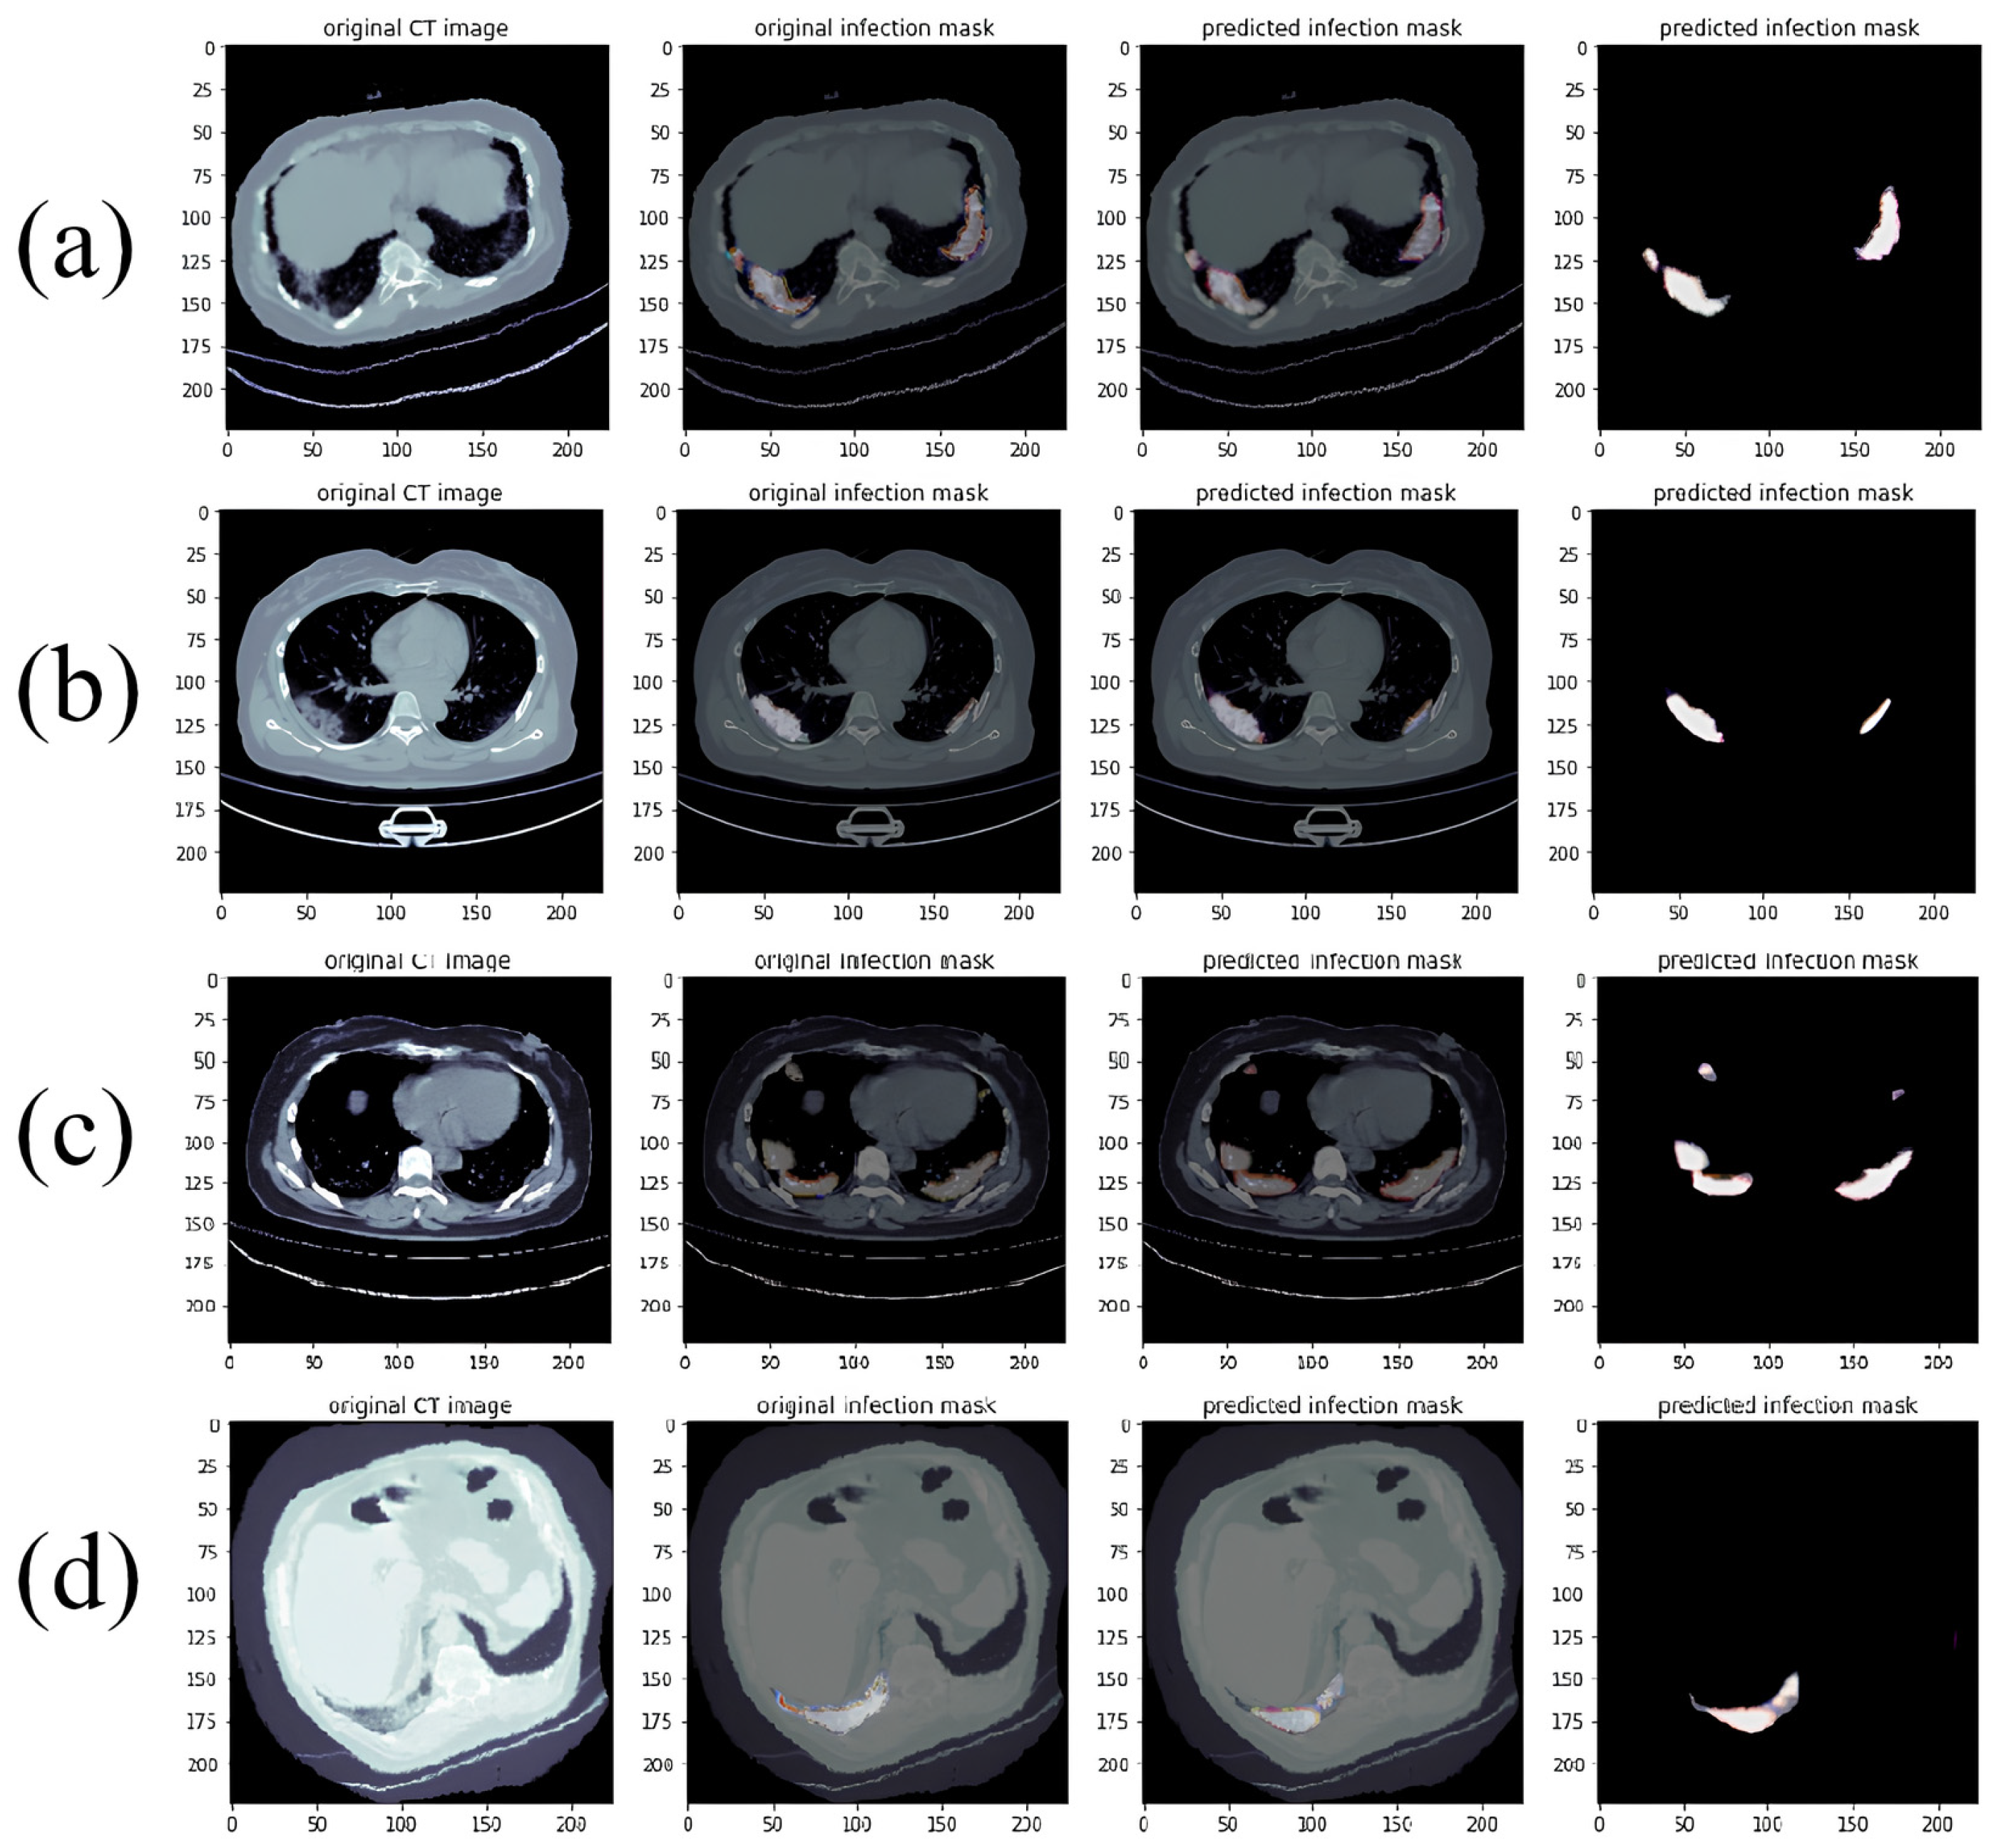
- Actual Predicted Lesion Segmentation Output:
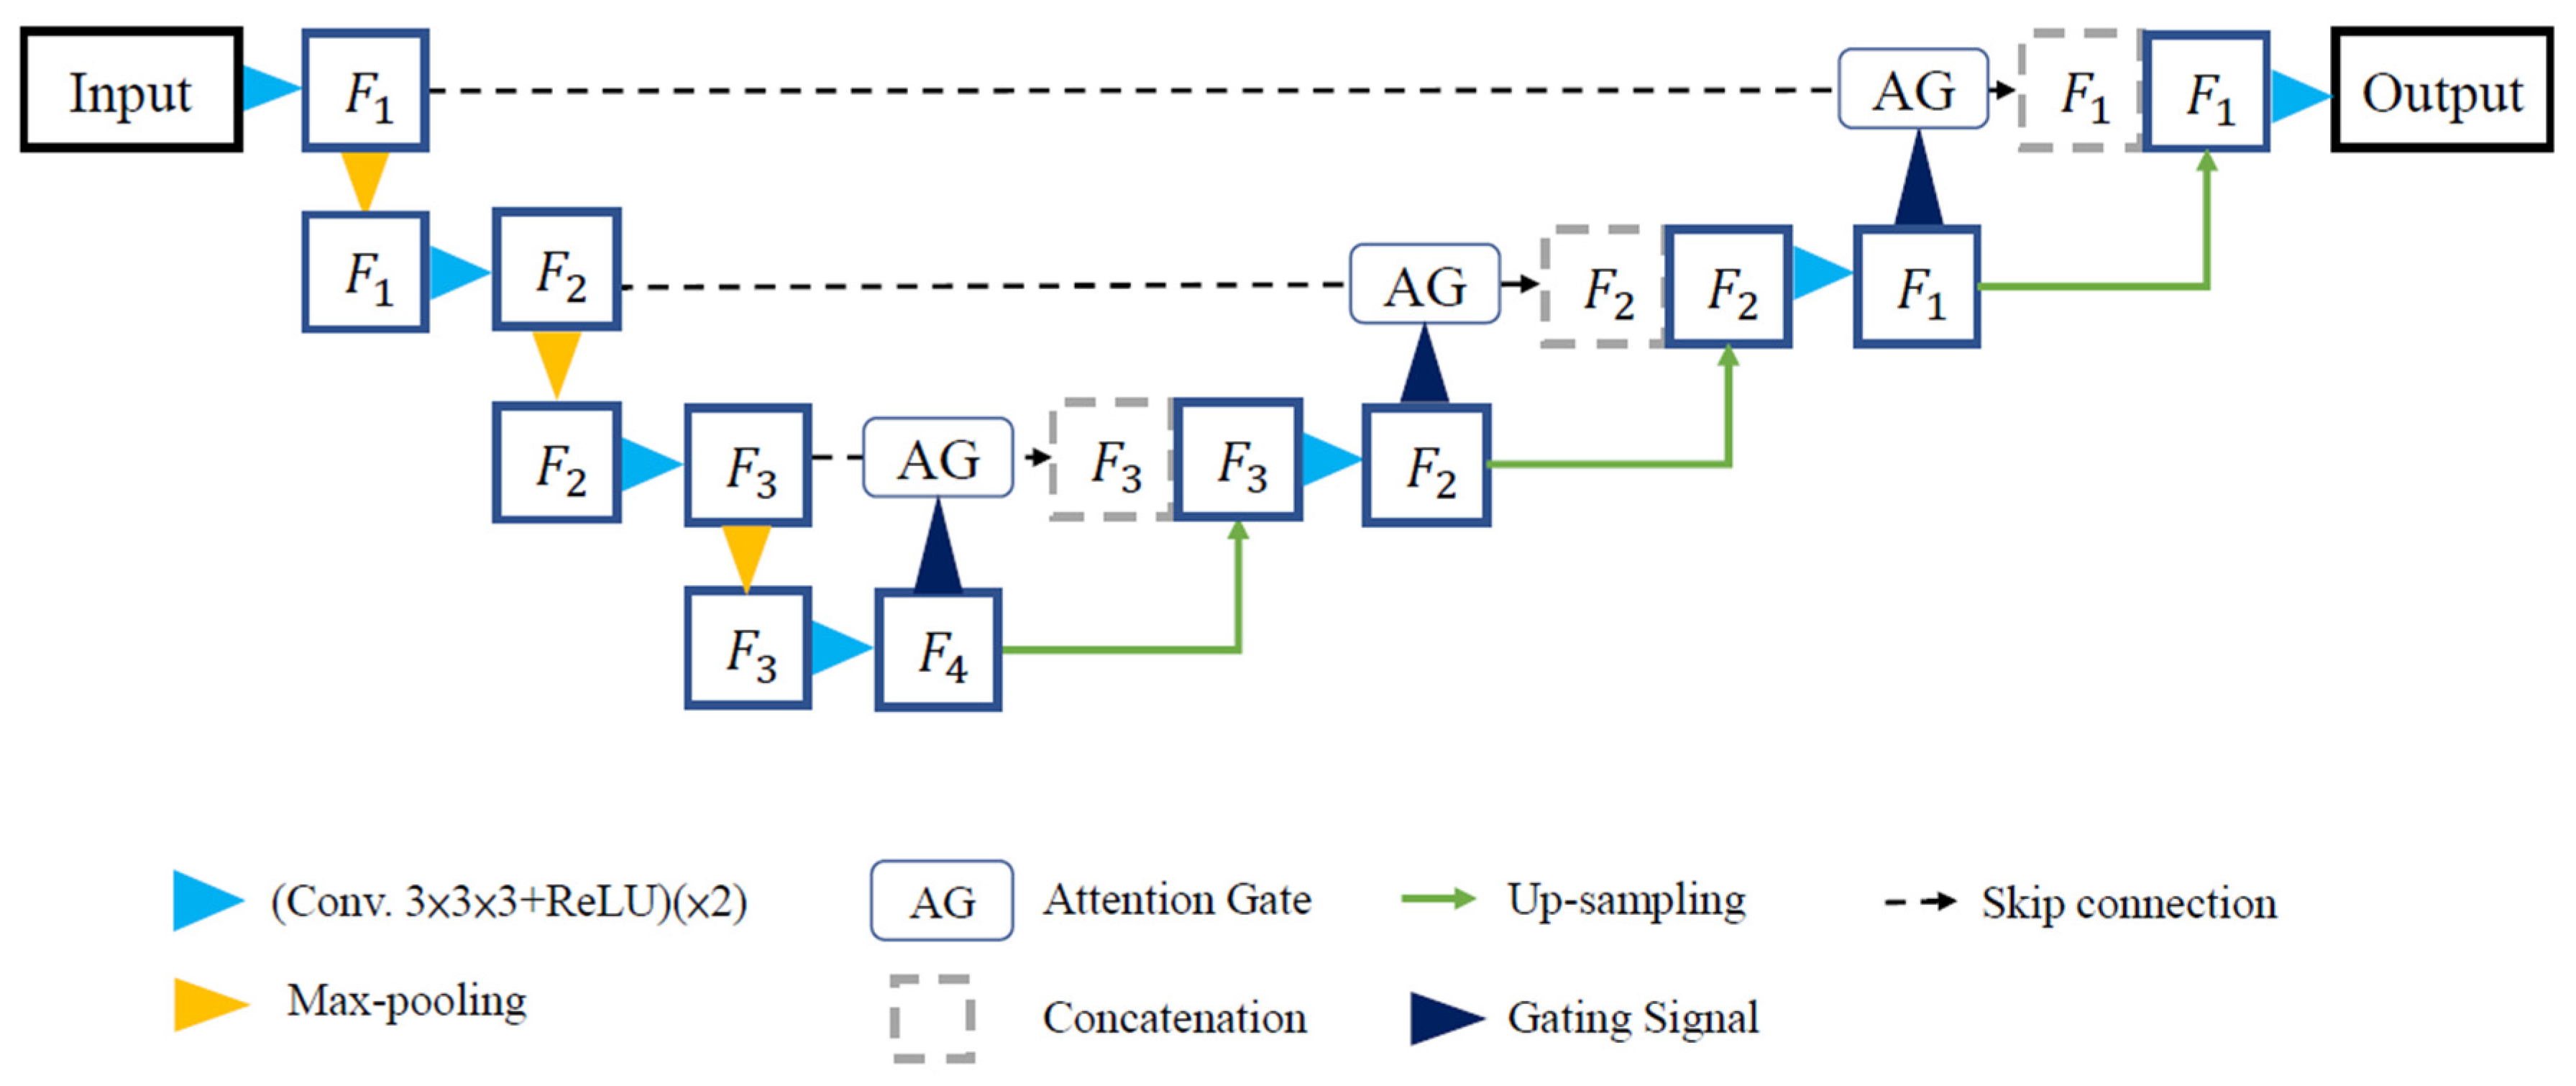
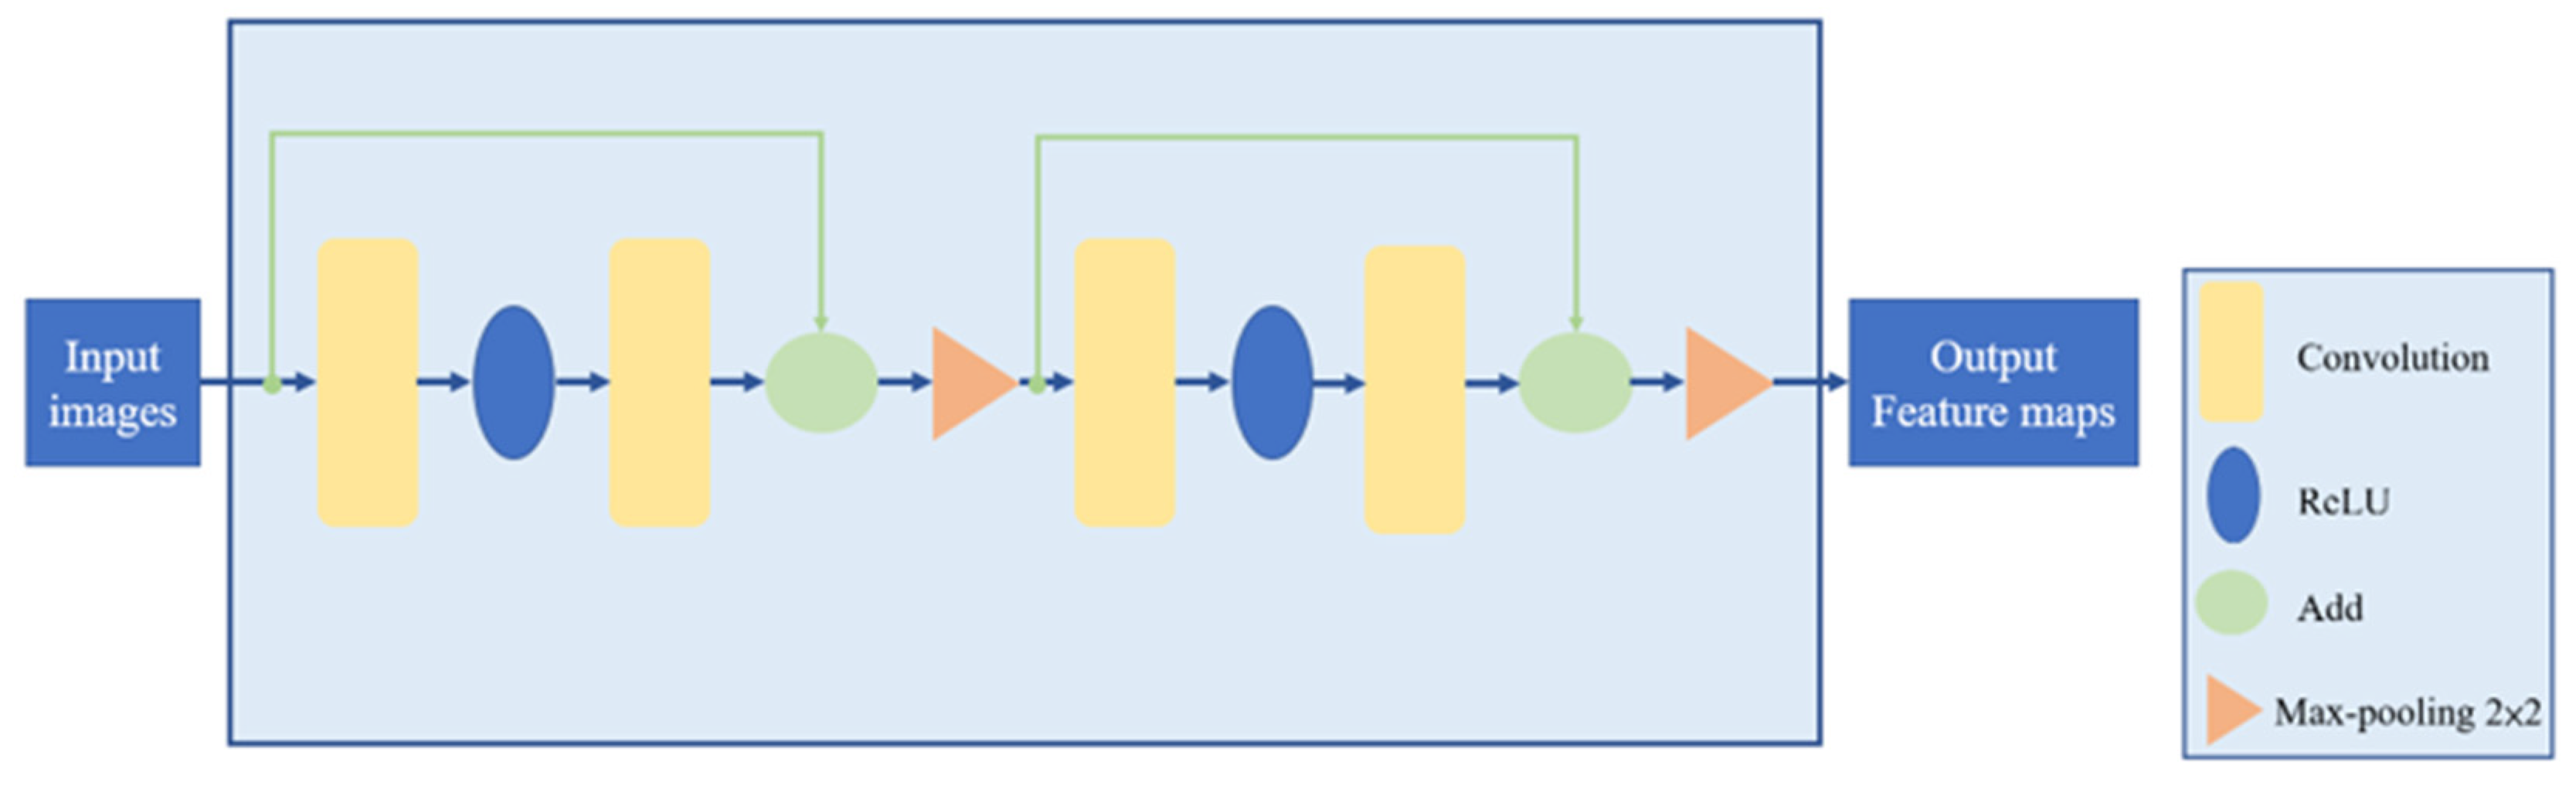
2.4. Model Framework
2.5. Training Environment Setup
3. Results and Discussion
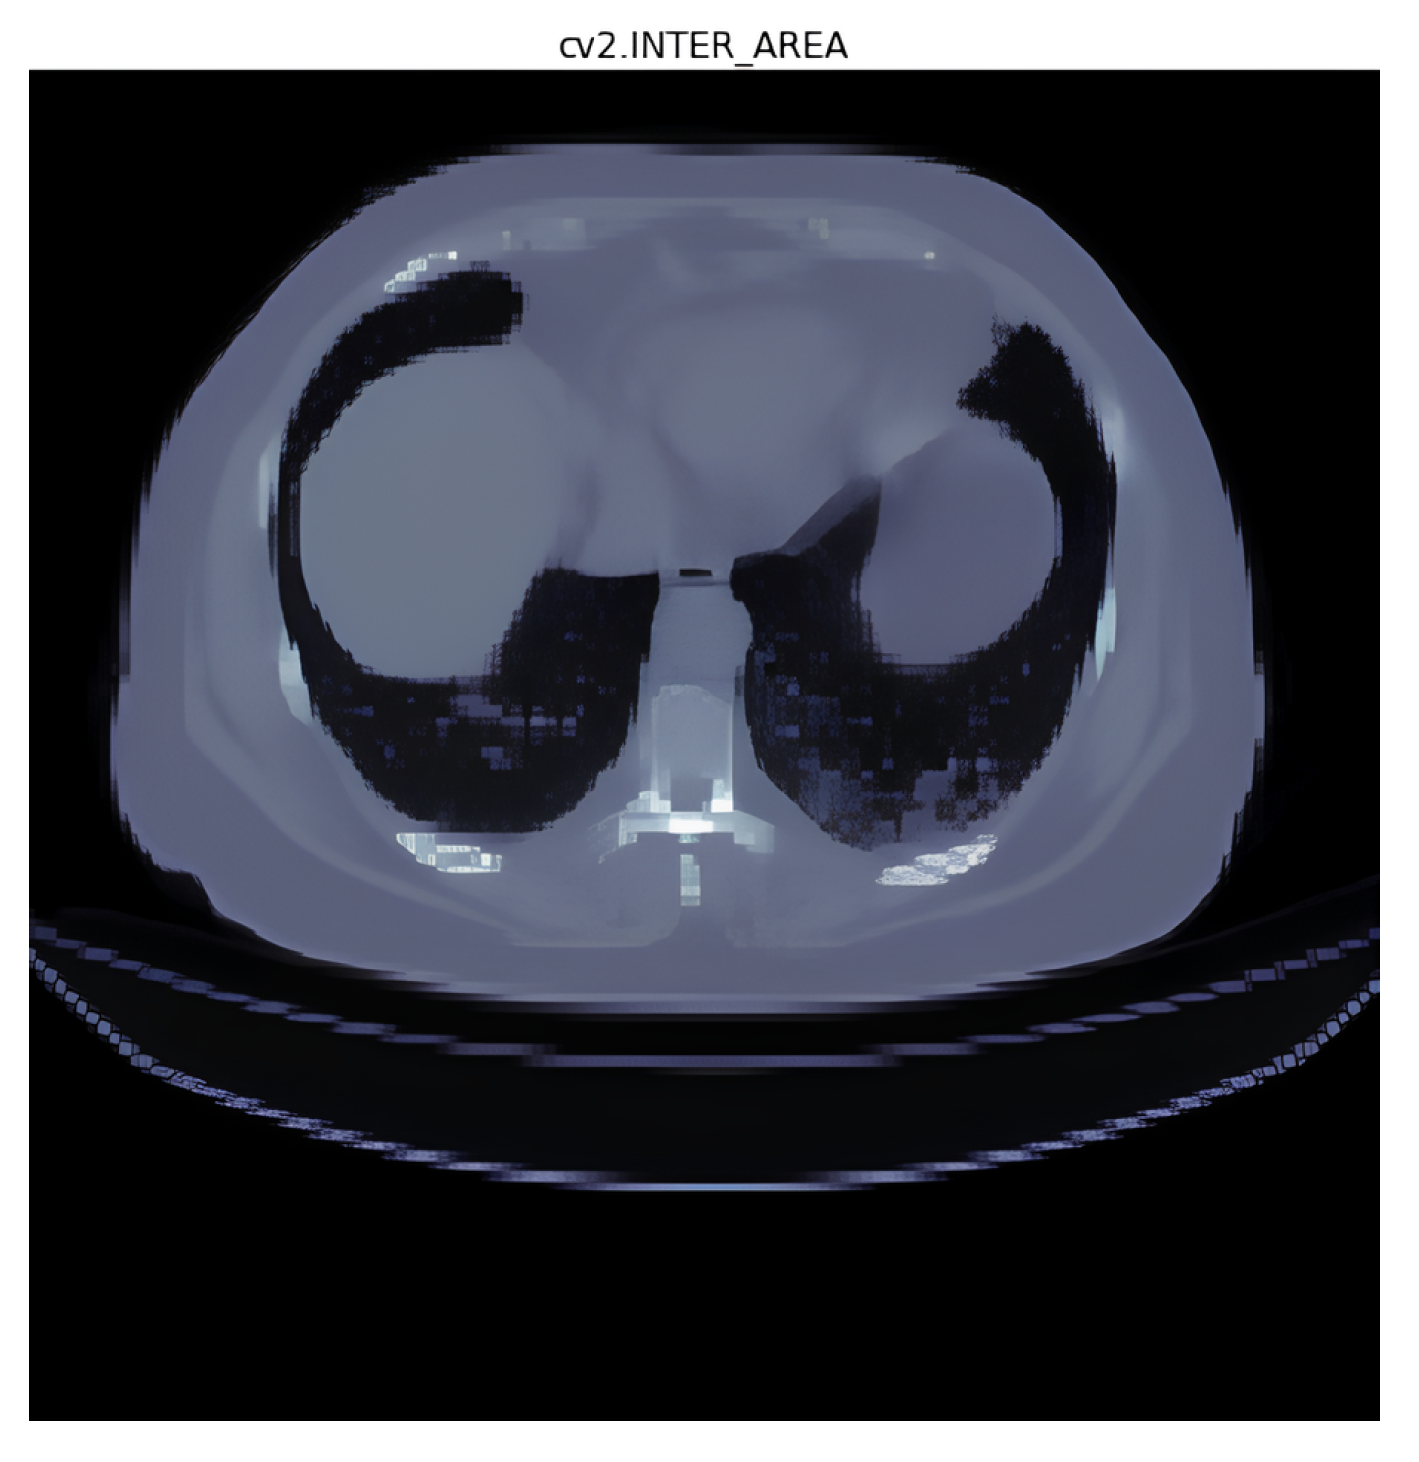
3.1. Interpolation Method Selection
- (1)
- Area interpolation [30]: Also known as “Pixel Area Resampling”, this method calculates the average pixel value within each target pixel’s area. It is useful when resizing images to reduce the blocky artifacts that may occur with other methods like nearest neighbor interpolation;
- (2)
- Linear interpolation [31]: Linear interpolation uses a straight line between two adjacent data points to estimate the value at the target point. It is computationally efficient and suitable for smoothly varying data;
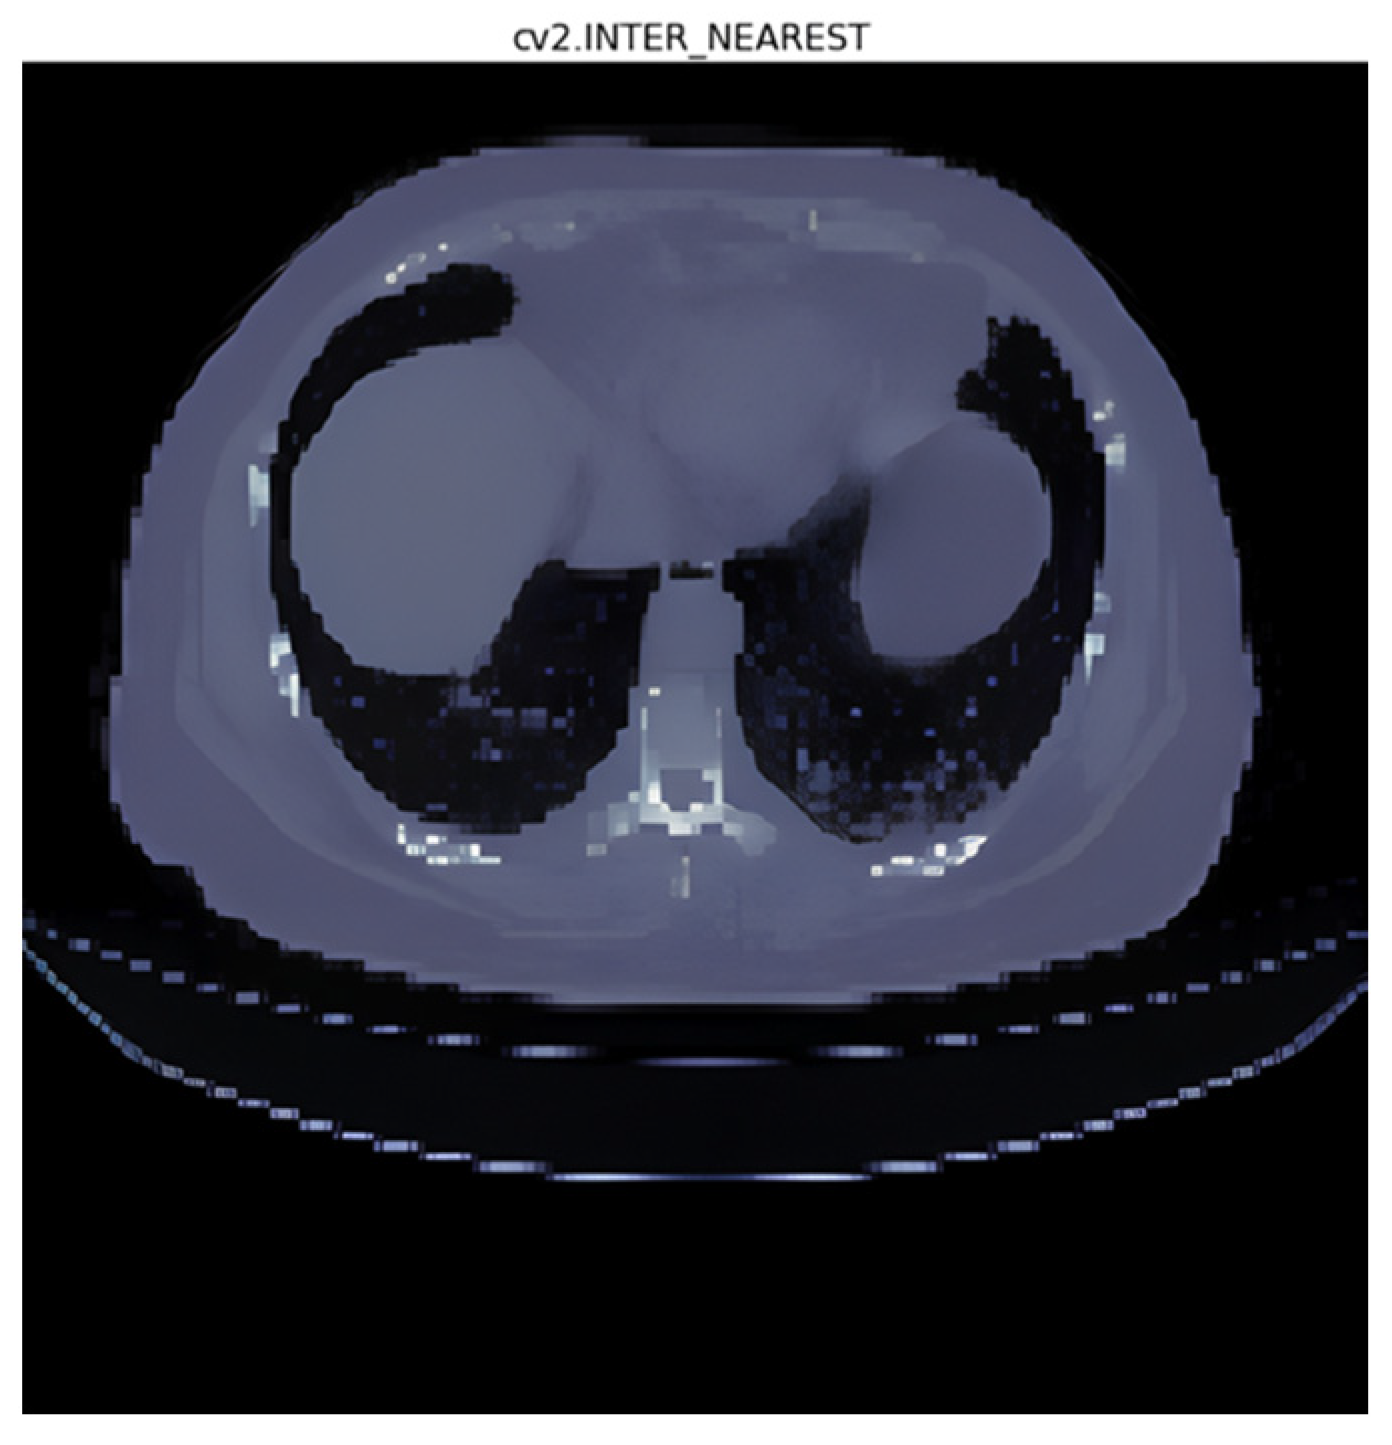
- (3)
- Nearest interpolation [32]: In nearest interpolation, the value of the nearest data point to the target point is assigned as the estimated value. It is a simple and fast interpolation method but may lead to blocky artifacts and might not capture smooth changes in data;
- (4)
- Lanczos interpolation [33]: Lanczos interpolation is a high-quality interpolation method that uses a sinc function to estimate values at non-grid points. It provides sharp details and reduces aliasing artifacts.
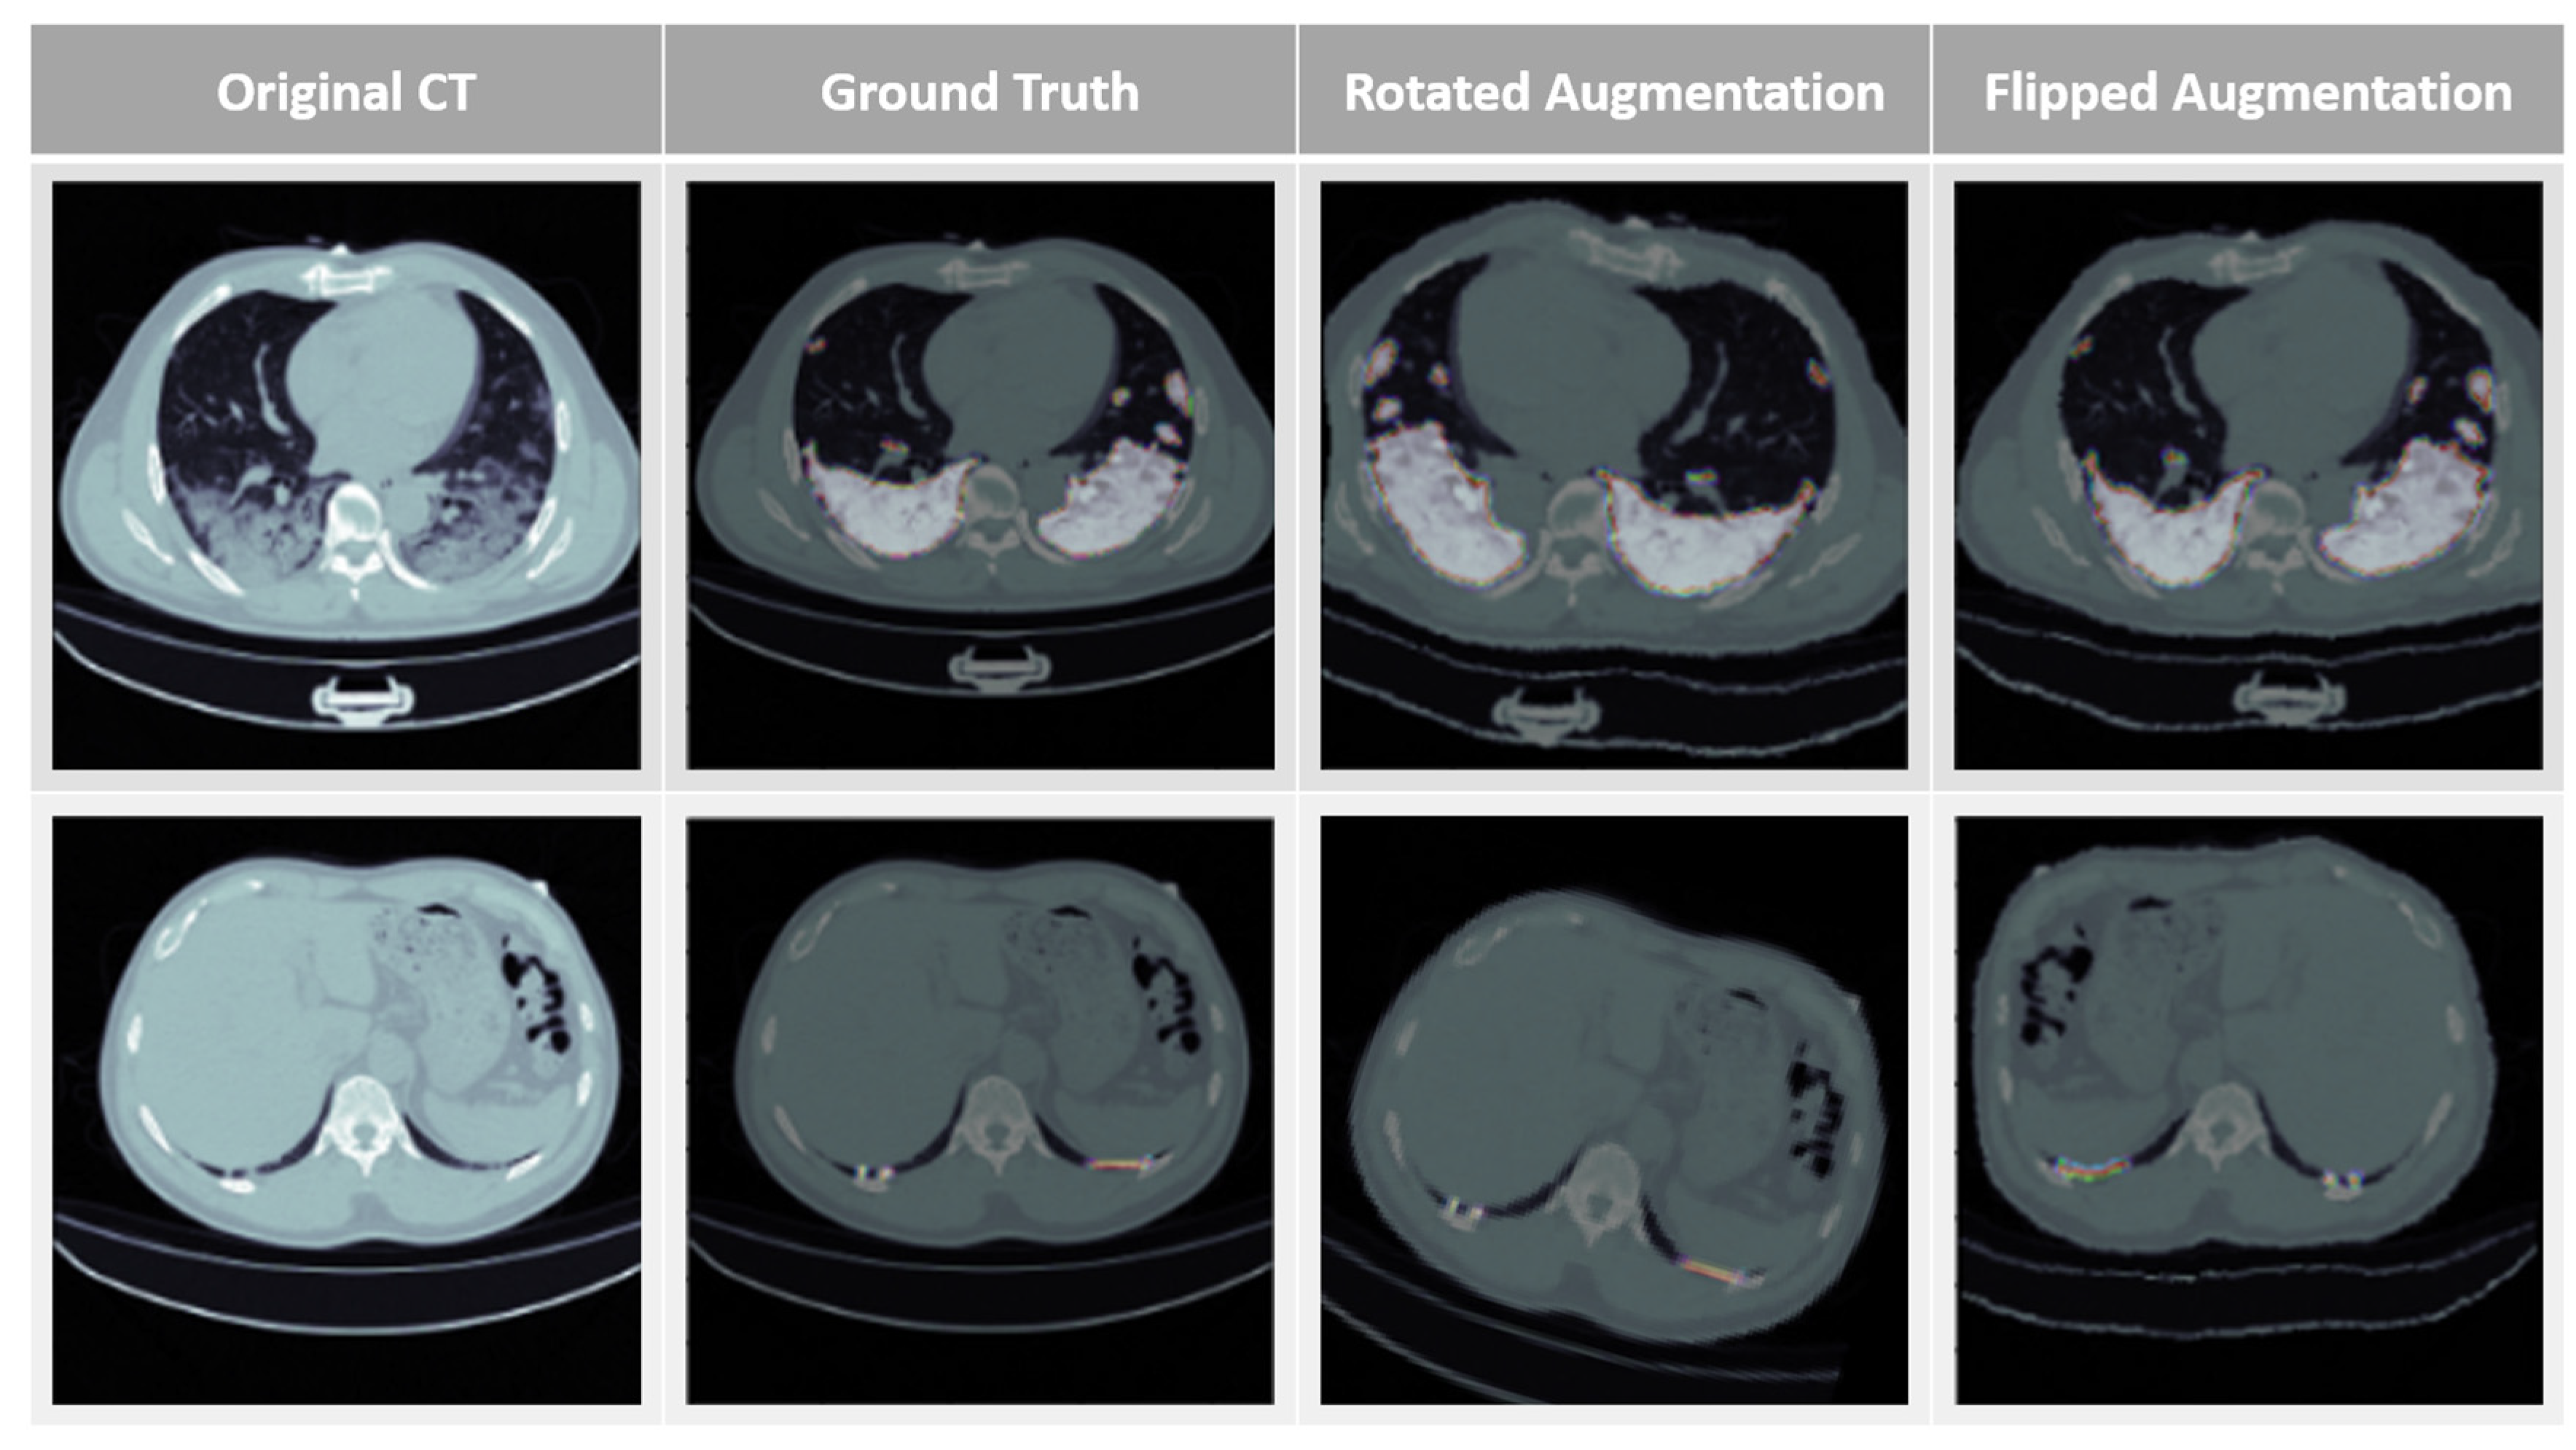
3.2. Data Augmentation and HU Value Adjustment Module
3.3. Training Time and Convolution Parameter Comparison
3.4. Training Convergence Curve
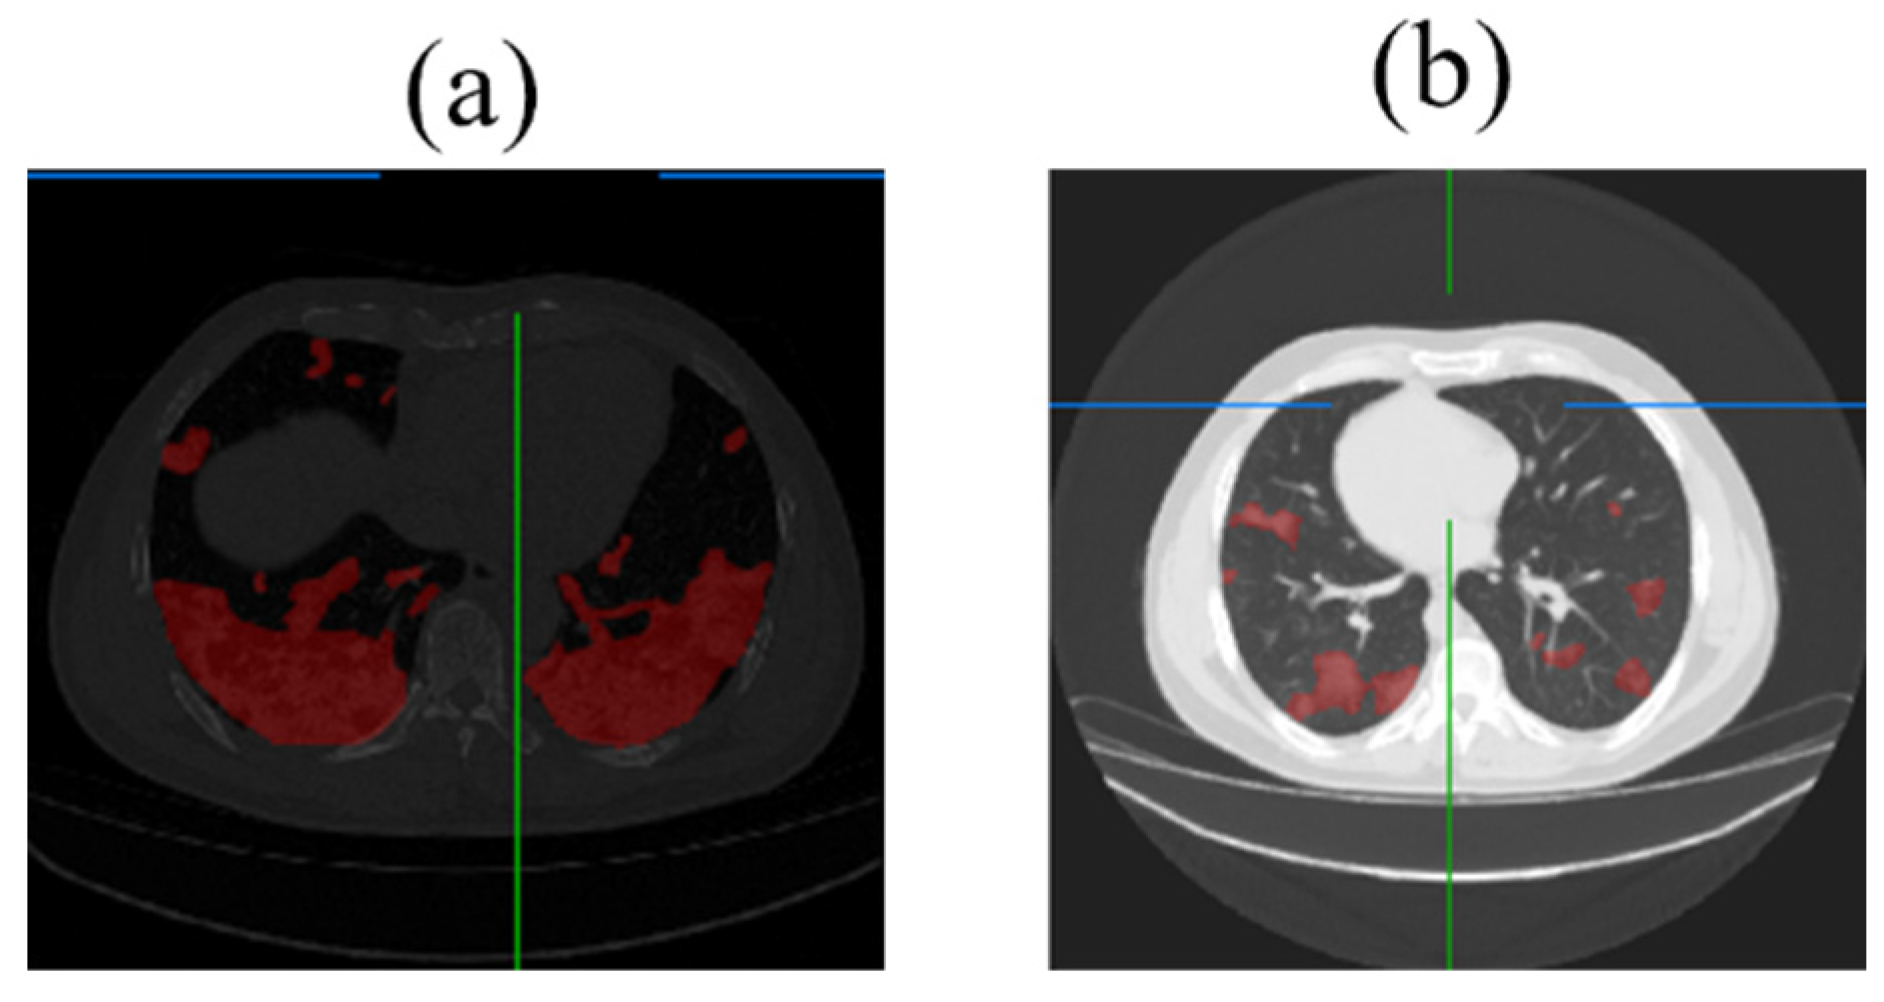
3.5. Lung Lesion Recognition Results
3.6. Analysis of Lung Lesion Results Using RDAG U-Net
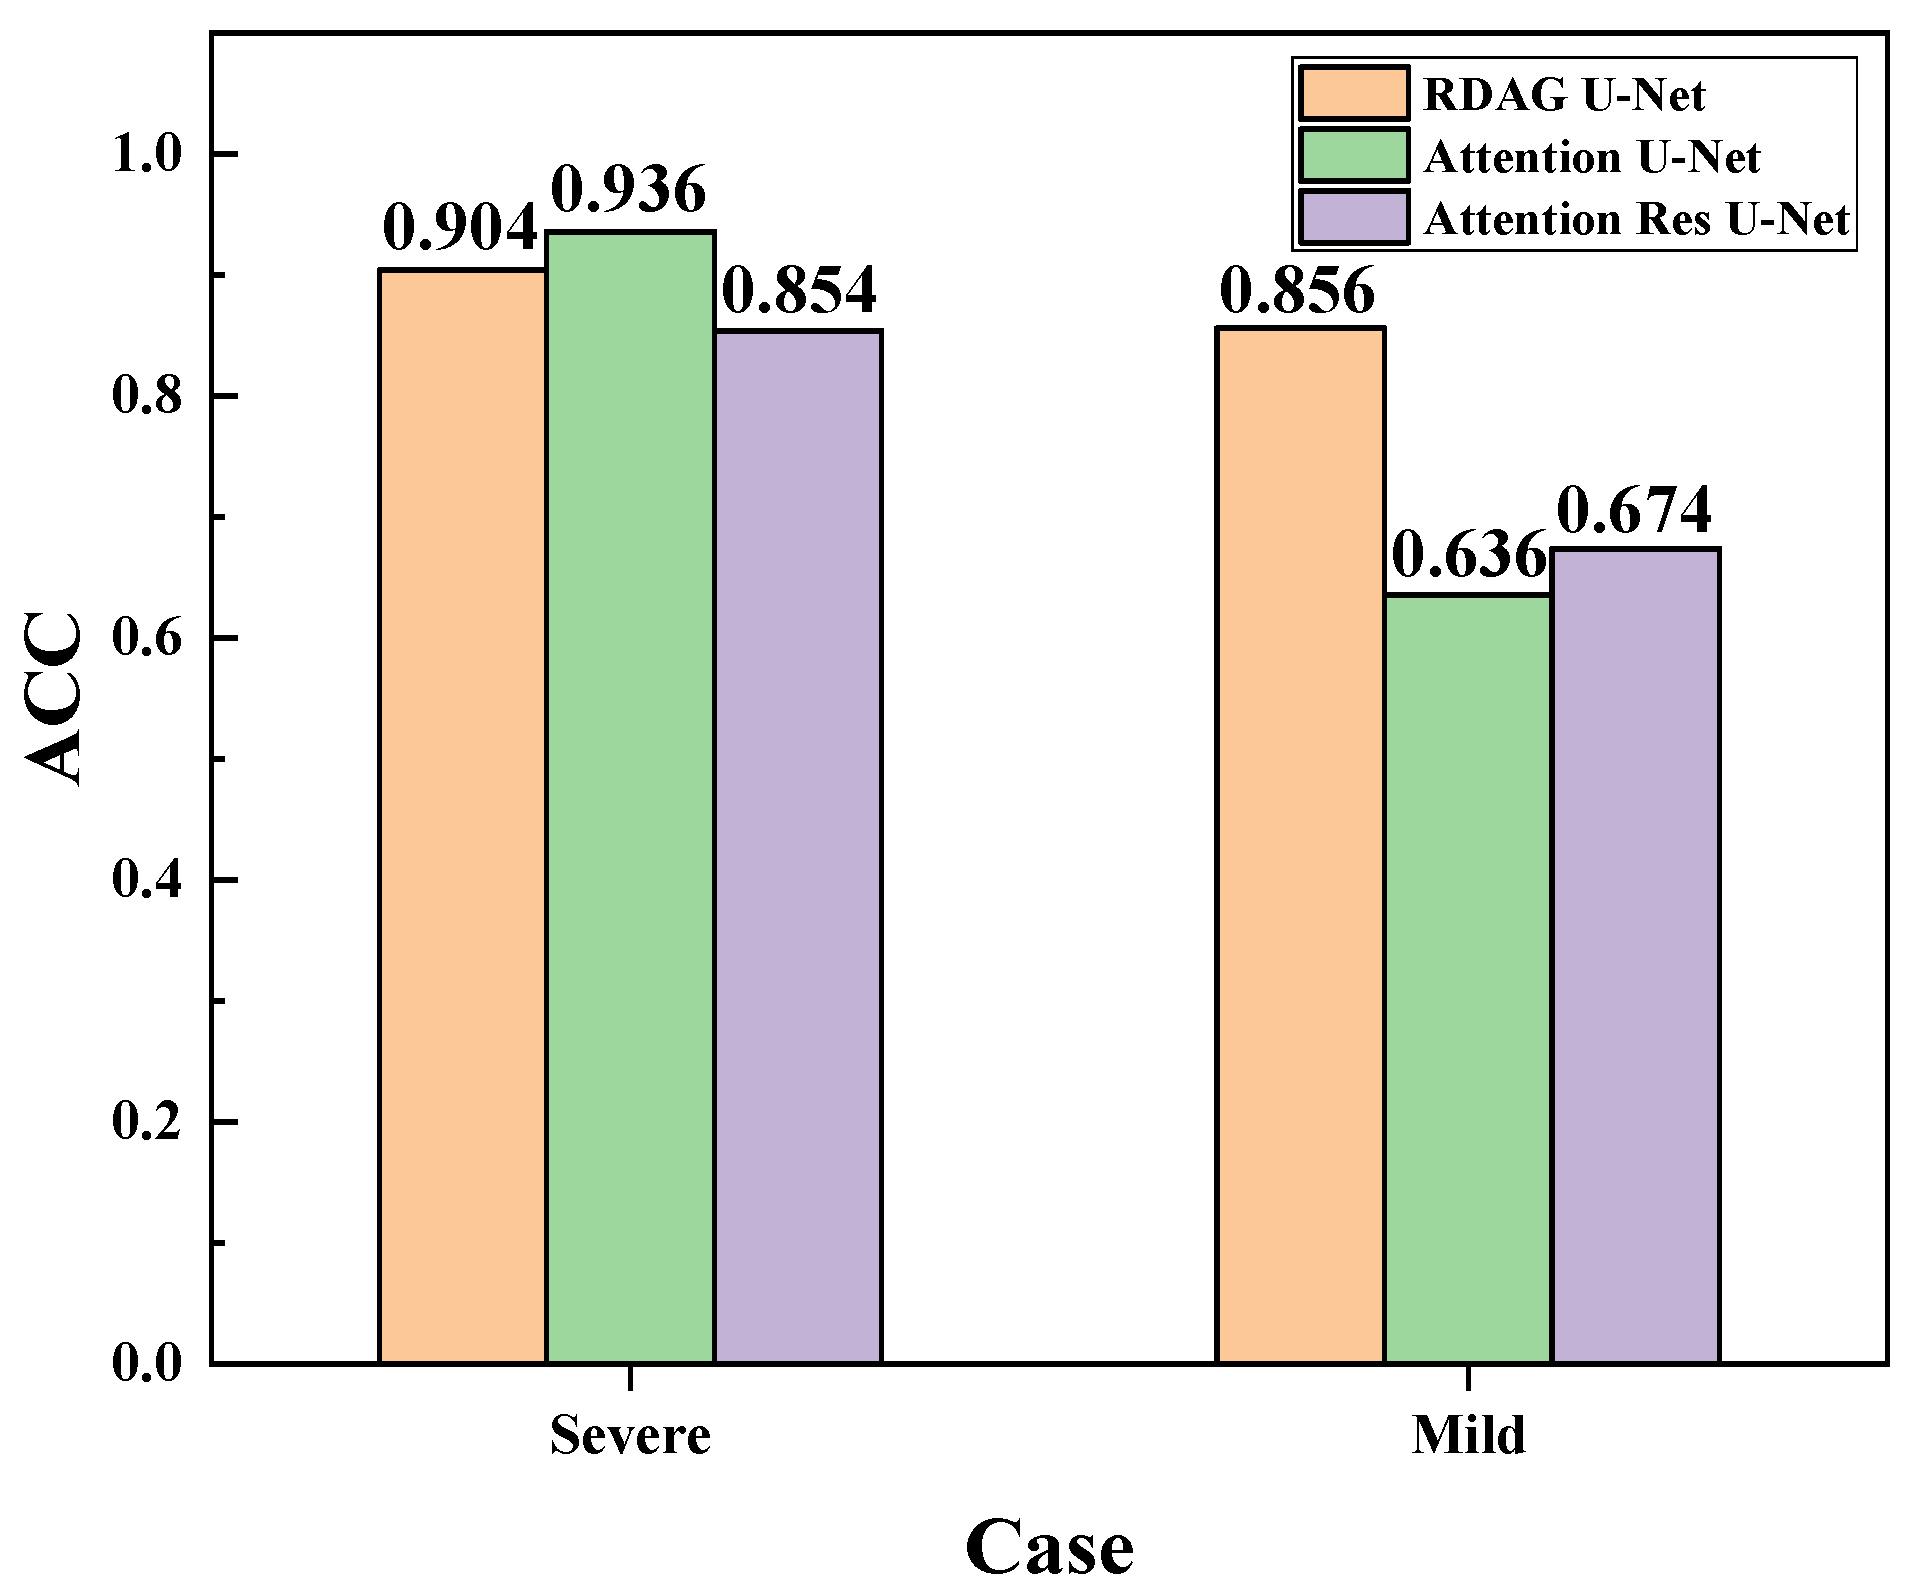
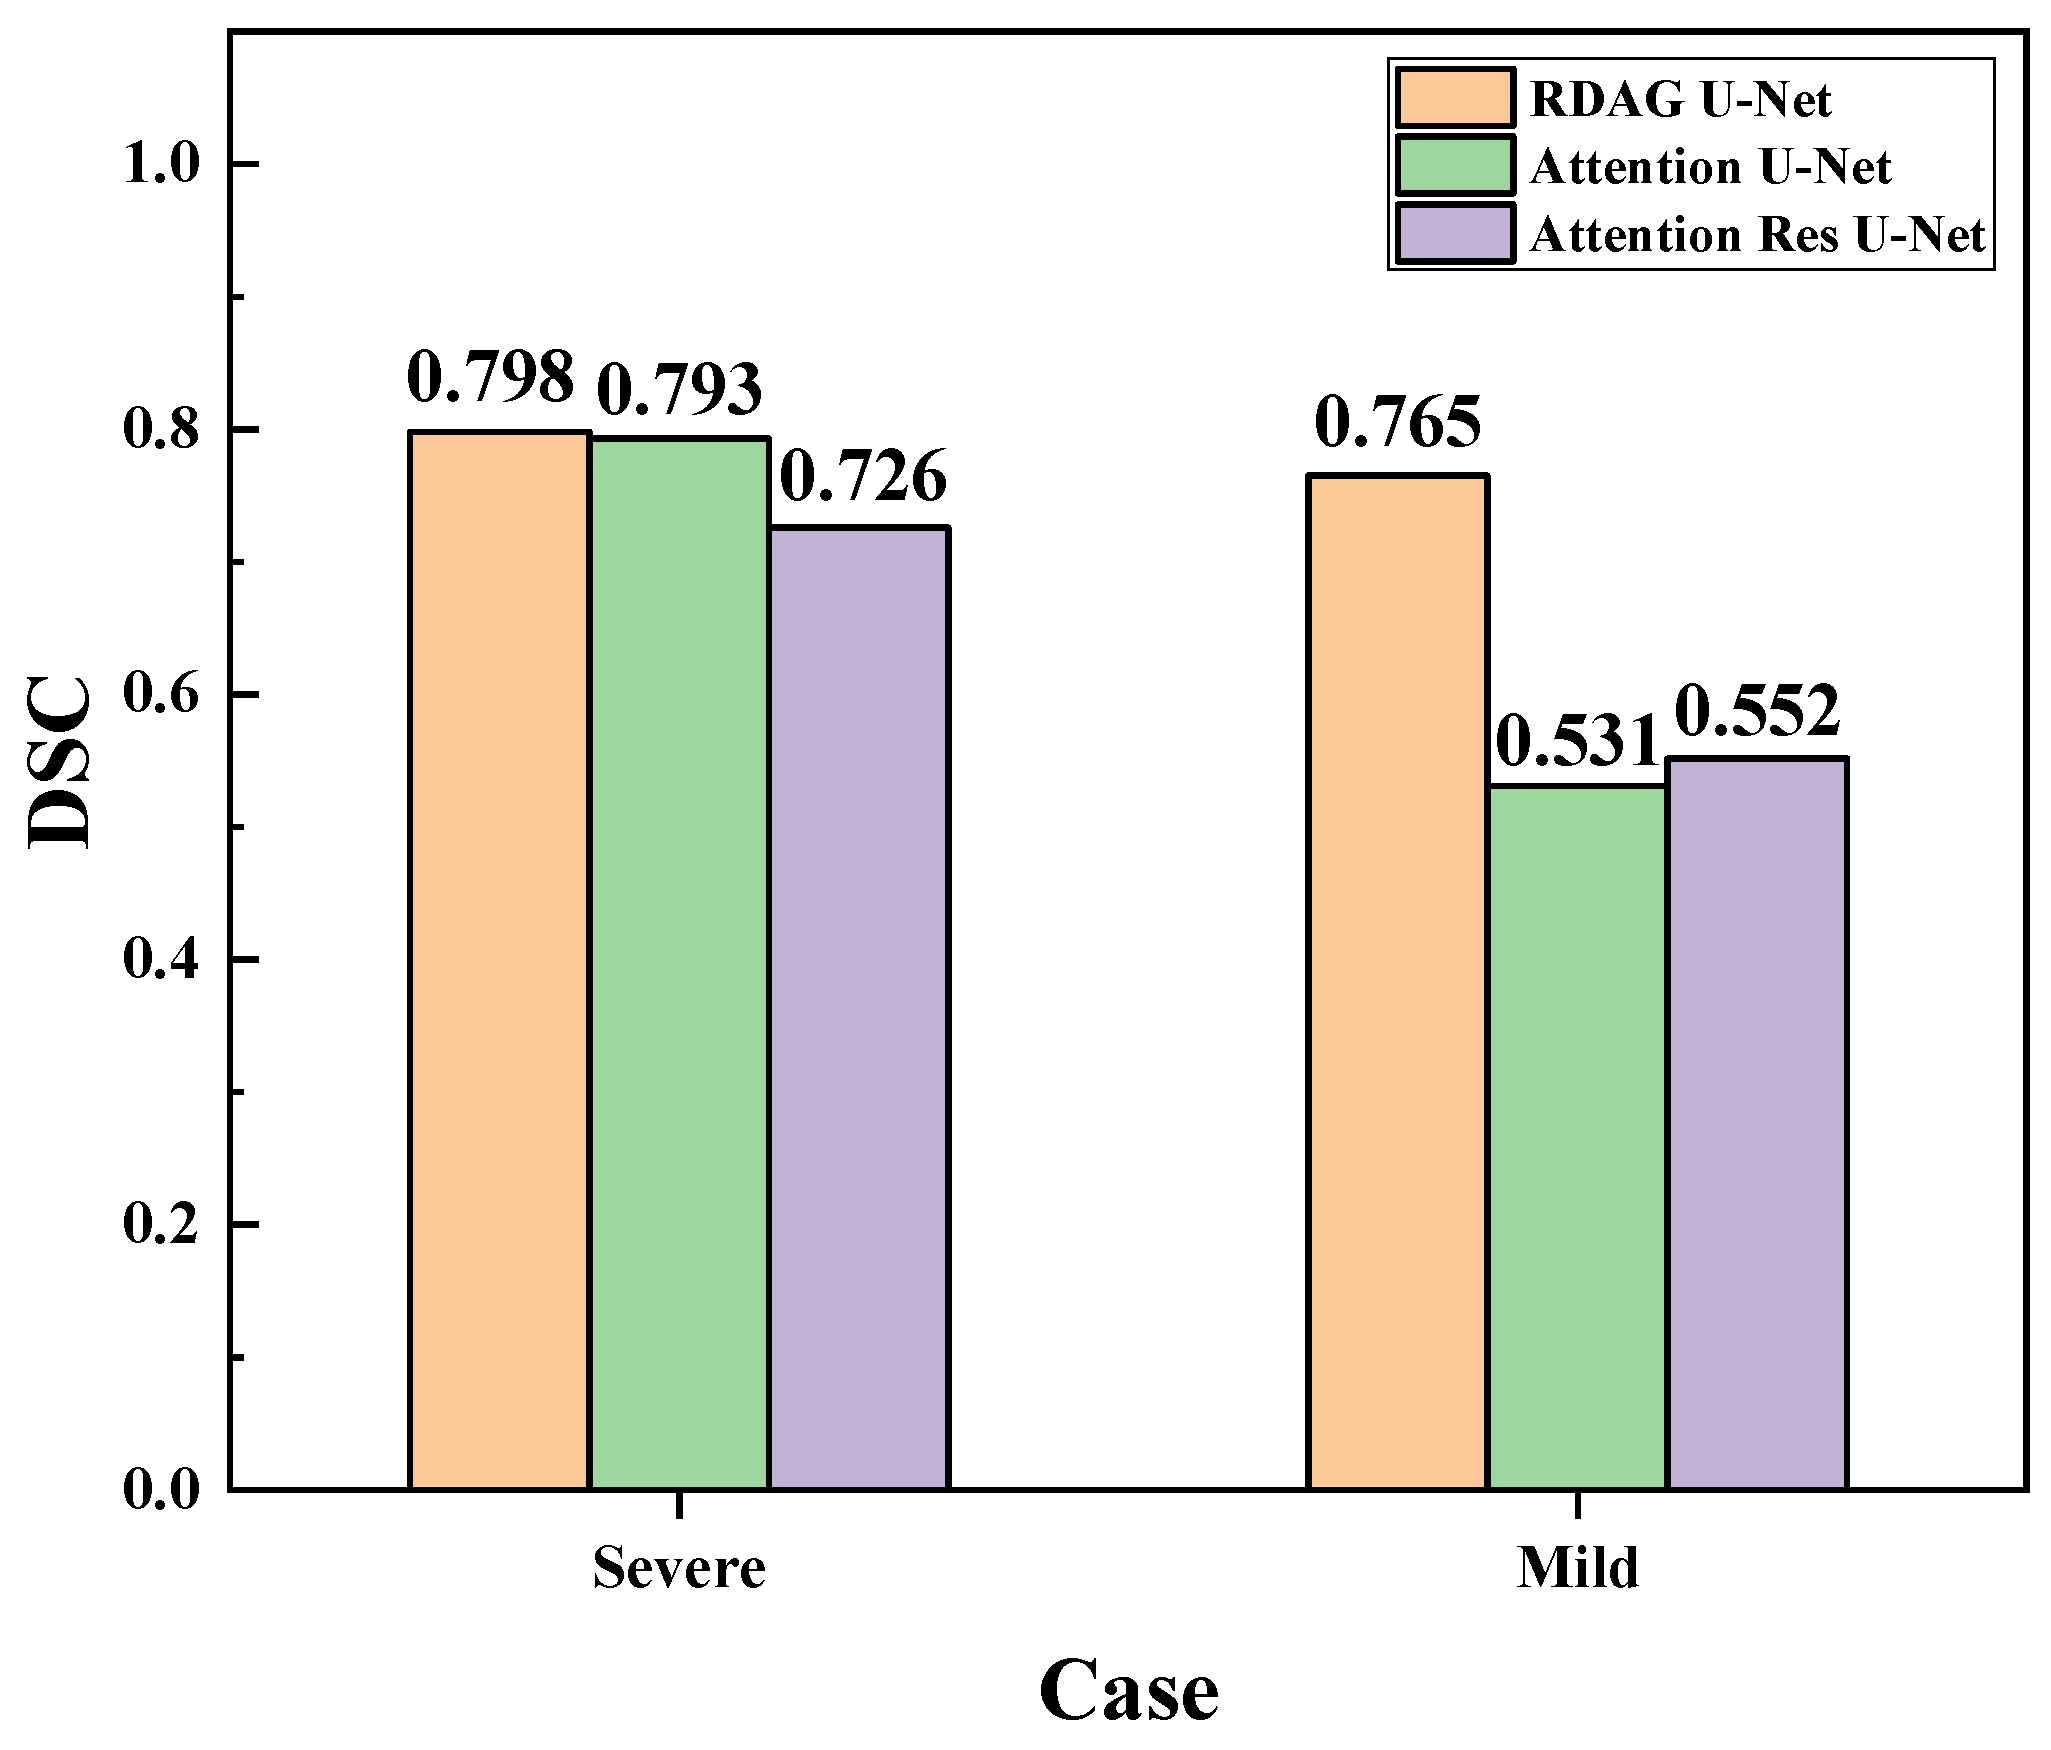
3.7. Evaluation and Comparison of Mild and Severe Pneumonia Models
3.8. Discussion of Experimental Results
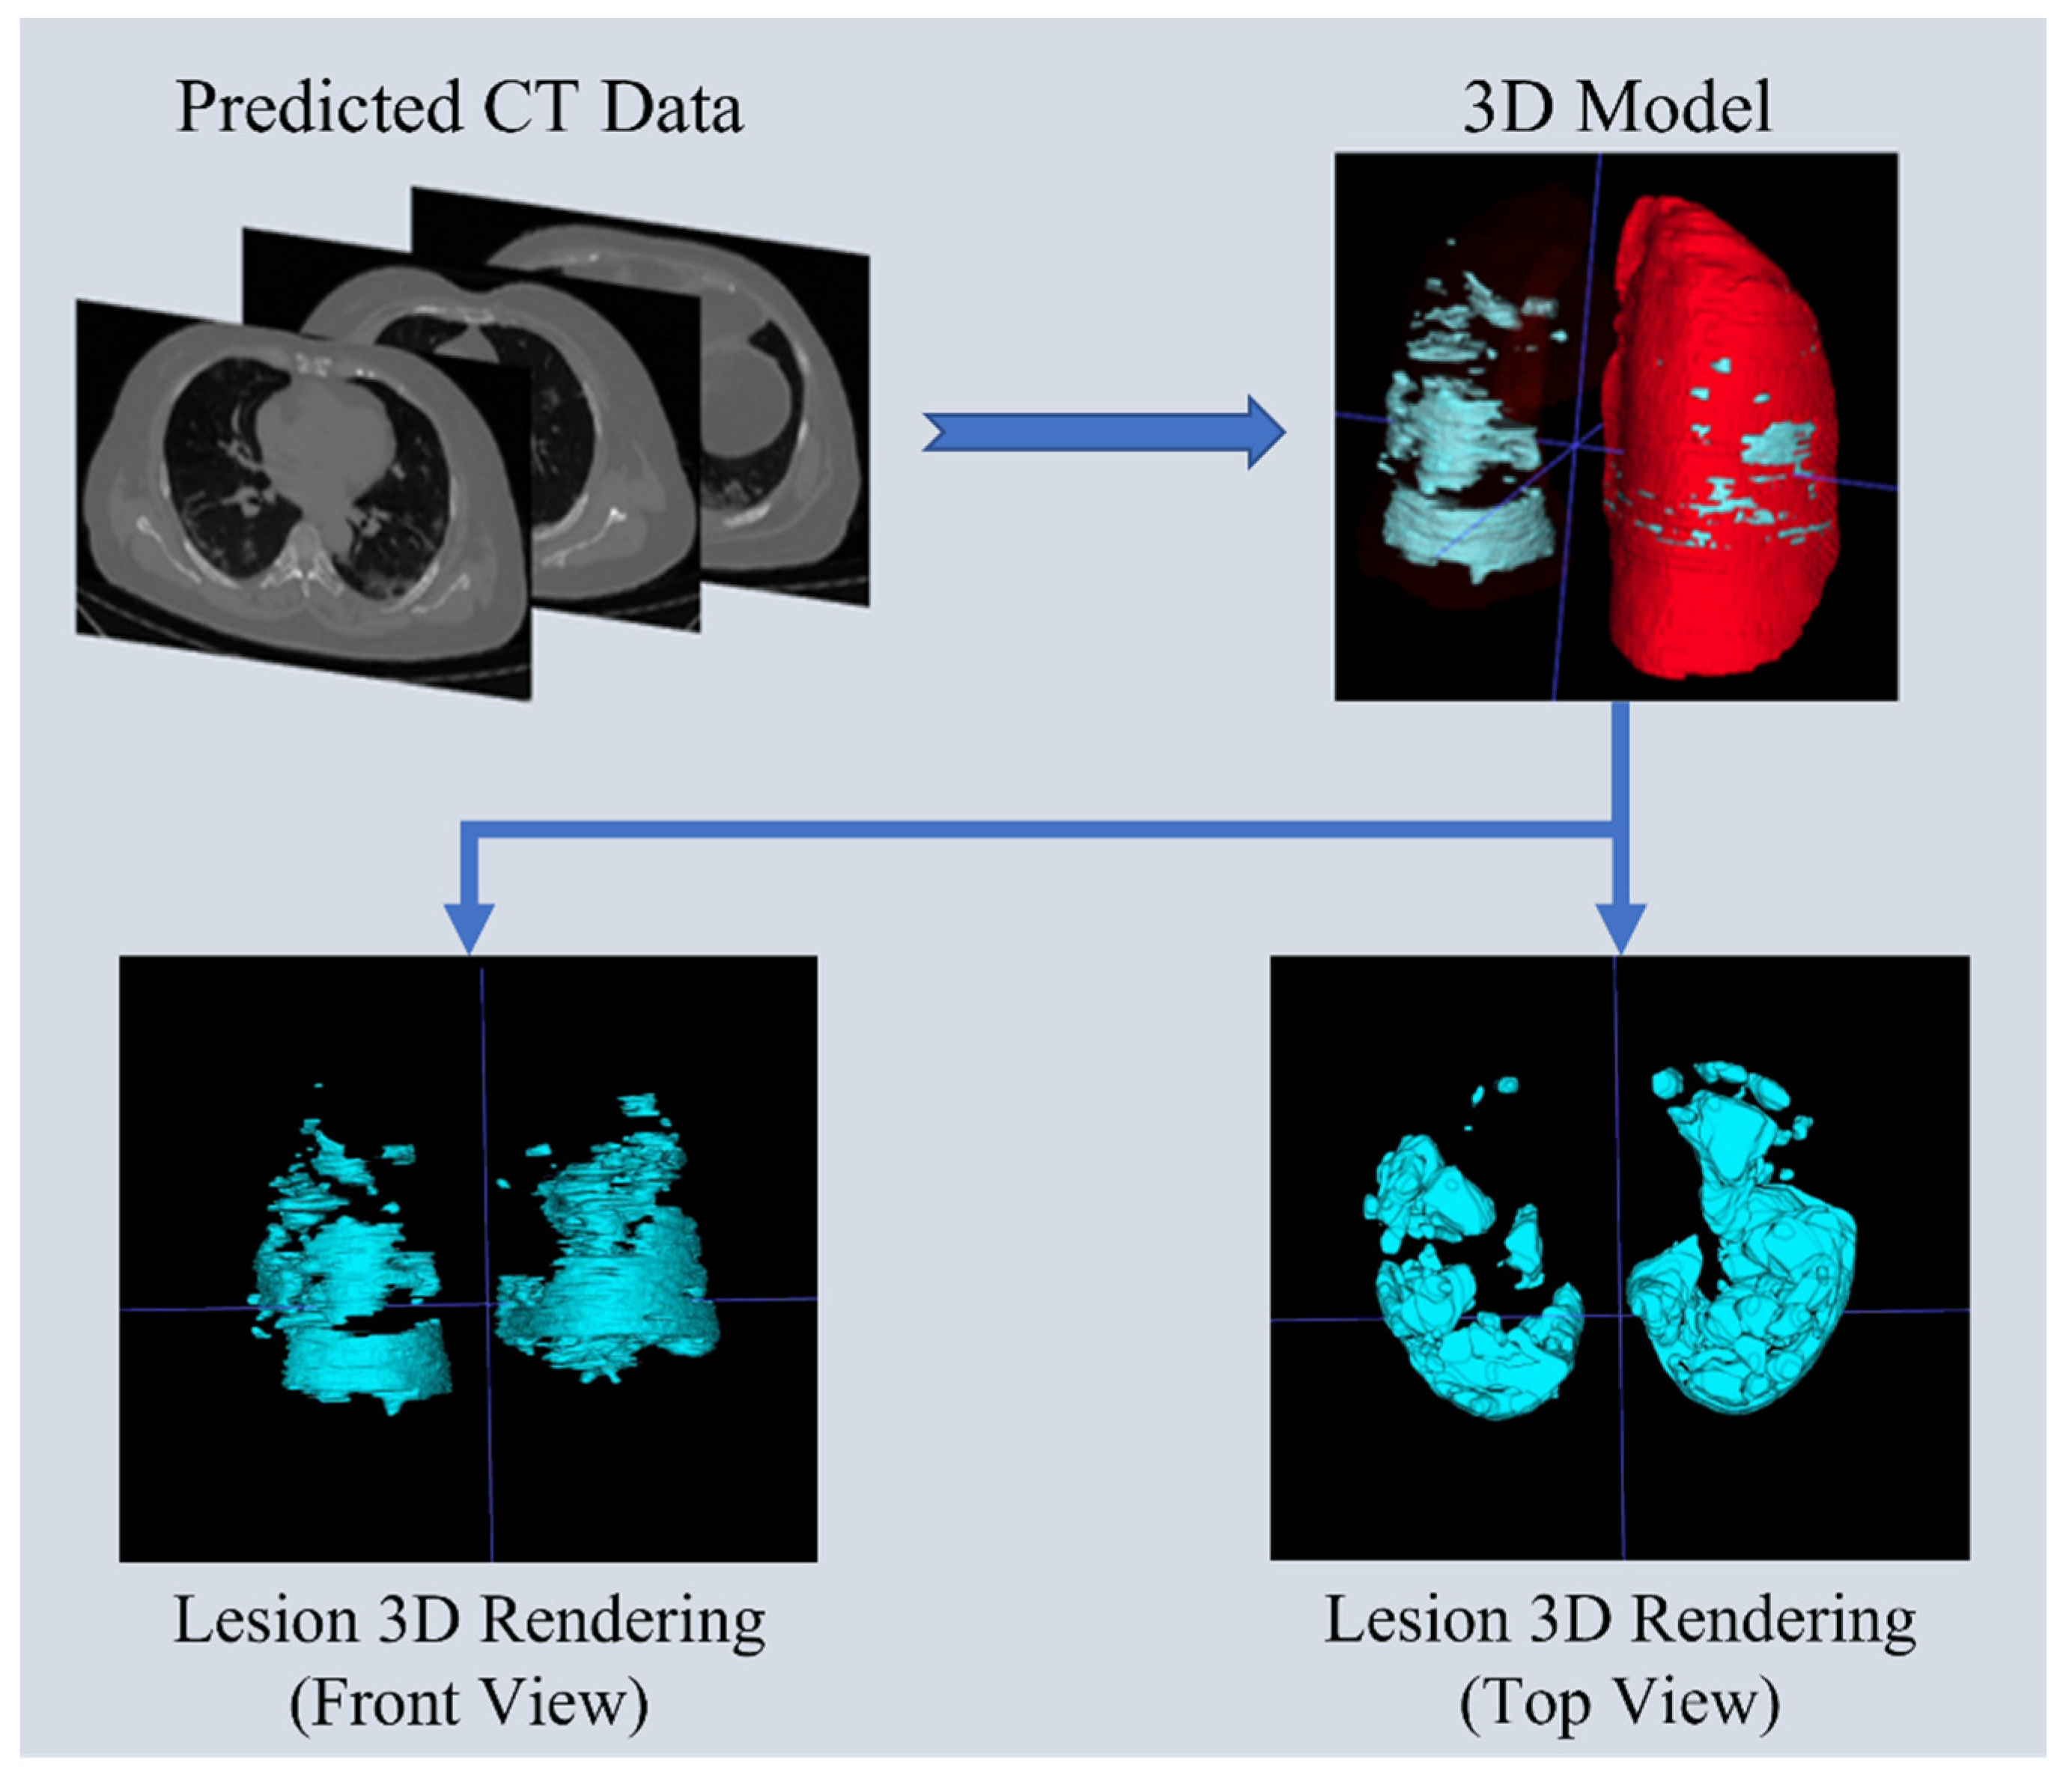
3.9. Lung Predictive 3D Visualization Model
4. Conclusions
- HU Value Modification: Adjusting the HU values allowed CT images to display lesions more clearly, even without the use of contrast agents.
- Computational Efficiency: RDAG U-Net demonstrated the fastest computational speed among the three models, reducing computation time by approximately 45% compared to Attention U-Net.
- Accuracy: Utilizing data from open-source images (TCGA), RDAG U-Net achieved an accuracy of 93.29% in pneumonia lesion identification.
Author Contributions
Funding
Institutional Review Board Statement
Informed Consent Statement
Data Availability Statement
Acknowledgments
Conflicts of Interest
References
- Weekly Epidemiological Update on COVID-19. 21 September 2022. Available online: https://www.who.int/publications/m/item/weekly-epidemiological-update-on-covid-19---21-september-2022 (accessed on 1 July 2024).
- Shen, M.; Zhou, Y.; Ye, J.; Abdullah Al-maskri, A.A.; Kang, Y.; Zeng, S.; Cai, S. Recent advances and perspectives of nucleic acid detection for coronavirus. J. Pharm. Anal. 2020, 10, 97–101. [Google Scholar] [CrossRef] [PubMed]
- Park, G.-S.; Ku, K.; Baek, S.-H.; Kim, S.-J.; Kim, S.I.; Kim, B.-T.; Maeng, J.-S. Development of Reverse Transcription Loop-Mediated Isothermal Amplification Assays Targeting Severe Acute Respiratory Syndrome Coronavirus 2 (SARS-CoV-2). J. Mol. Diagn. 2020, 22, 729–735. [Google Scholar] [CrossRef] [PubMed]
- Withers, P.J.; Bouman, C.; Carmignato, S.; Cnudde, V.; Grimaldi, D.; Hagen, C.K.; Maire, E.; Manley, M.; Du Plessis, A.; Stock, S.R. X-ray computed tomography. Nat. Rev. Methods Primers 2021, 1, 18. [Google Scholar] [CrossRef]
- Grover, V.P.B.; Tognarelli, J.M.; Crossey, M.M.E.; Cox, I.J.; Taylor-Robinson, S.D.; McPhail, M.J.W. Magnetic Resonance Imaging: Principles and Techniques: Lessons for Clinicians. J. Clin. Exp. Hepatol. 2015, 5, 246–255. [Google Scholar] [CrossRef] [PubMed]
- Miller, T. Explanation in artificial intelligence: Insights from the social sciences. Artif. Intell. 2019, 267, 1–38. [Google Scholar] [CrossRef]
- LeCun, Y.; Bengio, Y.; Hinton, G. Deep learning. Nature 2015, 521, 436–444. [Google Scholar] [CrossRef]
- O’Shea, K.; Nash, R. An Introduction to Convolutional Neural Networks. arXiv 2015, arXiv:1511.08458. [Google Scholar]
- Long, J.; Shelhamer, E.; Darrell, T. Fully Convolutional Networks for Semantic Segmentation. arXiv 2015, arXiv:1411.4038. [Google Scholar]
- Badrinarayanan, V.; Kendall, A.; Cipolla, R. SegNet: A Deep Convolutional Encoder-Decoder Architecture for Image Segmentation. arXiv 2016, arXiv:1511.00561. [Google Scholar] [CrossRef]
- Zhou, Z.; Rahman Siddiquee, M.M.; Tajbakhsh, N.; Liang, J. UNet++: A Nested U-Net Architecture for Medical Image Segmentation. In Deep Learning in Medical Image Analysis and Multimodal Learning for Clinical Decision Support: 4th International Workshop, In Proceedings of the DLMIA 2018, and 8th International Workshop, ML-CDS 2018, Held in Conjunction with MICCAI 2018; Granada, Spain, 20 September 2018, Springer International Publishing: Berlin, Germany, 2018. [Google Scholar]
- Ronneberger, O.; Fischer, P.; Brox, T. U-Net: Convolutional Networks for Biomedical Image Segmentation. Ronneberger, O., Fischer, P.; Brox, T. U-net: Convolutional networks for biomedical image segmentation. In Medical Image Computing and Computer-Assisted Intervention–In Proceedings of the MICCAI 2015: 18th International Conference, Munich, Germany, 5–9 October 2015; Springer International Publishing: Berlin, Germany, 2015. [Google Scholar]
- Oktay, O.; Schlemper, J.; Loic, L.F.; Lee, M.; Heinrich, M.; Misawa, K.; Mori, K.; McDonagh, S.; Hammerla, N.Y.; Kainz, B.; et al. Attention U-Net: Learning Where to Look for the Pancreas. arXiv 2018, arXiv:1804.03999. [Google Scholar]
- Zhang, J.; Yang, K.; Shen, Z.; Sang, S.; Yuan, Z.; Hao, R.; Zhang, Q.; Cai, M. End-to-End Automatic Classification of Retinal Vessel Based on Generative Adversarial Networks with Improved U-Net. Diagnostics 2023, 13, 1148. [Google Scholar] [CrossRef] [PubMed]
- Sharma, N.; Saba, L.; Khanna, N.N.; Kalra, M.K.; Fouda, M.M.; Suri, J.S. Segmentation-Based Classification Deep Learning Model Embedded with Explainable AI for COVID-19 Detection in Chest X-ray Scans. Diagnostics 2022, 12, 2132. [Google Scholar] [CrossRef]
- Lv, B.; Liu, F.; Li, Y.; Nie, J.; Gou, F.; Wu, J. Artificial Intelligence-Aided Diagnosis Solution by Enhancing the Edge Features of Medical Images. Diagnostics 2023, 13, 1063. [Google Scholar] [CrossRef] [PubMed]
- Wu, R.; Li, D.; Zhang, C. Semi-supervised Medical Image Segmentation via Query Distribution Consistency. arXiv 2023, arXiv:2311.12364. [Google Scholar]
- Lee, M.-C.; Wang, S.-Y.; Pan, C.-T.; Chien, M.-Y.; Li, W.-M.; Xu, J.-H.; Luo, C.-H.; Shiue, Y.-L. Development of Deep Learning with RDA U-Net Network for Bladder Cancer Segmentation. Cancers 2023, 15, 1343. [Google Scholar] [CrossRef] [PubMed]
- Chen, W.-F.; Ou, H.-Y.; Lin, H.-Y.; Wei, C.-P.; Liao, C.-C.; Cheng, Y.-F.; Pan, C.-T. Development of Novel Residual-Dense-Attention (RDA) U-Net Network Architecture for Hepatocellular Carcinoma Segmentation. Diagnostics 2022, 12, 1916. [Google Scholar] [CrossRef]
- Sabottke, C.F.; Spieler, B.M. The Effect of Image Resolution on Deep Learning in Radiography. Radiol. Artif. Intell. 2020, 2, e190015. [Google Scholar] [CrossRef]
- Xu, Y.; Xu, R. Research on Interpolation and Data Fitting: Basis and Applications. arXiv 2022, arXiv:2208.11825. [Google Scholar]
- Datasets, Papers with Code. Available online: https://paperswithcode.com/datasets (accessed on 20 June 2023).
- Yang, S.; Xiao, W.; Zhang, M.; Guo, S.; Zhao, J.; Shen, F. Image Data Augmentation for Deep Learning: A Survey. arXiv 2022, arXiv:2204.08610. [Google Scholar]
- Sudhyadhom, A. On the molecular relationship between Hounsfield Unit (HU), mass density, and electron density in computed tomography (CT). PLoS ONE 2020, 15, e0244861. [Google Scholar] [CrossRef]
- Janocha, K.; Czarnecki, W.M. On Loss Functions for Deep Neural Networks in Classification. arXiv 2017, arXiv:1702.05659. [Google Scholar] [CrossRef]
- Riehl, K.; Neunteufel, M.; Hemberg, M. Hierarchical confusion matrix for classification performance evaluation. J. R. Stat. Soc. Ser. C Appl. Stat. 2023, 72, 1394–1415. [Google Scholar] [CrossRef]
- Andreieva, V.; Shvai, N. Generalization of Cross-Entropy Loss Function for Image Classification. Mohyla Math. J. 2021, 3, 3–10. [Google Scholar] [CrossRef]
- Hodson, T.O.; Over, T.M.; Foks, S.S. Mean Squared Error, Deconstructed. J. Adv. Model. Earth Syst. 2021, 13, e2021MS002681. [Google Scholar] [CrossRef]
- Sudre, C.H.; Li, W.; Vercauteren, T.; Ourselin, S.; Jorge Cardoso, M. Generalised Dice Overlap as a Deep Learning Loss Function for Highly Unbalanced Segmentations. Lect. Notes Comput. Sci. Lect. Notes Comput. Sci. 2017, 10553, 240–248. [Google Scholar] [CrossRef]
- Arntz, M.; Wilke, R. Area Interpolation in Presence of Measurement Error and an Application to German Administrative Data; FDZ Methodenreport: Nuremberg, Germany, 2006. [Google Scholar]
- Noor, N.M.; Abdullah, M.M.A.B.; Yahaya, A.S.; Ramli, N. Comparison of Linear Interpolation Method and Mean Method to Replace the Missing Values in Environmental Data Set. Mater. Sci. Forum 2014, 803, 278–281. [Google Scholar] [CrossRef]
- Olivier, R.; Hanqiang, C. Nearest Neighbor Value Interpolation. Int. J. Adv. Comput. Sci. Appl. 2012, 3, 25–30. [Google Scholar] [CrossRef]
- Safinaz, S.; Kumar, A.V.R. VLSI Realization of Lanczos Interpolation for a Generic Video Scaling Algorithm. In Proceedings of the 2017 International Conference on Recent Advances in Electronics and Communication Technology (ICRAECT), Bangalore, India, 16–17 March 2017; IEEE: Piscataway, NJ, USA, 2017; pp. 17–23. [Google Scholar] [CrossRef]
- Maji, D.; Sigedar, P.; Singh, M. Attention Res-UNet with Guided Decoder for semantic segmentation of brain tumors. Biomed. Signal Process. Control. 2022, 71, 103077. [Google Scholar] [CrossRef]
- Rehman, A.; Butt, M.A.; Zaman, M. Attention Res-UNet: Attention Residual UNet With Focal Tversky Loss for Skin Lesion Segmentation. Int. J. Decis. Support Syst. Technol. (IJDSST) 2023, 15, 1–17. [Google Scholar] [CrossRef]


| Reference | Model | Disease | Features |
|---|---|---|---|
| [13] | Attention U-Net | Pancreatic disease | Developed Attention U-N to enhance the performance of the traditional U-NET |
| [14] | ASPP U-Net | Retinal vessels | Captures contextual information from different scales, improving the segmentation of complex image structures |
| [15] | U-Net with other classification models | COVID-19 | Classifies lesions as COVID-19 based on segmentation results |
| [16] | TB-Net | Tuberculosis | Specifically designed for detecting tuberculosis that is challenging to identify with traditional visual inspection |
| [17] | Dual Kmax UX-Net | sub-regions of organs | Uses information of unlabeled samples to determine labels, improving the situation of insufficient labeled data |
| Our work | RDAG U-Net | SARS-CoV-2 Pneumonia | Builds on U-Net by adding multiple modules to enhance accuracy, reduce training time, and successfully predict lesions without contrast agents by improving HU values |
| Operating System | Windows 10 |
| CPU | Intel i7 9700KF |
| GPU | NVIDIA RTX 2080Ti 11GB |
| SSD | M.2 (PCIe) 512GB*2 |
| RAM | DDR4 128G |
| Programming Language | Python 3.7.7 |
| Development Environment | Tensorflow-gpu 1.14 Keras 2.3.0 |
| Train Loss | Train Accuracy | Validation Loss | Validation Accuracy | |
|---|---|---|---|---|
| Area | 0.088 | 0.928 | 0.180 | 0.891 |
| Linear | 0.104 | 0.913 | 0.194 | 0.867 |
| Nearest | 0.090 | 0.930 | 0.097 | 0.929 |
| Lanzcos4 | 0.087 | 0.943 | 0.197 | 0.872 |
Disclaimer/Publisher’s Note: The statements, opinions and data contained in all publications are solely those of the individual author(s) and contributor(s) and not of MDPI and/or the editor(s). MDPI and/or the editor(s) disclaim responsibility for any injury to people or property resulting from any ideas, methods, instructions or products referred to in the content. |
© 2024 by the authors. Licensee MDPI, Basel, Switzerland. This article is an open access article distributed under the terms and conditions of the Creative Commons Attribution (CC BY) license (https://creativecommons.org/licenses/by/4.0/).
Share and Cite
Lee, C.-H.; Pan, C.-T.; Lee, M.-C.; Wang, C.-H.; Chang, C.-Y.; Shiue, Y.-L. RDAG U-Net: An Advanced AI Model for Efficient and Accurate CT Scan Analysis of SARS-CoV-2 Pneumonia Lesions. Diagnostics 2024, 14, 2099. https://doi.org/10.3390/diagnostics14182099
Lee C-H, Pan C-T, Lee M-C, Wang C-H, Chang C-Y, Shiue Y-L. RDAG U-Net: An Advanced AI Model for Efficient and Accurate CT Scan Analysis of SARS-CoV-2 Pneumonia Lesions. Diagnostics. 2024; 14(18):2099. https://doi.org/10.3390/diagnostics14182099
Chicago/Turabian StyleLee, Chih-Hui, Cheng-Tang Pan, Ming-Chan Lee, Chih-Hsuan Wang, Chun-Yung Chang, and Yow-Ling Shiue. 2024. "RDAG U-Net: An Advanced AI Model for Efficient and Accurate CT Scan Analysis of SARS-CoV-2 Pneumonia Lesions" Diagnostics 14, no. 18: 2099. https://doi.org/10.3390/diagnostics14182099
APA StyleLee, C.-H., Pan, C.-T., Lee, M.-C., Wang, C.-H., Chang, C.-Y., & Shiue, Y.-L. (2024). RDAG U-Net: An Advanced AI Model for Efficient and Accurate CT Scan Analysis of SARS-CoV-2 Pneumonia Lesions. Diagnostics, 14(18), 2099. https://doi.org/10.3390/diagnostics14182099