
The Effect of Image Count on Accuracy in Digital Measurements in Dentistry


Abstract
:1. Introduction
2. Materials and Methods
2.1. Sample Size Determination
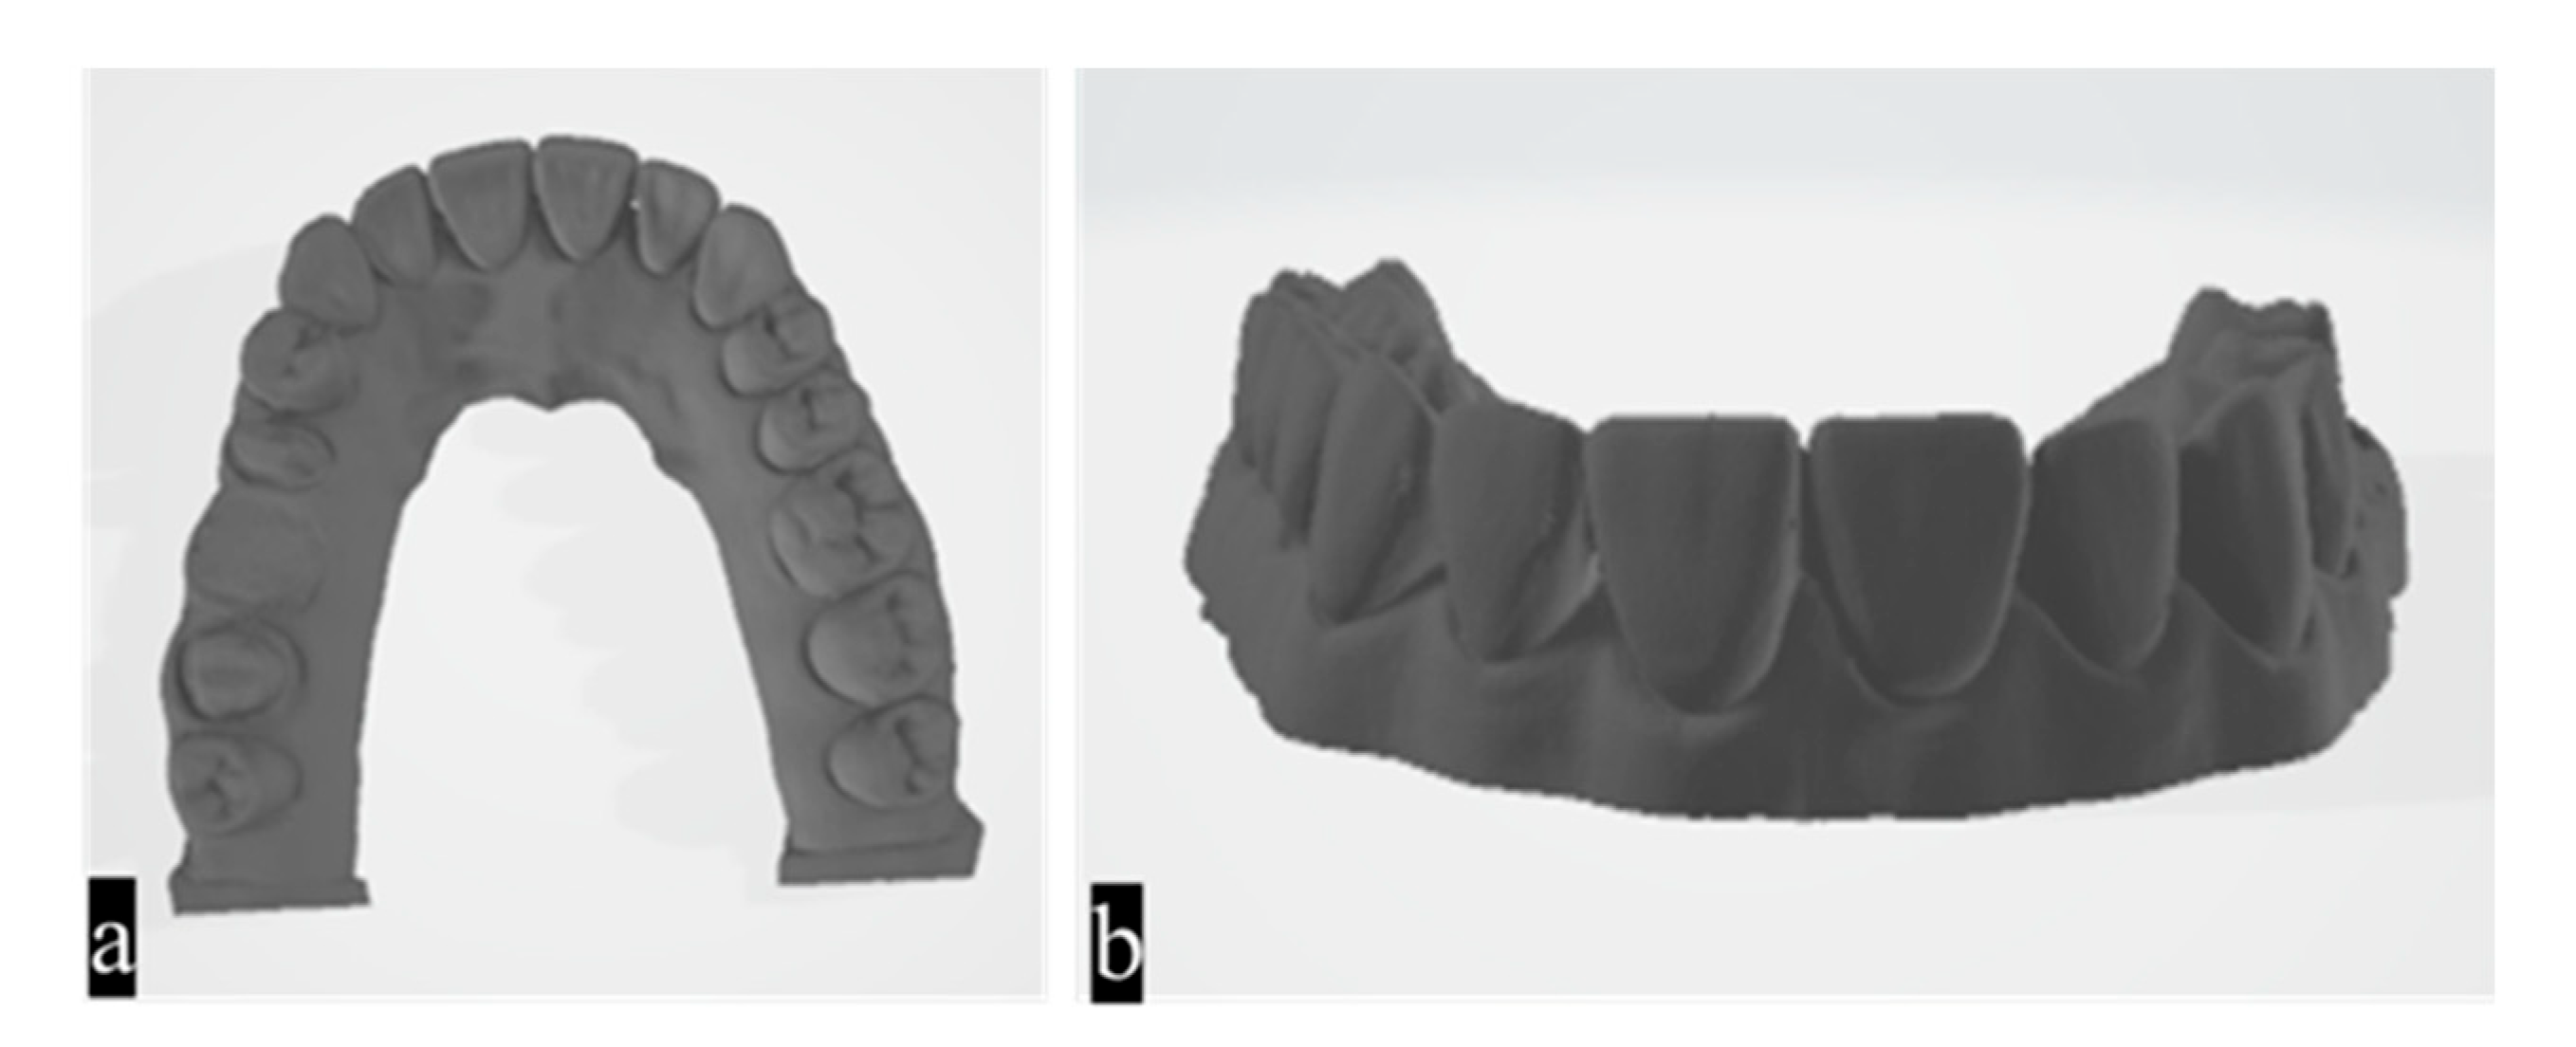
2.2. Reference Scanning and Obtaining the STL File
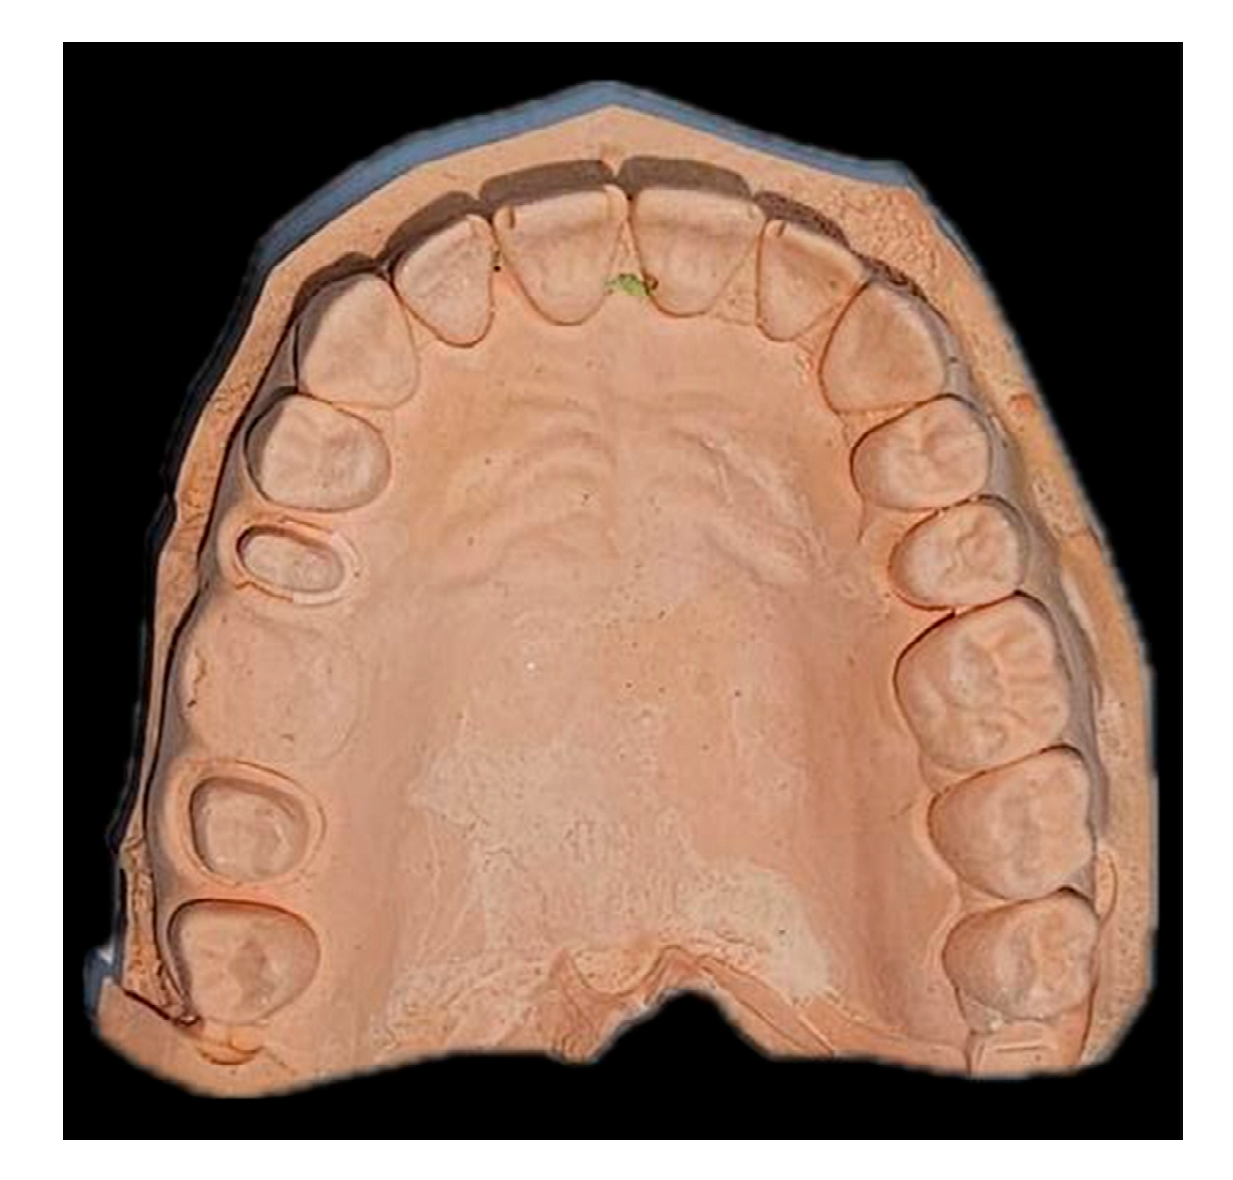
2.3. Impression Taking and Preparation of the Plaster Model
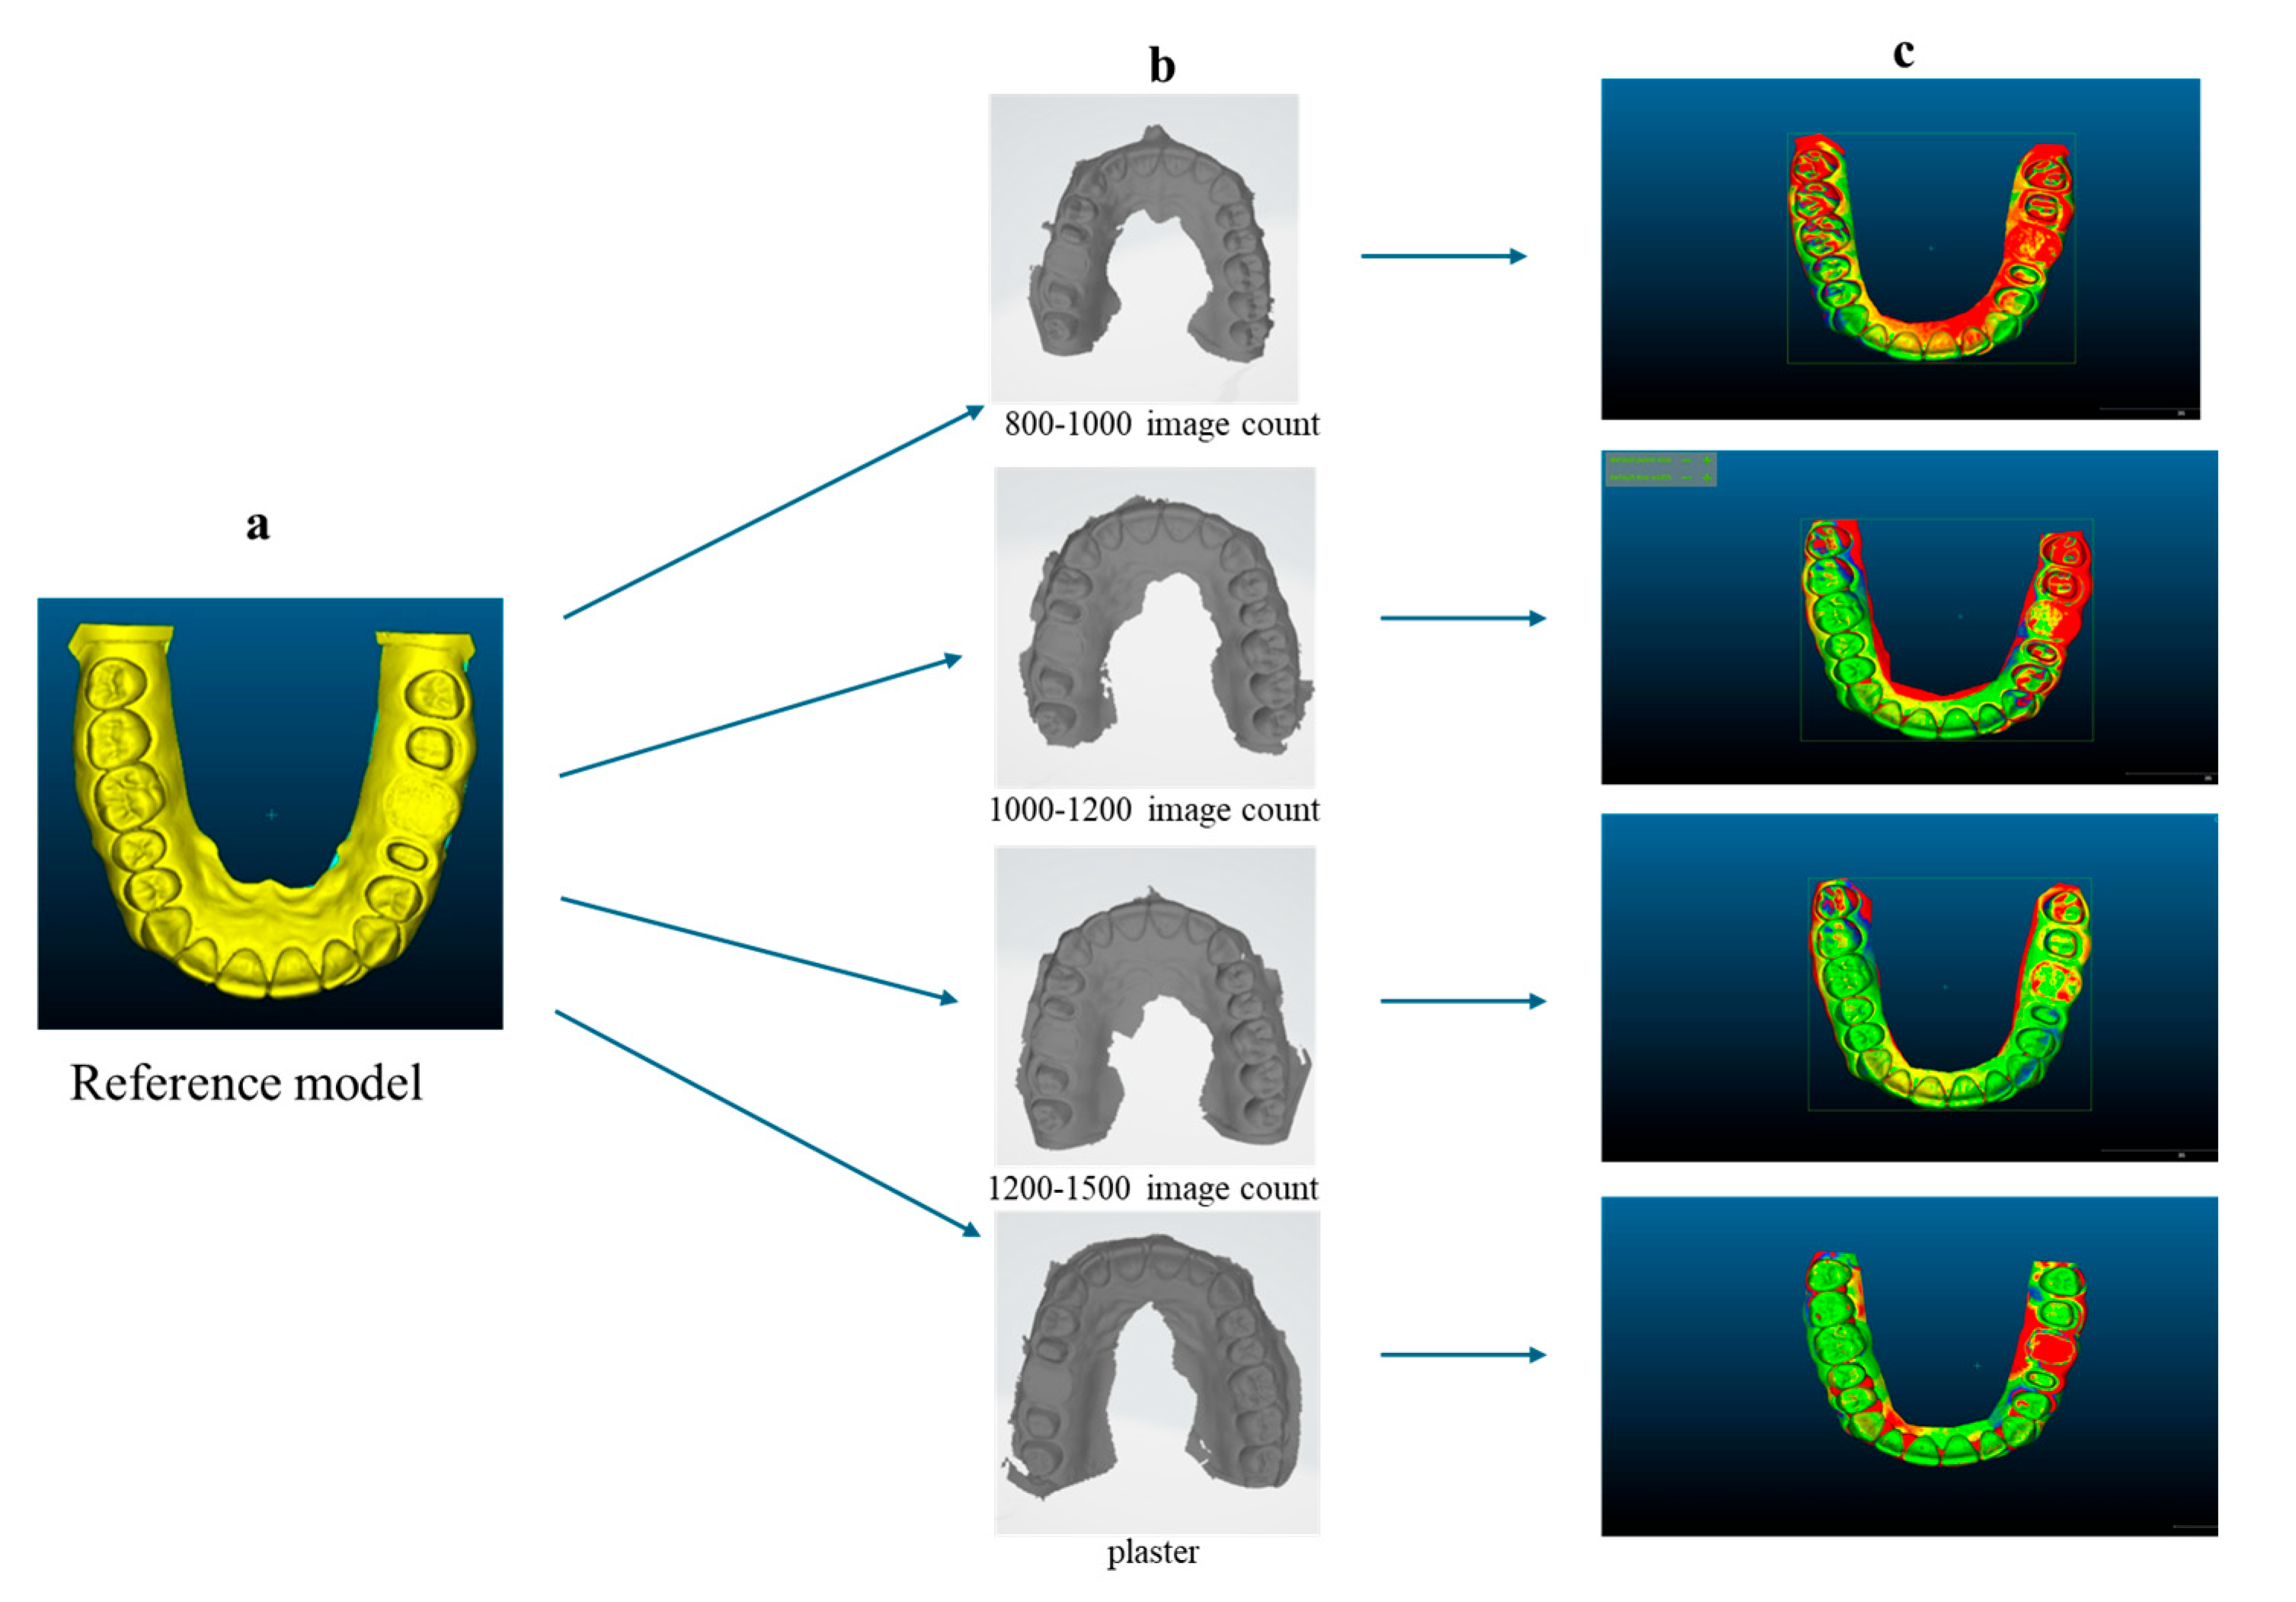
2.4. Determination of the Minimum Image Count and Photogram Distribution
2.5. Operator Standardization and Scanning Protocol
2.6. Data Analysis and Comparison
3. Results
4. Discussion
- Resolution and detail: Finer details of the tooth surface and surrounding tissues can be obtained with higher-resolution images that contain more recorded data points. This is particularly crucial for delicate anatomical structures or complex dental restorations.
- Coverage and completeness: Additional photos taken from various viewpoints can ensure thorough coverage of the entire surface of the teeth and gums. This reduces the likelihood that important details will be overlooked during scanning.
- Processing time: Increasing the number of images scanned may also lengthen the time needed for the scanner to compile and process the images into a coherent three-dimensional model. This may impact workflow efficiency, particularly in busy dental clinics.
- Patient comfort: Although IOSs are generally more comfortable for patients than traditional impressions, patient comfort may be influenced by the length of time the scanner remains in the mouth if more images are taken during a scan.
- Scanner technology: The scanner’s underlying technology, such as sensor resolution, scanning speed, and software algorithms, affects how well more images can be captured.
5. Conclusions
Author Contributions
Funding
Institutional Review Board Statement
Informed Consent Statement
Data Availability Statement
Conflicts of Interest
References
- Sanda, M.; Miyoshi, K.; Baba, K. Trueness and Precision of Digital Implant Impressions by Intraoral Scanners: A Literature Review. Int. J. Implant Dent. 2001, 7, 97. [Google Scholar] [CrossRef] [PubMed]
- Goswami, R.; Arora, G.; Priya, A. CAD/CAM in Restorative Dentistry: A Review. Br. Biomed. Bull. 2018, 4, 3180–3182. [Google Scholar] [CrossRef]
- Prajapati, A.; Prajapati, A.; Mody, D.R.; Choudhary, A.B. Dentistry Goes Digital: A CAD-CAM Way—A Review Article. IOSR–JDMS 2014, 13, 53–59. [Google Scholar] [CrossRef]
- Takashi, M.; Yasuhiro, H.; Jun, K.; Soichi, K. A Review of Dental CAD/CAM: Current Status and Future Perspectives from 20 Years of Experience. Dent. Mater. J. 2009, 28, 44–56. [Google Scholar]
- Paul, F.; Sameer, P. CAD/CAM and Digital Impressions. Cat. Course Organ. Pennwell 2014, 13, 53–59. [Google Scholar]
- Uzun, G. An Overview of Dental CAD/CAM Systems. Biotechnol. Biotechnol. Equip. 2008, 22, 530–535. [Google Scholar] [CrossRef]
- Alhelwani, A.; Blom, E.; Leusink, F.; Feilzer, A.J. Comparative Evaluation of Accuracy of Intraoral Scanners and Conventional Impression Techniques: A Systematic Review. J. Dent. 2023, 137, 104677. [Google Scholar]
- Ender, A.; Mehl, A. Full Arch Scans: Traditional and Digital Impression—An In-Vitro Study. Int. J. Comput. Dent. 2011, 14, 11–21. [Google Scholar]
- Güth, J.F.; Keul, C.; Stimmelmayr, M.; Beuer, F.; Edelhoff, D. Accuracy of Digital Models Obtained by Direct and Indirect Data Capture. Clin. Oral Investig. 2013, 17, 1201–1208. [Google Scholar] [CrossRef]
- Chiu, A.; Chen, Y.W.; Hayashi, J.; Sadr, A. Accuracy of CAD/CAM Digital Impressions with Different Intraoral Scanner Parameters. Sensors 2020, 20, 1157. [Google Scholar] [CrossRef]
- Gómez-Polo, M.; Cascos, R.; Ortega, R.; Barmak, A.B.; Kois, J.C.; Revilla-León, M. Influence of Arch Location and Scanning Pattern on the Scanning Accuracy, Scanning Time, and Number of Photograms of Complete-Arch Intraoral Digital Implant Scans. Clin. Oral Implant. Res. 2023, 34, 591–601. [Google Scholar] [CrossRef]
- Giménez, B.; Özcan, M.; Martínez-Rus, F.; Pradíes, G. Accuracy of a Digital Impression System Based on Parallel Confocal Laser Technology for Implants with Consideration of Operator Experience and Implant Angulation and Depth. Int. J. Oral Maxillofac. Implant. 2014, 29, 853–862. [Google Scholar] [CrossRef] [PubMed]
- Nedelcu, R.G.; Persson, A.S. Scanning Accuracy and Precision in 4 Intraoral Scanners: An In Vitro Comparison Based on 3-Dimensional Analysis. J. Prosthet. Dent. 2014, 112, 1461–1471. [Google Scholar] [CrossRef]
- Ender, A.; Mehl, A. Accuracy of Complete-Arch Dental Impressions: A New Method of Measuring Trueness and Precision. J. Prosthet. Dent. 2013, 109, 121–128. [Google Scholar] [CrossRef]
- Patzelt, S.B.; Emmanouilidi, A.; Stampf, S.; Strub, J.R.; Att, W. Accuracy of Full-Arch Scans Using Intraoral Scanners. Clin. Oral Investig. 2014, 18, 1687–1694. [Google Scholar] [CrossRef]
- Güngör, B.E.; Yilmaz, M.; Çelikkol, O. Accuracy in Intraoral Scanners. Aydin Dent. J. 2015, 8, 123–141. [Google Scholar] [CrossRef]
- Robles-Medina, M.; Romeo-Rubio, M.; Salido, M.P.; Pradíes, G. Digital Intraoral Impression Methods: An Update on Accuracy. Dent. Restor. Mater. 2020, 7, 361–375. [Google Scholar] [CrossRef]
- Richert, R.; Goujat, A.; Venet, L.; Viguie, G.; Viennot, S.; Robinson, P.; Farges, J.C.; Fages, M.; Ducret, M. Intraoral Scanner Technologies: A Review to Make a Successful Impression. J. Health. Eng. 2017, 2017, 8427595. [Google Scholar] [CrossRef] [PubMed]
- Joda, T.; Brägger, U. Complete Digital Workflow for the Production of Implant-Supported Single-Unit Monolithic Crowns. Clin. Oral Implant. Res. 2014, 25, 1304–1306. [Google Scholar] [CrossRef]
- Flügge, T.; Van der Meer, W.J.; Gonzalez, B.G.; Vach, K.; Wismeijer, D.; Wang, P. The Accuracy of Different Dental Impression Techniques for Supported Dental Prostheses: A Systematic Review and Meta-Analysis. Clin. Oral Implant. Res. 2018, 29, 374–392. [Google Scholar] [CrossRef]
- Roth, I.; Czigola, A.; Joos Kovacs, G.L.; Dalos, M.; Hermann, P.; Borbely, J. Learning Curve of Digital Intraoral Scanning-An In Vivo Study. BMC Oral Health 2020, 20, 287. [Google Scholar] [CrossRef] [PubMed]
- Pernar, L.I.M.; Robertson, F.C.; Tavakkoli, A.; Sheu, E.G.; Brooks, D.C.; Smink, D.S. An Appraisal of the Learning Curve in Robotic General Surgery. Surg. Endosc. 2017, 31, 4583–4596. [Google Scholar] [CrossRef] [PubMed]
- Gómez-Polo, M.; Cimolai, A.; Ortega, R.; Barmak, A.B.; Kois, J.C.; Revilla-León, M. Accuracy, Scanning Time, and Number of Photograms of Various Scanning Patterns for the Extraoral Digitalization of Complete Dentures by Using an Intraoral Scanner. J. Prosthet. Dent. 2024, 131, 521–528. [Google Scholar] [CrossRef] [PubMed]
- Kernen, F.R.; Recca, M.; Vach, K.; Nahles, S.; Nelson, K.; Flügge, T.V. In Vitro Scanning Accuracy Using Different Aids for Multiple Implants in the Edentulous Arch. Clin. Oral Implant. Res. 2022, 33, 1010–1020. [Google Scholar] [CrossRef]
- Wu, H.K.; Wang, J.; Chen, G.; Huang, X.; Deng, F.; Li, Y. Effect of Novel Prefabricated Auxiliary Devices Attaching to Scan Bodies on the Accuracy of Intraoral Scanning of Complete-Arch with Multiple Implants: An In-Vitro Study. J. Dent. 2023, 138, 104702. [Google Scholar] [CrossRef] [PubMed]
- Christensen, G.J. Will Digital Impressions Eliminate the Current Problems with Conventional Impressions? J. Am. Dent. Assoc. 2008, 139, 761–763. [Google Scholar] [CrossRef]
- Thongthammachat, S.; Moore, B.K.; Barco, M.T., II; Hovijitra, S.; Brown, D.T.; Andres, C.J. Dimensional Accuracy of Dental Casts: Influence of Tray Material, Impression Material, and Time. J. Prosthodont. 2002, 11, 98–108. [Google Scholar] [CrossRef]
- Ng, J.; Ruse, D.; Wyatt, C. A Comparison of the Marginal Fit of Crowns Fabricated with Digital and Conventional Methods. J. Prosthet. Dent. 2014, 112, 555–560. [Google Scholar] [CrossRef]
- Powers, J.M.; Wataha, J.C. Craig’ Restorative Dental Materials, 12th ed.; Mosby Elsevier: St. Louis, MO, USA, 2008. [Google Scholar]
- Anusavice, K.J.; Shen, C.; Rawls, H.R. Phillips’ Science of Dental Materials, 12th ed.; Elsevier: St. Louis, MO, USA, 2012. [Google Scholar]
- Mandikos, M.N. Polyvinyl Siloxane Impression Materials: An Update on Clinical Use. Aus. Dent. J. 1998, 43, 428–434. [Google Scholar] [CrossRef]
- Karaçor, K. Digital Impression Systems and Workflow Prosthodontics. 2024, 14, 646–651. [Google Scholar]
- Alkadi, L.A. Comprehensive Review of Factors That Influence the Accuracy of Intraoral Scanners. Diagnostics 2023, 13, 3291. [Google Scholar] [CrossRef] [PubMed]
- Latham, J.; Ludlow, M.; Mennito, A.; Kelly, A.; Evans, Z.; Renne, W. Effect of Scan Pattern on Complete-Arch Scans with 4 Digital Scanners. J. Prosthet. Dent. 2020, 123, 85–95. [Google Scholar] [CrossRef] [PubMed]
- Joda, T.; Brägger, U. Clinical Compliance and Efficiency of Monolithic Zirconia Restorations Fabricated in Dental Applications. J. Dent. Res. 2016, 95, 105–112. [Google Scholar]
- Jamjoom, F.Z.; Aldghim, A.; Aldibasi, O.; Yilmaz, B. In Vitro Evaluation of the Impact of Intraoral Scanner, Scanning Aids, and the Scanned Arch on the Scan Accuracy of Edentulous Arches. J. Prosthodont. 2024. ahead of print. [Google Scholar] [CrossRef] [PubMed]
- Treesh, J.C.; Liacouras, P.C.; Taft, R.M.; Brooks, D.I.; Raiciulescu, S.; Ellert, D.O.; Grant, G.T.; Ye, L. Complete-Arch Accuracy of Intraoral Scanners. J. Prosthet. Dent. 2018, 120, 382–388. [Google Scholar] [CrossRef]
- Sim, J.Y.; Jang, Y.; Kim, W.C.; Kim, H.Y.; Lee, D.H.; Kim, J.H. Comparing the Accuracy (Trueness and Precision) of Models of Fixed Dental Prostheses Fabricated by Digital and Conventional Workflows. J. Prosthodont. Res. 2019, 63, 25–30. [Google Scholar] [CrossRef]
- Seelbach, P.; Brueckel, C.; Wostmann, B. Accuracy of Digital and Conventional Impression Techniques and Workflow. Clin. Oral Investig. 2013, 17, 1759–1764. [Google Scholar] [CrossRef]
- Zarauz, C.; Valverde, A.; Martinez-Rus, F.; Hassan, B.; Pradies, G. Clinical Evaluation comparing the Fit of All-Ceramic Crowns Obtained from Silicone and Digital Intraoral Impressions. Clin. Oral Investig. 2016, 20, 799–806. [Google Scholar] [CrossRef] [PubMed]
- Syrek, A.; Reich, G.; Ranftl, D.; Klein, C.; Cerny, B.; Brodesser, J. Clinical Evaluation of All-Ceramic Crowns Fabricated from Intraoral Digital Impressions Based on the Principle of Active Wavefront Sampling. J. Dent. 2010, 38, 553–559. [Google Scholar] [CrossRef]
- Wostmann, B.; Dohle, A.; Rettberg, S. On the Question of the Impression Accuracy Achievable In Vivo. DZZ 1994, 49, 679–682. [Google Scholar]

| Trueness | ||||||||
|---|---|---|---|---|---|---|---|---|
| Valid | Missing | Mean | Median | Std. Deviation | Minimum | Maximum | F-Value | |
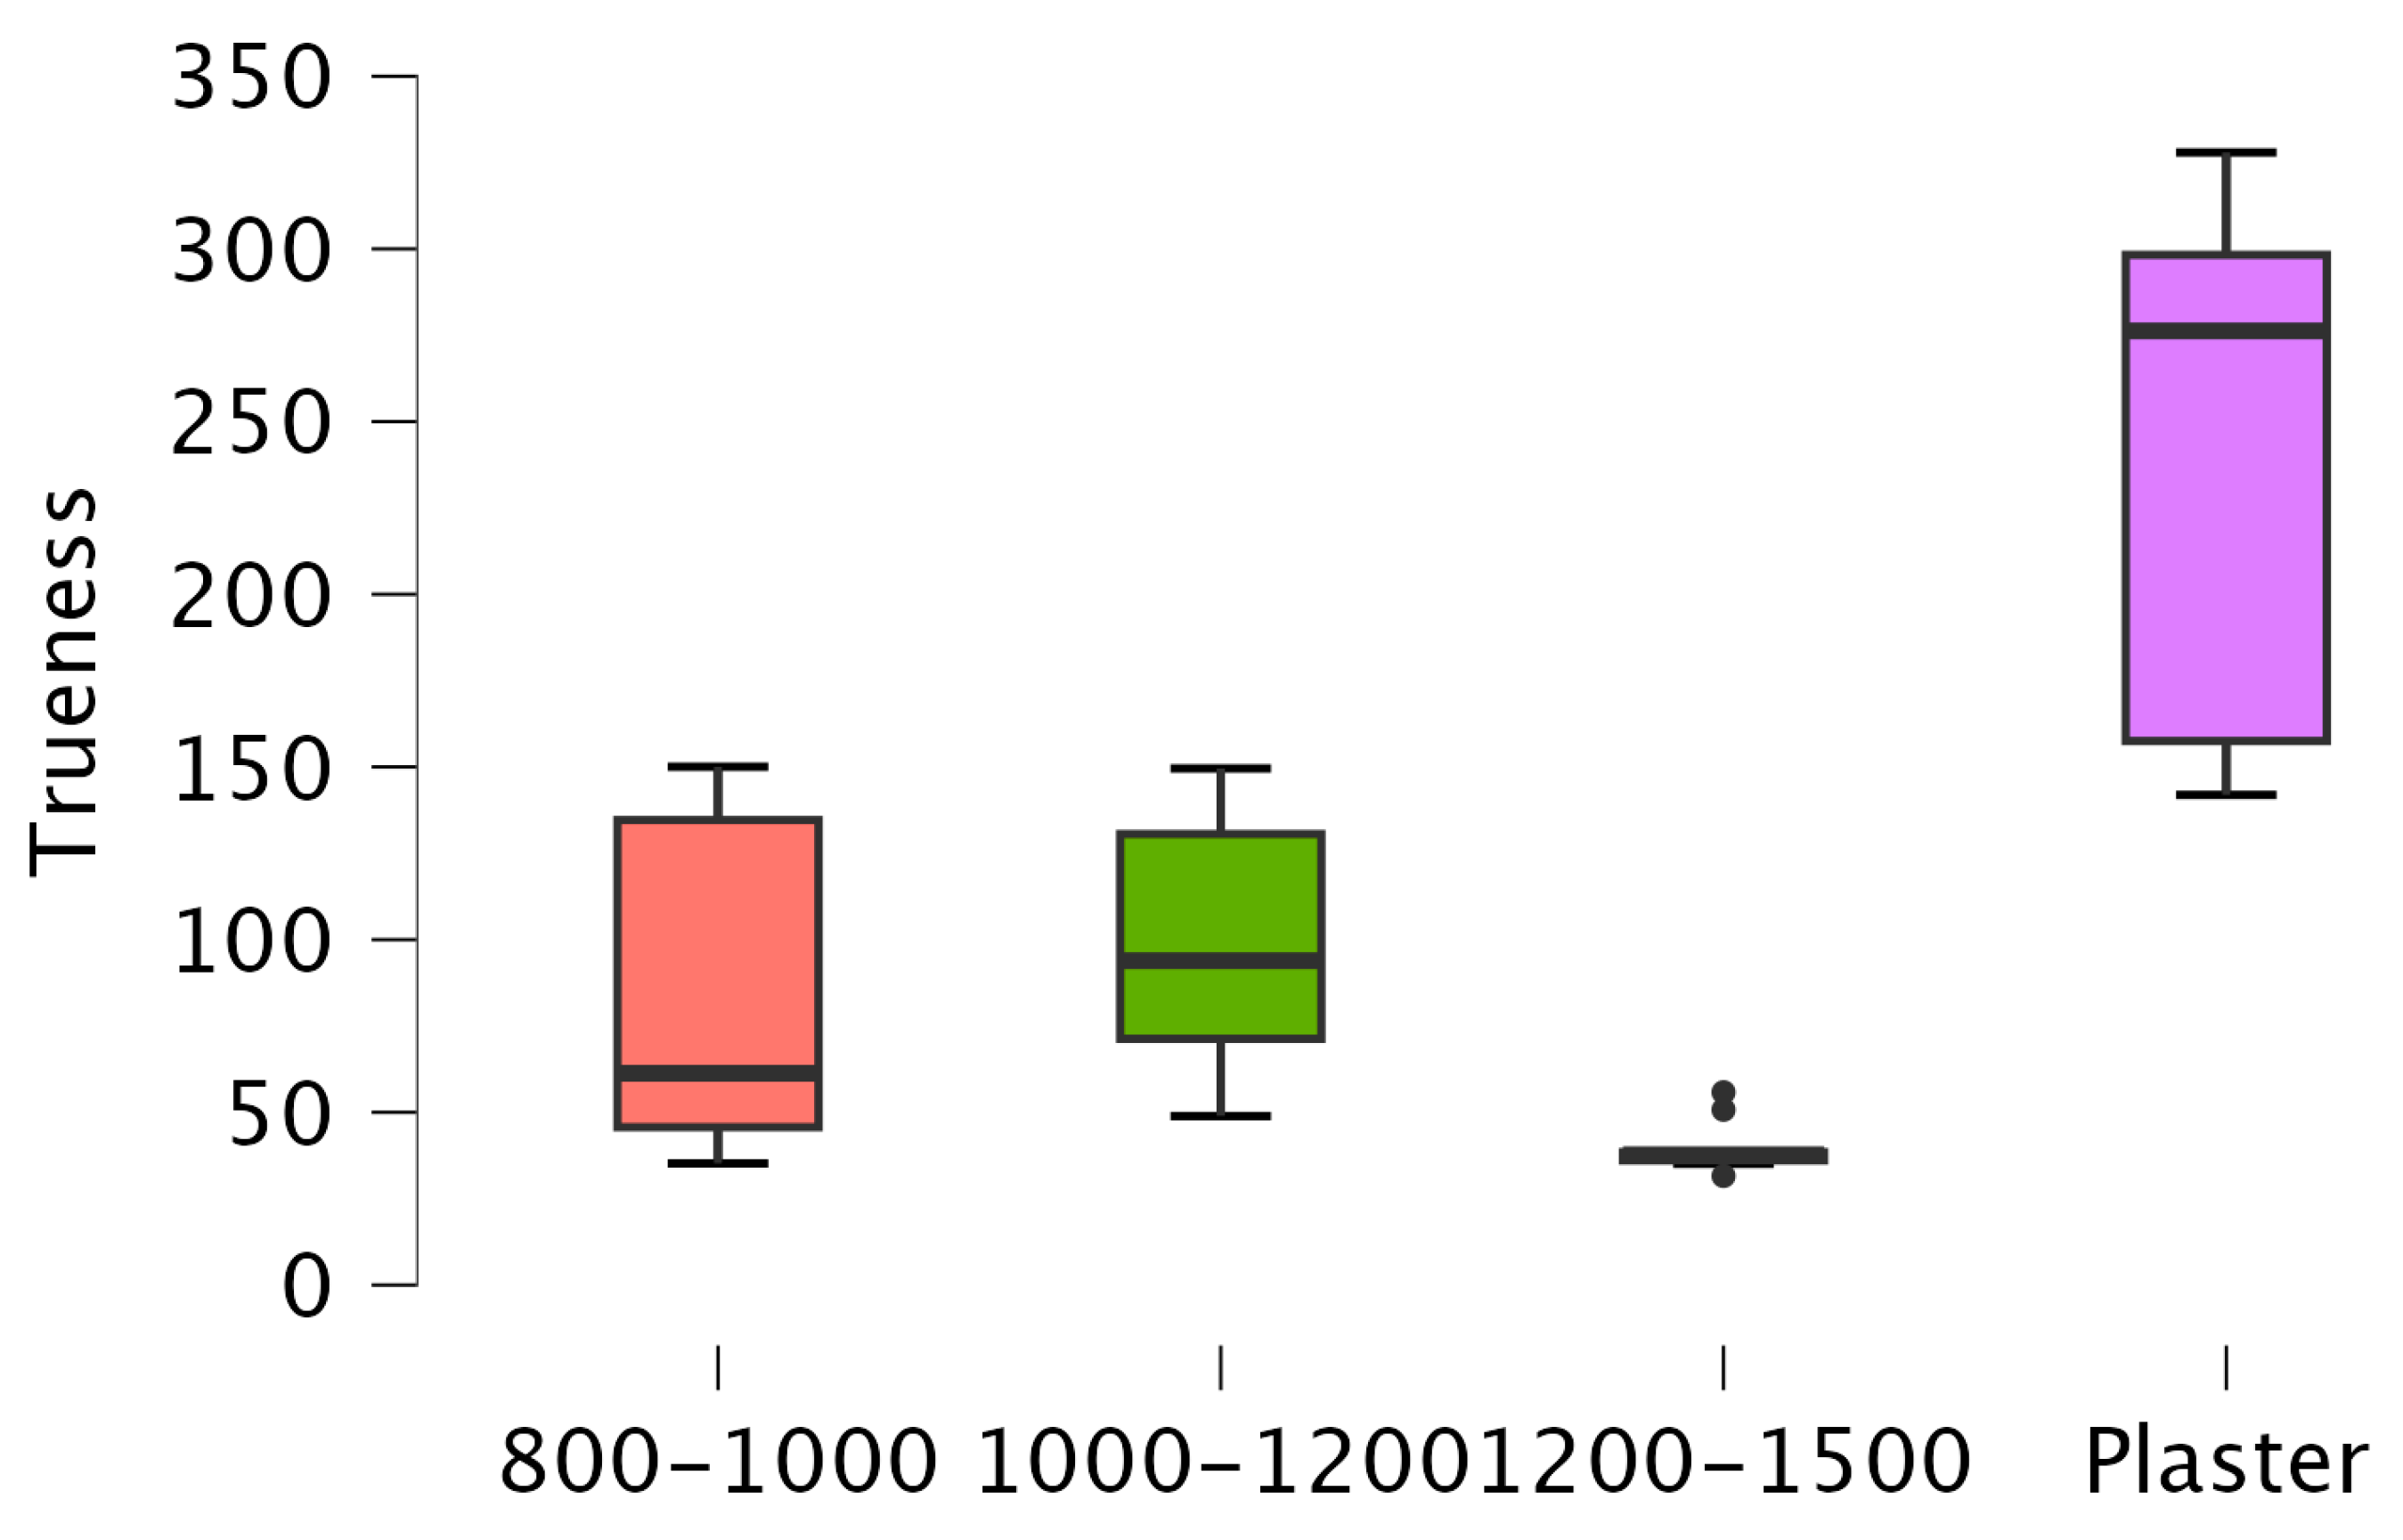
| Plaster a | 10 | 0 | 237.05 | 276.3 | 76.56 | 141.91 | 327.93 | 27.386 |
| 800–1000 b | 10 | 0 | 84.72 | 61.3 | 48.96 | 35.2 | 150.06 | |
| 1000–1200 ab | 10 | 0 | 98.66 | 93.9 | 36.8 | 48.92 | 149.56 | |
| 1200–1500 b | 10 | 0 | 39.79 | 37.7 | 7.48 | 31.58 | 55.82 | |
| Precision | ||||||||
|---|---|---|---|---|---|---|---|---|
| Valid | Missing | Mean | Median | Std. Deviation | Minimum | Maximum | F-Value | |
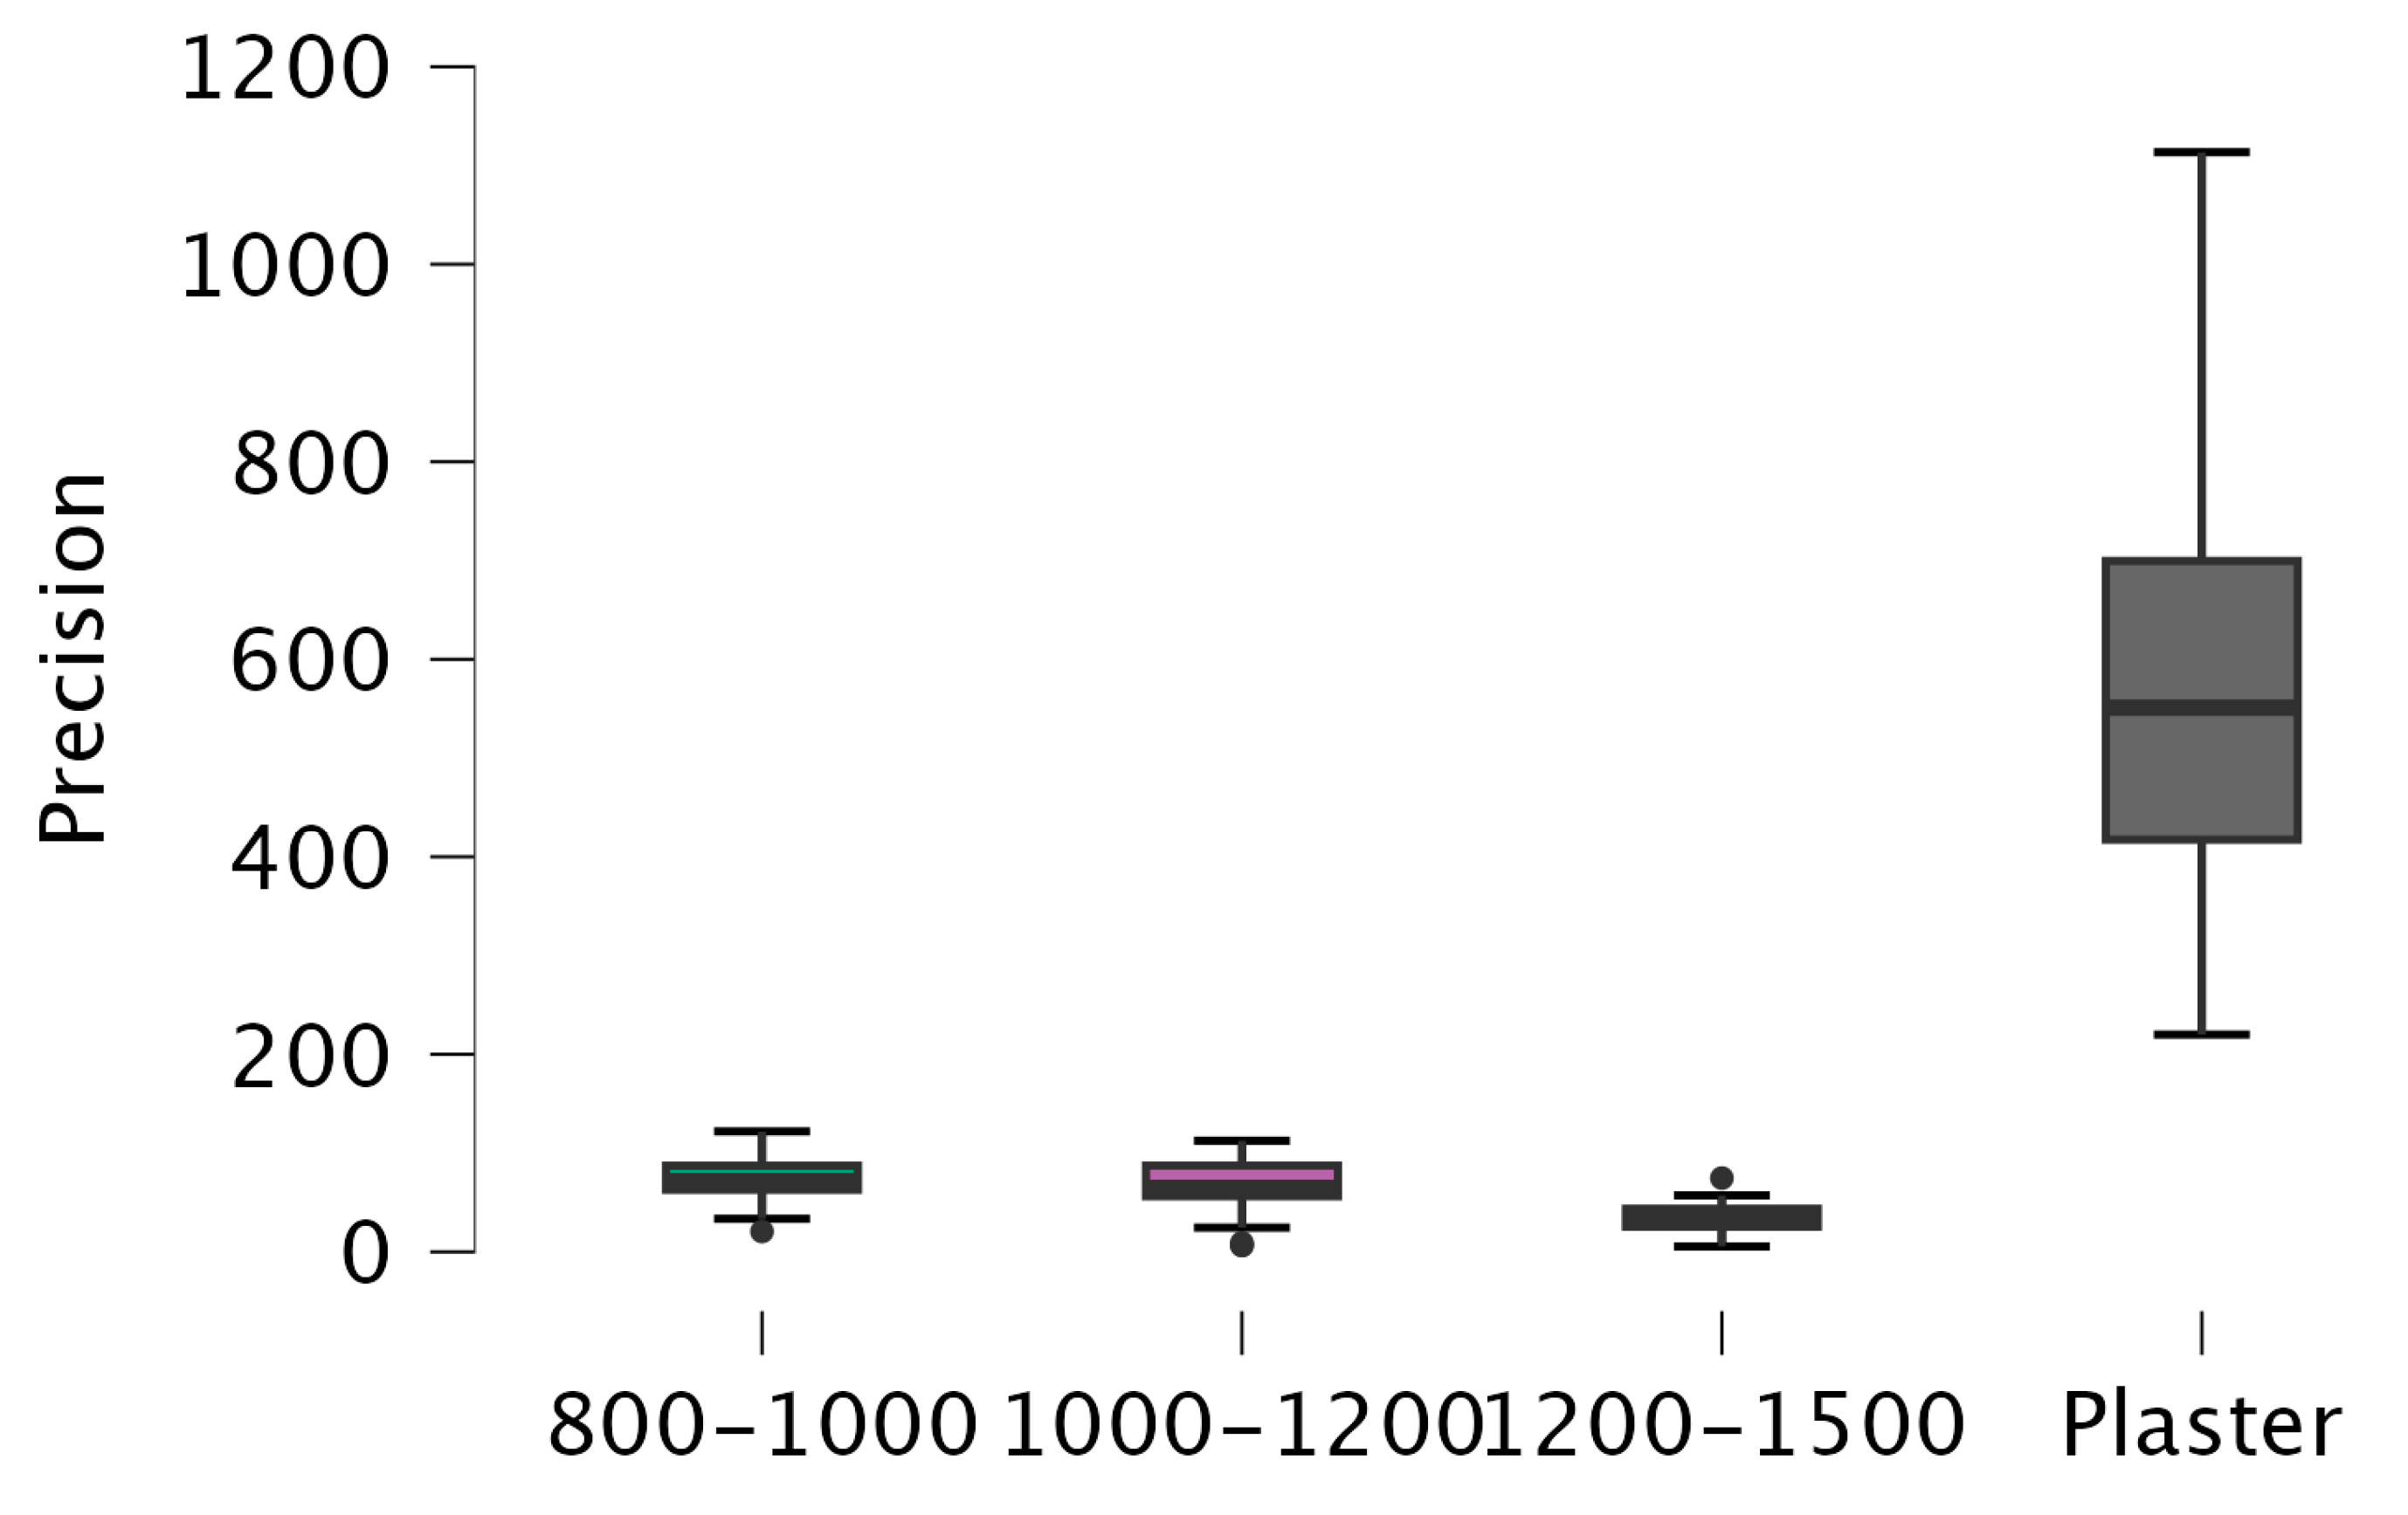
| Plaster c | 45 | 0 | 570.89 | 551 | 210.44 | 220 | 1113.44 | 134.255 |
| 800–1000 a | 45 | 0 | 74.77 | 71.4 | 21.04 | 20.62 | 121.98 | |
| 1000–1200 a | 45 | 0 | 67.43 | 64.7 | 26.73 | 6.43 | 112.56 | |
| 1200–1500 b | 45 | 0 | 35.36 | 34.6 | 13.57 | 5.50 | 74.73 | |
Disclaimer/Publisher’s Note: The statements, opinions and data contained in all publications are solely those of the individual author(s) and contributor(s) and not of MDPI and/or the editor(s). MDPI and/or the editor(s) disclaim responsibility for any injury to people or property resulting from any ideas, methods, instructions or products referred to in the content. |
© 2024 by the authors. Licensee MDPI, Basel, Switzerland. This article is an open access article distributed under the terms and conditions of the Creative Commons Attribution (CC BY) license (https://creativecommons.org/licenses/by/4.0/).
Share and Cite
Güntekin, N.; Çiftçi, A.; Gözen, M.; İleri, S.A. The Effect of Image Count on Accuracy in Digital Measurements in Dentistry. Diagnostics 2024, 14, 2122. https://doi.org/10.3390/diagnostics14192122
Güntekin N, Çiftçi A, Gözen M, İleri SA. The Effect of Image Count on Accuracy in Digital Measurements in Dentistry. Diagnostics. 2024; 14(19):2122. https://doi.org/10.3390/diagnostics14192122
Chicago/Turabian StyleGüntekin, Neslihan, Aslı Çiftçi, Mehmet Gözen, and Sema Ateşalp İleri. 2024. "The Effect of Image Count on Accuracy in Digital Measurements in Dentistry" Diagnostics 14, no. 19: 2122. https://doi.org/10.3390/diagnostics14192122