
An Improved Skin Lesion Classification Using a Hybrid Approach with Active Contour Snake Model and Lightweight Attention-Guided Capsule Networks


Abstract
:1. Introduction
Motivation and Objectives
- Low Contrast: Low-contrast skin lesions affect lesion localization accuracy. Some existing technologies may occasionally fail to generate exact, clear edges between various regions in the images during segmentation. Some authors have failed to address the preprocessing method, which might lead to image inaccuracy [25].
- Variations: Variations in lesion shape and texture can lead to incorrect region segmentation, which then leads to the extraction of irrelevant features [26].
- Feature Extraction: Failure to incorporate crucial spatial relationships among characteristics such as incorrect region features, healthy region features, and extra features that are necessary for the classification purpose [27].
- Time-Consuming: Certain classification techniques may require a substantial amount of annotated data to operate optimally, which can be costly and time-consuming, especially for less frequent or specialized forms of skin cancer [28].
- Lack of Interpretability: Understanding decisions and how to interpret the retrieved features is not always easy. Because there are more extracted features than previous efforts, the final prediction is more challenging.
- Developing and implement an active contour segmentation technique for accurately localizing skin lesions within images and applying the ResNet50 pre-trained network to extract essential and relevant features of interest from images.
- Proposing a novel approach by integrating a capsule network architecture fused with the convolutional block attention module (CBAM), which includes dynamic routing and layer-based squashing for feature extraction and classification of segmented skin lesions. Stochastic gradient descent (SGD), a gradient-based optimization technique, is used to optimize the model parameters.
- Evaluating the novel approach on a diverse dataset of skin lesion images and comparing its performance against traditional methods and state-of-the-art techniques.
2. Related Work
3. Methodology
3.1. Proposed Novel Lightweight Attention Mechanism-Capsule Neural Network Framework
3.2. Dataset Acquisition and Preparation
3.3. Image Preprocessing
3.3.1. Data Augmentation
3.3.2. Data Normalization
3.4. Image Segmentation
3.5. Feature Extraction
Design of Residual Building Block (RBB) in ResNet50
3.6. Skin Lesion Classification Using Lightweight-Guide Capsule Neural Network
3.6.1. Convolutional Block Attention Mechanism (CBAM)
3.6.2. Development of Proposed Capsule Neural Network
3.6.3. Stochastic Gradient Descent (SGD) Optimizer
4. Experimental Results
4.1. Dataset
4.2. Image Preprocessing
4.3. Active Contour Segmentation
4.4. Feature Extraction
4.4.1. Convexity
4.4.2. Circularity
4.4.3. Irregularity Index
4.4.4. Textural Pattern
4.4.5. Color Features
4.5. Results of Classification Phase Using Proposed Lightweight-Guided CapsNet Model
4.6. Comparison of LACapsNet Results with Augmentation and without Augmentation
4.7. Comparative Analysis
4.7.1. Accuracy
4.7.2. Sensitivity
4.7.3. Specificity
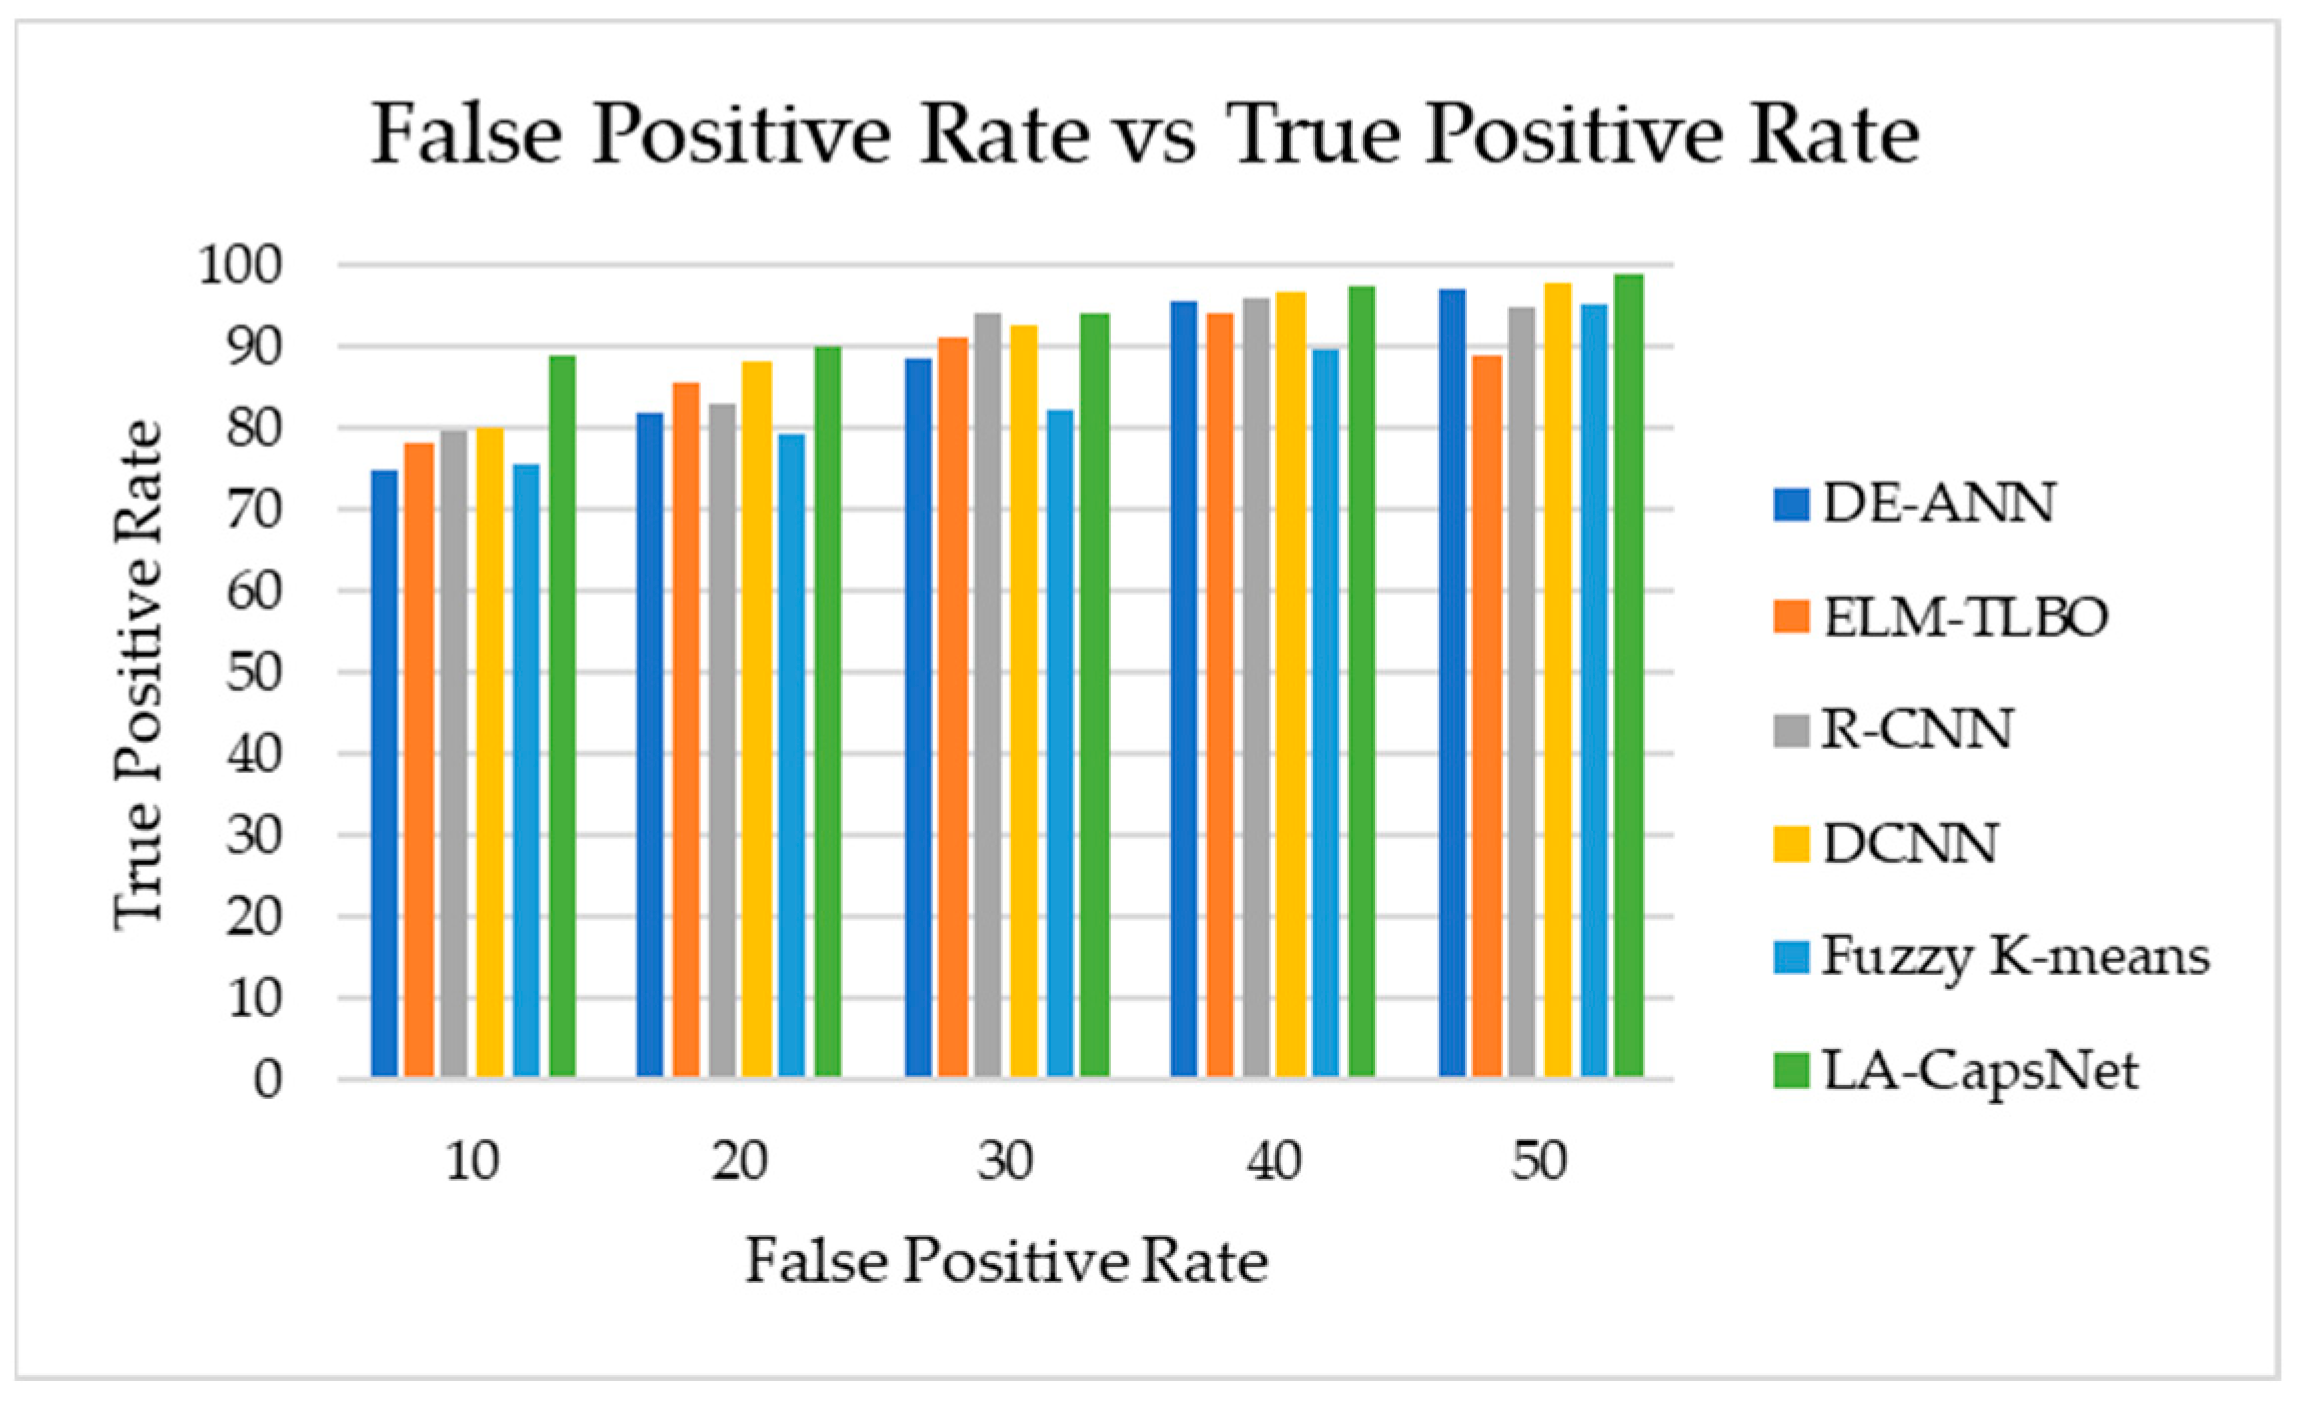
4.7.4. AUC-ROC
4.7.5. F1 Score
4.8. Research Summary
5. Conclusions and Future Scope
Author Contributions
Funding
Institutional Review Board Statement
Informed Consent Statement
Data Availability Statement
Acknowledgments
Conflicts of Interest
References
- Khan, N.H.; Mir, M.; Qian, L.; Baloch, M.; Khan, M.F.A.; Rehman, A.-U.; Ngowi, E.E.; Wu, D.-D.; Ji, X.-Y. Skin cancer biology and barriers to treatment: Recent applications of polymeric micro/nanostructures. J. Adv. Res. 2021, 36, 223–247. [Google Scholar] [CrossRef] [PubMed]
- Monika, M.K.; Vignesh, N.A.; Kumari, C.U.; Kumar, M.N.V.S.S.; Lydia, E.L. Skin cancer detection and classification using machine learning. Mater. Today Proc. 2020, 33, 4266–4270. [Google Scholar] [CrossRef]
- Wright, C.Y.; Jean du Preez, D.; Millar, D.A.; Norval, M. The Epidemiology of Skin Cancer and Public Health Strategies for Prevention in Southern Africa. Int. J. Environ. Res. Pub. Health 2020, 17, 1017. [Google Scholar] [CrossRef] [PubMed]
- Schadendorf, D.; Van Akkooi, A.C.; Berking, C.; Griewank, K.G.; Gutzmer, R.; Hauschild, A.; Stang, A.; Roesch, A.; Ugurel, S. Melanoma. Lancet 2018, 392, 971–984. [Google Scholar] [CrossRef] [PubMed]
- Republic of South Africa, Department of Statistics: Stats SA. Available online: http://www.statssa.gov.za (accessed on 20 August 2023).
- Colditz, G.A. Cancer Association of South Africa. SAGE Encycl. Cancer Soc. 2021, 1–20. [Google Scholar] [CrossRef]
- Ndlovu, B.C.; Sengayi-Muchengeti, M.; Wright, C.Y.; Chen, W.C.; Kuonza, L.; Singh, E. Skin cancer risk factors among Black South Africans—The Johannesburg Cancer Study, 1995–2016. Immun. Inflamm. Dis. 2022, 10, e623. [Google Scholar] [CrossRef]
- Republic of South Africa, Department of Health: National Cancer Strategic Framework for South Africa, 2017–2022. Available online: https://www.health.gov.za (accessed on 20 August 2023).
- Dinnes, J.; Deeks, J.J.; Grainge, M.J.; Chuchu, N.; di Ruffano, L.F.; Matin, R.N.; Thomson, D.R.; Wong, K.Y.; Aldridge, R.B.; Abbott, R.; et al. Visual inspection for diagnosing cutaneous melanoma in adults (Review). Cochrane Database Syst. Rev. 2018, 12. [Google Scholar] [CrossRef]
- Young, A.T.; Vora, N.B.; Cortez, J.; Tam, A.; Yeniay, Y.; Afifi, L.; Yan, D.; Nosrati, A.; Wong, A.; Johal, A.; et al. The role of technology in melanoma screening and diagnosis. Pigment. Cell Melanoma Res. 2021, 34, 288–300. [Google Scholar] [CrossRef]
- Man against Machine: AI Is Better than Dermatologists at Diagnosing Skin Cancer. Available online: https://www.sciencedaily.com/releases/2018/05/180528190839.htm (accessed on 20 August 2023).
- Duarte, A.F.; Sousa-Pinto, B.; Azevedo, L.F.; Barros, A.M.; Puig, S.; Malvehy, J.; Haneke, E.; Correia, O. Clinical ABCDE rule for early melanoma detection. Eur. J. Dermatol. 2021, 31, 771–778. [Google Scholar] [CrossRef] [PubMed]
- Saravanan, S.; Heshma, B.; Shanofer, A.A.; Vanithamani, R. Skin cancer detection using dermoscope images. Mater. Today Proc. 2020, 33, 4823–4827. [Google Scholar] [CrossRef]
- Wei, L.; Ding, K.; Hu, H. Automatic skin cancer detection in dermoscopy images based on ensemble lightweight deep learning network. IEEE Access 2020, 8, 99633–99647. [Google Scholar] [CrossRef]
- Thanh, D.N.; Prasath, V.S.; Hieu, L.M.; Hien, N.N. Melanoma skin cancer detection method based on adaptive principal curvature, colour normalization and feature extraction with the ABCD rule. J. Digit. Imaging 2020, 33, 574–585. [Google Scholar] [CrossRef]
- Murugan, A.; Nair, S.A.H.; Preethi, A.A.P.; Kumar, K.S. Diagnosis of skin cancer using machine learning techniques. Microprocess. Microsyst. 2021, 81, 103727. [Google Scholar] [CrossRef]
- Subha, S.; Wise, D.J.W.; Srinivasan, S.; Preetham, M.; Soundarlingam, B. Detection and differentiation of skin cancer from rashes. In Proceedings of the 2020 International Conference on Electronics and Sustainable Communication Systems (ICESC), Coimbatore, India, 2–4 July 2020; IEEE: Piscataway, NJ, USA, 2021; pp. 389–393. [Google Scholar]
- Verstockt, J.; Verspeek, S.; Thiessen, F.; Tjalma, W.A.; Brochez, L.; Steenackers, G. Skin cancer detection using infrared thermography: Measurement setup, procedure and equipment. Sensors 2022, 22, 3327. [Google Scholar] [CrossRef]
- Aljanabi, M.; Enad, M.H.; Chyad, R.M.; Jumaa, F.A.; Mosheer, A.D.; Ali Altohafi, A.S. A review ABCDE Evaluated the Model for Decision by Dermatologists for Skin Lesions using Bee Colony. IOP Conf. Ser. Mater. Sci. Eng. 2020, 745, 012098. [Google Scholar] [CrossRef]
- Das, K.; Cockerell, C.J.; Patil, A.; Pietkiewicz, P.; Giulini, M.; Grabbe, S.; Goldust, M. Machine learning and its application in skin cancer. Int. J. Environ. Res. Public Health 2021, 18, 13409. [Google Scholar] [PubMed]
- Zhang, N.; Cai, Y.X.; Wang, Y.Y.; Tian, Y.T.; Wang, X.L.; Badami, B. Skin cancer diagnosis based on optimized convolutional neural network. Artif. Intell. Med. 2020, 102, 101756. [Google Scholar] [CrossRef]
- Vidya, M.; Karki, M.V. Skin cancer detection using machine learning techniques. In Proceedings of the 2020 IEEE international conference on electronics, computing and communication technologies (CONECCT), Bangalore, India, 2–4 July 2020; IEEE: Piscataway, NJ, USA, 2020; pp. 1–5. [Google Scholar]
- Wang, Y.; Louie, D.C.; Cai, J.; Tchvialeva, L.; Lui, H.; Wang, Z.J.; Lee, T.K. Deep learning enhances polarization speckle for in vivo skin cancer detection. Opt. Laser Technol. 2021, 140, 107006. [Google Scholar] [CrossRef]
- Mehr, R.A.; Ameri, A. Skin Cancer Detection Based on Deep Learning. J. Biomed. Phys. Eng. 2022, 12, 559–568. [Google Scholar] [CrossRef]
- Naqvi, M.; Gilani, S.Q.; Syed, T.; Marques, O.; Kim, H.-C. Skin Cancer Detection Using Deep Learning—A Review. Diagnostics 2023, 13, 1911. [Google Scholar] [CrossRef] [PubMed]
- Hartanto, C.A.; Wibowo, A. Development of mobile skin cancer detection using faster R-CNN and MobileNet v2 model. In Proceedings of the 2020 7th International Conference on Information Technology, Computer, and Electrical Engineering (ICITACEE), Semarang, Indonesia, 24–25 September 2020; IEEE: Piscataway, NJ, USA, 2020; pp. 58–63. [Google Scholar]
- Adla, D.; Reddy, G.V.R.; Nayak, P.; Karuna, G. Deep learning-based computer aided diagnosis model for skin cancer detection and classification. Distrib. Parallel Databases 2022, 40, 717–736. [Google Scholar] [CrossRef]
- Behara, K.; Bhero, E.; Agee, J.T.; Gonela, V. Artificial Intelligence in Medical Diagnostics: A Review from a South African Context. Sci. Afr. 2022, 17, e01360. [Google Scholar] [CrossRef]
- Fraiwan, M.; Faouri, E. On the automatic detection and classification of skin cancer using deep transfer learning. Sensors 2022, 22, 4963. [Google Scholar] [CrossRef]
- Patel, C.; Bhatt, D.; Sharma, U.; Patel, R.; Pandya, S.; Modi, K.; Cholli, N.; Patel, A.; Bhatt, U.; Khan, M.A.; et al. DBGC: Dimension-based generic convolution block for object recognition. Sensors 2022, 22, 1780. [Google Scholar] [CrossRef]
- Hemalatha, R.; Thamizhvani, T.; Dhivya AJ, A.; Joseph, J.E.; Babu, B.; Chandrasekaran, R. Active Contour Based Segmentation Techniques for Medical Image Analysis. In Medical and Biological Image Analysis; IntechOpen: London, UK, 2018; p. 74576. [Google Scholar]
- Almeida, M.A.M.; Santos, I.A.X. Classification models for skin tumor detection using texture analysis in medical images. J. Imaging 2020, 6, 51–65. [Google Scholar] [CrossRef] [PubMed]
- Liu, S.; Wang, Z.; An, Y.; Zhao, J.; Zhao, Y.; Zhang, Y.-D. EEG emotion recognition based on the attention mechanism and pre-trained convolution capsule network. Knowl.-Based Syst. 2023, 265, 110372. [Google Scholar] [CrossRef]
- Quan, H.; Xu, X.; Zheng, T.; Li, Z.; Zhao, M.; Cui, X. DenseCapsNet: Detection of COVID-19 from X-ray images using a capsule neural network. Comput. Biol. Med. 2021, 133, 104399. [Google Scholar] [CrossRef]
- Wang, Y.; Ning, D.; Feng, S. A novel capsule network based on wide convolution and multi-scale convolution for fault diagnosis. Appl. Sci. 2020, 10, 3659. [Google Scholar] [CrossRef]
- Mobiny, A.; Lu, H.; Nguyen, H.V.; Roysam, B.; Varadarajan, N. Automated classification of apoptosis in phase contrast microscopy using capsule network. IEEE Trans. Med. Imaging 2020, 39, 1–10. [Google Scholar] [CrossRef]
- Jones, O.T.; Matin, R.N.; Van der Schaar, M.; Bhayankaram, K.P.; Ranmuthu, C.K.I.; Islam, M.S.; Behiyat, D.; Boscott, R.; Calanzani, N.; Emery, J.; et al. Artificial intelligence and machine learning algorithms for early detection of skin cancer in community and primary care settings: A systematic review. Lancet Digit. Health 2022, 4, e466–e476. [Google Scholar] [CrossRef]
- Thurnhofer-Hemsi, K.; Domínguez, E. A convolutional neural network framework for accurate skin cancer detection. Neural Process. Lett. 2021, 53, 3073–3093. [Google Scholar] [CrossRef]
- Kumar, M.; Alshehri, M.; AlGhamdi, R.; Sharma, P.; Deep, V. A DE-ANN inspired skin cancer detection approach using fuzzy c-means clustering. Mob. Netw. Appl. 2020, 25, 1319–1329. [Google Scholar] [CrossRef]
- Xi, E.; Bing, S.; Jin, Y. Capsule network performance on complex data. arXiv 2017, arXiv:1712.03480. [Google Scholar]
- Gowthami, V.; Sneha, G. Melanoma Detection Using Recurrent Neural Network. In Advances in Automation, Signal Processing, Instrumentation, and Control. i-CASIC 2020; Komanapalli, V.L.N., Sivakumaran, N., Hampannavar, S., Eds.; Lecture Notes in Electrical Engineering; Springer: Singapore, 2021; Volume 700. [Google Scholar] [CrossRef]
- Arshed, M.A.; Mumtaz, S.; Ibrahim, M.; Ahmed, S.; Tahir, M.; Shafi, M. Multiclass Skin Cancer Classification Using Vision Transformer Networks and Convolutional Neural Network-Based Pre-Trained Models. Information 2023, 14, 415. [Google Scholar] [CrossRef]
- Sabour, S.; Frosst, N.; Hinton, G.E. Dynamic Routing Between Capsules. Adv. Neural Inf. Process. Syst. 2017, 3856–3866. [Google Scholar]
- Nawaz, M.; Mehmood, Z.; Nazir, T.; Naqvi, R.A.; Rehman, A.; Iqbal, M.; Saba, T. Skin cancer detection from dermoscopic images using deep learning and fuzzy k-means clustering. Microsc. Res. Tech. 2022, 85, 339–351. [Google Scholar] [CrossRef] [PubMed]
- Durgarao, N.; Sudhavani, G. Diagnosing skin cancer via C-means segmentation with enhanced fuzzy optimization. IET Image Process. 2021, 15, 2266–2280. [Google Scholar] [CrossRef]
- Keerthana, D.; Venugopal, V.; Nath, M.K.; Mishra, M. Hybrid convolutional neural networks with SVM classifier for classification of skin cancer. Biomed. Eng. Adv. 2023, 5, 100069. [Google Scholar] [CrossRef]
- Venugopal, V.; Raj, N.I.; Nath, M.K.; Stephen, N. A deep neural network using modified EfficientNet for skin cancer detection in dermoscopic images. Decis. Anal. J. 2023, 8, 100278. [Google Scholar] [CrossRef]
- Alwakid, G.; Gouda, W.; Humayun, M.; Sama, N.U. Melanoma detection using deep learning-based classifications. Healthcare 2022, 10, 2481. [Google Scholar] [CrossRef]
- Lembhe, A.; Motarwar, P.; Patil, R.; Elias, S. Enhancement in Skin Cancer Detection using Image Super Resolution and Convolutional Neural Network. Procedia Comput. Sci. 2023, 218, 164–173. [Google Scholar] [CrossRef]
- Priyadharshini, N.; Selvanathan, N.; Hemalatha, B.; Sureshkumar, C. A novel hybrid Extreme Learning Machine and Teaching–Learning-Based Optimization algorithm for skin cancer detection. Healthc. Anal. 2023, 3, 100161. [Google Scholar] [CrossRef]
- Shorfuzzaman, M. An explainable stacked ensemble of deep learning models for improved melanoma skin cancer detection. Multimed. Syst. 2022, 28, 1309–1323. [Google Scholar] [CrossRef]
- Rashid, J.; Ishfaq, M.; Ali, G.; Saeed, M.R.; Hussain, M.; Alkhalifah, T.; Alturise, F.; Samand, N. Skin cancer disease detection using transfer learning technique. Appl. Sci. 2022, 12, 5714. [Google Scholar] [CrossRef]
- Kadampur, M.A.; Al Riyaee, S. Skin cancer detection: Applying a deep learning-based model driven architecture in the cloud for classifying dermal cell images. Inform. Med. Unlocked 2020, 18, 100282. [Google Scholar] [CrossRef]
- Alam, T.M.; Shaukat, K.; Khan, W.A.; Hameed, I.A.; Almuqren, L.A.; Raza, M.A.; Aslam, M.; Luo, S. An efficient deep learning-based skin cancer classifier for an imbalanced dataset. Diagnostics 2022, 12, 2115. [Google Scholar] [CrossRef] [PubMed]
- Lan, Z.; Cai, S.; He, X.; Wen, X. Fixcaps: An improved capsule network for diagnosis of skin cancer. IEEE Access 2022, 10, 76261–76267. [Google Scholar] [CrossRef]
- Furriel, B.C.R.S.; Oliveira, B.D.; Prôa, R.; Paiva, J.Q.; Loureiro, R.M.; Calixto, W.P.; Reis, M.R.C.; Giavina-Bianchi, M. Artificial Intelligence for Skin Cancer Detection and Classification for Clinical Environment: A Systematic Review. Front. Med. 2023, 10, 1305954. Available online: www.ncbi.nlm.nih.gov/pmc/articles/PMC10800812/ (accessed on 18 February 2024). [CrossRef] [PubMed]
- Dahou, A.; Aseeri, A.O.; Mabrouk, A.; Ibrahim, R.A.; Al-Betar, M.A.; Elaziz, M.A. Optimal Skin Cancer Detection Model Using Transfer Learning and Dynamic-Opposite Hunger Games Search. Diagnostics 2023, 13, 1579. [Google Scholar] [CrossRef] [PubMed]
- Mazhar, T.; Haq, I.; Ditta, A.; Mohsan, S.A.H.; Rehman, F.; Zafar, I.; Gansau, J.A.; Goh, L.P.W. The role of machine learning and deep learning approaches for the detection of skin cancer. Healthcare 2023, 11, 415. [Google Scholar] [CrossRef] [PubMed]
- Tahir, M.; Naeem, A.; Malik, H.; Tanveer, J.; Naqvi, R.A.; Lee, S.W. DSCC_Net: Multi-Classification Deep Learning Models for Diagnosing of Skin Cancer Using Dermoscopic Images. Cancers 2023, 15, 2179. [Google Scholar] [CrossRef] [PubMed]
- Mridha, K.; Uddin, M.M.; Shin, J.; Khadka, S.; Mridha, M.F. An Interpretable Skin Cancer Classification Using Optimized Convolutional Neural Network for a Smart Healthcare System. IEEE Access 2023, 11, 41003–41018. [Google Scholar] [CrossRef]
- Aladhadh, S.; Alsanea, M.; Aloraini, M.; Khan, T.; Habib, S.; Islam, M. An effective skin cancer classification mechanism via medical vision transformer. Sensors 2022, 22, 4008. [Google Scholar] [CrossRef] [PubMed]
- Bhimavarapu, U.; Battineni, G. Skin Lesion Analysis for Melanoma Detection Using the Novel Deep Learning Model Fuzzy GC-SCNN. Healthcare 2022, 10, 962. [Google Scholar] [CrossRef] [PubMed]
- Mahum, R.; Aladhadh, S. Skin Lesion Detection Using Handcrafted and DL-Based Features Fusion and LSTM. Diagnostics 2022, 12, 2974. [Google Scholar] [CrossRef]
- Coronado-Gutiérrez, D.; López, C.; Burgos-Artizzu, X.P. Skin cancer high-risk patient screening from dermoscopic images via Artificial Intelligence: An online study. medRxiv 2021. [Google Scholar] [CrossRef]
- Atta, M.; Ahmed, O.; Rashed, A.; Ahmed, M. Advances in Image Enhancement for Performance Improvement: Mathematics, Machine Learning and Deep Learning Solutions. IEEE Access 2021, 1–14. [Google Scholar] [CrossRef]
- Ali, M.S.; Miah, M.S.; Haque, J.; Rahman, M.M.; Islam, M.K. An enhanced technique of skin cancer classification using deep convolutional neural network with transfer learning models. Mach. Learn. Appl. 2021, 5, 2666–8270. Available online: https://www.sciencedirect.com/science/article/pii/S2666827021000177 (accessed on 23 December 2023). [CrossRef]
- Patro, S.G.; Sahu, K.K. Normalization: A Preprocessing Stage. arXiv 2015, arXiv:1503.06462. [Google Scholar] [CrossRef]
- Lee, K.W.; Chin, R.K.Y. The Effectiveness of Data Augmentation for Melanoma Skin Cancer Prediction Using Convolutional Neural Networks. In Proceedings of the 2020 IEEE 2nd International Conference on Artificial Intelligence in Engineering and Technology (IICAIET), Kota Kinabalu, Malaysia, 26–27 September 2020; pp. 1–6. [Google Scholar] [CrossRef]
- Gouda, W.; Sama, N.U.; Al-Waakid, G.; Humayun, M.; Jhanjhi, N.Z. Detection of Skin Cancer Based on Skin Lesion Images Using Deep Learning. Healthcare 2022, 10, 1183. [Google Scholar] [CrossRef]
- Daghrir, J.; Tlig, L.; Bouchouicha, M.; Sayadi, M. Melanoma skin cancer detection using deep learning and classical machine learning techniques: A hybrid approach. In Proceedings of the 2020 5th International Conference on Advanced Technologies for Signal and Image Processing (ATSIP), Sousse, Tunisia, 2–5 September 2020; IEEE: Piscataway, NJ, USA, 2020; pp. 1–5. [Google Scholar]
- Modi, H.; Patel, H.; Patel, K. Comparative Analysis of Active Contour Models on Skin Cancer Images. In Proceedings of the International Conference on IoT Based Control Networks & Intelligent Systems—ICICNIS. 2021. Available online: https://ssrn.com/abstract=3883925 (accessed on 23 December 2023). [CrossRef]
- Riaz, F.; Naeem, S.; Nawaz, R.; Coimbra, M. Active Contours Based Segmentation and Lesion Periphery Analysis For Characterization of Skin Lesions in Dermoscopy Images. IEEE J. Biomed. Health Inform. 2018, 23, 489–500. [Google Scholar] [CrossRef] [PubMed]
- Bayraktar, M.; Kockara, S.; Halic, T.; Mete, M.; Wong, H.K.; Iqbal, K. Local edge-enhanced active contour for accurate skin lesion border detection. BMC Bioinform. 2019, 20, 87–97. [Google Scholar] [CrossRef] [PubMed]
- Rodtook, A.; Khwunta, K.; Wanrudee, L.; Stanislav, S.M. Automatic initialization of active contours and level set method in ultrasound images of breast abnormalities. Pattern Recognit. 2018, 79, 172–182. [Google Scholar] [CrossRef]
- He, K.; Zhang, X.; Ren, S.; Sun, J. Deep Residual Learning for Image Recognition. 2016, pp. 770–778. Available online: http://image-net.org/challenges/LSVRC/2015/ (accessed on 13 July 2023).
- Dropout Regularization in Neural Networks: How It Works and When to Use It—Programmathically. Available online: https://programmathically.com/dropout-regularization-in-neural-networks-how-it-works-and-when-to-use-it/ (accessed on 12 August 2022).
- Sambyal, K.; Gupta, S.; Gupta, V. Skin Cancer Detection Using Resnet. In Proceedings of the International Conference on Innovative Computing & Communication (ICICC). 2022. Available online: https://ssrn.com/abstract=4365250 (accessed on 29 January 2024). [CrossRef]
- Pérez, E.; Ventura, S. Melanoma Recognition by Fusing Convolutional Blocks and Dynamic Routing between Capsules. Cancers 2021, 13, 4974. [Google Scholar] [CrossRef] [PubMed]
- Woo, S.; Park, J.; Lee, J.Y.; Kweon, I.S. CBAM: Convolutional block attention module. In Proceedings of the European Conference on Computer Vision (ECCV), Munich, Germany, 8–14 September 2018; pp. 3–19. [Google Scholar]
- Yang, J.; Yang, G. Modified Convolutional Neural Network Based on Dropout, and the Stochastic Gradient Descent Optimizer. Algorithms 2018, 11, 28. [Google Scholar] [CrossRef]
- Pechyonkin, Max. “Understanding Hinton’s Capsule Networks. Part III: Dynamic Routing between Capsules.” AI3|Theory, Practice, Business, 18 Dec. 2018. Available online: https://medium.com/ai%C2%B3-theory-practice-business/understanding-hintons-capsule-networks-part-iii-dynamic-routing-between-capsules-349f6d30418 (accessed on 15 March 2024).
- Xiang, C.; Zhang, L.; Tang, Y.; Zou, W.; Xu, C. MS-CapsNet: A novel multi-scale capsule network. IEEE Signal Process. Lett. 2018, 25, 1850–1854. [Google Scholar] [CrossRef]
- Rajasegaran, J.; Jayasundara, V.; Jayasekara, S.; Jayasekara, H.; Seneviratne, S.; Rodrigo, R. DeepCaps: Going deeper with capsule networks. In Proceedings of the IEEE/CVF Conference on Computer Vision and Pattern Recognition (CVPR), Long Beach, CA, USA, 15–20 June 2019; pp. 10717–10725. [Google Scholar]
- Göçeri, E. Classification of Skin Cancer Using Adjustable and Fully Convolutional Capsule Layers. Biomed. Signal Process. Control 2023, 85, 104949. [Google Scholar] [CrossRef]
- Goceri, E. Capsule Neural Networks in Classification Of Skin Lesions. In Proceedings of the 15th International Conference on Computer Graphics, Visualization, Computer Vision and Image Processing (CGVCVIP 2021), the 7th International Conference on Connected Smart Cities (CSC 2021) and 6th International Conference on Big Data Analytics, Data Mining and Computational Intel, Online, 21–23 July 2021. [Google Scholar]
- Lan, Z.; Cai, S.; Zhu, J.; Xu, Y. A Novel Skin Cancer Assisted Diagnosis Method based on Capsule Networks with CBAM. TechRxiv 2023. [Google Scholar] [CrossRef]
- Boaro, J.M.; dos Santos PT, C.; Rocha, C.V.; Fontenele, T.; Júnior, G.B.; de Almeida, J.D.; de Paiva, A.C.; Rocha, S. Hybrid Capsule Network Architecture Estimation for Melanoma Detection. In Proceedings of the 2020 International Conference on Systems, Signals and Image Processing (IWSSIP), Niteroi, Brazil, 1–3 July 2020; pp. 93–98. [Google Scholar] [CrossRef]
- Cruz, M.V.; Namburu, A.; Chakkaravarthy, S.; Pittendreigh, M.; Satapathy, S.C. Skin Cancer Classification using Convolutional Capsule Network (CapsNet). J. Sci. Ind. Res. 2020, 79, 994–1001. [Google Scholar]
- Wilson, A.C.; Roelofs, R.; Stern, M.; Srebro, N.; Recht, B. The marginal value of adaptive gradient methods in machine learning. arXiv 2017, arXiv:1705.08292. [Google Scholar]
- Hardt, M.; Recht, B.; Singer, Y. Train faster, generalize better: Stability of stochastic gradient descent. In Proceedings of the 33rd International Conference on Machine Learning, New York, NY, USA, 19–24 June 2016; pp. 1225–1234. [Google Scholar]
- Behara, K.; Bhero, E.; Agee, J.T. Skin Lesion Synthesis and Classification Using an Improved DCGAN Classifier. Diagnostics 2023, 13, 2635. [Google Scholar] [CrossRef] [PubMed]
- Tschandl, P.; Rosendahl, C.; Kittler, H. The HAM10000 dataset, a large collection of multi-sources dermatoscopic images of common pigmented skin lesions. Sci. Data 2018, 5, 180161. [Google Scholar] [CrossRef] [PubMed]
- Alsahafi, Y.S.; Kassem, M.A.; Hosny, K.M. Skin-Net: A novel deep residual network for skin lesions classification using multilevel feature extraction and cross-channel correlation with detection of outlier. J. Big Data 2023, 10, 105. [Google Scholar] [CrossRef]
- Pérez-Perdomo, E.; Ventura, S. An ensemble-based Convolutional Neural Network model powered by a genetic algorithm for melanoma diagnosis. Neural Comput. Appl. 2022, 34, 10429–10448. [Google Scholar] [CrossRef]


| Ref. | Objective | Methods/Techniques | Research Gap |
|---|---|---|---|
| [45] | Deep learning-based skin cancer detection using dermoscopy images. | Deep neural network algorithms such as faster R-CNN and fuzzy k-means clustering (FKM) | When employing FKM, the boundaries between distinct areas in the skin lesion images cannot always be clear and precise. |
| [46] | Techniques for detecting skin cancer that categorize the disease as benign, malignant, or normal. | Fuzzy C-means clustering (FCM), rider optimization algorithm (ROA) | FCM clustering faces challenges in complex or textured images, leading to weak convergence and local minima issues, impacting image segmentation quality. |
| [47] | To categorize dermoscopy images into benign or malignant lesions. | CNN, support vector machines (SVMs) | The proposed system does not emphasize preprocessing. Thus, it affects input image accuracy. |
| [48] | To improve dermoscopy image learning and skin cancer diagnosis training. | DNN, DL models | DNNs require a lot of labeled data for training, making it hard to find and annotate diverse and accurate skin lesion images, especially for rare or specialized malignancies. |
| [49] | Deep learning-based melanoma classification. | CNN, super-resolution generative adversarial networks (SRGANs) | CNN may make decision-making and learning features challenging to interpret. The final prediction is complex, with more extracted features. |
| [50] | Skin cancer detection using ML and image processing | Image super-resolution (ISR) algorithms | ISR image artifacts can affect skin cancer detection. Abnormalities lead to generating diagnostic false positives and negatives. |
| [51] | Teaching–learning-based optimization for detecting skin cancer. | TLBO algorithm, extreme learning machine (ELM) | The suggested technique requires a lot of computing power to handle large skin cancer imaging datasets, limiting its practical uses. |
| [52] | An explainable CNN-based method for early melanoma skin cancer detection. | CNN-based stacked ensemble architecture | Stacking ensemble frameworks with many models, such as CNNs, can create a complex architecture. Complexity needs more extended training and more resources. |
| [53] | Detecting skin cancer using transfer learning | MobileNetV2 | Due to its low capabilities, MobileNetV2 can have difficulty with complex skin diseases that demand fine-grained characteristics. |
| [54] | Deep learning-based skin cancer detection and categorization. | Swallow swarm optimization (SSO), DLCAL-SLDC method, CAD model | When CAD systems overlook carcinogenic lesions and misclassify benign lesions as malignant, false positives and negatives occur. Errors cause needless biopsies or missed diagnoses. |
| [55] | DL-based skin cancer classifier for imbalanced datasets. | Modeling based on deep learning RegNetY-320, InceptionV3, and AlexNet | Most of these parametric algorithms require uniform data, but without controlling their nature. Thus, these approaches cannot accurately diagnose the condition. |
| [56] | Network of capsules for skin cancer diagnosis | FixCaps, convolutional block attention module | FixCaps’s generalization performance has not been thoroughly investigated. |
| [57] | Detect skin cancer from food antioxidants via deep learning. | CNN, DL model | The suggested system for effective training considers features, classifications, and augmentations, which can overfit data. |
| [58] | A robust skin cancer detection system using transfer learning. | Optimizing particle swarms (PSO) with dynamic-opposite learning | Proper transfer learning depends on the quantity and quality of the target skin cancer dataset. Transfer learning fails if the dataset is too small or has noisy or biased samples. |
| [59] | DL approaches for detecting and categorizing skin cancer | CNN, medical vision transformer | Privacy considerations and the rarity of some skin cancers make obtaining datasets for skin cancer detection and expert annotations difficult. |
| [60] | DL model- based classification for skin cancer | CNN, EfficientNet-B0, ResNet-152, Vgg-16, Vgg-19, Inception-V3, and MobileNet | DSCC_Net model works only for light-skinned people. This study omitted dark-skinned people. |
| [61] | Convolutional neural network for cancer classification | CNN, Grad-CAM | Due to computational costs, access to strong GPUs or cloud computing resources is necessary to train optimized CNN designs. |
| [62] | Skin cancer classification via medical vision | Medical vision transformer (MVT), multilayer perceptron (MLP) | MLPs do not capture image spatial connections. Skin cancer diagnosis often requires spatial patterns and specific features. |
| [63] | Melanoma identification from dermoscopy images using DL | GrabCut-stacked convolutional neural networks (GC-SCNNs), SVM | GrabCut can encounter issues with complex backdrops or parts with similar color distributions to the target object. The algorithm cannot distinguish foreground from background in some cases. |
| [64] | Skin cancer detection model based on feature fusion | Local binary patterns (LBPs), LSTM | LSTM is commonly used for sequential data, including time series or natural language word sequences. This method can convert images into sequential representations, although it cannot be as efficient or precise as convolutional neural networks. |
| Class Assessment Metrics Using Randomly Sampled Datasets | ||||||
|---|---|---|---|---|---|---|
| Dataset | No. of Images | ImbR | IntraC | InterC | DistR | Silho |
| HAM10000 [92] | 7818 | 6.024 | 8705 | 9770 | 0.891 | 0.213 |
| ISIC 2020 [93] | 25,838 | 9.012 | 28,786 | 32,132 | 0.804 | 0.202 |
| PSNR (dB) | SSIM | MSE | Mean Absolute Difference | |
|---|---|---|---|---|
| Resized image | 33.52 | 0.97 | 0.0023 | 109.01 |
| Normalized image | 44.90 | 0.97 | 0.0023 | 0.0052 |
| Model | Accuracy (%) | Params Millions (M) | FLOPs Giga-Billions(G) |
|---|---|---|---|
| DE-ANN | 96.97 | 4.3 | 1.2 |
| ELM-TLBO | 96.21 | 4.3 | 1.2 |
| R-CNN | 97.63 | 1.2 | 1.2 |
| DCNN | 97.83 | 1.2 | 1.2 |
| Fuzzy K-means | 94.23 | 1.2 | 1.2 |
| LA-CapsNet | 98.04 | 1.2 | 0.36 |
| LA-CapsNet | Accuracy | Sensitivity | F1 Score | AUC | Specificity |
|---|---|---|---|---|---|
| With data augmentation | 98.04 | 98.82 | 98.87 | 99.00 | 68.00 |
| Without data augmentation | 78.00 | 81.04 | 78.84 | 78.02 | 55.20 |
| Performance Metric | DE-ANN | ELM-TLBO | R-CNN | DCNN | Fuzzy K-Means | LA-CapsNet |
|---|---|---|---|---|---|---|
| Accuracy | 96.97 | 96.21 | 97.63 | 97.83 | 94.23 | 98.04 |
| Sensitivity | 97.91 | 97.03 | 98.32 | 97.72 | 96.53 | 98.82 |
| F1 score | 97.01 | 85.00 | 98.42 | 90.00 | 96.07 | 98.87 |
| AUC | 97.21 | 89.00 | 95.00 | 97.92 | 95.43 | 99.00 |
| Specificity | 45.00 | 48.00 | 49.00 | 39.00 | 55.00 | 68.00 |
Disclaimer/Publisher’s Note: The statements, opinions and data contained in all publications are solely those of the individual author(s) and contributor(s) and not of MDPI and/or the editor(s). MDPI and/or the editor(s) disclaim responsibility for any injury to people or property resulting from any ideas, methods, instructions or products referred to in the content. |
© 2024 by the authors. Licensee MDPI, Basel, Switzerland. This article is an open access article distributed under the terms and conditions of the Creative Commons Attribution (CC BY) license (https://creativecommons.org/licenses/by/4.0/).
Share and Cite
Behara, K.; Bhero, E.; Agee, J.T. An Improved Skin Lesion Classification Using a Hybrid Approach with Active Contour Snake Model and Lightweight Attention-Guided Capsule Networks. Diagnostics 2024, 14, 636. https://doi.org/10.3390/diagnostics14060636
Behara K, Bhero E, Agee JT. An Improved Skin Lesion Classification Using a Hybrid Approach with Active Contour Snake Model and Lightweight Attention-Guided Capsule Networks. Diagnostics. 2024; 14(6):636. https://doi.org/10.3390/diagnostics14060636
Chicago/Turabian StyleBehara, Kavita, Ernest Bhero, and John Terhile Agee. 2024. "An Improved Skin Lesion Classification Using a Hybrid Approach with Active Contour Snake Model and Lightweight Attention-Guided Capsule Networks" Diagnostics 14, no. 6: 636. https://doi.org/10.3390/diagnostics14060636