
The Doppler Perfusion Index of the Liver and the Underlying Duplex Sonography of Visceral Vessels—A Systematic and Comprehensive Evaluation of Reproducibility


 ,
,
Abstract
1. Introduction
2. Materials and Methods
2.1. Operators
2.2. Subjects
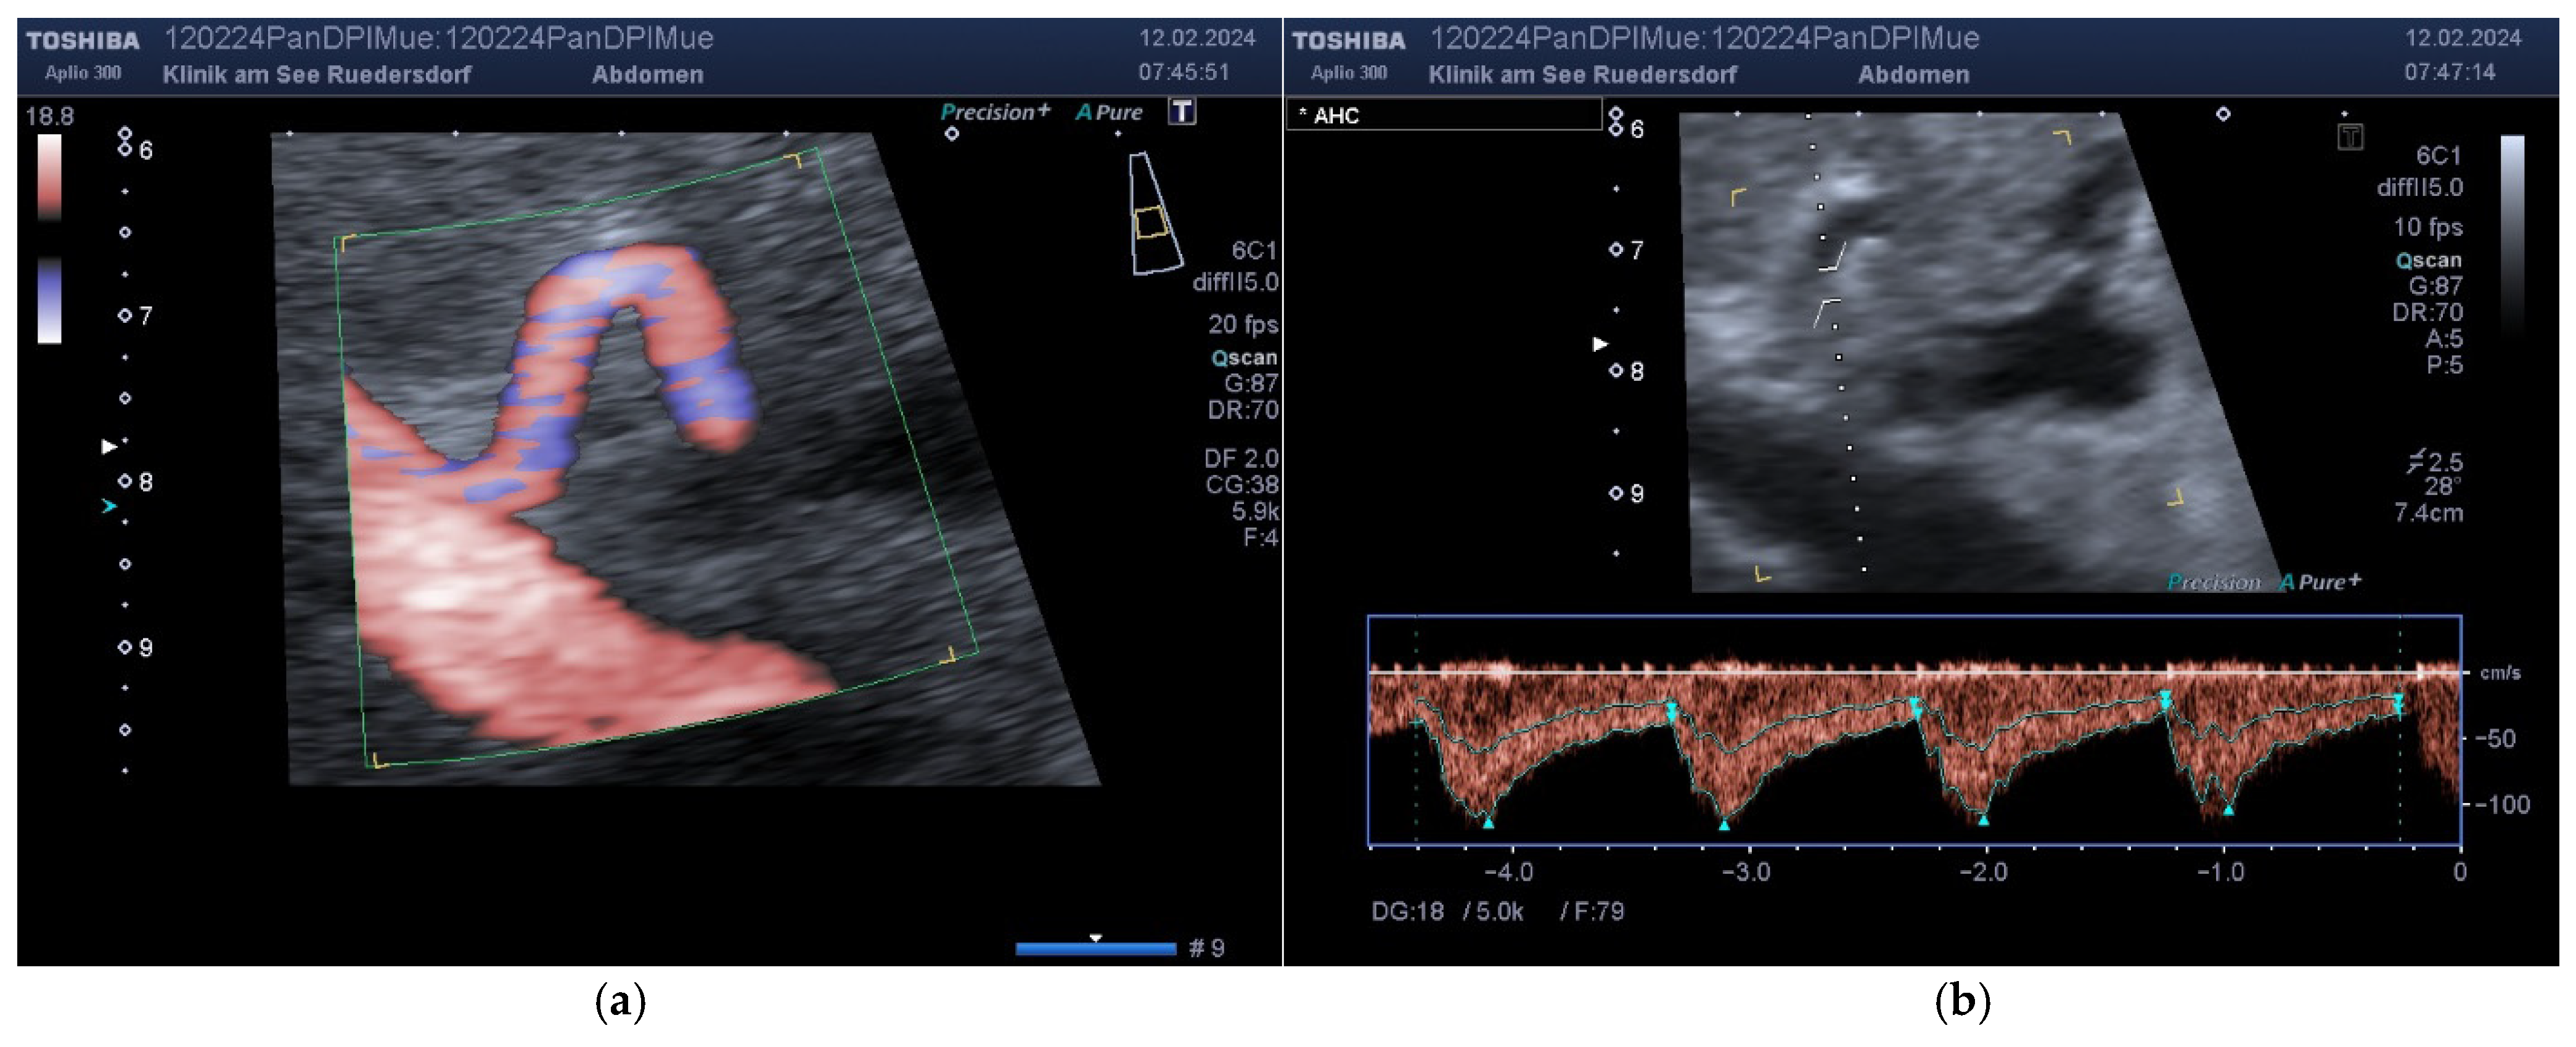
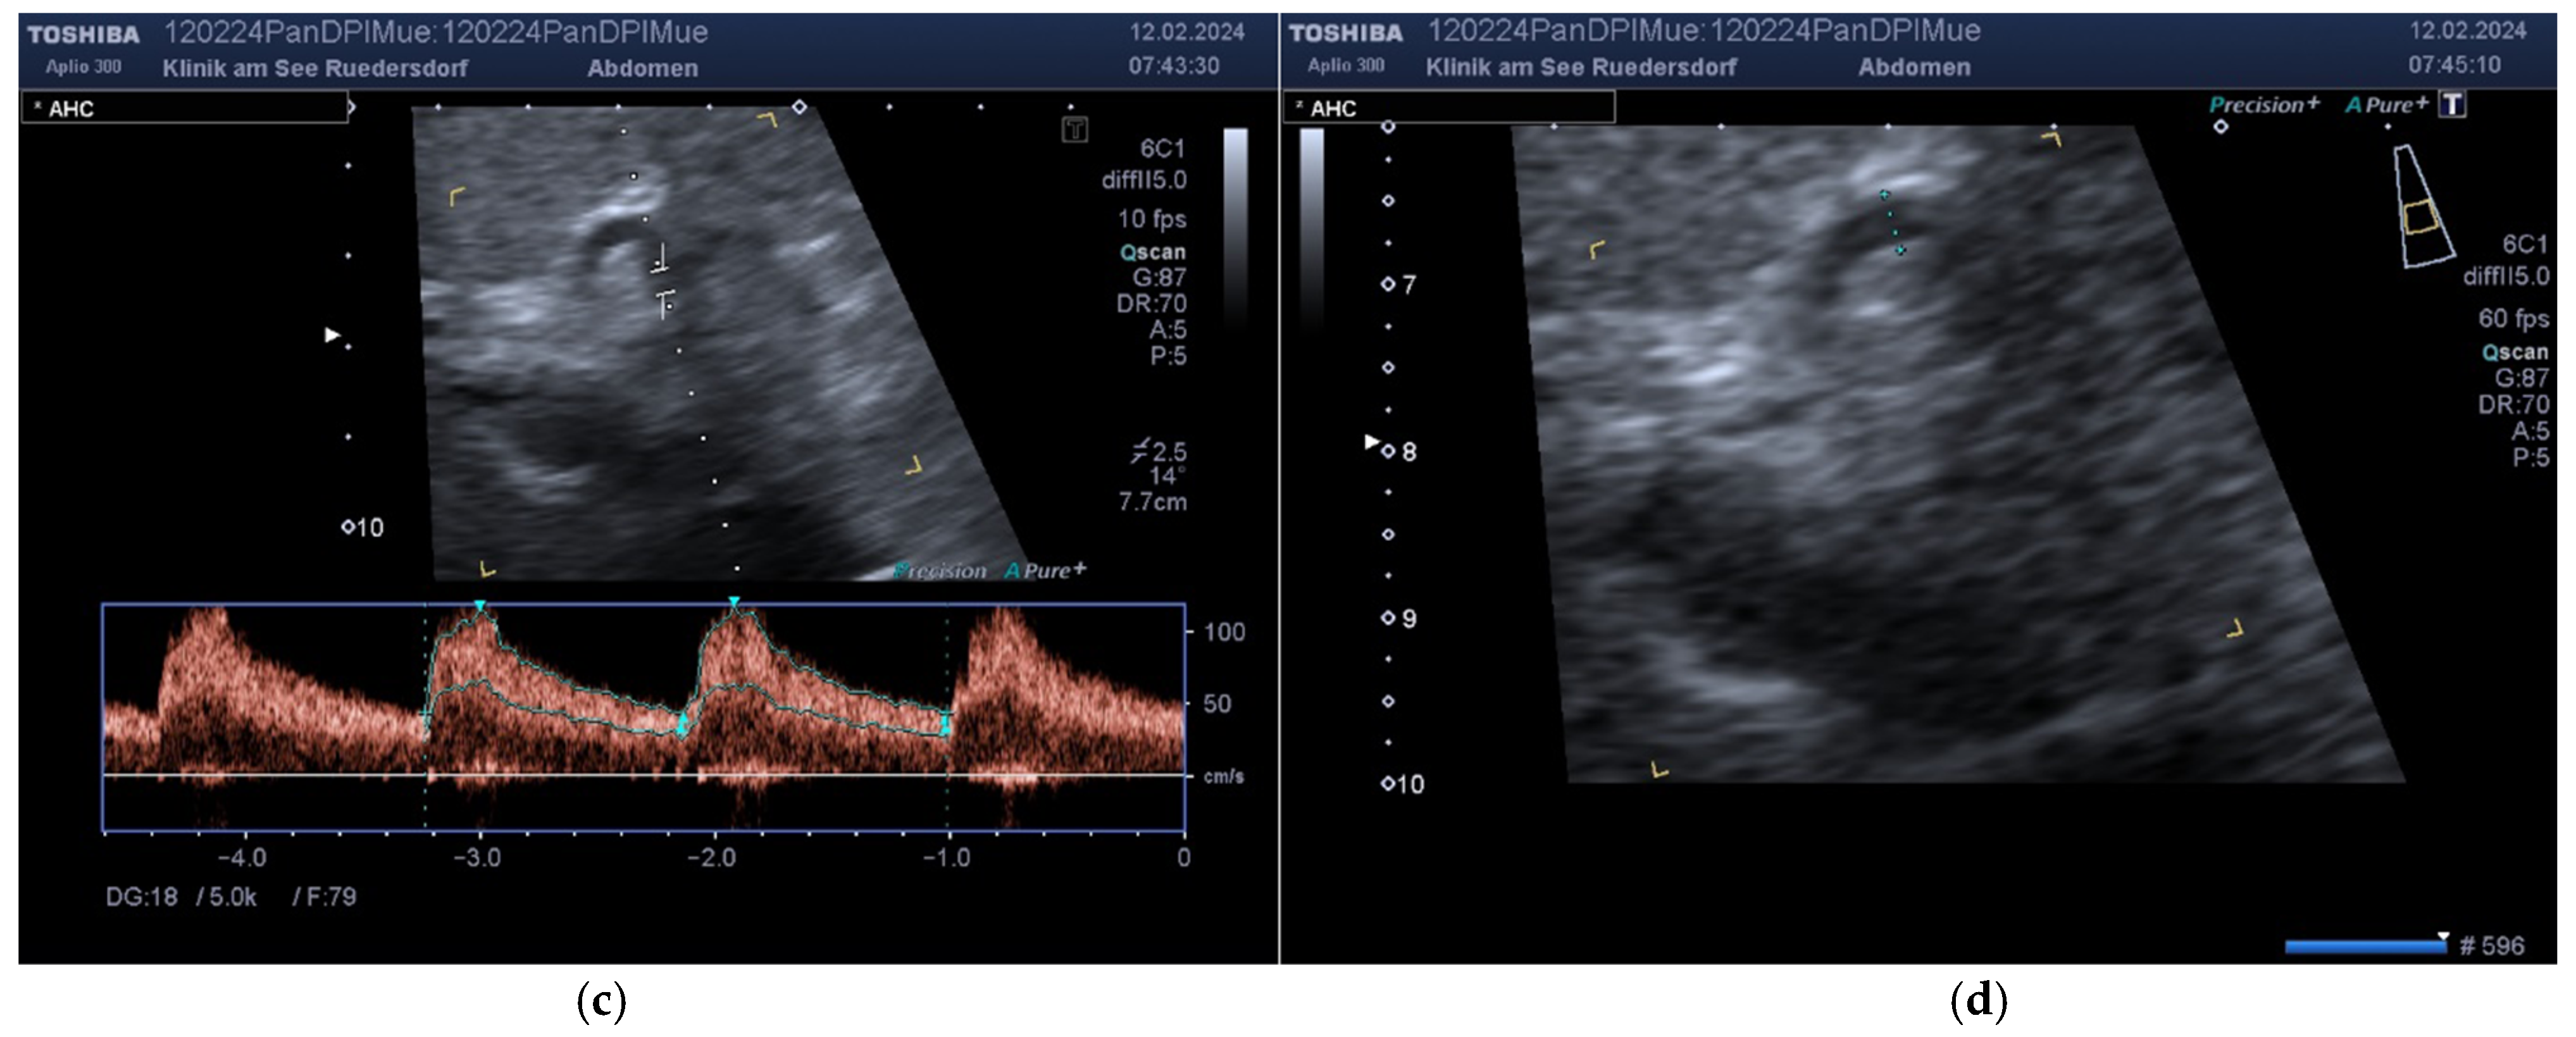
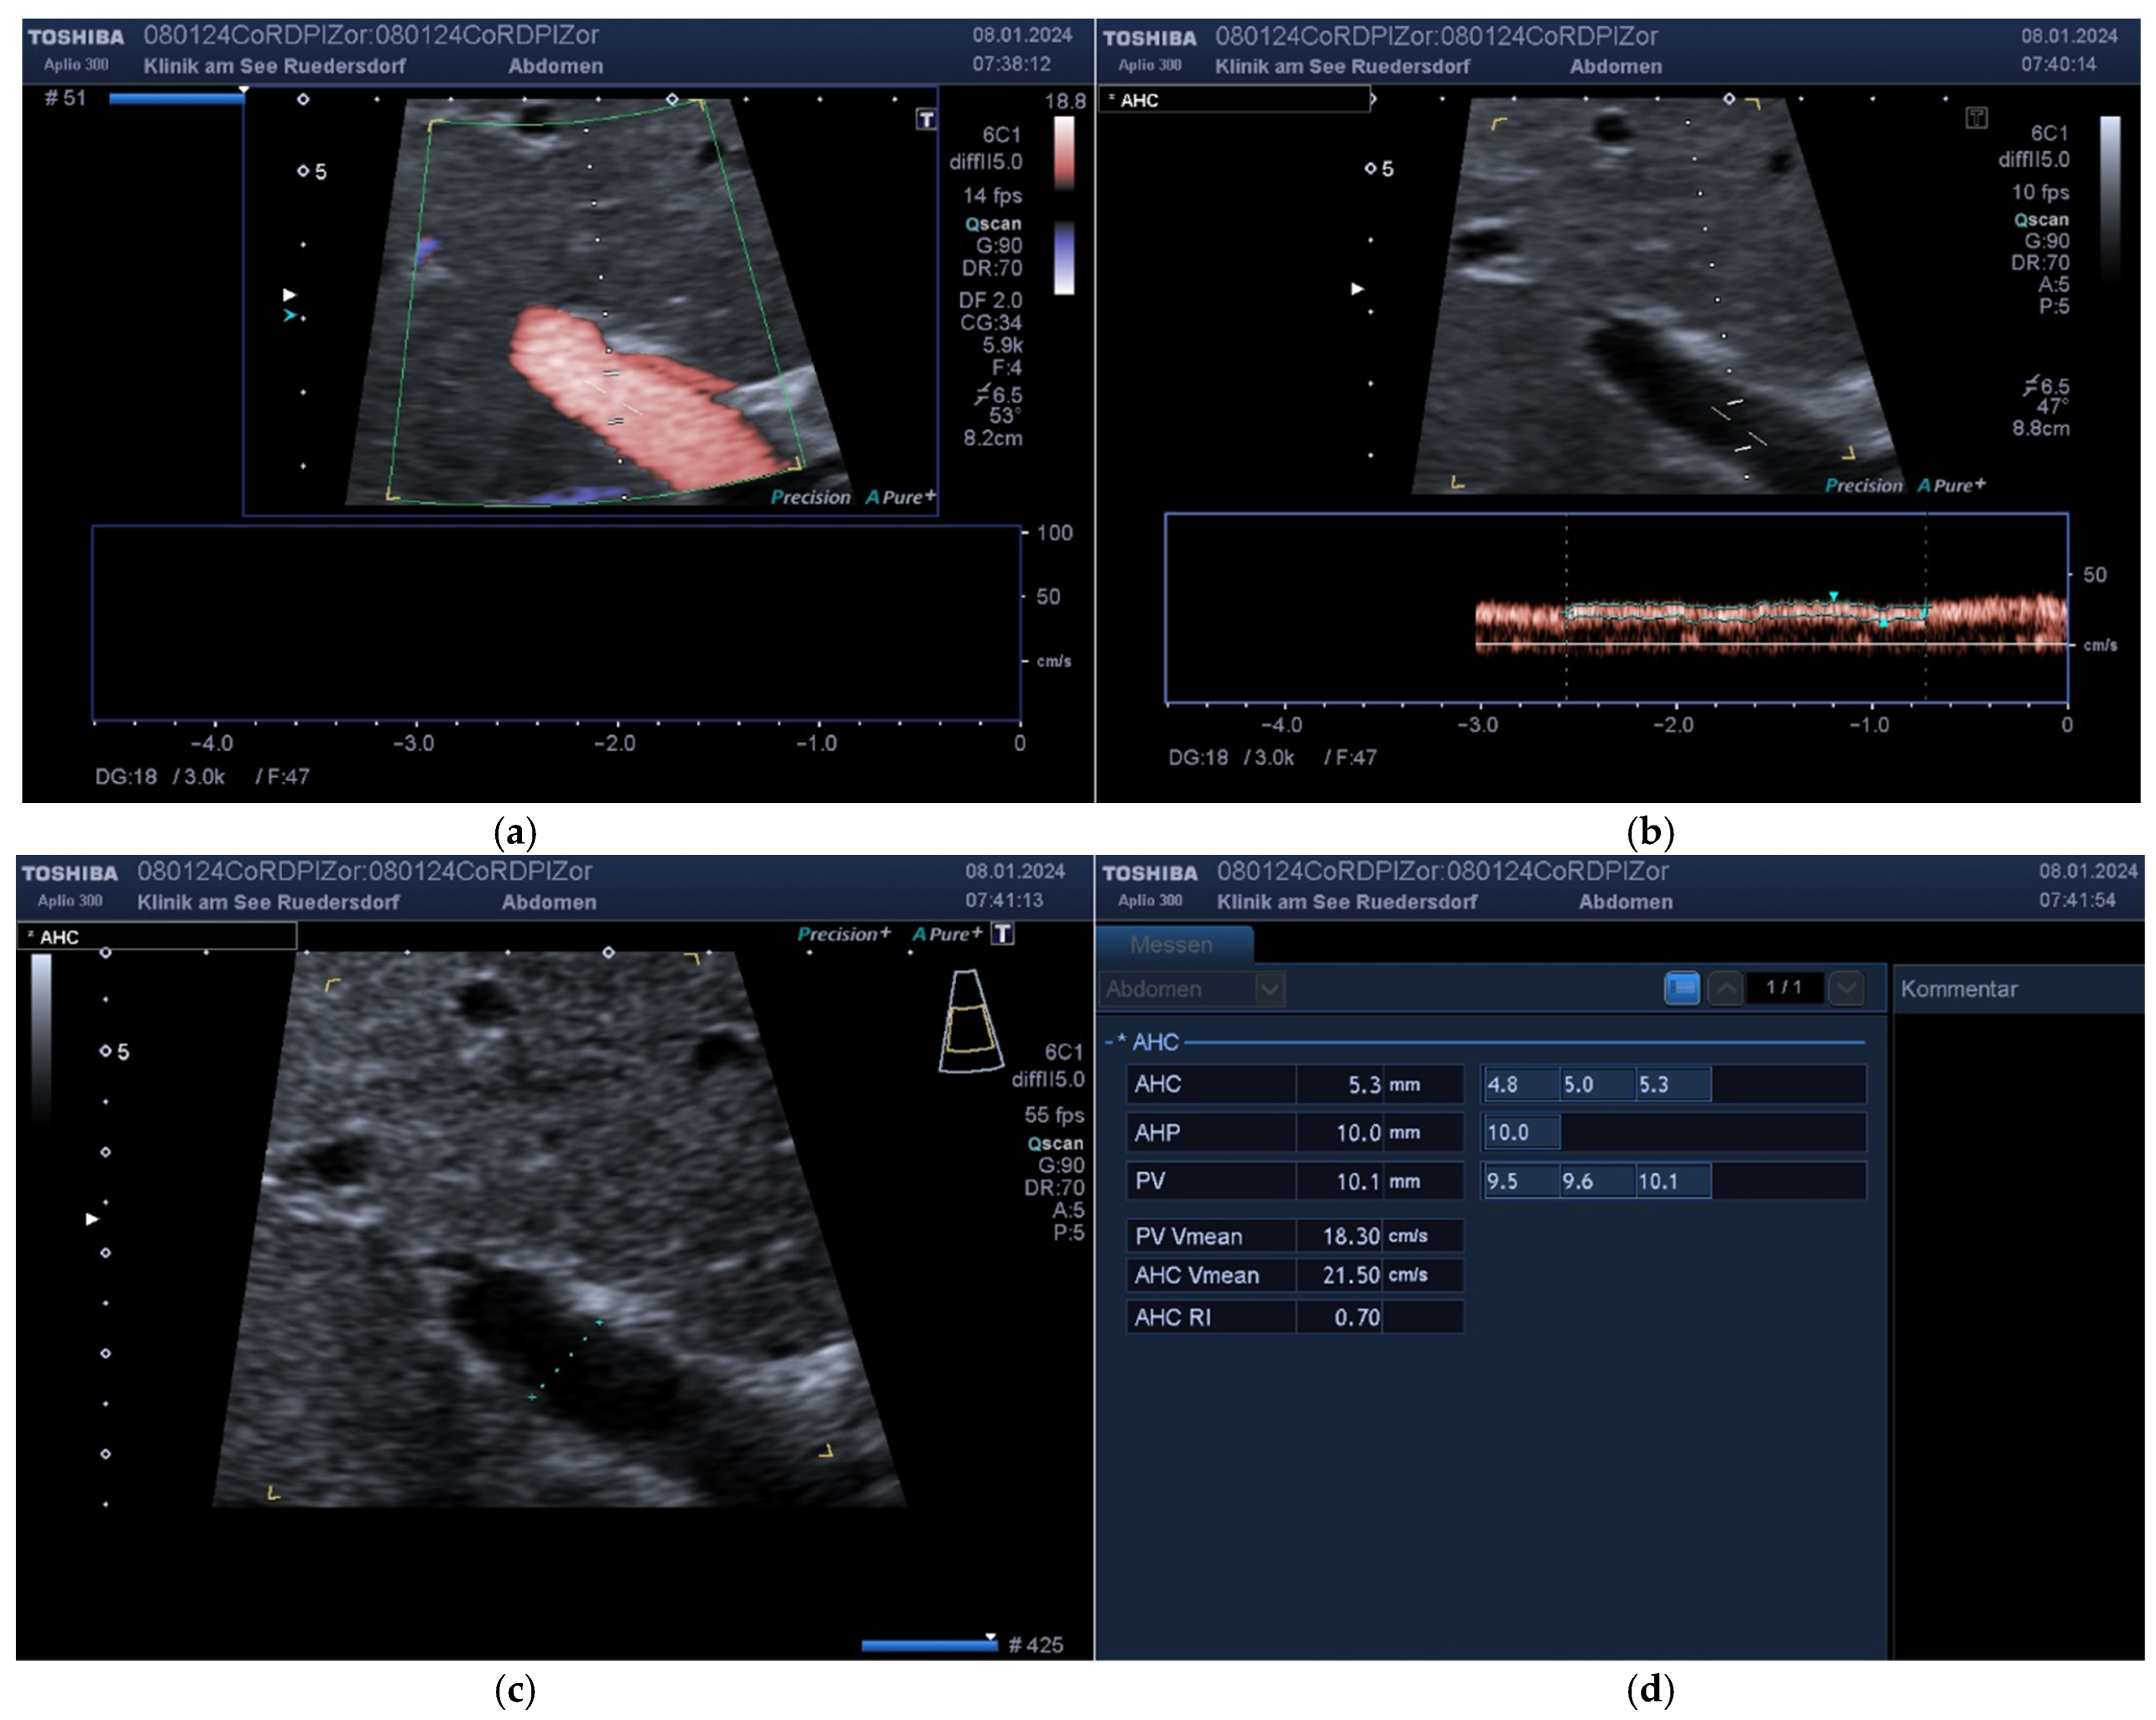
2.3. Investigation Procedure
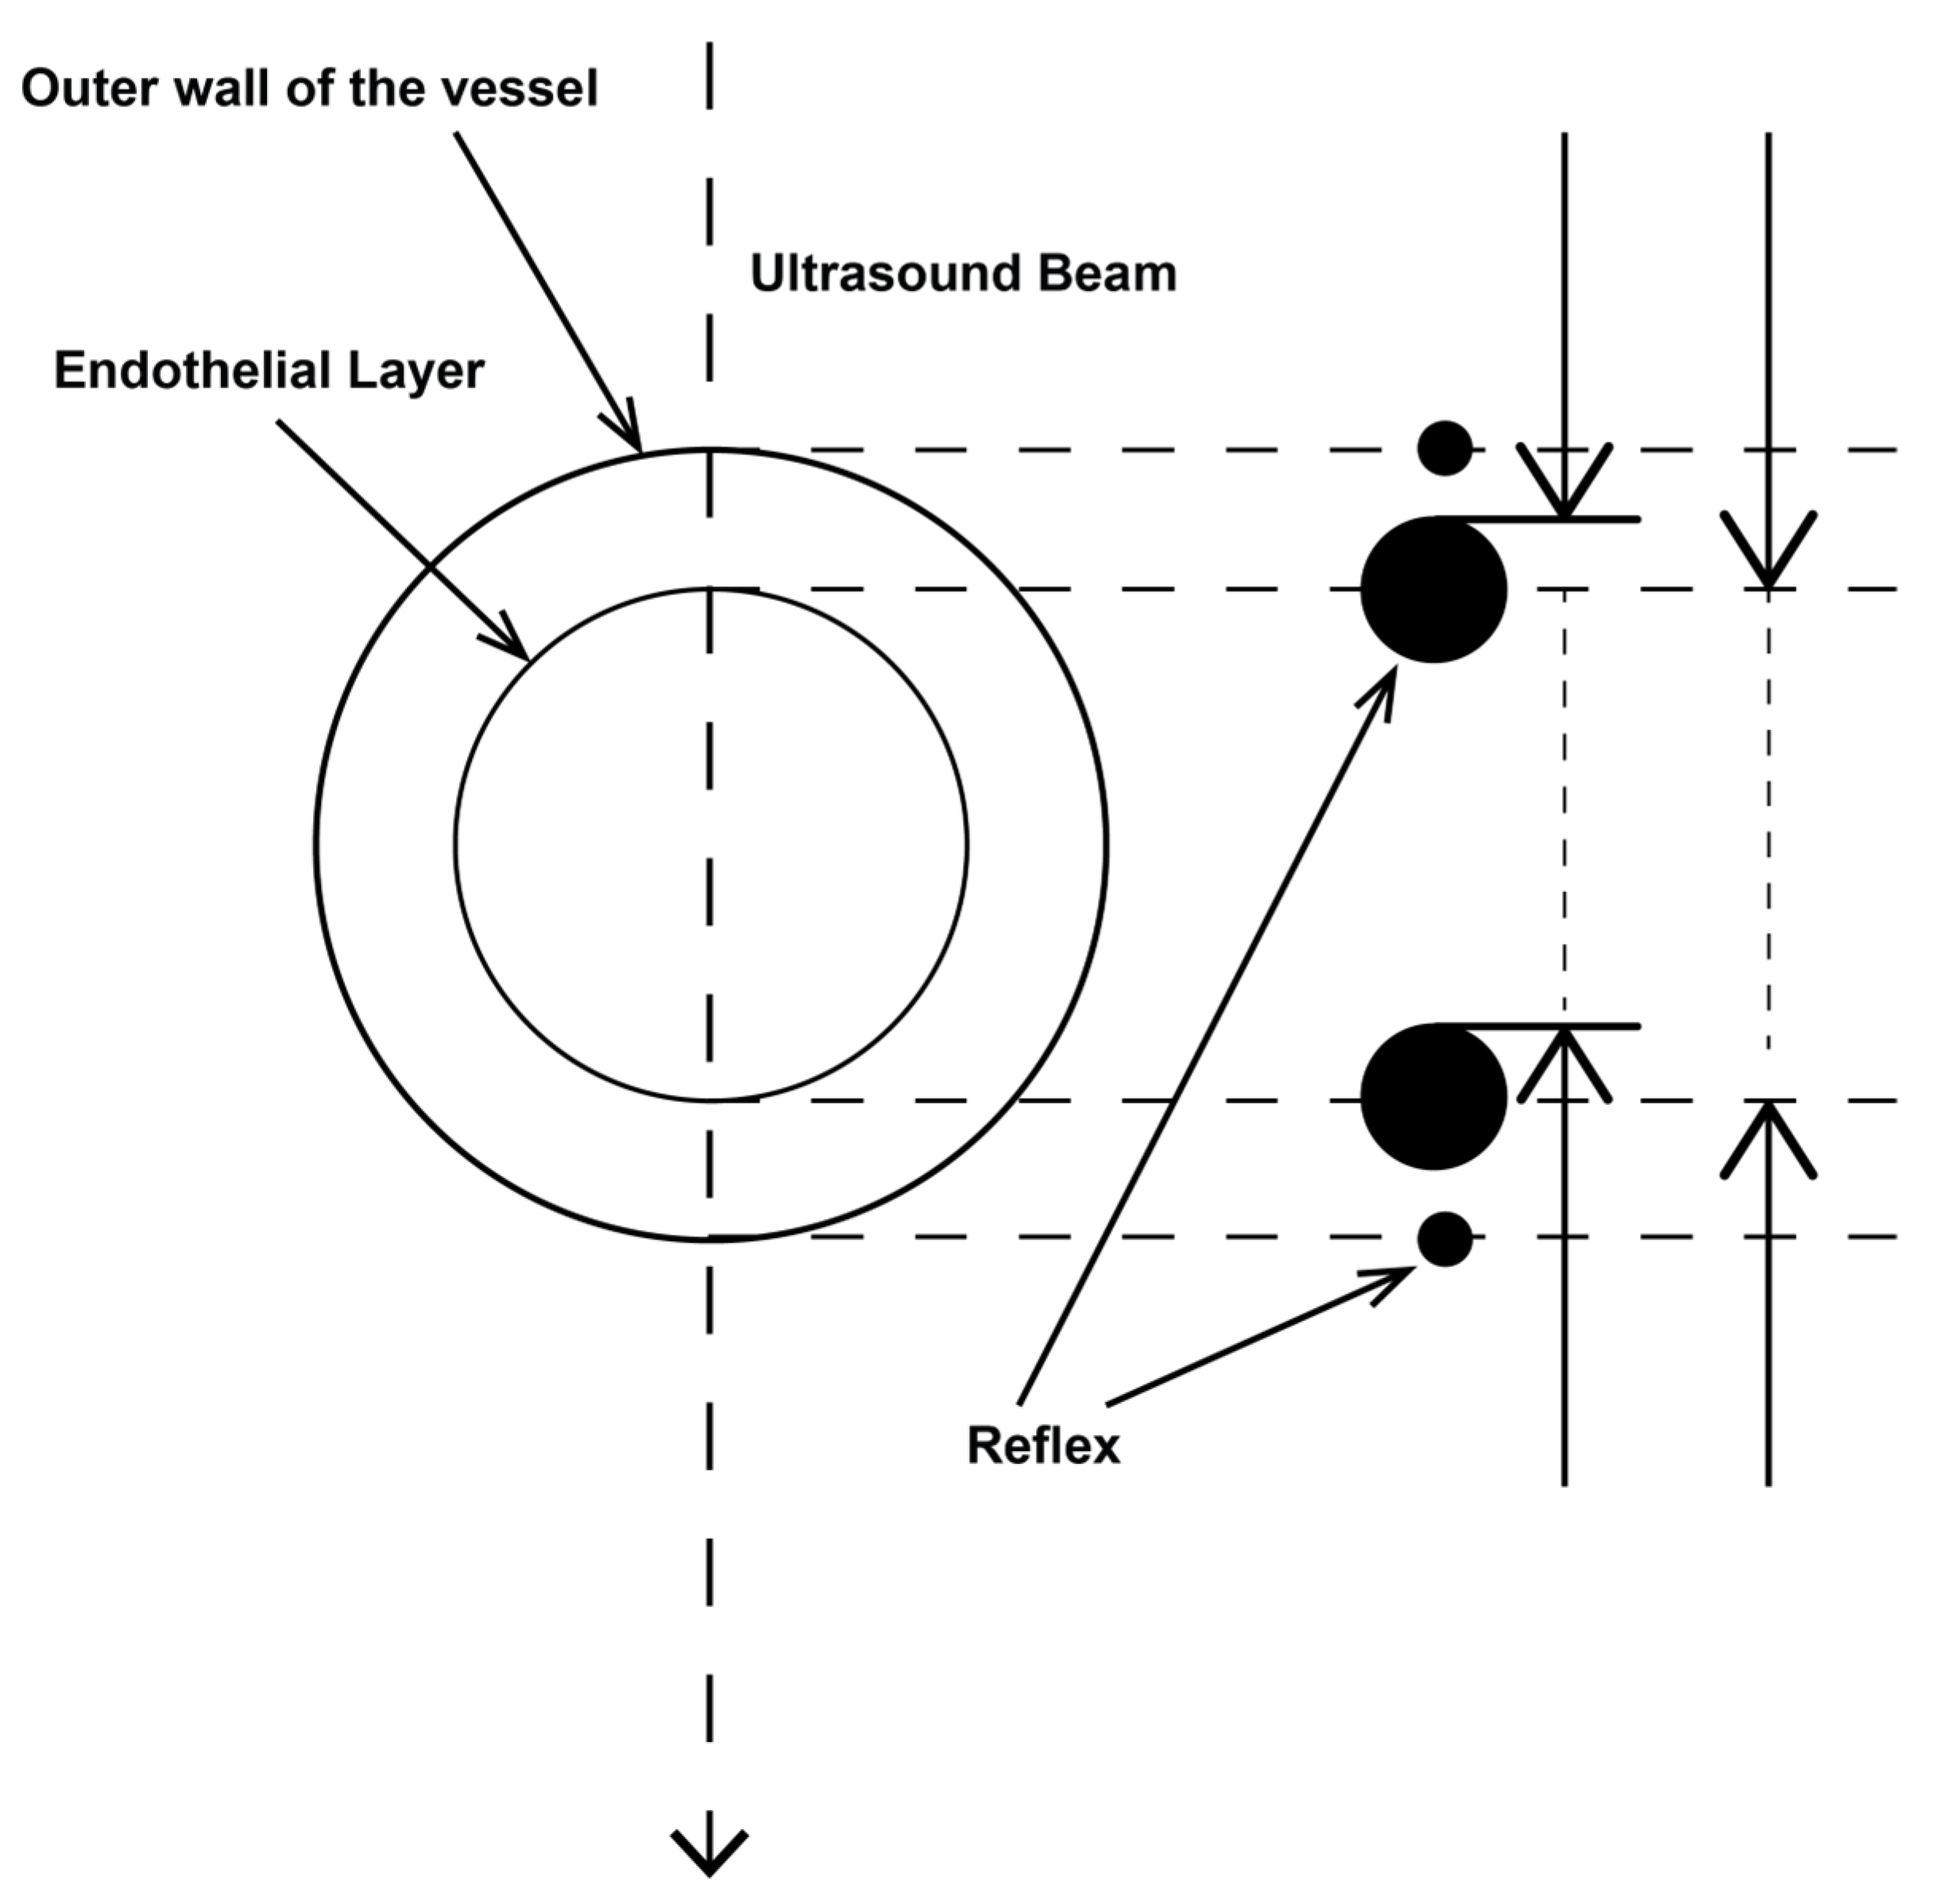
2.3.1. Determination of Vessel Diameter
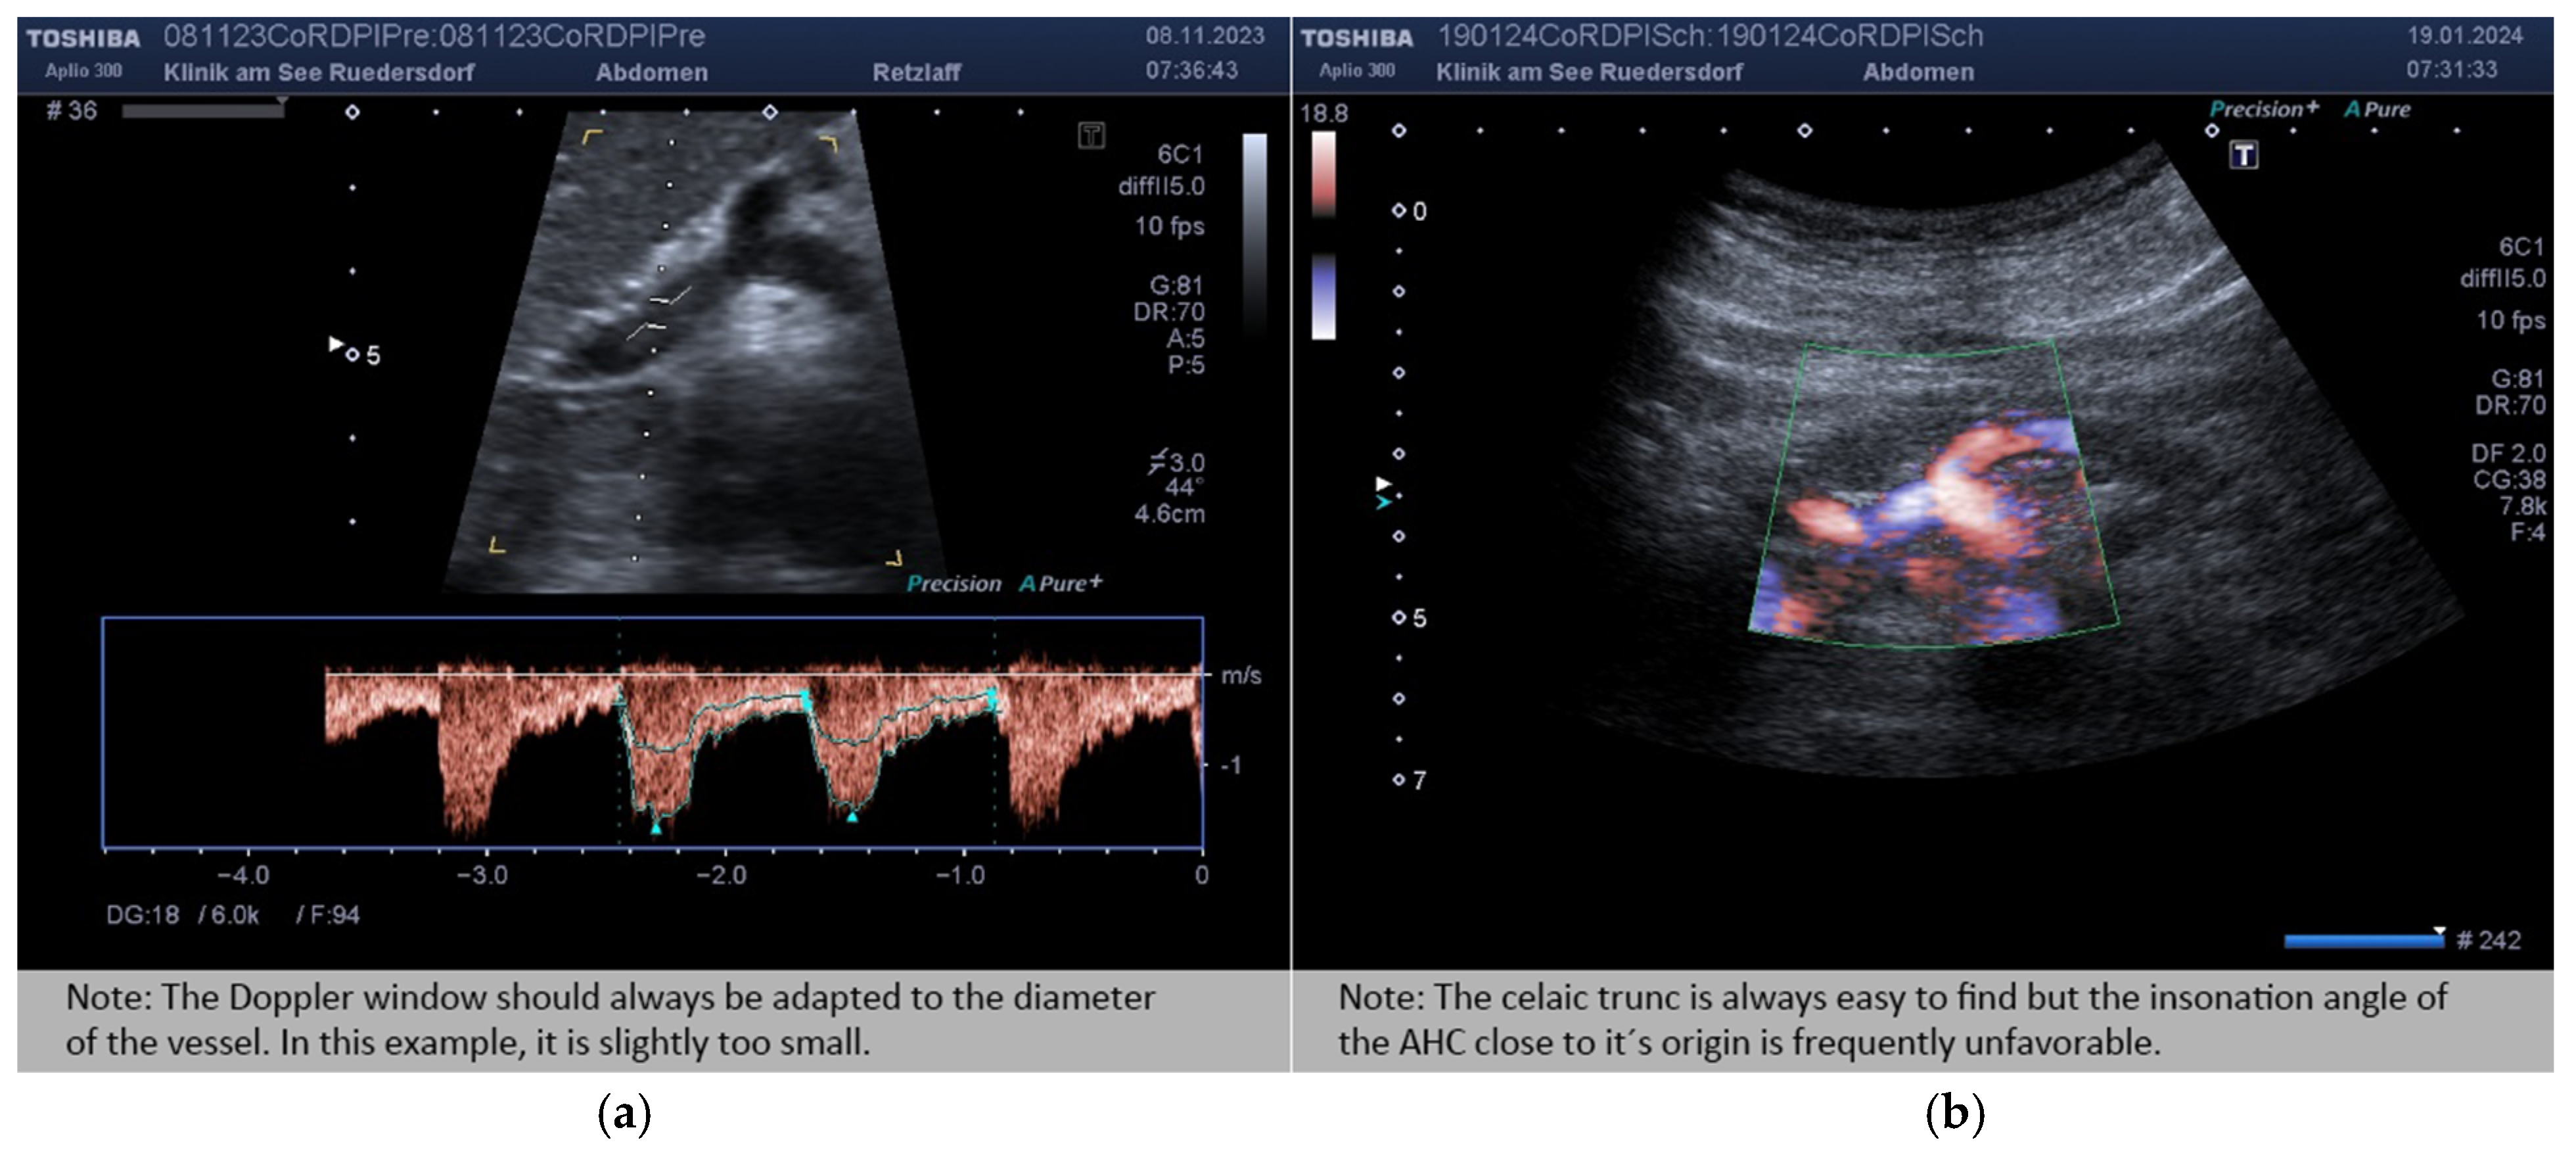
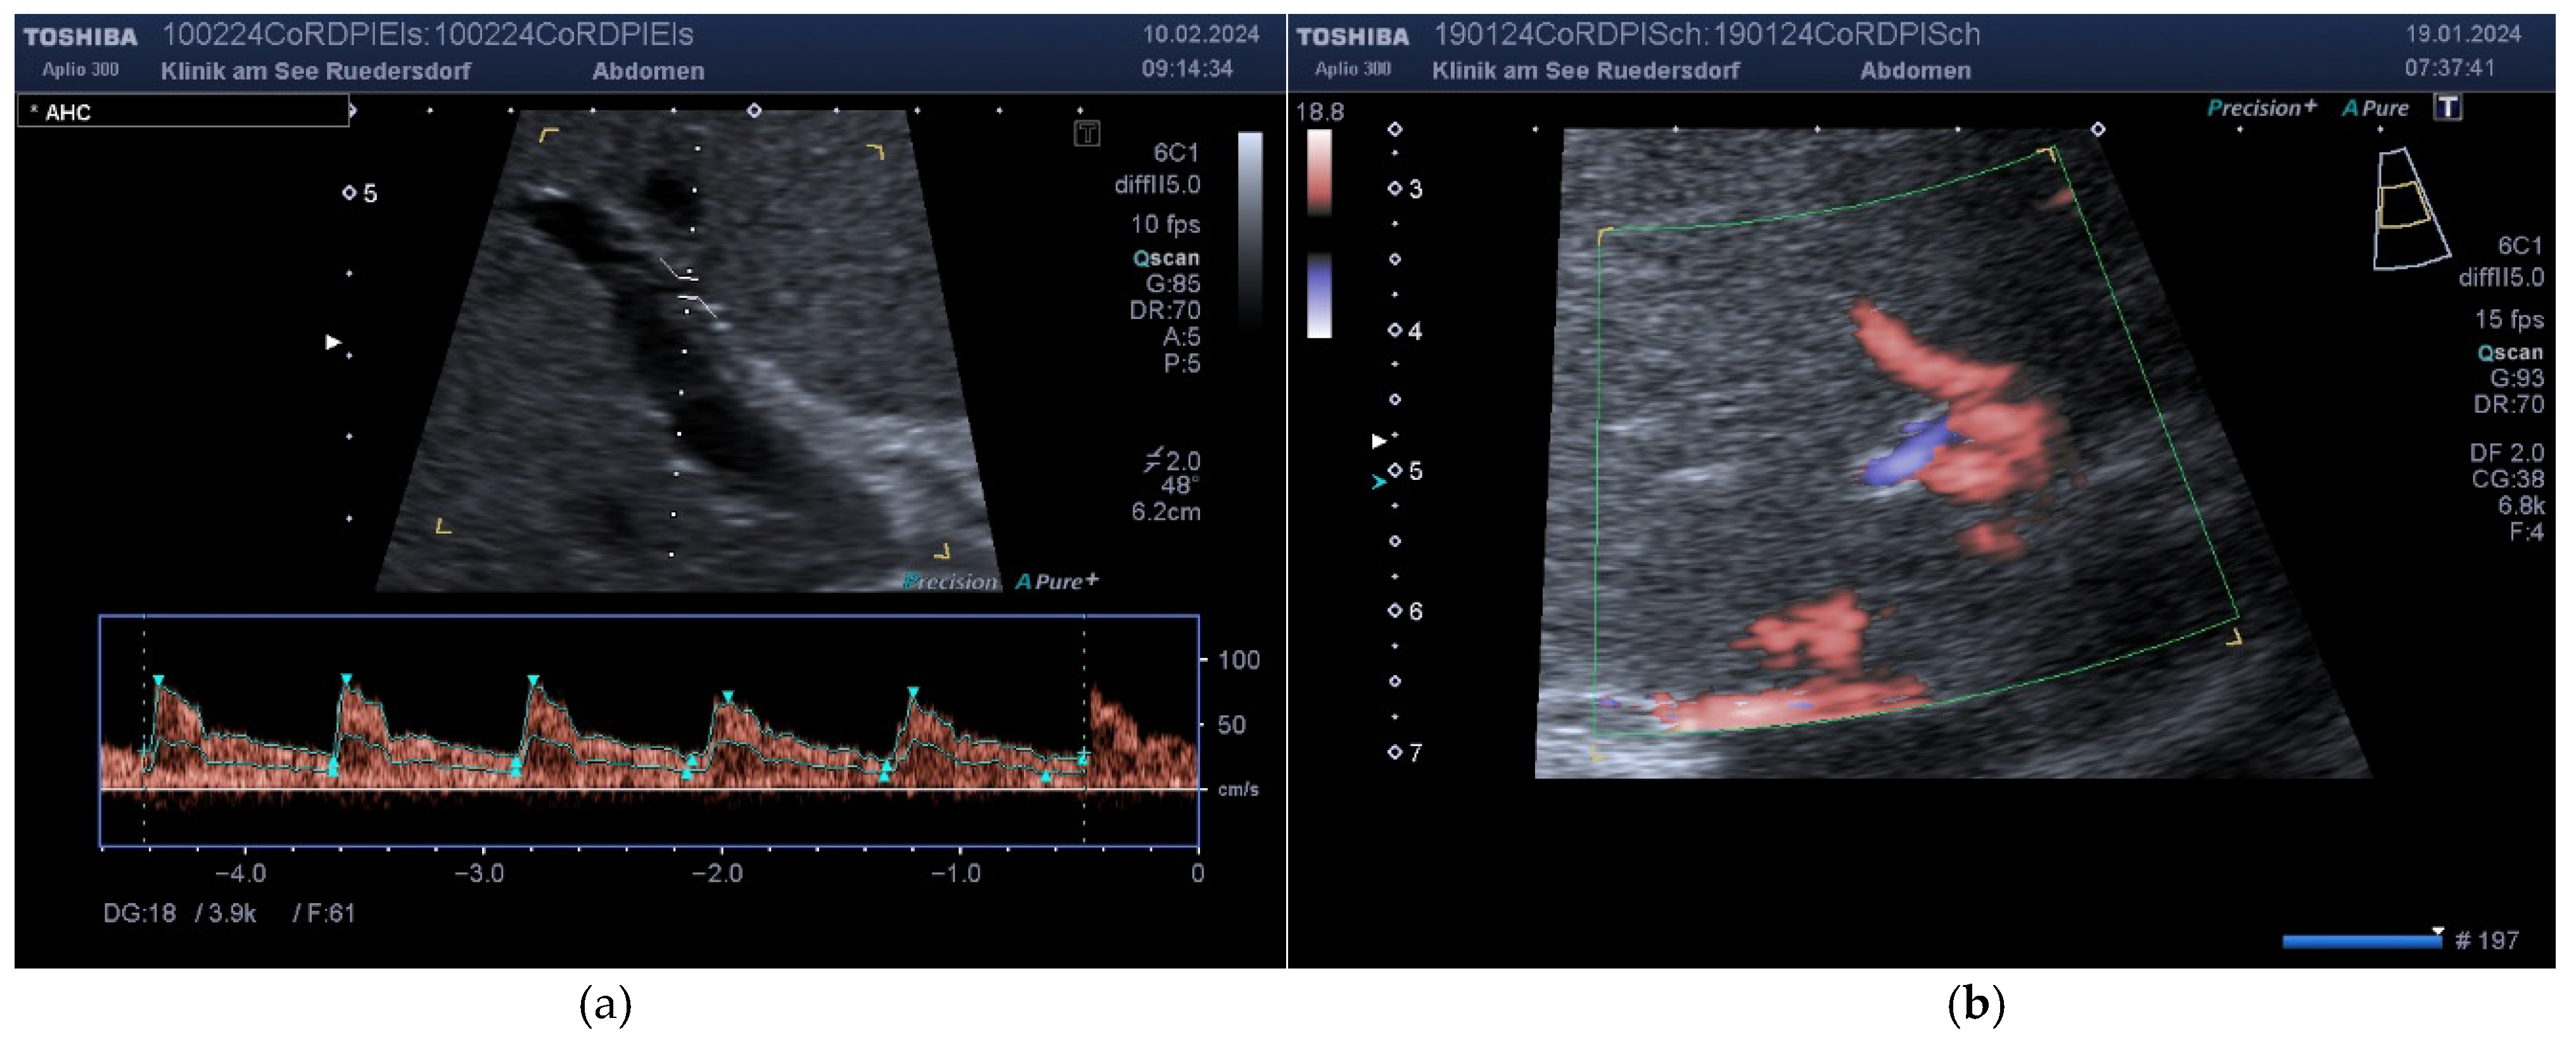
2.3.2. Location of the Probe, Insonation Angle, and Doppler Window
2.4. Variables Acquired and Calculation of Blood Flows and DPI
- -
- The vessel diameter (d, mm);
- -
- The insonation angle (θ, degrees);
- -
- The Doppler shift (V, cm/s);
- -
- The resistive index for AHC and AHP (RI, non-dimensional).
2.5. Statistics
- (a)
- Test for normal distribution;
- (b)
- Test for differences in means between the two operators (systematic bias) using the exact Wilcoxon test for paired samples;
- (c)
- Test for equality of variances between the two observers (Levene test) (if there is high correlation, mean, and variance equivalence, there is a high absolute agreement);
- (d)
- Calculation of Pearson’s correlation coefficient between the measurements of both operators;
- (e)
- Calculation of the intraclass correlation coefficients under the assumption that the absolute agreement is tested; the raters were selected as two raters from the population of all potential raters, and the patients are random (two-way random model). The ICC for single measurement is reported;
- (f)
- Calculation of the mean coefficient of variation (MVC) across all patients (the standard deviation of both measurements per patient divided by the mean of both measurements).
3. Results
3.1. Descriptive Data and Indices
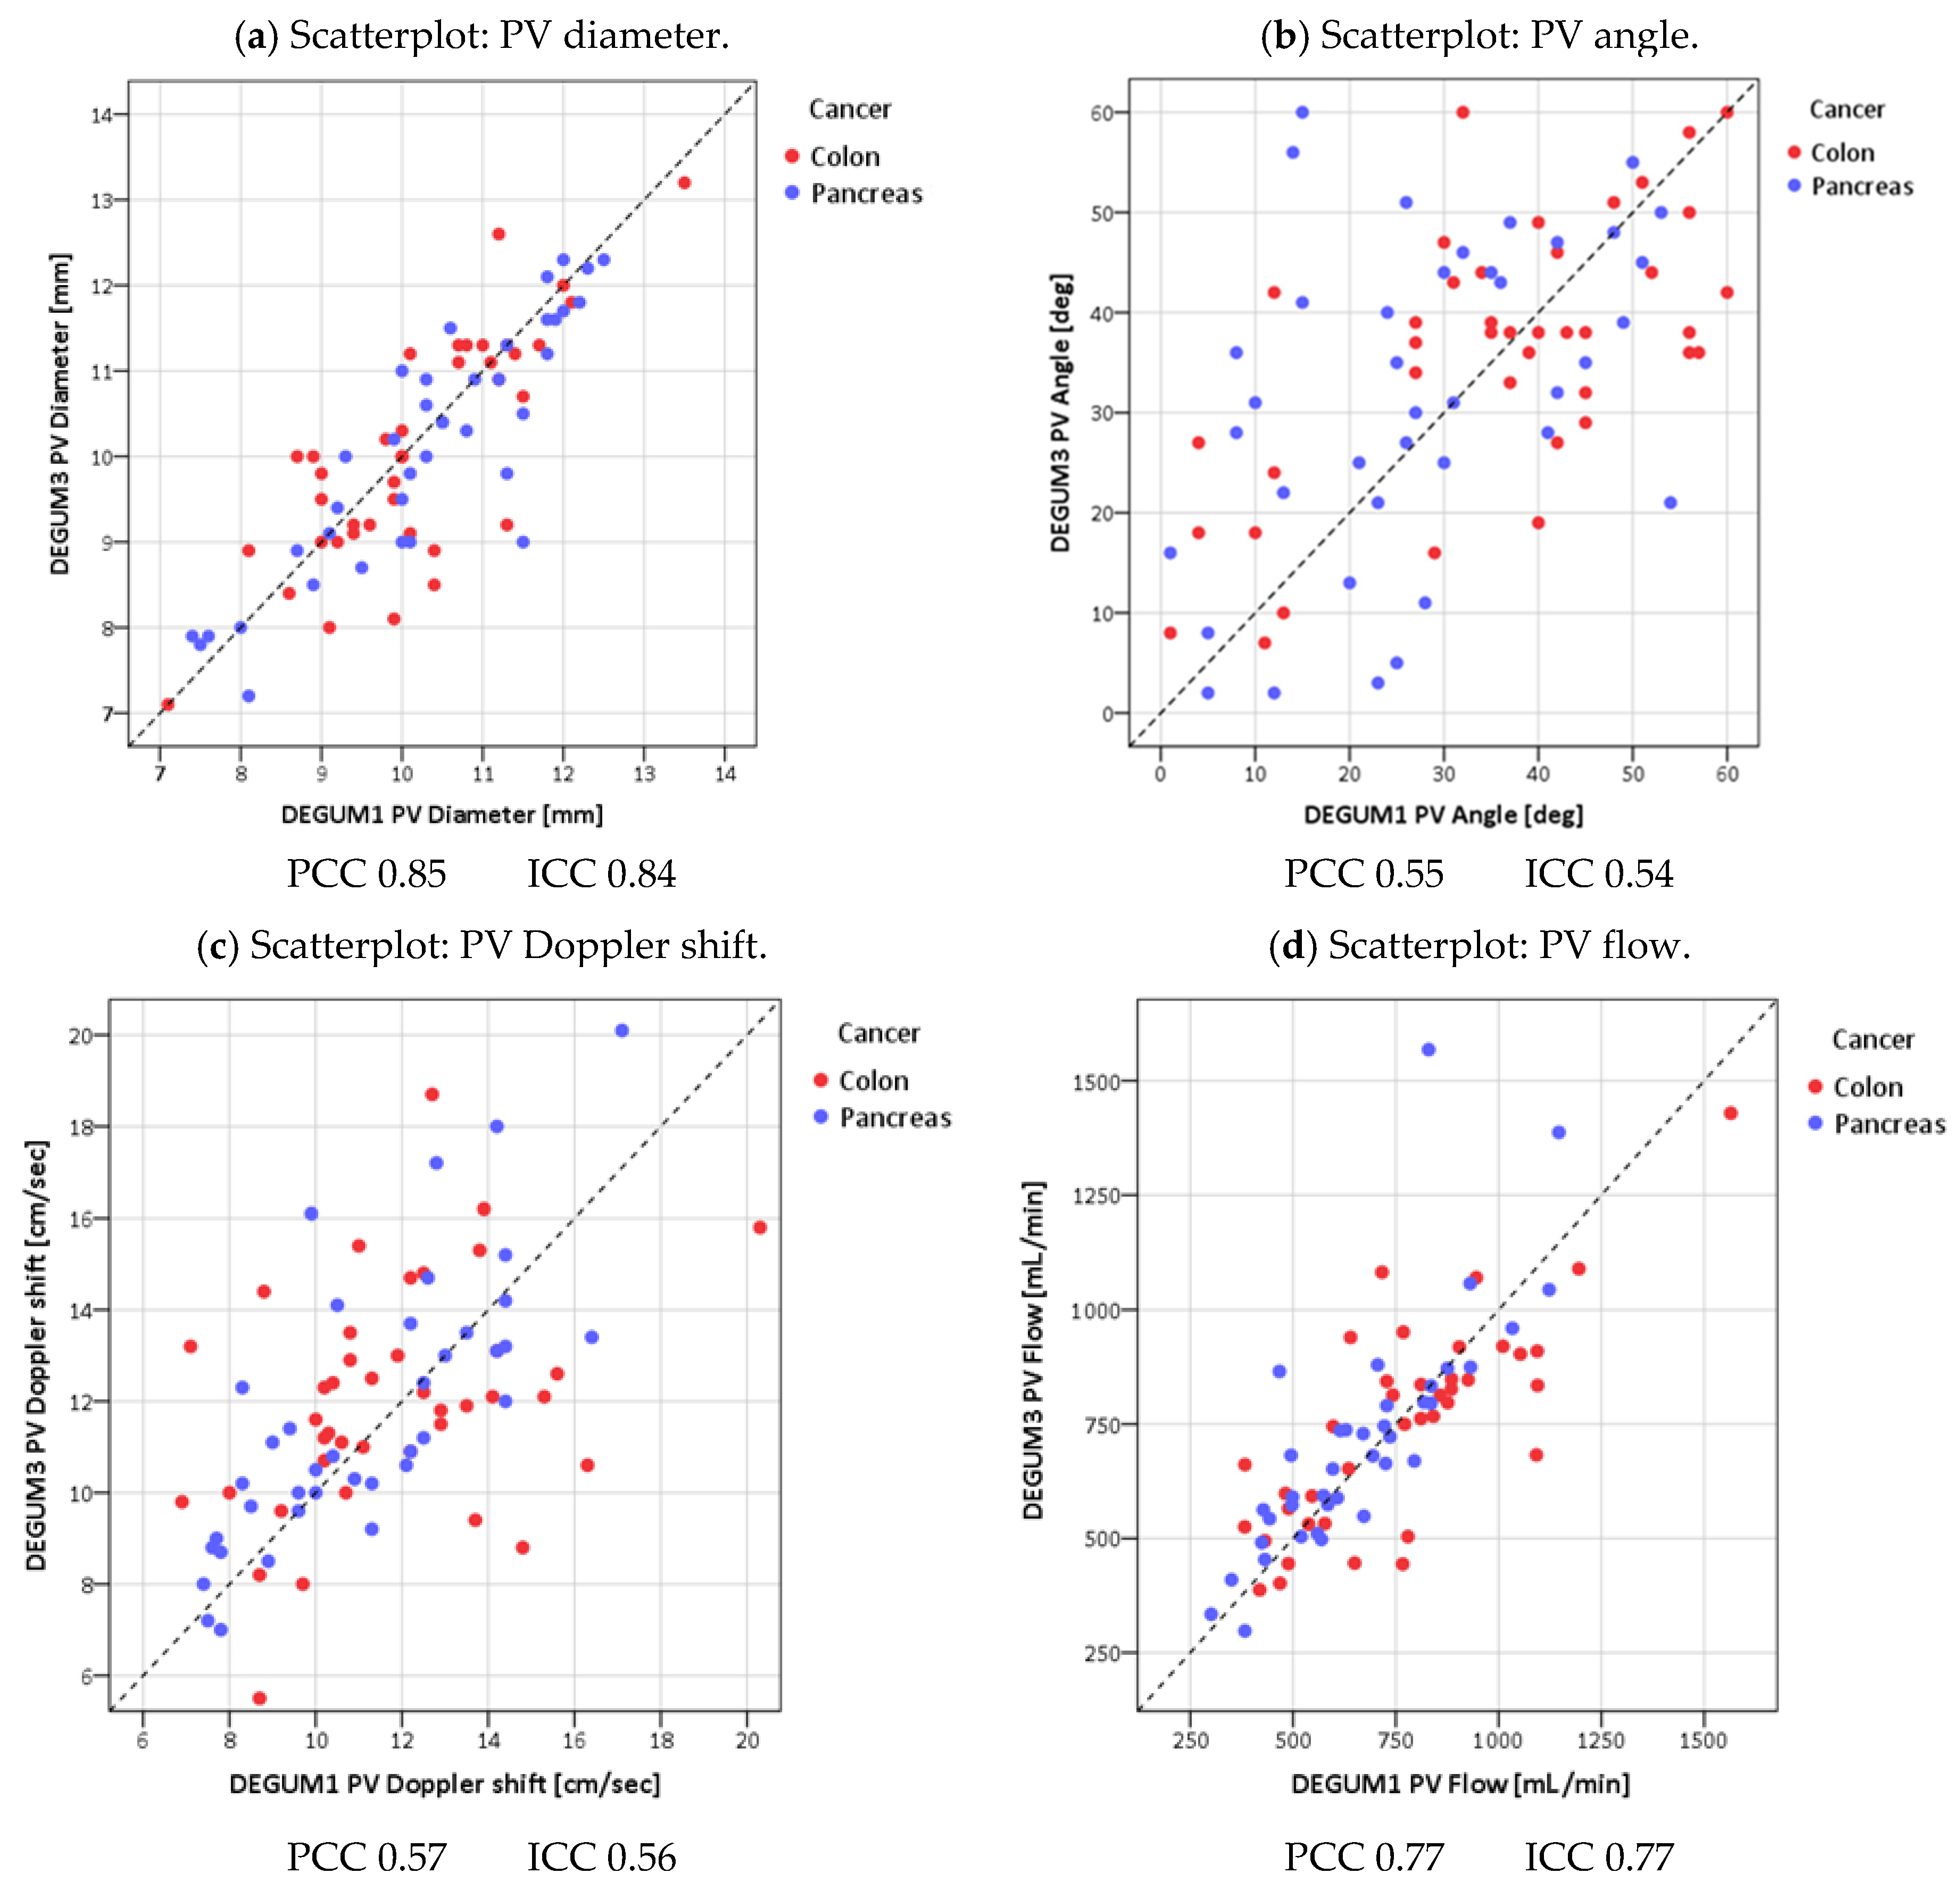
3.2. Measured Values and Calculated Blood Flow
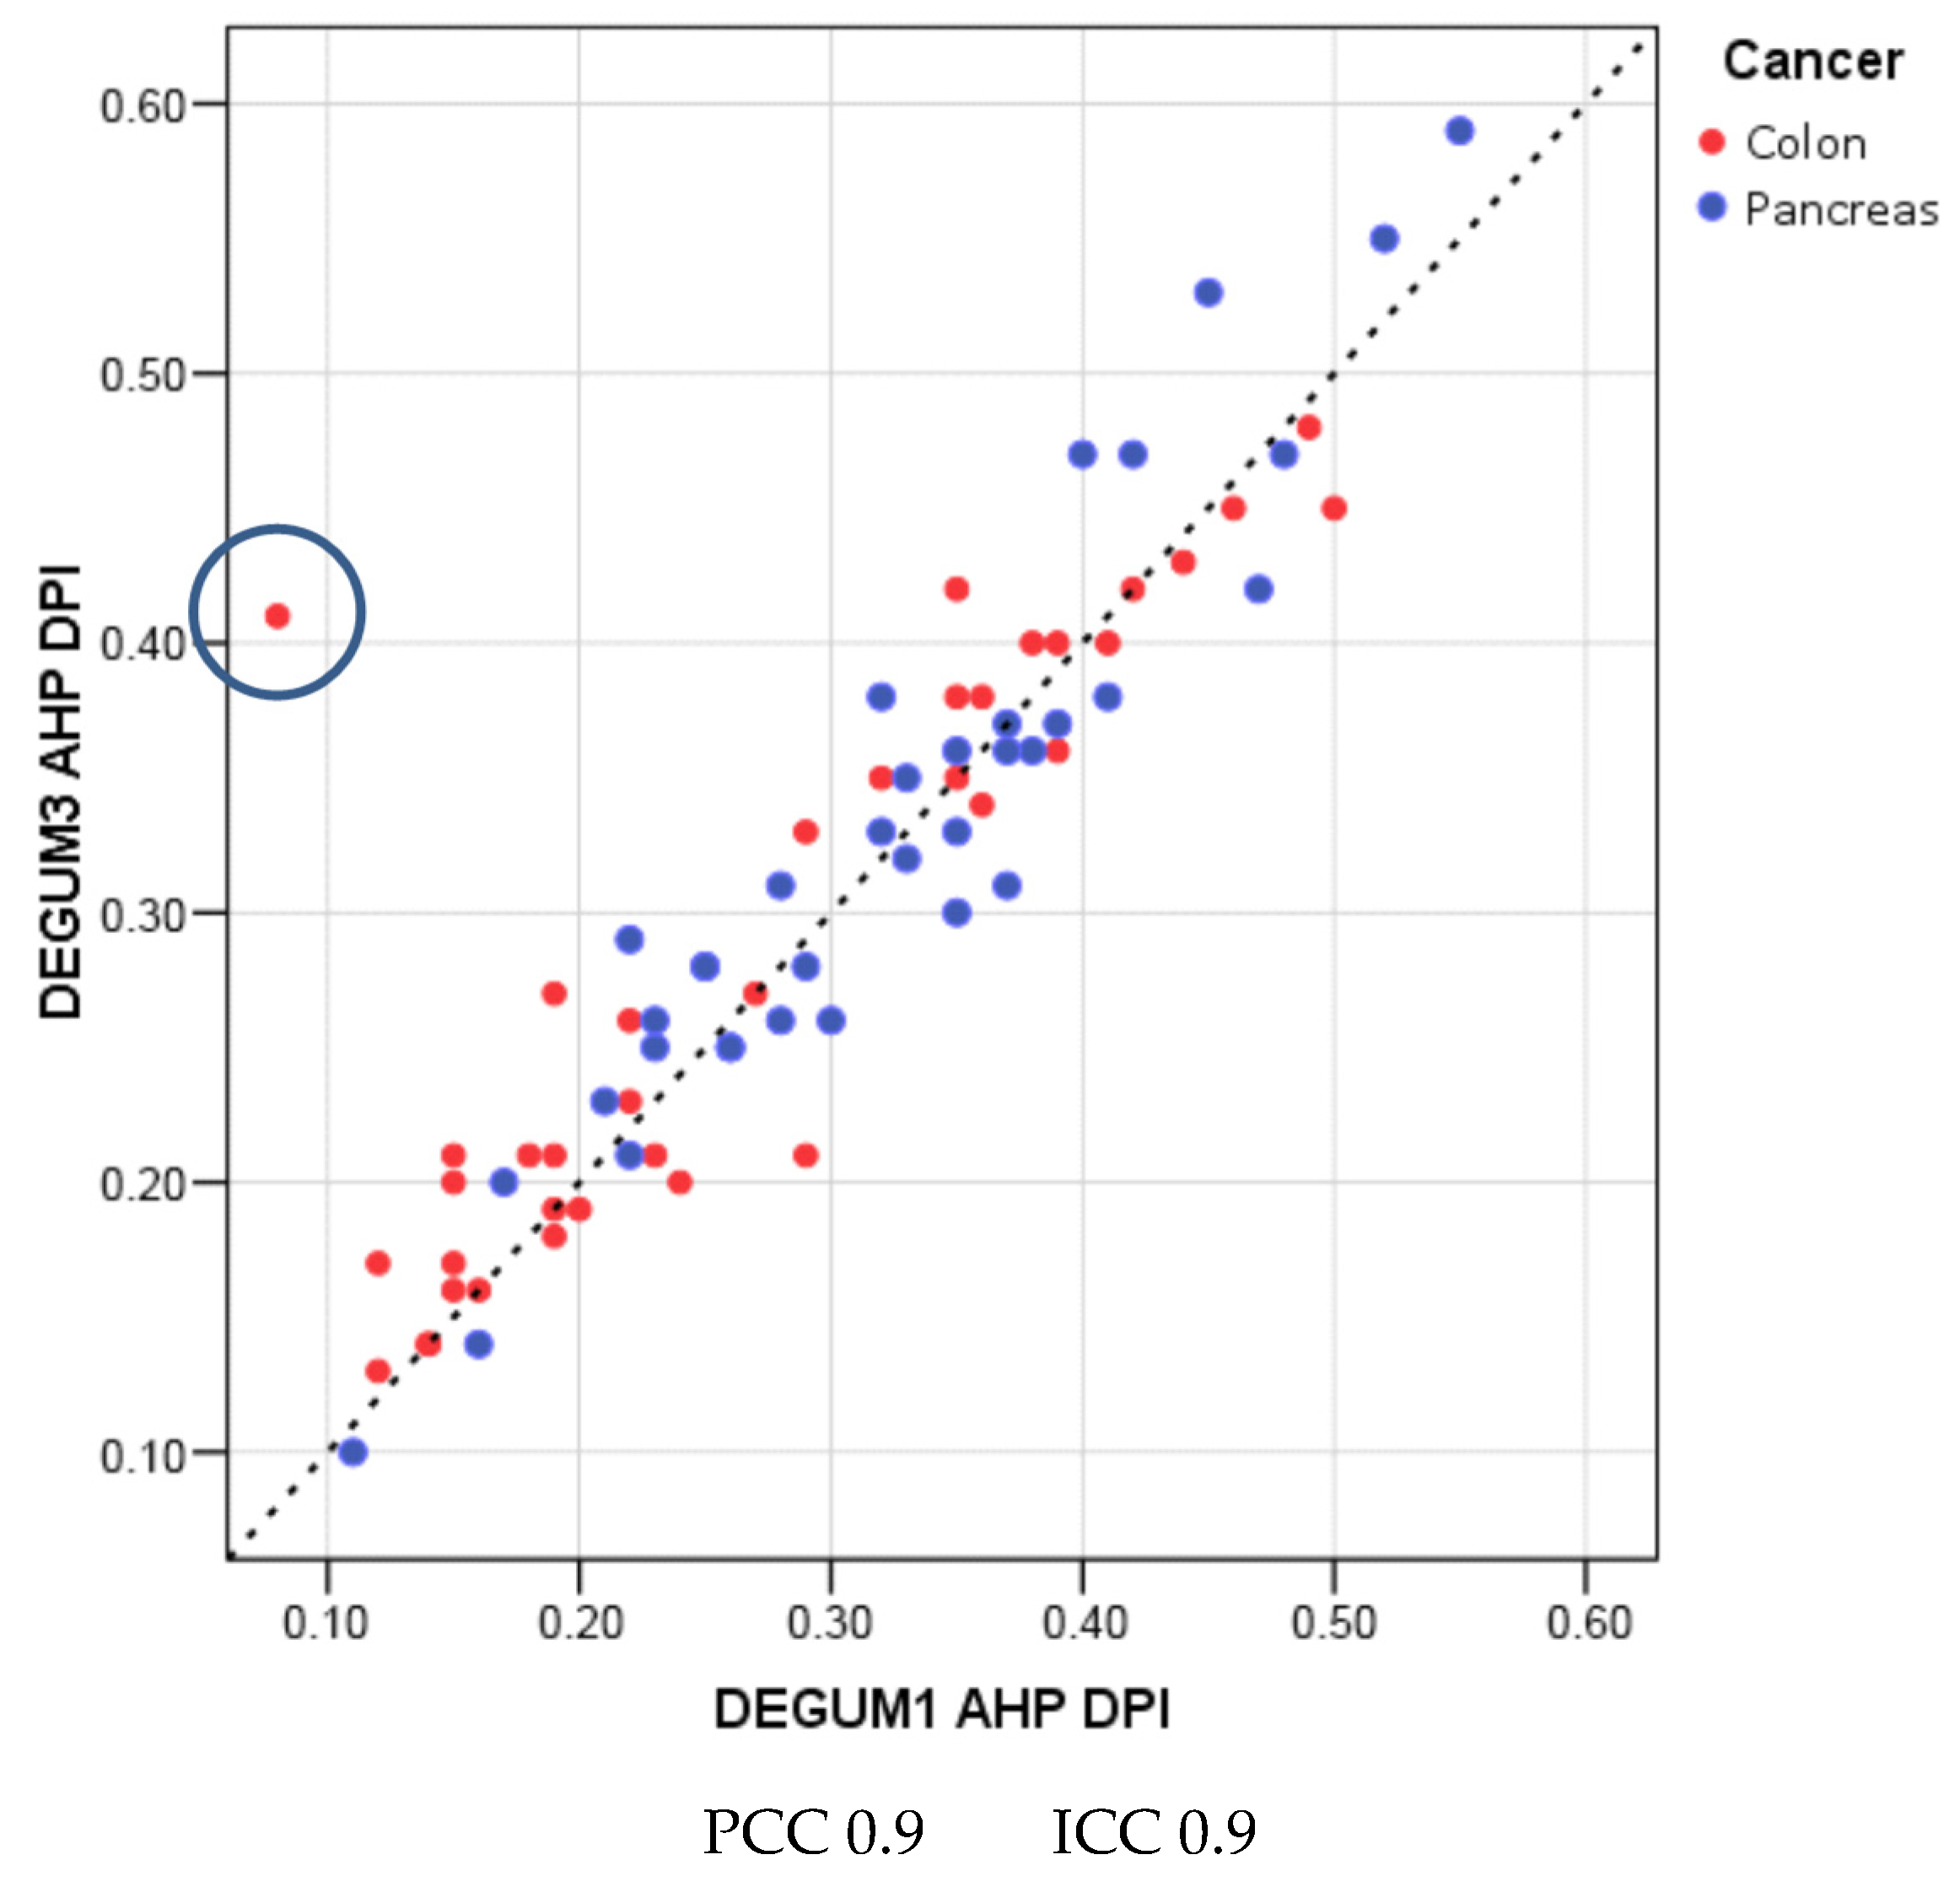
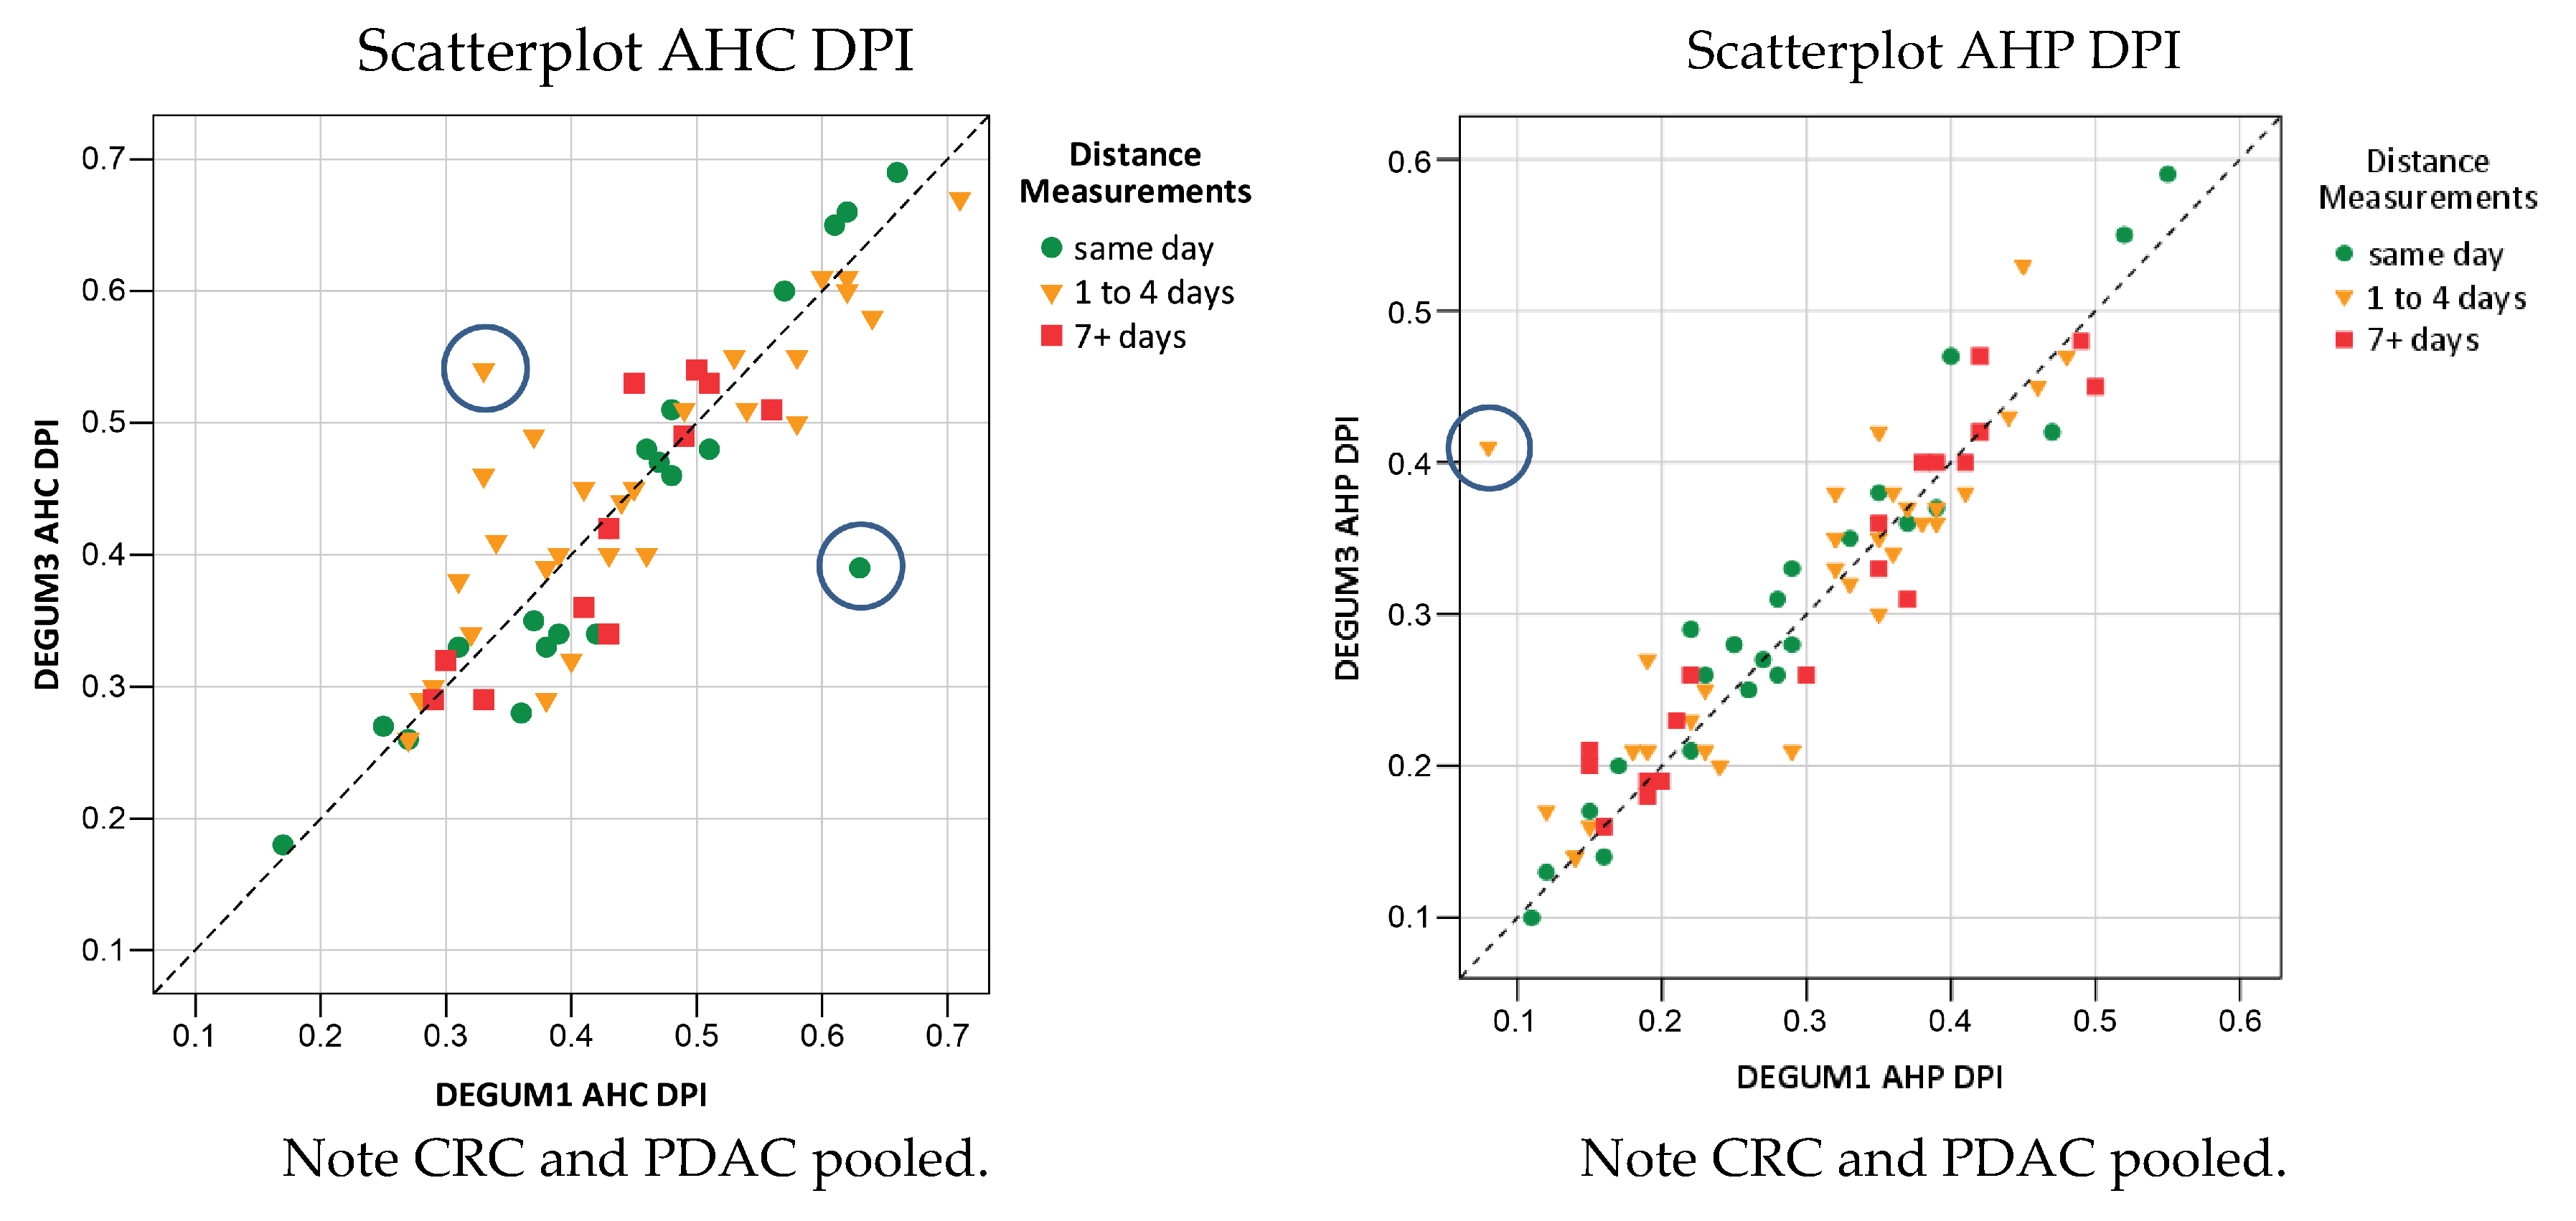
3.3. DPI
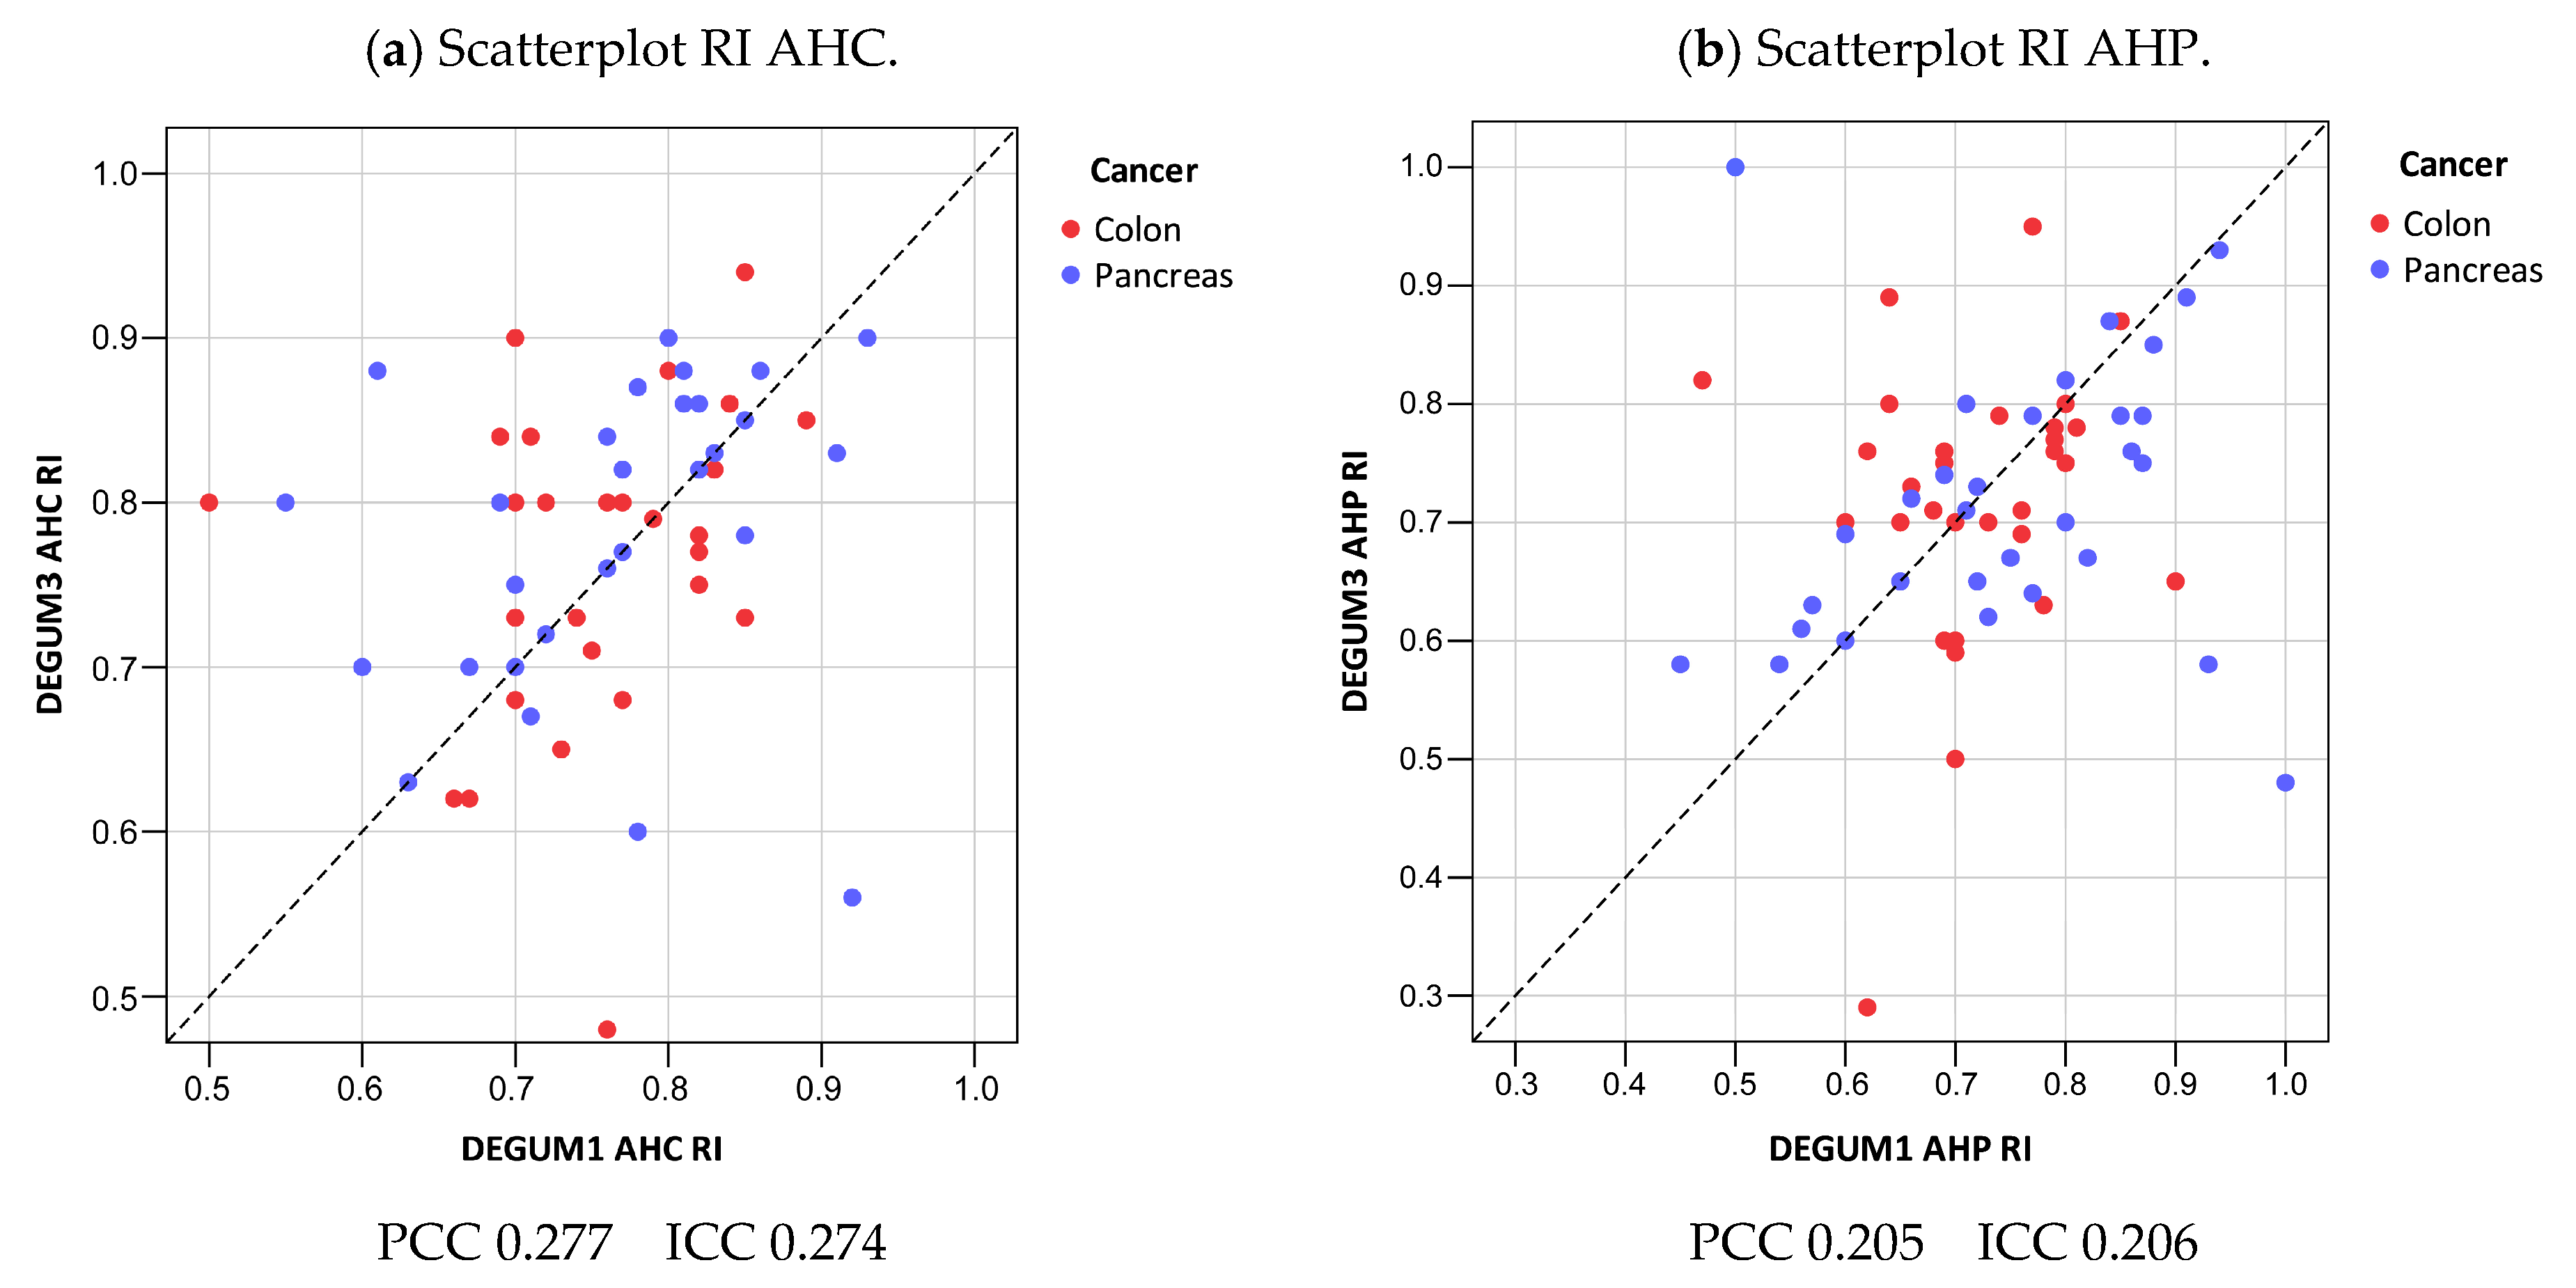
3.4. Resistive Index
3.5. The Question of Time Dependency
4. Discussion
5. Conclusions
Supplementary Materials
Author Contributions
Funding
Institutional Review Board Statement
Informed Consent Statement
Data Availability Statement
Acknowledgments
Conflicts of Interest
References
- Conroy, T.; Hammel, P.; Hebbar, M.; Ben Abdelghani, M.; Wei, A.C.; Raoul, J.-L.; Choné, L.; Francois, E.; Artru, P.; Biagi, J.J.; et al. FOLFIRINOX or Gemcitabine as Adjuvant Therapy for Pancreatic Cancer. N. Engl. J. Med. 2018, 379, 2395–2406. [Google Scholar] [CrossRef]
- Hoendervangers, S.; Burbach, J.P.M.; Lacle, M.M.; Koopman, M.; van Grevenstein, W.M.U.; Intven, M.P.W.; Verkooijen, H.M. Pathological Complete Response Following Different Neoadjuvant Treatment Strategies for Locally Advanced Rectal Cancer: A Systematic Review and Meta-analysis. Ann. Surg. Oncol. 2020, 27, 4319–4336. [Google Scholar] [CrossRef] [PubMed]
- Schmidt, M.; Quante, M. The IDEA Intergroup Study-New standard in adjuvant treatment of stage III colorectal cancer. Z. Gastroenterol. 2018, 56, 398–400. [Google Scholar] [CrossRef] [PubMed]
- Kotani, D.; Oki, E.; Nakamura, Y.; Yukami, H.; Mishima, S.; Bando, H.; Shirasu, H.; Yamazaki, K.; Watanabe, J.; Kotaka, M.; et al. Molecular residual disease and efficacy of adjuvant chemotherapy in patients with colorectal cancer. Nat. Med. 2023, 29, 127–134. [Google Scholar] [CrossRef] [PubMed]
- Leen, E. The detection of occult liver metastases of colorectal carcinoma. J. Hepato-Biliary-Pancreat. Surg. 1999, 6, 7–15. [Google Scholar] [CrossRef] [PubMed]
- Leen, E.; A Goldberg, J.; Angerson, W.J.; McArdle, C.S. Potential role of doppler perfusion index in selection of patients with colorectal cancer for adjuvant chemotherapy. Lancet 2000, 355, 34–37. [Google Scholar] [CrossRef] [PubMed]
- Ignee, A.; Boerner, N.; Bruening, A.; Dirks, K.; von Herbay, A.; Jenssen, C.; Kubale, R.; Sattler, H.; Schuler, A.; Weiss, H.; et al. Duplexsonography of the mesenteric vessels–A critical evaluation of inter observer variability. Z. Gastroenterol. 2016, 54, 304–311. [Google Scholar] [CrossRef] [PubMed]
- Tempero, M.A.; Malafa, M.P.; Al-Hawary, M.; Behrman, S.W.; Benson, A.B.; Cardin, D.B.; Chiorean, E.G.; Chung, V.; Czito, B.; Del Chiaro, M.; et al. Pancreatic Adenocarcinoma, Version 2.2021, NCCN Clinical Practice Guidelines in Oncology. J. Natl. Compr. Cancer Netw. 2021, 19, 439–457. [Google Scholar] [CrossRef] [PubMed]
- Hashiguchi, Y.; Muro, K.; Saito, Y.; Ito, Y.; Ajioka, Y.; Hamaguchi, T.; Hasegawa, K.; Hotta, K.; Ishida, H.; Ishiguro, M.; et al. Japanese Society for Cancer of the Colon and Rectum (JSCCR) guidelines 2019 for the treatment of colorectal cancer. Int. J. Clin. Oncol. 2020, 25, 1–42. [Google Scholar] [CrossRef] [PubMed]
- Kopljar, M.; Patrlj, L.; Bušić, Z.; Kolovrat, M.; Rakić, M.; Kliček, R.; Židak, M.; Stipančić, I. Potential use of Doppler perfusion index in detection of occult liver metastases from colorectal cancer. Hepatobiliary Surg. Nutr. 2014, 3, 259–267. [Google Scholar] [CrossRef] [PubMed][Green Version]
- Jiang, X.; Zhang, Z.; Zhao, N.; He, X.; Guo, H. Effects of Platelet-Derived Endothelial Cell Growth Factor and Doppler Perfusion Index in Patients with Colorectal Hepatic Metastases. Visc. Med. 2016, 32, 206–210. [Google Scholar] [CrossRef] [PubMed]
- Macrì, A.; Saladino, E.; Caminiti, R.; Bartolo, V.; Fortugno, A.; Asero, S.; Cinquegrani, M.; Famulari, C. Doppler perfusion index and colorectal hepatic metastases: Personal experience and review of the literature. Hepato-Gastroenterology 2012, 59, 731–733. [Google Scholar] [CrossRef] [PubMed]
- Roumen, R.; Scheltinga, M.; Slooter, G.; van der Linden, A. Doppler perfusion index fails to predict the presence of occult hepatic colorectal metastases. Eur. J. Surg. Oncol. 2005, 31, 521–527. [Google Scholar] [CrossRef] [PubMed]
- Kubale, R.; Stiegler, H.; Weskott, H.P. Vascular Ultrasound: B-Mode, Color Doppler and Duplex Ultrasound, Contrast-Enhanced Ultrasound; Georg Thieme: Leipzig, Germany, 2023. [Google Scholar]
- Struyk, P.; Pijpers, L.; Wladimiroff, J.; Lotgering, F.; Tonge, M.; Bom, N. The time-distance recorder as a means of improving the accuracy of fetal blood flow measurements. Ultrasound Med. Biol. 1985, 11, 71–77. [Google Scholar] [CrossRef] [PubMed]
- Schäberle, W.; Seitz, K. Duplex ultrasound measurement of blood flow in the superior mesenteric artery. Ultraschall Med. 1991, 12, 277–282. [Google Scholar] [CrossRef] [PubMed]
- Leen, E.; A Goldberg, J.; Anderson, J.R.; Robertson, J.; Moule, B.; Cooke, T.G.; McArdle, C.S. Hepatic perfusion changes in patients with liver metastases: Comparison with those patients with cirrhosis. Gut 1993, 34, 554–557. [Google Scholar] [CrossRef] [PubMed]
- Breedis, C.; Young, G. The blood supply of neoplasms in the liver. Am. J. Pathol. 1954, 30, 969–977. [Google Scholar] [PubMed]
- Dietrich, C.F.; Ignee, A.; Seitz, K.-H.; Caspary, W.F. Duplexsonographie der Viszeralarterien. Ultraschall Med. 2001, 22, 247–257. [Google Scholar] [CrossRef] [PubMed]
- Koo, T.K.; Li, M.Y. A Guideline of Selecting and Reporting Intraclass Correlation Coefficients for Reliability Research. J. Chiropr. Med. 2016, 15, 155–163. [Google Scholar] [CrossRef] [PubMed]
- Encyclopedia of Statistical Sciences—Wikipedia. Available online: https://en.wikipedia.org/wiki/Encyclopedia_of_Statistical_Sciences (accessed on 18 February 2024).
- Oppo, K.; Leen, E.; Angerson, W.J.; Cooke, T.G.; McArdle, C.S. Doppler perfusion index: An interobserver and intraobserver reproducibility study. Radiology 1998, 208, 453–457. [Google Scholar] [CrossRef] [PubMed]


| Parameter | Diameter [mm] | Insonation Angle | Doppler Shift [cm/s] | Flow [mL/min] |
|---|---|---|---|---|
| N | 79 | 79 | 79 | 79 |
| Mean D1 (SD) | 10.3 (1.3) | 31.7 (16.2) | 11.5 (2.7) | 712 (236) |
| Mean D3 (SD) | 10.1 (1.4) | 34.0 (14.9) | 11.9 (2.3) | 729 (238) |
| Mean tot (SD) | 10.2 (1.3) | 32.8 (15.5) | 11.7 (2.7) | 720 (237) |
| Mean Diff (SD) | −0.15 (0.74) | 2.4 (14.8) | 0.4 (2.5) | 17 (160) |
| p(Bias) | 0.20 | 0.26 | 0.11 | 0.55 |
| p(Var) | 0.57 | 0.29 | 0.81 | 0.82 |
| PCC | 0.85 | 0.55 | 0.57 | 0.77 |
| ICC (95% CI) | 0.84 (0.77; 0.90) | 0.54 (0.37; 0.68) | 0.56 (0.39; 0.70) | 0.77 (0.67; 0.85) |
| MVC | 0.04 | 0.33 | 0.12 | 0.11 |
| B/A Limits | (−1.6; 1.3) | (−26.7; 31.4) | (−4.5; 5.3) | (−297; 331) |
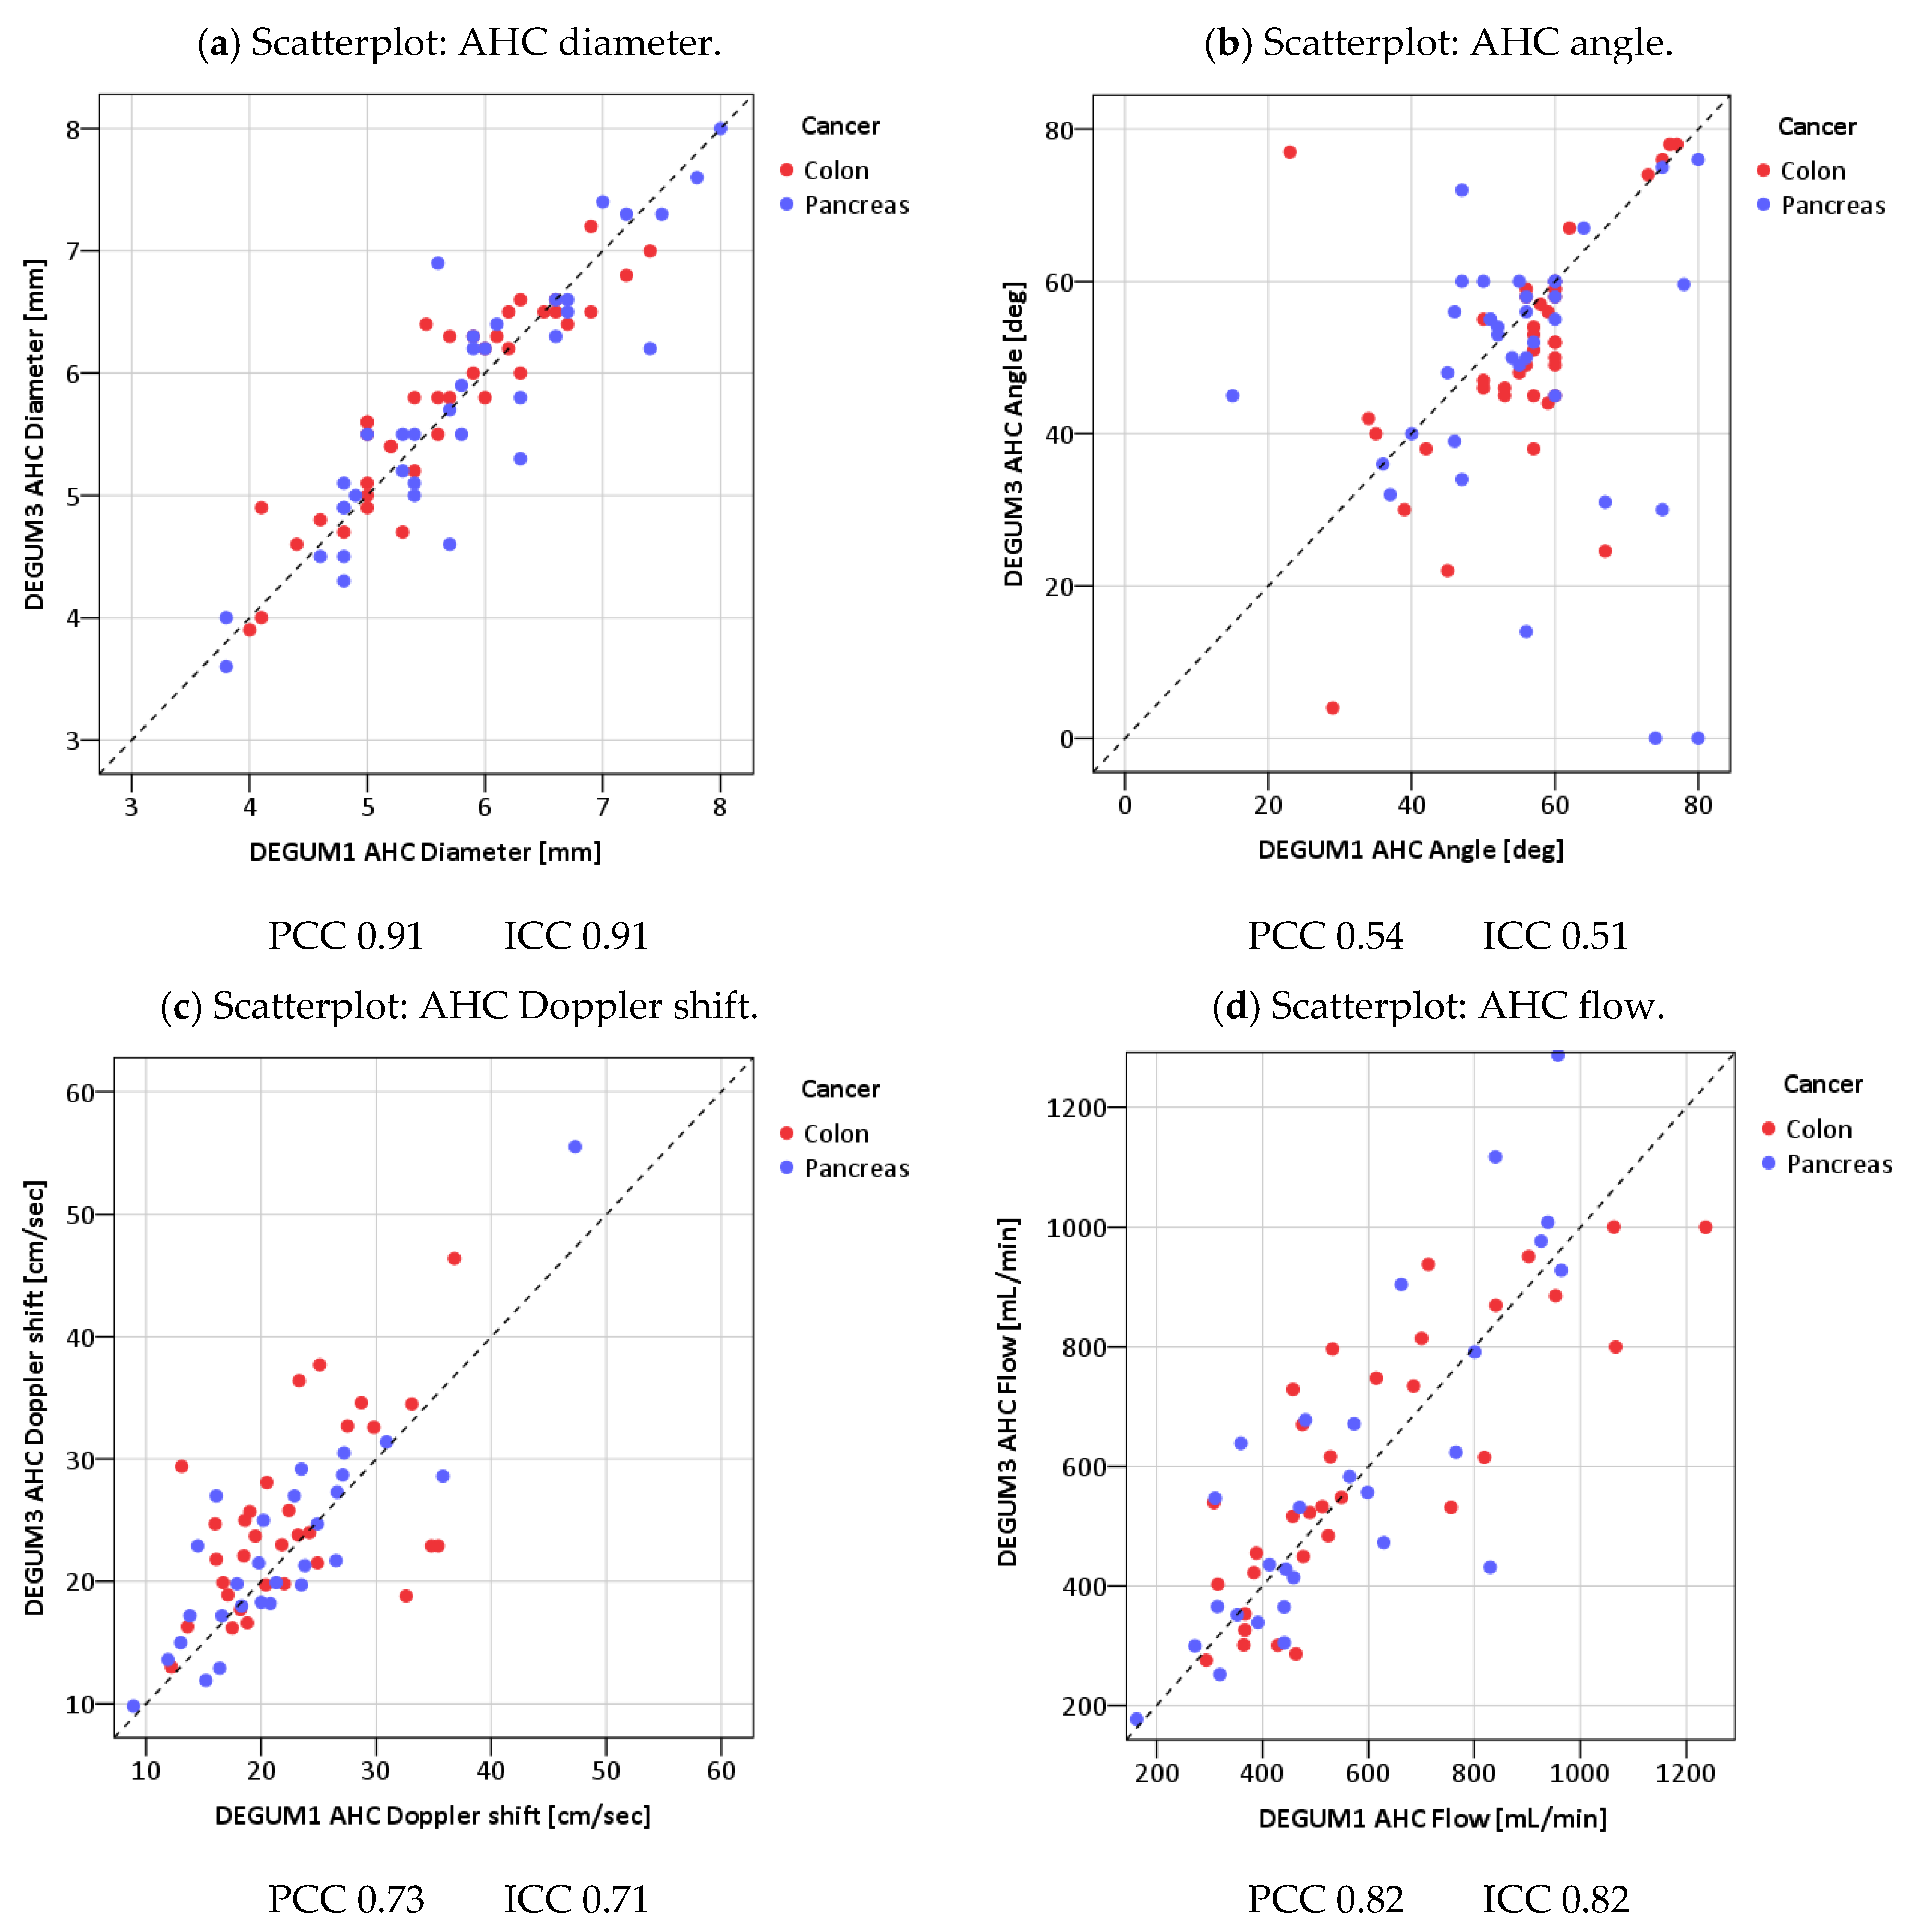
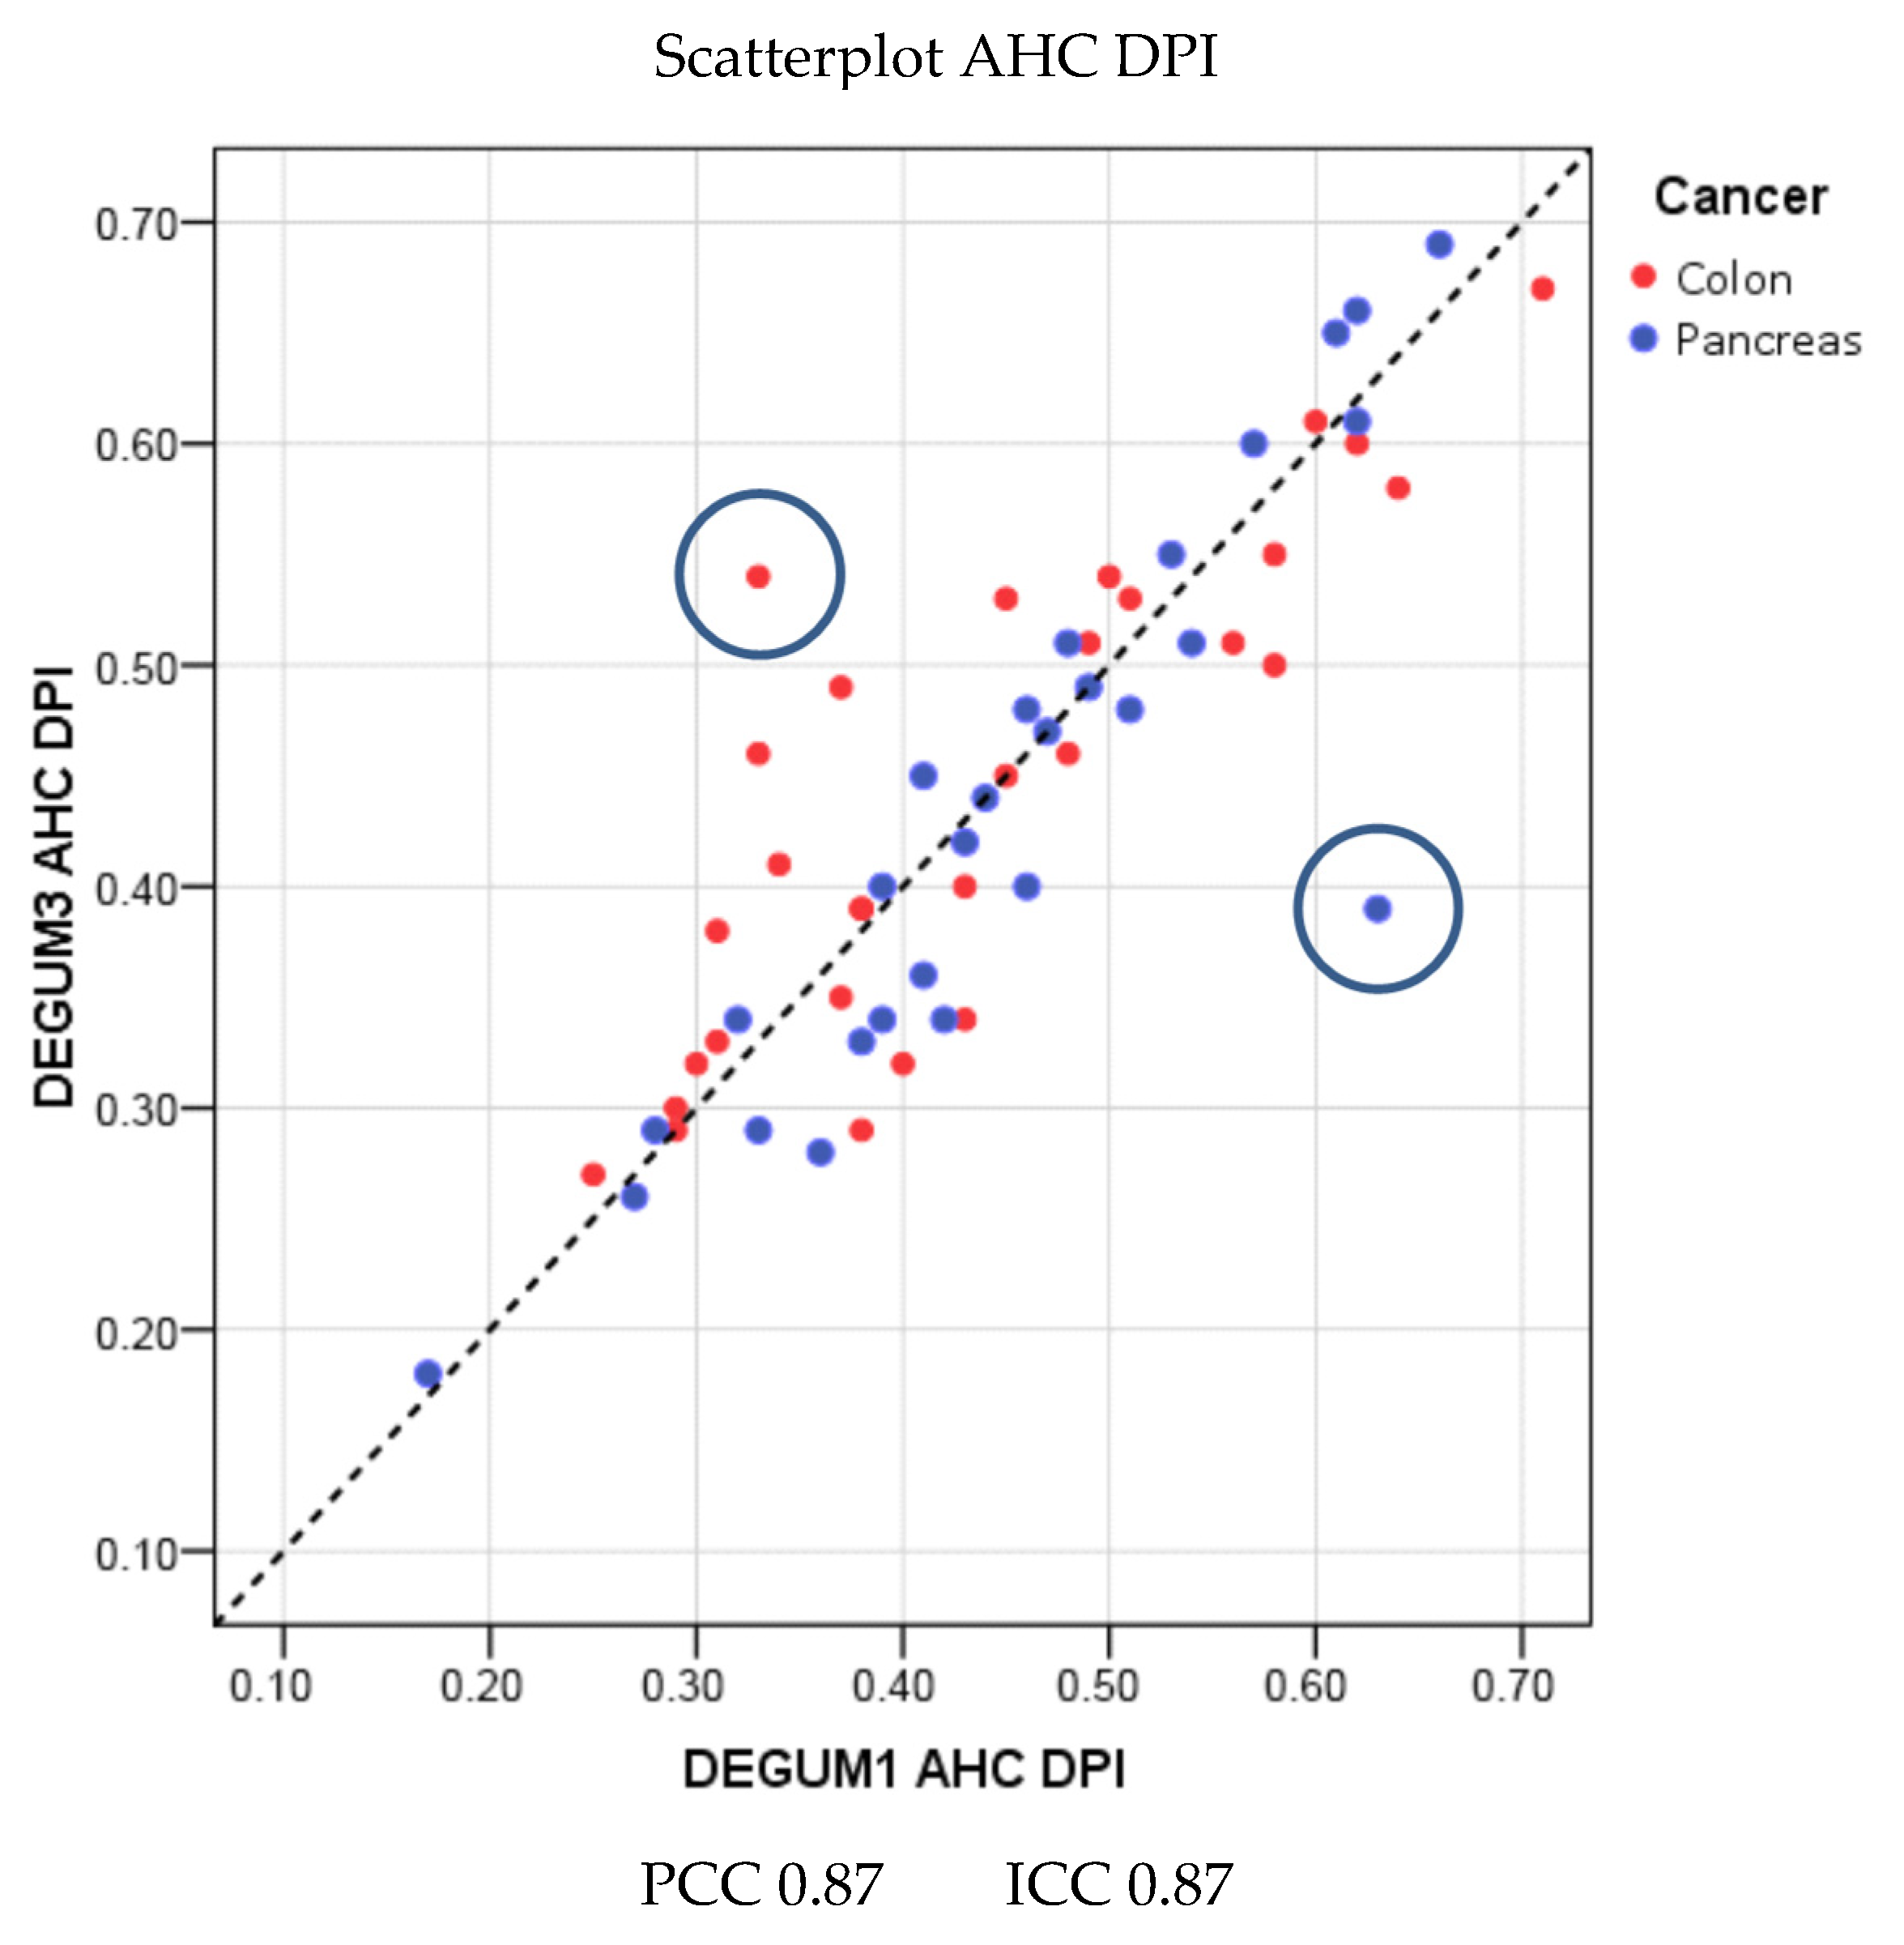
| Parameter | Diameter [mm] | Insonation Angle | Doppler Shift [cm/s] | Flow [mL/min] | AHC-DPI |
|---|---|---|---|---|---|
| N | 75 | 60 | 60 | 60 | 60 |
| Mean D1 (SD) | 5.7 (1) | 52.1 (9.2) | 22.1 (7.3) | 579 (240) | 0.4 (0.1) |
| Mean D3 (SD) | 5.8 (0.9) | 48.4 (11.4) | 23.8 (8.1) | 598 (252) | 0.4 (0.1) |
| Mean tot (SD) | 5.7 (0.9) | 50.2 (10.5) | 23 (7.7) | 588 (245) | 0.4 (0.1) |
| Mean Diff (SD) | 0.0 (0.4) | −3.7 (10) | 1.7 (5.7) | 20 (148) | 0.01 (0.06) |
| p(Bias) | 0.50 | 0.002 | 0.008 | 0.30 | 0.55 |
| p(Var) | 0.97 | 0.29 | 0.73 | 0.70 | 0.82 |
| PCC | 0.91 | 0.54 | 0.73 | 0.82 | 0.87 |
| ICC (95% CI) | 0.91 (0.86; 0.94) | 0.51 (0.24; 0.67) | 0.71 (0.55; 0.82) | 0.82 (0.72; 0.89) | 0.87 (0.79; 0.92) |
| MVC | 0.04 | 0.13 | 0.13 | 0.14 | 0.07 |
| B/A Limits | (−0.78; 0.82) | (−23.3; 16.0) | (−9.4; 12.9) | (−270; 310) | (−0.13; 0.12) |
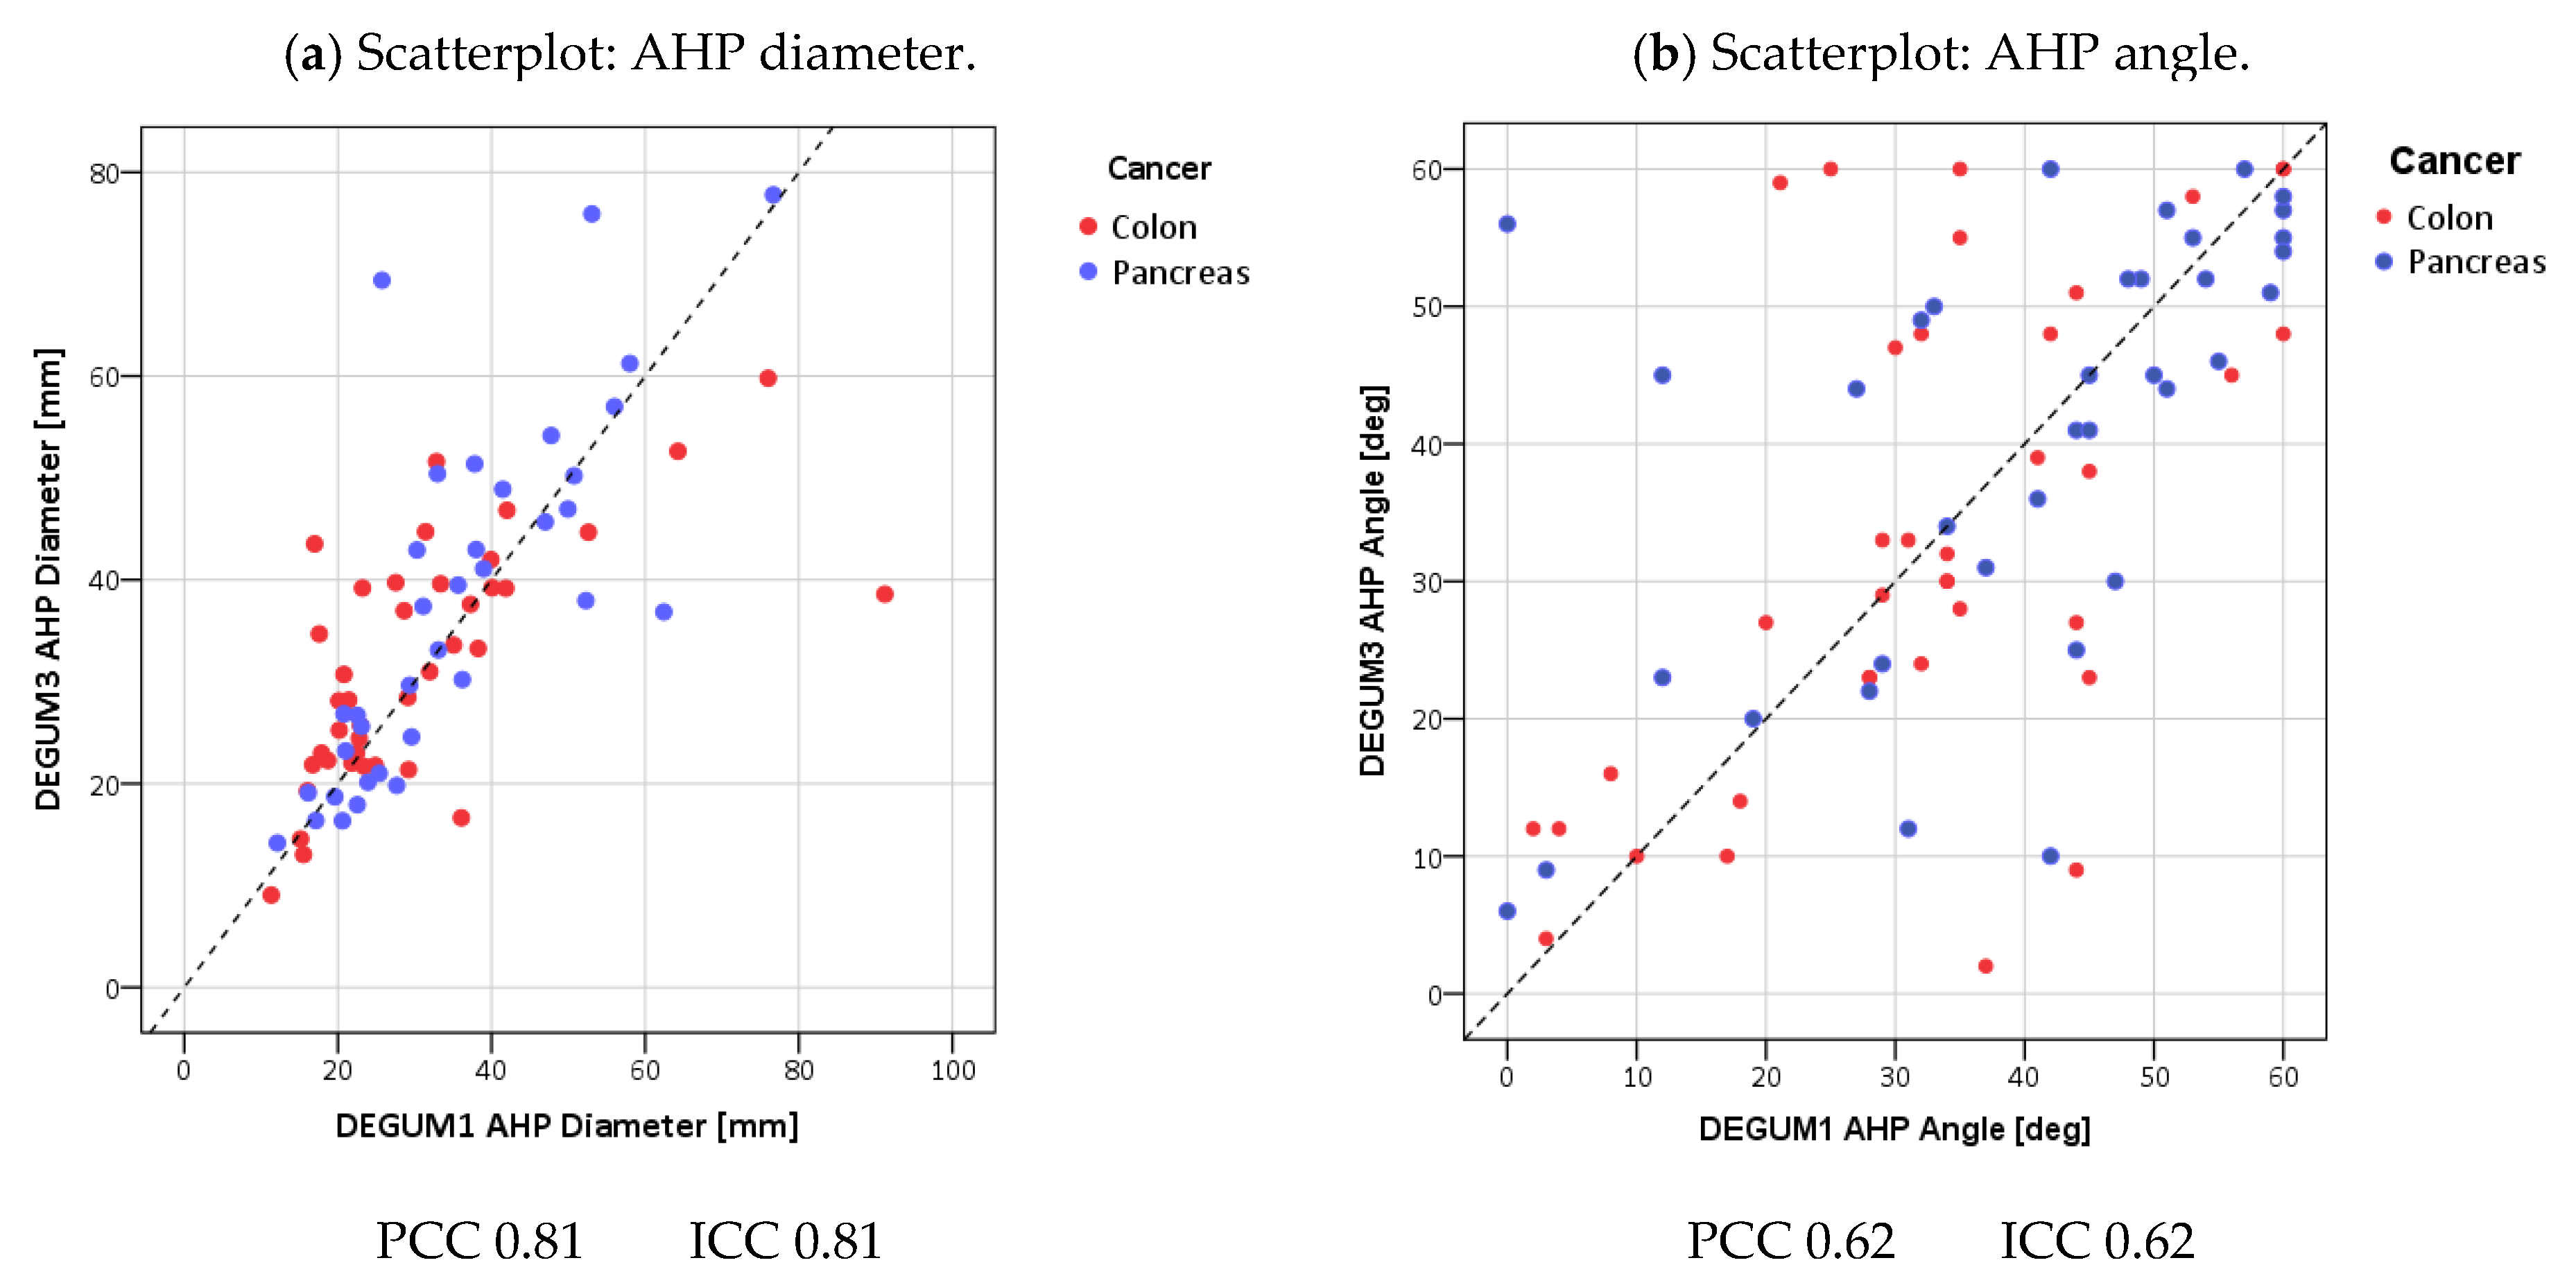
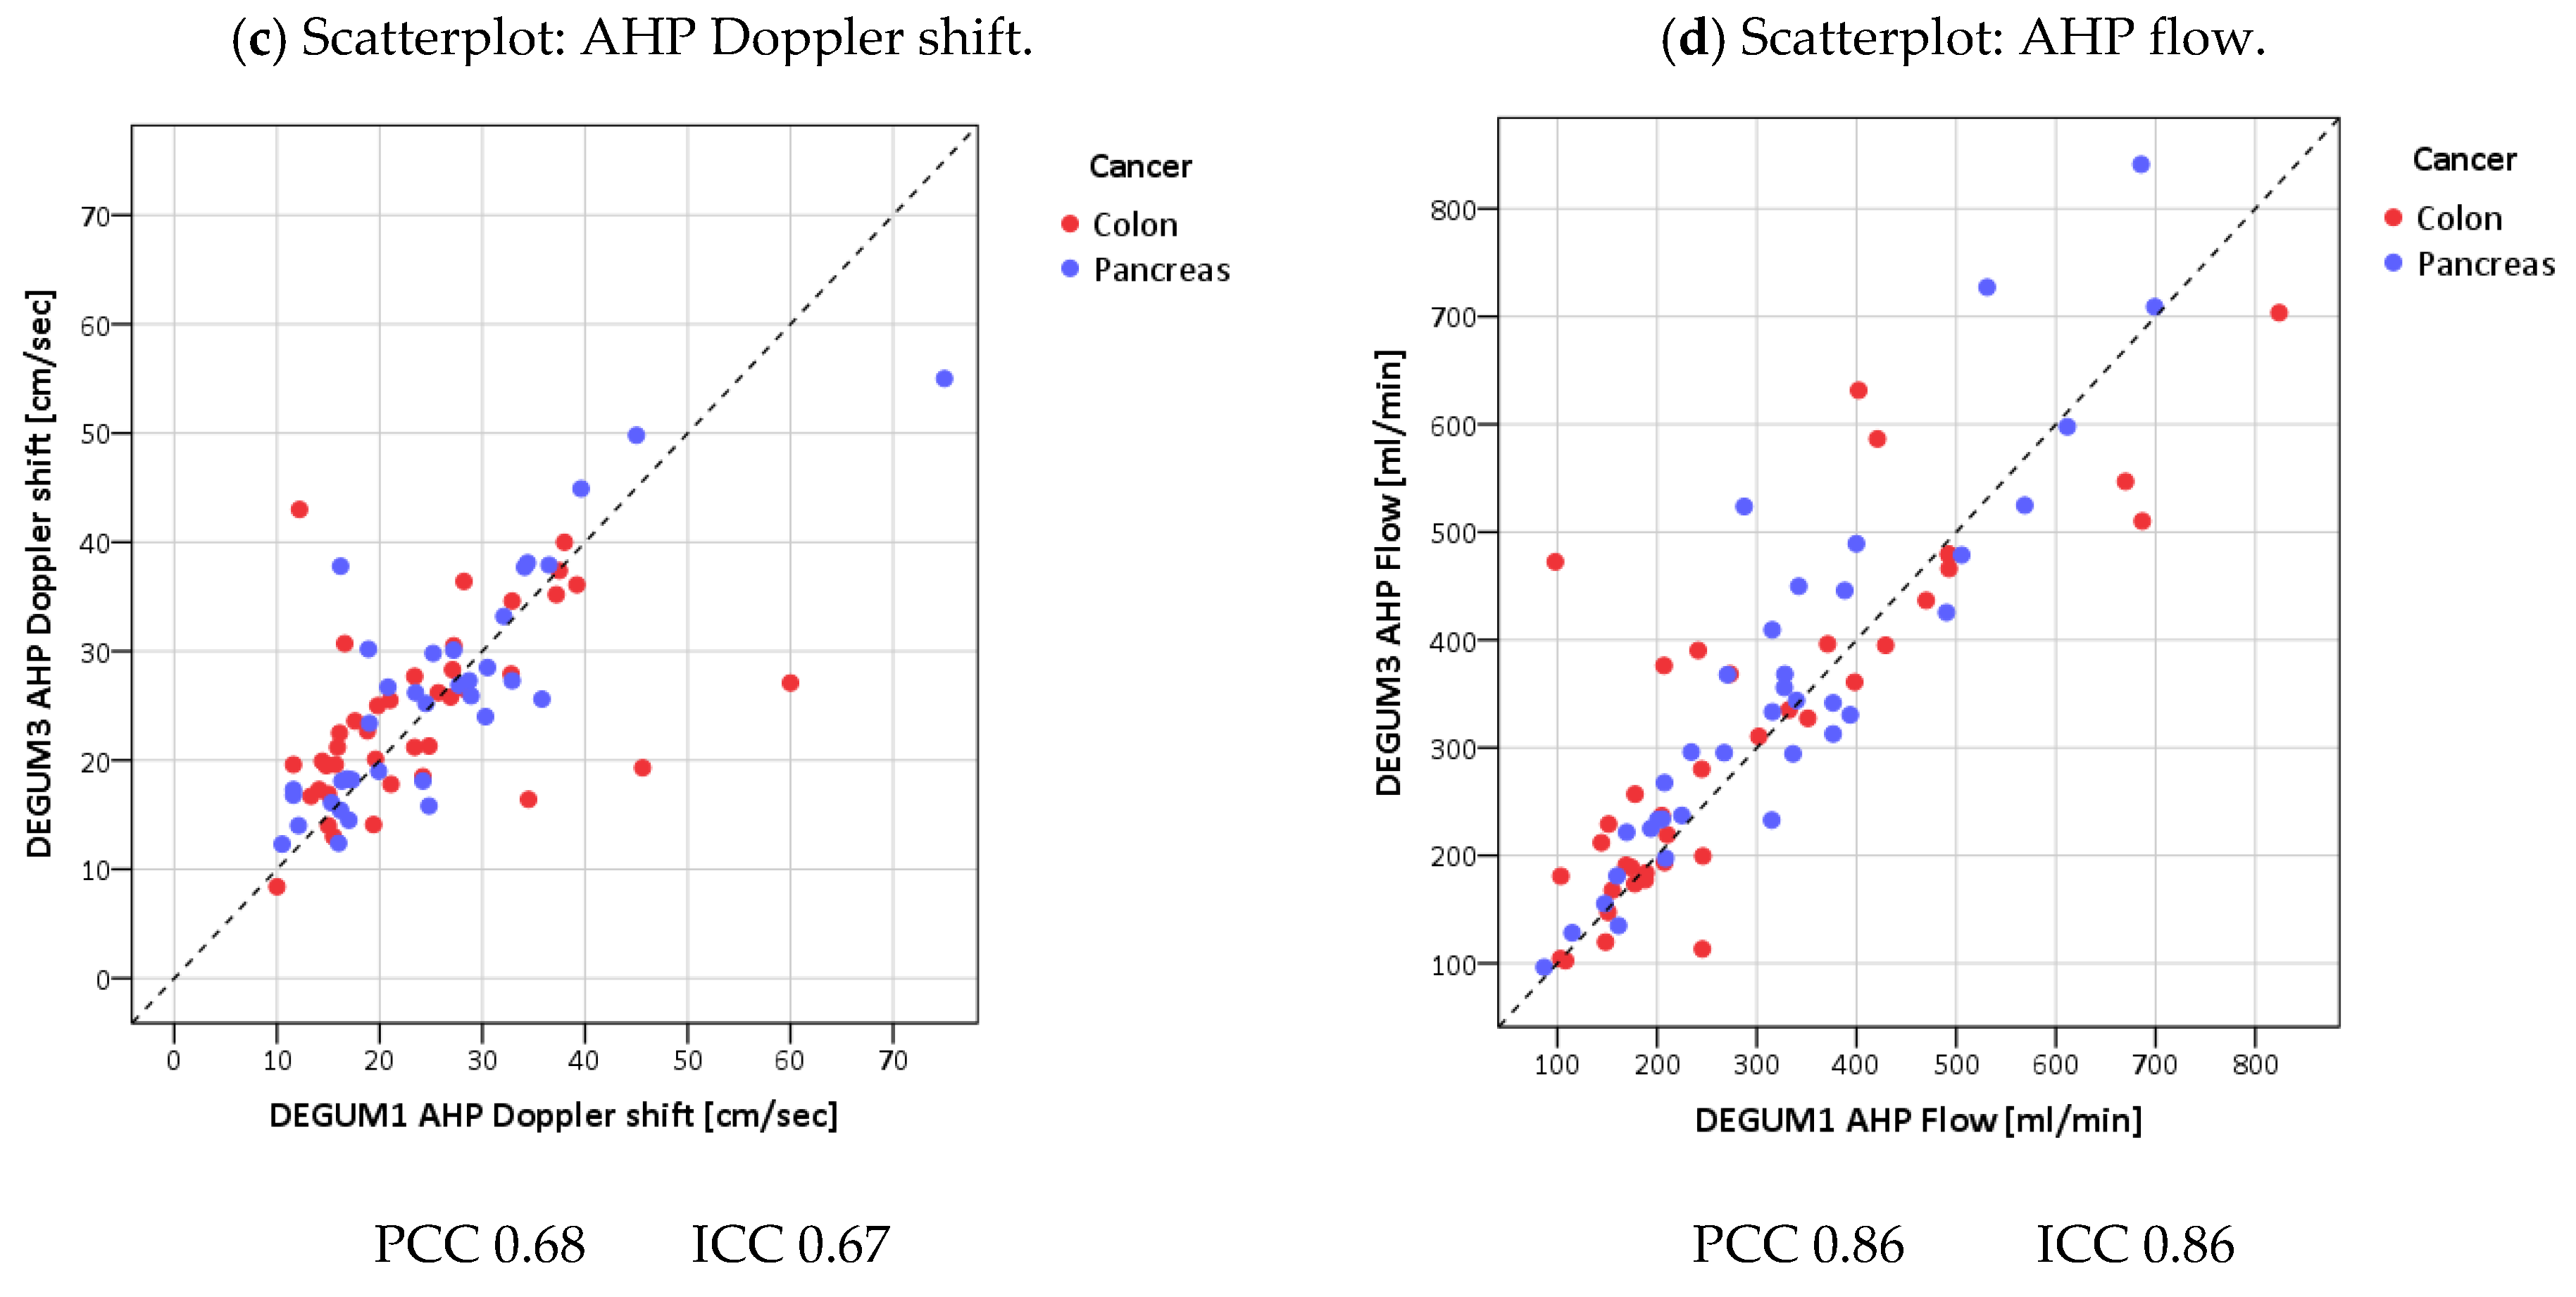
| Parameter | Diameter [mm] | Insonation Angle | Doppler Shift [cm/s] | Flow [mL/min] | AHP-DPI |
|---|---|---|---|---|---|
| N | 79 | 76 | 76 | 76 | 76 |
| Mean D1 (SD) | 4.4 (0.7) | 35.8 (16.9) | 24.6 (11.3) | 308 (165) | 0.3 (0.1) |
| Mean D3 (SD) | 4.5 (0.7) | 36.6 (17.3) | 25 (9.4) | 332 (166) | 0.3 (0.1) |
| Mean tot (SD) | 4.5 (0.7) | 36.2 (17) | 24.8 (10.3) | 320 (165) | 0.3 (0.1) |
| Mean Diff (SD) | 0.1 (0.4) | 0.8 (14.9) | 0.5 (8.5) | 24 (86) | 0.01 (0.05) |
| p(Bias) | 0.10 | 0.98 | 0.14 | 0.05 | 0.06 |
| p(Var) | 0.38 | 0.33 | 0.25 | 0.94 | 0.66 |
| PCC | 0.81 | 0.62 | 0.68 | 0.87 | 0.90 |
| ICC (95% CI) | 0.81 (0.71; 0.87) | 0.62 (0.46; 0.74) | 0.67 (0.52; 0.78) | 0.86 (0.78; 0.91) | 0.90 (0.84; 0.93) |
| MVC | 0.05 | 0.27 | 0.15 | 0.13 | 0.08 |
| B/A Limits | (−0.79; 0.94) | (−28.5; 30.1) | (−16.1; 17.0) | (−145; 192) | (−0.09; 0.11) |
Disclaimer/Publisher’s Note: The statements, opinions and data contained in all publications are solely those of the individual author(s) and contributor(s) and not of MDPI and/or the editor(s). MDPI and/or the editor(s) disclaim responsibility for any injury to people or property resulting from any ideas, methods, instructions or products referred to in the content. |
© 2024 by the authors. Licensee MDPI, Basel, Switzerland. This article is an open access article distributed under the terms and conditions of the Creative Commons Attribution (CC BY) license (https://creativecommons.org/licenses/by/4.0/).
Share and Cite
Lueders, C.; Gladitz, J.; Bauer, G.; Jenssen, C.; Belaschki, J.; von Kirchbach, A.; Schneider, C.; Kiefer, T.; Voeller, H.; Merkel, D. The Doppler Perfusion Index of the Liver and the Underlying Duplex Sonography of Visceral Vessels—A Systematic and Comprehensive Evaluation of Reproducibility. Diagnostics 2024, 14, 778. https://doi.org/10.3390/diagnostics14070778
Lueders C, Gladitz J, Bauer G, Jenssen C, Belaschki J, von Kirchbach A, Schneider C, Kiefer T, Voeller H, Merkel D. The Doppler Perfusion Index of the Liver and the Underlying Duplex Sonography of Visceral Vessels—A Systematic and Comprehensive Evaluation of Reproducibility. Diagnostics. 2024; 14(7):778. https://doi.org/10.3390/diagnostics14070778
Chicago/Turabian StyleLueders, Christian, Johannes Gladitz, Georg Bauer, Christian Jenssen, Jana Belaschki, Arndt von Kirchbach, Christoph Schneider, Thomas Kiefer, Heinz Voeller, and Daniel Merkel. 2024. "The Doppler Perfusion Index of the Liver and the Underlying Duplex Sonography of Visceral Vessels—A Systematic and Comprehensive Evaluation of Reproducibility" Diagnostics 14, no. 7: 778. https://doi.org/10.3390/diagnostics14070778
APA StyleLueders, C., Gladitz, J., Bauer, G., Jenssen, C., Belaschki, J., von Kirchbach, A., Schneider, C., Kiefer, T., Voeller, H., & Merkel, D. (2024). The Doppler Perfusion Index of the Liver and the Underlying Duplex Sonography of Visceral Vessels—A Systematic and Comprehensive Evaluation of Reproducibility. Diagnostics, 14(7), 778. https://doi.org/10.3390/diagnostics14070778