

Development and Validation of a Screening Equation for Obstructive Sleep Apnea


Abstract
1. Introduction
1.1. The Burden of Obstructive Sleep Apnea
1.2. Epidemiology and Risk Factors
1.3. The State of Art of OSA Screening
1.4. Aim of the Study
2. Materials and Methods
2.1. First Phase
2.2. Second Phase
2.3. Statistical Analysis
3. Results
3.1. First Phase
3.2. Second Phase
4. Discussion
4.1. The Impact of Neck Circumference and Epworth Sleepiness Scale
4.2. The Predictive Equation
4.3. Future Applications
4.4. Study Strengths and Limitations
5. Conclusions
Author Contributions
Funding
Institutional Review Board Statement
Informed Consent Statement
Data Availability Statement
Conflicts of Interest
References
- Edwards, B.A.; Eckert, D.J.; Jordan, A.S. Obstructive sleep apnoea pathogenesis from mild to severe: Is it all the same? Respirology 2017, 22, 33–42. [Google Scholar] [CrossRef] [PubMed]
- Meliante, P.G.; Zoccali, F.; Cascone, F.; Di Stefano, V.; Greco, A.; de Vincentiis, M.; Petrella, C.; Fiore, M.; Minni, A.; Barbato, C. Molecular Pathology, Oxidative Stress, and Biomarkers in Obstructive Sleep Apnea. Int. J. Mol. Sci. 2023, 24, 5478. [Google Scholar] [CrossRef] [PubMed]
- Gold, A.R.; Gold, M.S. Con: Sleep fragmentation causes hypersomnolence in OSA. Sleep Med. Rev. 2021, 55, 101399. [Google Scholar] [CrossRef] [PubMed]
- Salman, L.A.; Shulman, R.; Cohen, J.B. Obstructive Sleep Apnea, Hypertension, and Cardiovascular Risk: Epidemiology, Pathophysiology, and Management. Curr. Cardiol. Rep. 2020, 22, 6. [Google Scholar] [CrossRef]
- Xu, P.H.; Hui, C.K.M.; Lui, M.M.S.; Lam, D.C.L.; Fong, D.Y.T.; Ip, M.S.M. Incident Type 2 Diabetes in OSA and Effect of CPAP Treatment: A Retrospective Clinic Cohort Study. Chest 2019, 156, 743–753. [Google Scholar] [CrossRef]
- Lal, C.; Ayappa, I.; Ayas, N.; Beaudin, A.E.; Hoyos, C.; Kushida, C.A.; Kaminska, M.; Mullins, A.; Naismith, S.L.; Osorio, R.S.; et al. The Link between Obstructive Sleep Apnea and Neurocognitive Impairment: An Official American Thoracic Society Workshop Report. Ann. Am. Thorac. Soc. 2022, 19, 1245–1256. [Google Scholar] [CrossRef]
- Krishnan, S.; Chai-Coetzer, C.L.; Grivell, N.; Lovato, N.; Mukherjee, S.; Vakulin, A.; Adams, R.J.; Appleton, S.L. Comorbidities and quality of life in Australian men and women with diagnosed and undiagnosed high-risk obstructive sleep apnea. J. Clin. Sleep Med. 2022, 18, 1757–1767. [Google Scholar] [CrossRef]
- Morsy, N.E.; Farrag, N.S.; Zaki, N.F.W.; Badawy, A.Y.; Abdelhafez, S.A.; El-Gilany, A.-H.; El Shafey, M.M.; Pandi-Perumal, S.R.; Spence, D.W.; BaHammam, A.S. Obstructive sleep apnea: Personal, societal, public health, and legal implications. Rev. Environ. Health 2019, 34, 153–169. [Google Scholar] [CrossRef]
- Alakörkkö, I.; Törmälehto, S.; Leppänen, T.; McNicholas, W.T.; Arnardottir, E.S.; Sund, R. The economic cost of obstructive sleep apnea: A systematic review. Sleep Med. Rev. 2023, 72, 101854. [Google Scholar] [CrossRef]
- Léger, D.; Stepnowsky, C. The economic and societal burden of excessive daytime sleepiness in patients with obstructive sleep apnea. Sleep Med. Rev. 2020, 51, 101275. [Google Scholar] [CrossRef]
- Bonsignore, M.R.; Lombardi, C.; Lombardo, S.; Fanfulla, F. Epidemiology, Physiology and Clinical Approach to Sleepiness at the Wheel in OSA Patients: A Narrative Review. J. Clin. Med. 2022, 11, 3691. [Google Scholar] [CrossRef] [PubMed]
- Benjafield, A.V.; Ayas, N.T.; Eastwood, P.R.; Heinzer, R.; Ip, M.S.M.; Morrell, M.J.; Nunez, C.M.; Patel, S.R.; Penzel, T.; Pépin, J.-L.; et al. Estimation of the global prevalence and burden of obstructive sleep apnoea: A literature-based analysis. Lancet Respir Med. 2019, 7, 687–698. [Google Scholar] [CrossRef] [PubMed]
- Tufik, S.; Santos-Silva, R.; Taddei, J.A.; Bittencourt, L.R. Obstructive sleep apnea syndrome in the Sao Paulo Epidemiologic Sleep Study. Sleep Med. 2010, 11, 441–446. [Google Scholar] [CrossRef]
- Ghavami, T.; Kazeminia, M.; Ahmadi, N.; Rajati, F. Global Prevalence of Obstructive Sleep Apnea in the Elderly and Related Factors: A Systematic Review and Meta-Analysis Study. J. PeriAnesth. Nurs. 2023, 38, 865–875. [Google Scholar] [CrossRef] [PubMed]
- Ernst, G.; Mariani, J.; Blanco, M.; Finn, B.; Salvado, A.; Borsini, E. Increase in the frequency of obstructive sleep apnea in elderly people. Sleep Sci. 2019, 12, 222–226. [Google Scholar] [CrossRef]
- Osorio, R.S.; Martínez-García, M.Á.; Rapoport, D.M. Sleep apnoea in the elderly: A great challenge for the future. Eur. Respir. J. 2021, 59, 2101649. [Google Scholar] [CrossRef]
- Zhang, W.; Gao, X. A Cone Beam CT Study of Upper Airway Morphology in Perimenopausal and Postmenopausal Women. Int. J. Women’s Health 2021, 13, 1129–1137. [Google Scholar] [CrossRef]
- Sands, S.A.; Alex, R.M.; Mann, D.; Vena, D.; Terrill, P.I.; Gell, L.K.; Zinchuk, A.; Sofer, T.; Patel, S.R.; Taranto-Montemurro, L.; et al. Pathophysiology Underlying Demographic and Obesity Determinants of Sleep Apnea Severity. Ann. Am. Thorac. Soc. 2023, 20, 440–449. [Google Scholar] [CrossRef]
- Fabozzi, A.; Steffanina, A.; Nicolai, A.; Olmati, F.; Bonini, M.; Palange, P. The Impact of Lung Function on Sleep Monitoring in Obstructive Sleep Apnea Associated with Obstructive Lung Diseases: Insights from a Clinical Study. J. Clin. Med. 2024, 13, 6189. [Google Scholar] [CrossRef]
- Dosman, J.A.; Karunanayake, C.P.; Fenton, M.; Ramsden, V.R.; Seeseequasis, J.; Skomro, R.; Kirychuk, S.; Rennie, D.C.; McMullin, K.; Russell, B.P.; et al. Obesity, Sex, Snoring and Severity of OSA in a First Nation Community in Saskatchewan, Canada. Clocks Sleep 2022, 4, 100–113. [Google Scholar] [CrossRef]
- Tai, J.E.; Phillips, C.L.; Yee, B.J.; Grunstein, R.R. Obstructive sleep apnoea in obesity: A review. Clin. Obes. 2024, 14, e12651. [Google Scholar] [CrossRef] [PubMed]
- Messineo, L.; Bakker, J.P.; Cronin, J.; Yee, J.; White, D.P. Obstructive sleep apnea and obesity: A review of epidemiology, pathophysiology and the effect of weight-loss treatments. Sleep Med. Rev. 2024, 78, 101996. [Google Scholar] [CrossRef] [PubMed]
- Heffernan, A.; Duplancic, D.; Kumric, M.; Ticinovic Kurir, T.; Bozic, J. Metabolic Crossroads: Unveiling the Complex Interactions between Obstructive Sleep Apnoea and Metabolic Syndrome. Int. J. Mol. Sci. 2024, 25, 3243. [Google Scholar] [CrossRef] [PubMed]
- Ma, B.; Li, Y.; Wang, X.; Du, L.; Wang, S.; Ma, H.; Zhou, D.; Usman, T.; Lu, L.; Qu, S. Association Between Abdominal Adipose Tissue Distribution and Obstructive Sleep Apnea in Chinese Obese Patients. Front. Endocrinol. 2022, 13, 847324. [Google Scholar] [CrossRef] [PubMed]
- Cizza, G.; de Jonge, L.; Piaggi, P.; Mattingly, M.; Zhao, X.; Lucassen, E.; Rother, K.I.; Sumner, A.E.; Csako, G.; the NIDDK Sleep Extension Study. Neck circumference is a predictor of metabolic syndrome and obstructive sleep apnea in short-sleeping obese men and women. Metab. Syndr. Relat. Disord. 2014, 12, 231–241. [Google Scholar] [CrossRef]
- Miras, A.D.; Kamocka, A.; Patel, D.; Dexter, S.; Finlay, I.; Hopkins, J.C.; Khan, O.; Reddy, M.; Sedman, P.; Small, P.; et al. Obesity surgery makes patients healthier and more functional: Real world results from the United Kingdom National Bariatric Surgery Registry. Surg. Obes. Relat. Dis. 2018, 14, 1033–1040. [Google Scholar] [CrossRef]
- Wyszomirski, K.; Walędziak, M.; Różańska-Walędziak, A. Obesity, Bariatric Surgery and Obstructive Sleep Apnea—A Narrative Literature Review. Medicina 2023, 59, 1266. [Google Scholar] [CrossRef]
- Walker, N.A.; Sunderram, J.; Zhang, P.; Lu, S.E.; Scharf, M.T. Clinical utility of the Epworth sleepiness scale. Sleep Breath. 2020, 24, 1759–1765. [Google Scholar] [CrossRef]
- Bonsignore, M.R.; Pepin, J.L.; Cibella, F.; Barbera, C.D.; Marrone, O.; Verbraecken, J.; Saaresranta, T.; Basoglu, O.K.; Trakada, G.; Bouloukaki, I.; et al. Excessive Daytime Sleepiness in Obstructive Sleep Apnea Patients Treated With Continuous Positive Airway Pressure: Data From the European Sleep Apnea Database. Front. Neurol. 2021, 12, 690008. [Google Scholar] [CrossRef]
- Gandhi, K.D.; Mansukhani, M.P.; Silber, M.H.; Kolla, B.P. Excessive Daytime Sleepiness: A Clinical Review. Mayo Clin. Proc. 2021, 96, 1288–1301. [Google Scholar] [CrossRef]
- Chiu, H.Y.; Chen, P.Y.; Chuang, L.P.; Chen, N.-H.; Tu, Y.-K.; Hsieh, Y.-J.; Wang, Y.-C.; Guilleminault, C. Diagnostic accuracy of the Berlin questionnaire, STOP-BANG, STOP, and Epworth sleepiness scale in detecting obstructive sleep apnea: A bivariate meta-analysis. Sleep Med. Rev. 2017, 36, 57–70. [Google Scholar] [CrossRef] [PubMed]
- Yang, H.; Watach, A.; Varrasse, M.; King, T.S.; Sawyer, A.M. Clinical Trial Enrollment Enrichment in Resource-Constrained Research Environments: Multivariable Apnea Prediction (MAP) Index in SCIP-PA Trial. J. Clin. Sleep Med. 2018, 14, 173–181. [Google Scholar] [CrossRef] [PubMed]
- Tan, A.; Yin, J.D.; Tan, L.W.; van Dam, R.M.; Cheung, Y.Y.; Lee, C.H. Using the Berlin Questionnaire to Predict Obstructive Sleep Apnea in the General Population. J. Clin. Sleep Med. 2017, 13, 427–432. [Google Scholar] [CrossRef] [PubMed]
- Tasbakan, M.S.; Gunduz, C.; Pirildar, S.; Basoglu, O.K. Quality of life in obstructive sleep apnea is related to female gender and comorbid insomnia. Sleep Breath. 2018, 22, 1013–1020. [Google Scholar] [CrossRef]
- Pivetta, B.; Chen, L.; Nagappa, M.; Saripella, A.; Waseem, R.; Englesakis, M.; Chung, F. Use and Performance of the STOP-Bang Questionnaire for Obstructive Sleep Apnea Screening Across Geographic Regions: A Systematic Review and Meta-Analysis. JAMA Netw. Open 2021, 4, e211009. [Google Scholar] [CrossRef]
- Neves Junior, J.A.S.; Fernandes, A.P.A.; Tardelli, M.A.; Yamashita, A.M.; Moura, S.M.P.G.T.; Tufik, S.; Silva, H.C.A.D. Cutoff points in STOP-Bang questionnaire for obstructive sleep apnea. Arq. Neuropsiquiatr. 2020, 78, 561–569. [Google Scholar] [CrossRef]
- Chung, F.; Abdullah, H.R.; Liao, P. STOP-Bang Questionnaire: A Practical Approach to Screen for Obstructive Sleep Apnea. Chest 2016, 149, 631–638. [Google Scholar] [CrossRef]
- Gottlieb, D.J. Screening for Obstructive Sleep Apnea in Adults. JAMA 2022, 328, 1908–1910. [Google Scholar] [CrossRef]
- US Preventive Services Task Force. Mangione, C.M.; Barry, M.J.; Nicholson, W.K.; Cabana, M.; Chelmow, D.; Coker, T.R.; Davidson, K.W.; Davis, E.M.; Donahue, K.E.; et al. Screening for Obstructive Sleep Apnea in Adults: US Preventive Services Task Force Recommendation Statement. JAMA 2022, 328, 1945–1950. [Google Scholar] [CrossRef]
- Faria, A.; Allen, A.H.; Fox, N.; Ayas, N.; Laher, I. The public health burden of obstructive sleep apnea. Sleep Sci. 2021, 14, 257–265. [Google Scholar] [CrossRef]
- Cheng, A.C.; Wu, G.J.; Chung, C.H.; Wu, K.-H.; Sun, C.-A.; Wang, I.-D.; Chien, W.-C. Effect of Obstructive Sleep Apnea on the Risk of Injuries—A Nationwide Population-Based Cohort Study. Int. J. Environ. Res. Public Health 2021, 18, 13416. [Google Scholar] [CrossRef] [PubMed]
- Borsoi, L.; Armeni, P.; Donin, G.; Costa, F.; Ferini-Strambi, L. The invisible costs of obstructive sleep apnea (OSA): Systematic review and cost-of-illness analysis. PLoS ONE 2022, 17, e0268677. [Google Scholar] [CrossRef] [PubMed]
- Berry, R.B.; Budhiraja, R.; Gottlieb, D.J.; Gozal, D.; Iber, C.; Kapur, V.K.; Marcus, C.L.; Mehra, R.; Parthasarathy, S.; Quan, S.F.; et al. Rules for scoring respiratory events in sleep: Update of the 2007 AASM Manual for the Scoring of Sleep and Associated Events. Deliberations of the Sleep Apnea Definitions Task Force of the American Academy of Sleep Medicine. J. Clin. Sleep Med. 2012, 8, 597–619. [Google Scholar] [CrossRef] [PubMed]
- Rodriguez-Villegas, E.; Chen, G.; Radcliffe, J.; Duncan, J. A pilot study of a wearable apnoea detection device. BMJ Open 2014, 4, e005299. [Google Scholar] [CrossRef]
- Ernst, G.; Dalzotto, P.; Saban, M.; Ferraro, F.M.; Salvado, A.; Borsini, E.E. The Cervical Fat Tissue Volume is a Predictor for Moderate to Severe OSA. Sleep Sci. 2023, 16, e323–e328. [Google Scholar] [CrossRef]
- Turnbull, C.D.; Wang, S.H.; Manuel, A.R.; Keenan, B.T.; McIntyre, A.G.; Schwab, R.J.; Stradling, J.R. Relationships between MRI fat distributions and sleep apnea and obesity hypoventilation syndrome in very obese patients. Sleep Breath. 2018, 22, 673–681. [Google Scholar] [CrossRef]
- Chiang, J.K.; Lin, Y.C.; Lu, C.M.; Kao, Y.H. Snoring Index and Neck Circumference as Predictors of Adult Obstructive Sleep Apnea. Healthcare 2022, 10, 2543. [Google Scholar] [CrossRef]
- Loh, J.M.-R.; Toh, S.-T. Rethinking neck circumference in STOP-BANG for Asian OSA. Proc. Singap. Health 2019, 28, 105–109. [Google Scholar] [CrossRef]
- Liria-Domínguez, R.; Pérez-Albela, M.; Vásquez, M.P.; Gómez, G.; Kovalskys, I.; Fisberg, M.; Cortés, L.Y.; García, M.C.Y.; Herrera-Cuenca, M.; Rigotti, A.; et al. Correlation between Neck Circumference and Other Anthropometric Measurements in Eight Latin American Countries. Results from ELANS Study. Int. J. Environ. Res. Public Health 2021, 18, 11975. [Google Scholar] [CrossRef]
- Espinoza López, P.A.; Fernández Landeo, K.J.; Pérez Silva Mercado, R.R.; Quiñones Ardela, J.J.; Carrillo-Larco, R.M. Neck circumference in Latin America and the Caribbean: A systematic review and meta-analysis. Wellcome Open Res. 2021, 6, 13. [Google Scholar] [CrossRef]
- Nagappa, M.; Liao, P.; Wong, J.; Auckley, D.; Ramachandran, S.K.; Memtsoudis, S.; Mokhlesi, B.; Chung, F. Validation of the STOP-Bang Questionnaire as a Screening Tool for Obstructive Sleep Apnea among Different Populations: A Systematic Review and Meta-Analysis. PLoS ONE 2015, 10, e0143697. [Google Scholar] [CrossRef] [PubMed]
- Garzon, S.B.A.; Muñoz-Velandia, O.M.; Ruiz, A.J.; Martínez, P.H.; Otero, L. Cut-off points of neck and waist circumference as predictors of obstructive sleep apnea in the Colombian population: A comparison with polysomnography. Sao Paulo Med. J. 2023, 142, e2022415. [Google Scholar] [CrossRef] [PubMed]
- Coutinho Costa, J.; Rebelo-Marques, A.; Machado, J.N.; Gama, J.; Santos, C.; Teixeira, F.; Moita, J. Validation of NoSAS (Neck, Obesity, Snoring, Age, Sex) score as a screening tool for obstructive sleep apnea: Analysis in a sleep clinic. Pulmonology 2019, 25, 263–270. [Google Scholar] [CrossRef] [PubMed]
- Mazzotti, D.R.; Keenan, B.T.; Lim, D.C.; Gottlieb, D.J.; Kim, J.; Pack, A.I. Symptom Subtypes of Obstructive Sleep Apnea Predict Incidence of Cardiovascular Outcomes. Am. J. Respir. Crit. Care Med. 2019, 200, 493–506. [Google Scholar] [CrossRef]
- Chaidas, K.; Lamprou, K.; Stradling, J.R.; Nickol, A.H. Association between Patient- and Partner-Reported Sleepiness Using the Epworth Sleepiness Scale in Patients with Obstructive Sleep Apnoea. Life 2022, 12, 1523. [Google Scholar] [CrossRef]
- Scharf, M.T. Reliability and Efficacy of the Epworth Sleepiness Scale: Is There Still a Place for It? Nat. Sci. Sleep 2022, 14, 2151–2156. [Google Scholar] [CrossRef]
- Lapin, B.R.; Bena, J.F.; Walia, H.K.; Moul, D.E. The Epworth Sleepiness Scale: Validation of One-Dimensional Factor Structure in a Large Clinical Sample. J. Clin. Sleep Med. 2018, 14, 1293–1301. [Google Scholar] [CrossRef]
- Mazzotti, D.R.; Keenan, B.T.; Thorarinsdottir, E.H.; Gislason, T.; Pack, A.I.; Sleep Apnea Global Interdisciplinary Consortium. Is the Epworth Sleepiness Scale Sufficient to Identify the Excessively Sleepy Subtype of OSA? Chest 2022, 161, 557–561. [Google Scholar] [CrossRef]
- Viswanath, A.; Ramamurthy, J.; Dinesh, S.P.; Srinivas, A. Obstructive sleep apnea: Awakening the hidden truth. Niger. J. Clin. Pract. 2015, 18, 1–7. [Google Scholar] [CrossRef]
- Amra, B.; Pirpiran, M.; Soltaninejad, F.; Penzel, T.; Fietze, I.; Schoebel, C. The prediction of obstructive sleep apnea severity based on anthropometric and Mallampati indices. J. Res. Med. Sci. 2019, 24, 66. [Google Scholar] [CrossRef]
- Deflandre, E.; Degey, S.; Brichant, J.F.; Poirrier, R.; Bonhomme, V. Development and Validation of a Morphologic Obstructive Sleep Apnea Prediction Score: The DES-OSA Score. Anesth. Analg. 2016, 122, 363–372. [Google Scholar] [CrossRef]
- Sahin, M.; Bilgen, C.; Tasbakan, M.S.; Midilli, R.; Basoglu, O.K. A clinical prediction formula for apnea-hypopnea index. Int. J. Otolaryngol. 2014, 2014, 438376. [Google Scholar] [CrossRef]


| Number of Patients: 200 | |
|---|---|
| Men/Women, n (%) | 130 (65)/70 (35) |
| Age, years | 54 (13) |
| Smoking habits, n (%) | Nonsmokers: 92 (46) |
| Smokers: 74 (37) | |
| Former smokers: 34 (17) | |
| T2DM, n (%) | 80 (40) |
| Hypertension, n (%) | 110 (55) |
| Dyslipidemia, n (%) | 24 (12) |
| GERD, n (%) | 86 (43) |
| Heart failure, n (%) | 6 (3) |
| BMI, kg/m2 | 34 ± 9 |
| NC, cm | 42 ± 4 |
| Snoring, n (%) | 190 (95) |
| Reported apneas, n (%) | 50 (25) |
| ESS | 9 ± 5 |
| AHI, events per hour | 25 ± 14 |
| Independent Variable | β Coefficient | OR (95% CI) | p Value |
|---|---|---|---|
| NC | 2.312 | 1.67 (1.55–1.81) | <0.001 |
| ESS | 0.925 | 2.24 (2.00–2.50) | <0.001 |
| BMI | 1.784 | 1.53 (1.34–1.72) | 0.002 |
| Age | 0.298 | 1.03 (1.01–1.05) | 0.015 |
| Sex | 1.364 | 1.18 (0.97–1.42) | 0.087 |
| Smoking habits | 0.542 | 1.10 (0.92–1.32) | 0.213 |
| Independent Variable | β Coefficient | OR (95% CI) | p Value |
|---|---|---|---|
| Intercept | −70.498 | - | |
| NC | 2.196 | 1.47 (1.34–1.61) | <0.001 |
| ESS | 0.809 | 2.06 (1.81–2.34) | <0.001 |
| Sex | 1.253 | 1.15 (0.92–1.43) | 0.217 |
| Age | 0.298 | 1.01 (0.86–1.13) | 0.138 |
| BMI | 0.874 | 1.12 (0.97–1.29) | 0.101 |
| Smoking habits | 0.462 | 1.08 (0.89–1.30) | 0.345 |
| Number of Patients: 53 | |
|---|---|
| Men/Women, n (%) | 41 (77)/12 (23) |
| Age, years | 62 ± 15 |
| Nonsmokers: 19 (36) | |
| Smoking habits, n (%) | Smokers: 21 (40) |
| Former smokers: 13 (24) | |
| T2DM, n (%) | 25 (47) |
| Hypertension, n (%) | 40 (75) |
| Dyslipidemia, n (%) | 18 (34) |
| GERD, n (%) | 31 (58) |
| BMI, kg/m2 | 32 ± 8 |
| NC, cm | 43 ± 4 |
| ESS | 9 ± 5 |
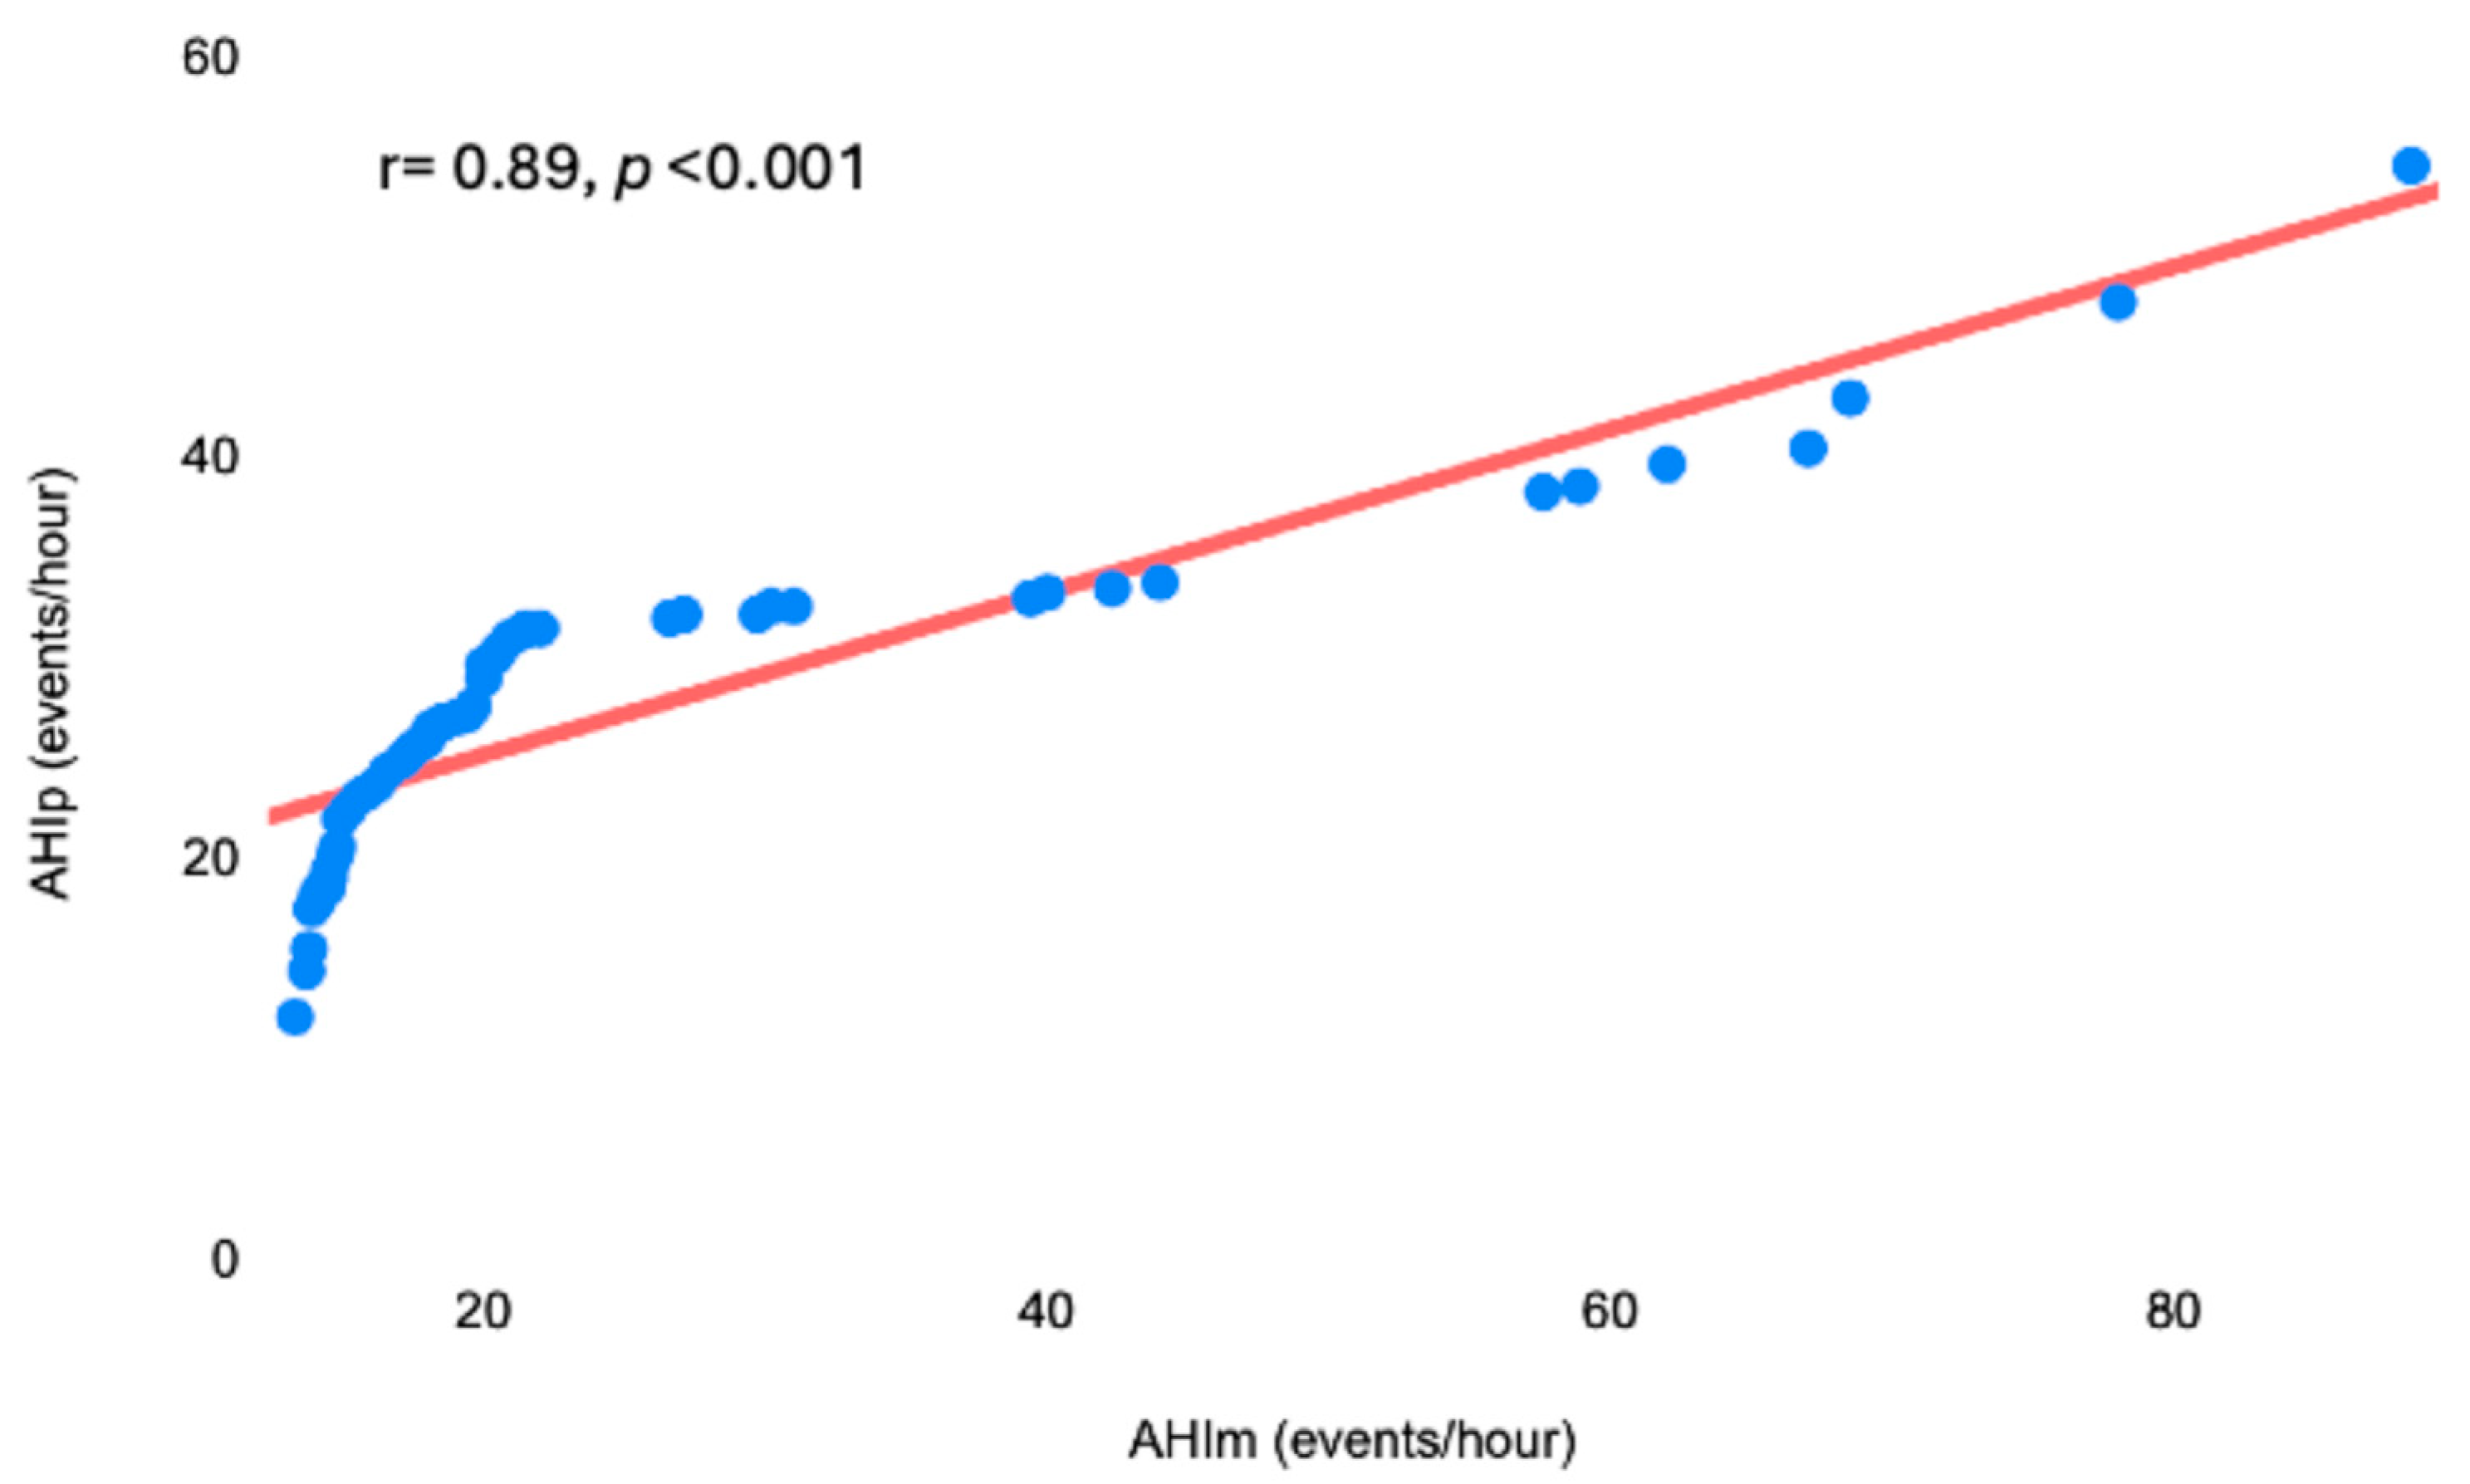
| AHIm, events per hour | 27 ± 14 |
| AHIp, events per hour | 28 ± 16 |
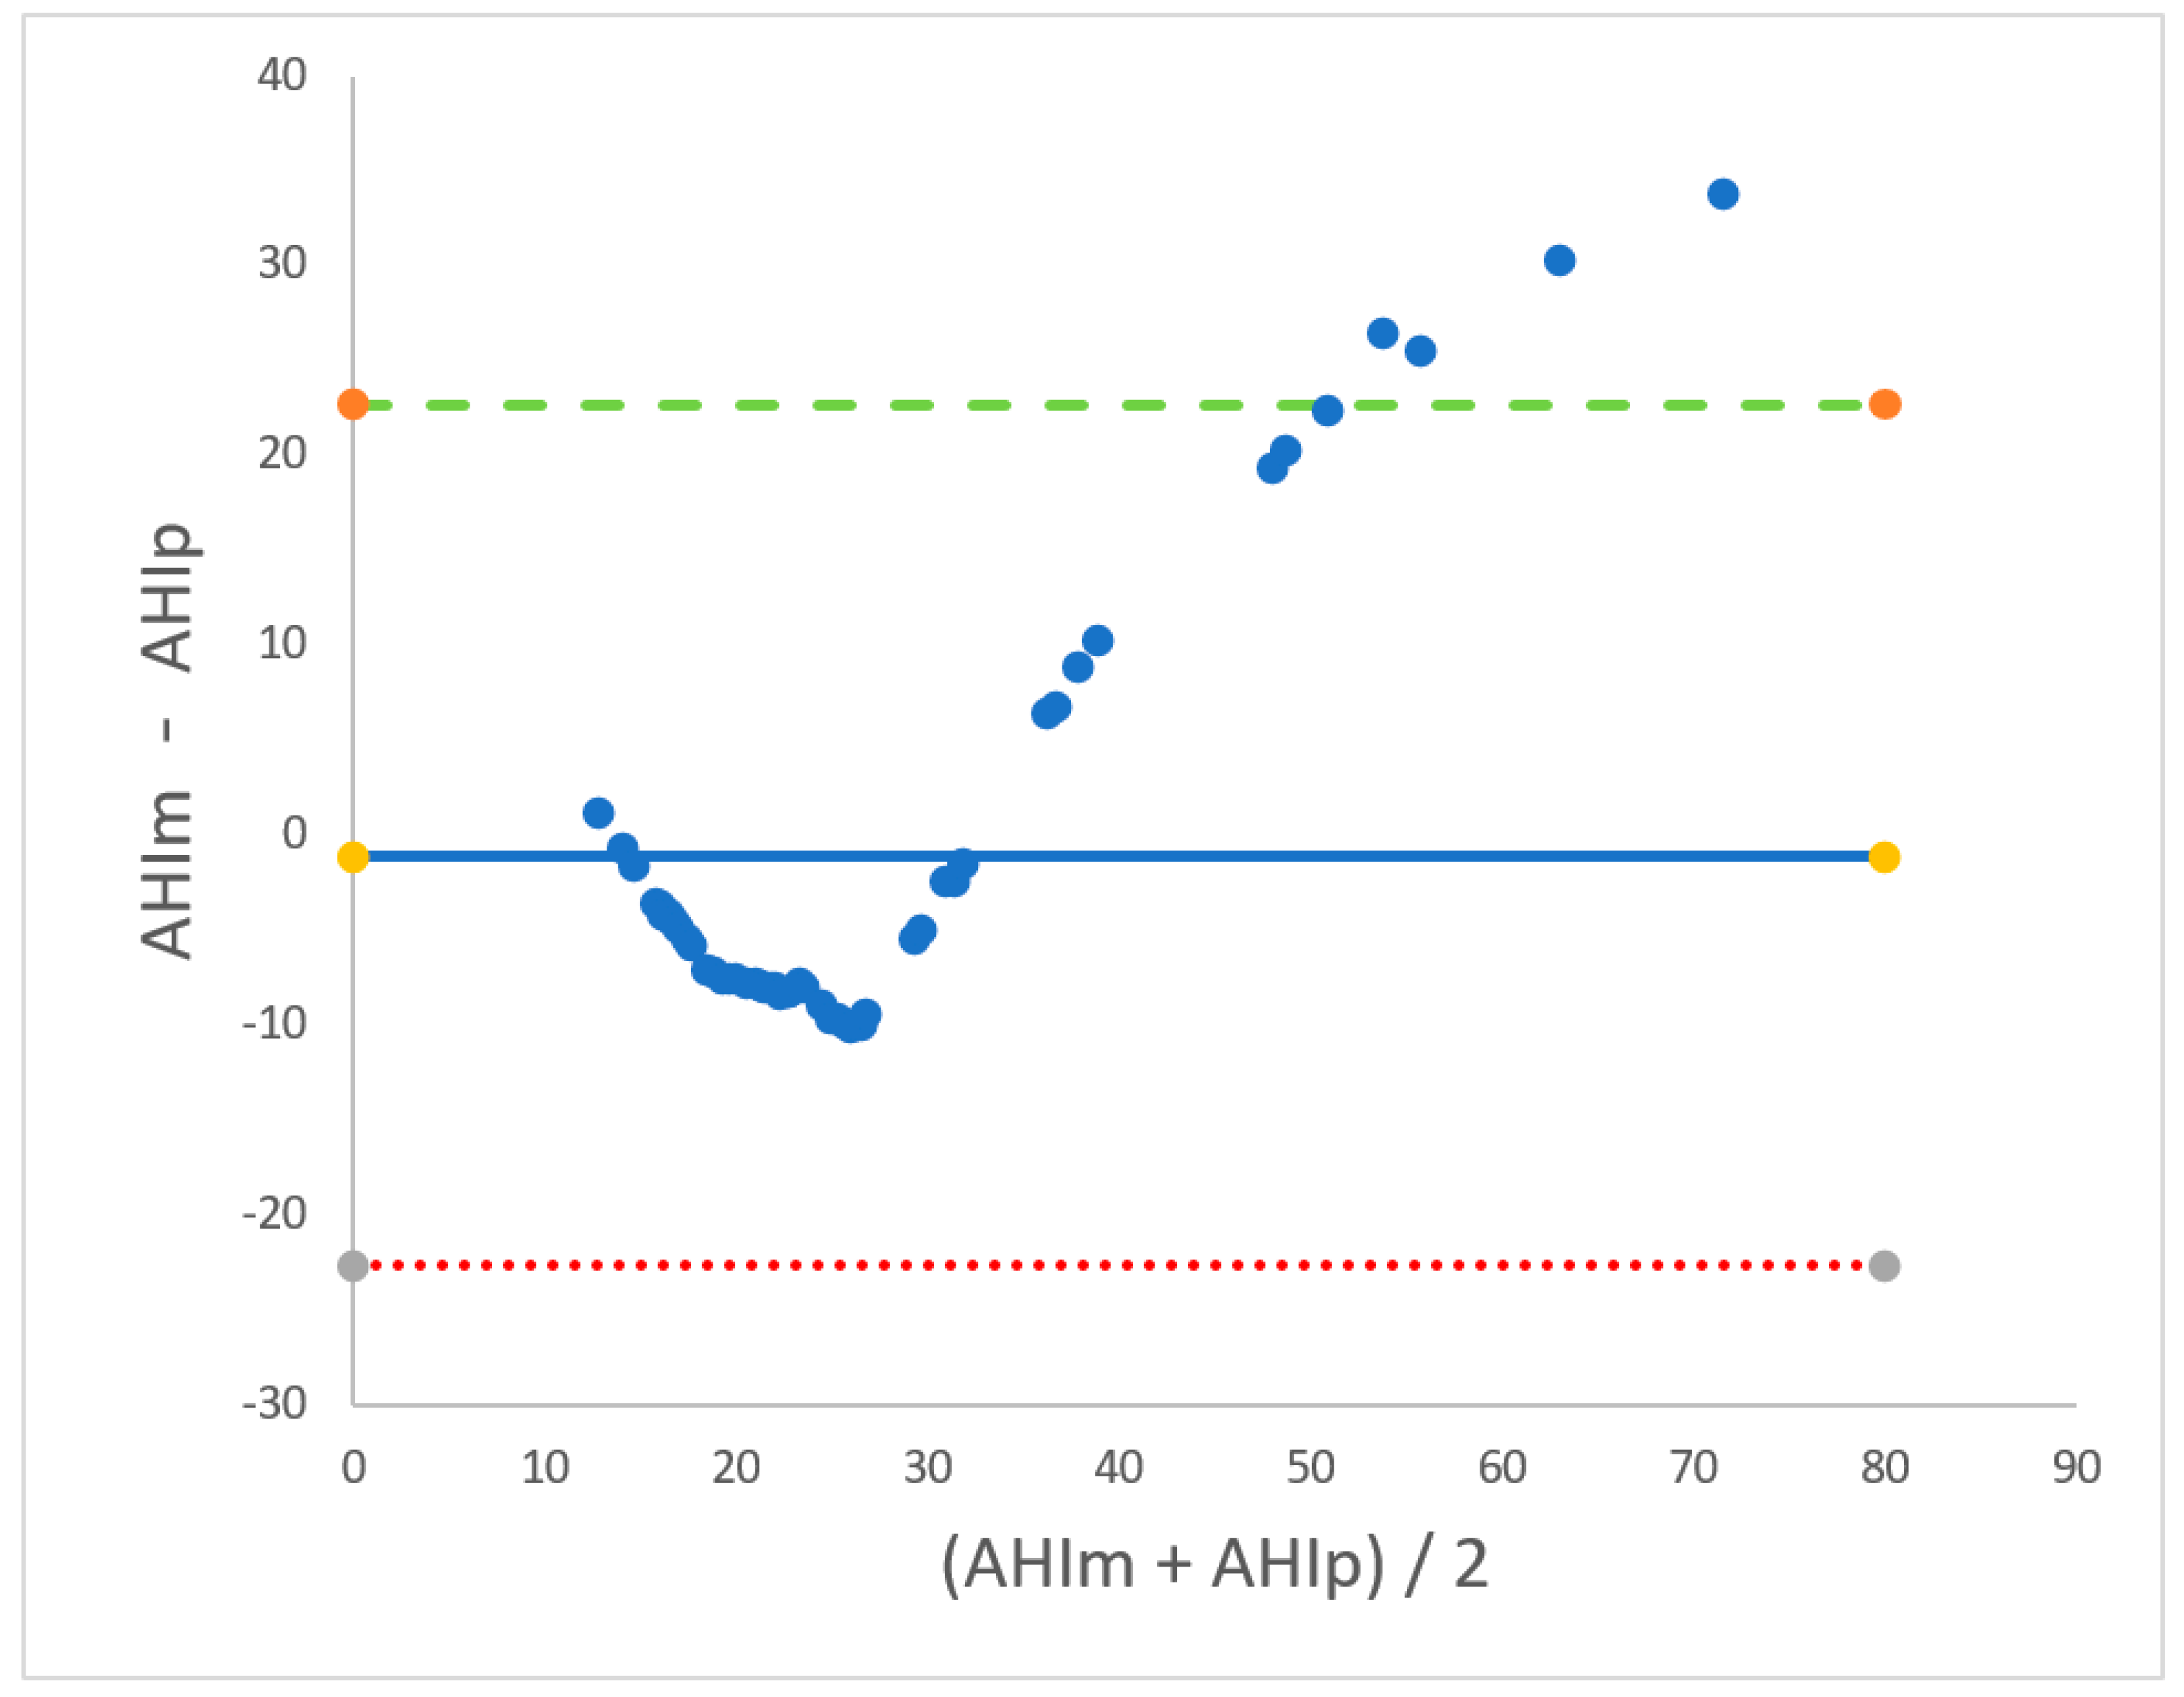
| AHIm < 20 Events/Hour | 20 ≤ AHIm ≤ 40 Events/Hour | AHIm > 40 Events/Hour | |
|---|---|---|---|
| Bias, events/hour | 6.25 | 4.85 | −22 |
| Lower LoA, events/hour | 1.14 | −6.9 | −38.3 |
| Upper LoA, events/hour | 11.3 | 16.6 | −5–5 |
| R2 | 0.91 | 0.81 | 0.95 |
Disclaimer/Publisher’s Note: The statements, opinions and data contained in all publications are solely those of the individual author(s) and contributor(s) and not of MDPI and/or the editor(s). MDPI and/or the editor(s) disclaim responsibility for any injury to people or property resulting from any ideas, methods, instructions or products referred to in the content. |
© 2025 by the authors. Licensee MDPI, Basel, Switzerland. This article is an open access article distributed under the terms and conditions of the Creative Commons Attribution (CC BY) license (https://creativecommons.org/licenses/by/4.0/).
Share and Cite
Fabozzi, A.; Steffanina, A.; Bonini, M.; Palange, P. Development and Validation of a Screening Equation for Obstructive Sleep Apnea. Diagnostics 2025, 15, 427. https://doi.org/10.3390/diagnostics15040427
Fabozzi A, Steffanina A, Bonini M, Palange P. Development and Validation of a Screening Equation for Obstructive Sleep Apnea. Diagnostics. 2025; 15(4):427. https://doi.org/10.3390/diagnostics15040427
Chicago/Turabian StyleFabozzi, Antonio, Alessia Steffanina, Matteo Bonini, and Paolo Palange. 2025. "Development and Validation of a Screening Equation for Obstructive Sleep Apnea" Diagnostics 15, no. 4: 427. https://doi.org/10.3390/diagnostics15040427
APA StyleFabozzi, A., Steffanina, A., Bonini, M., & Palange, P. (2025). Development and Validation of a Screening Equation for Obstructive Sleep Apnea. Diagnostics, 15(4), 427. https://doi.org/10.3390/diagnostics15040427