Article

Exploring Fat Fraction and Vertebral Bone Quality Score in Lumbar Spine Magnetic Resonance Imaging: A Cross-Sectional Study on Associations and Clinical Implication

1
Department of Radiology, Ajou University School of Medicine, Suwon 16499, Republic of Korea
2
Musculoskeletal Imaging Laboratory, Ajou University Medical Center, Suwon 16499, Republic of Korea
3
Philips Healthcare, Seoul 04637, Republic of Korea
4
Department of Radiology, College of Medicine, Inha University, Incheon 22332, Republic of Korea
*
Author to whom correspondence should be addressed.
Diagnostics 2025, 15(4), 503; https://doi.org/10.3390/diagnostics15040503
Submission received: 4 February 2025 / Revised: 12 February 2025 / Accepted: 17 February 2025 / Published: 19 February 2025
(This article belongs to the Special Issue Imaging in Muscle and Bone Diseases)

Abstract

:
Background/Objectives: While gradient-echo (GRE)-based chemical shift-encoded magnetic resonance imaging (CSE-MRI) offers precise method for measuring adiposity in bone marrow, its limitation lies in the need for additional imaging. On the other hand, spin-echo (SE)-based CSE-MRI can seamlessly integrate into conventional protocols. Recently, a novel technique called the vertebral bone quality (VBQ) score has been introduced. The objective of this study was to investigate the association between fat fraction (FF) measured by GRE-based CSE-MRI (FFGRE) and FF measured by SE-based CSE-MRI (FFSE) or the VBQ score. Methods: A retrospective study with 344 patients assessed the correlation between FF and the VBQ score and each measurement’s correlation with age using Pearson’s correlation (r). Concordance between FFGRE and FFSE was assessed using Lin’s concordance correlation coefficient (ρc). Vertebral lesions (n = 41) were categorized as benign and malignant, and the Mann–Whitney U test was used for comparison. Results: FFGRE demonstrated strong positive correlations with FFSE and the VBQ score (r = 0.861 and 0.708, respectively). However, the concordance between FFGRE and FFSE was poor (ρc = 0.295). All measurements moderately correlated with age (FFGRE, r = 0.583; FFSE, r = 0.477; VBQ score, r = 0.468). FF was significantly higher in benign lesions (FFGRE, p = 0.004; FFSE, p = 0.007), while the VBQ score did not show statistically significant differences between the two groups (p = 0.089). Conclusions: FFGRE exhibited a high correlation with the VBQ score. FFSE showed a strong correlation with FFGRE, but replacing FFGRE with FFSE may be challenging. Both FF and the VBQ score moderately correlated with age. FF demonstrated statistically significant differences between benign and malignant lesions, while the VBQ score did not provide a distinguishable separation.

1. Introduction

Bone marrow adipose tissue (BMAT) is a crucial organ that influences not only hematopoiesis but also plays a significant role in the areas of immune function, paracrine signaling, and endocrine regulation [1,2,3]. Adipogenesis in the bone marrow can undergo changes based in the body’s conditions, such as aging, menopause, diabetes mellitus, anorexia nervosa, hematopoietic disease, osteoporosis, and other health-related factors [1,2,3,4,5]. Therefore, assessing the quantity of BMAT can serve as a clue to estimate the body’s condition.
Chemical shift-encoded magnetic resonance imaging (CSE-MRI) is a technique that allows for the generation of four different images (in-phase, out-of-phase, water-only, and fat-only) in a single acquisition. In addition, gradient-echo (GRE)-based CSE-MRI can easily measure the quantity of BMAT by creating a fat fraction (FF) map [6]. It is well known that there are many confounding factors when calculating the signal of water or fat using CSE-MRI. For example, trabecular bone shortens the T2* of water and fat components, making it difficult to separate water and fat signals. Therefore, correcting for T2* decay is crucial when quantifying fat in bone marrow [7]. The smaller signals from peaks other than the largest peak at −3.5 ppm in the fat spectrum are easily overlooked [7]. The T1 bias resulting from the difference in T1 relaxation times between water and fat also acts as a confounding factor [8]. The FF measured using multi-echo GRE-based CSE-MRI, by correcting for these confounding factors, has been reported to closely match results obtained from magnetic resonance spectroscopy, which is known for its high accuracy [9,10]. There have been studies aiming to apply FF measurements in various fields, such as estimating osteoporosis [11,12] or distinguishing between benign and malignant lesions [13,14]. However, GRE-based CSE-MRI comes with the inconvenience of requiring additional imaging beyond conventional MRI.
Spin-echo (SE)-based CSE-MRI can be utilized with conventional sequences due to its higher signal-to-noise ratio [15]. Furthermore, SE-based CSE-MRI has the advantage of achieving homogeneous fat suppression and reducing imaging time. This technique also generates the same four image sets as GRE-based CSE-MRI (in-phase, out-of-phase, water-only and fat-only), and, although it does not fully correct for confounding factors, it theoretically allows for the creation of a fat fraction map for measuring BMAT. Therefore, despite various limitations, we hypothesized that the fat fraction measured by SE-based CSE-MRI could potentially replace GRE-based CSE MRI.
Recently, a method called the vertebral bone quality (VBQ) score has been devised for assessing bone density using MRI [16,17,18,19,20,21,22]. This method estimates bone density through the utilization of an increase in T1 signal intensity associated with the escalation of BMAT in osteoporosis, using MRI, and shares similarities in principle with FF assessment. However, to the best of our knowledge, the relationship between FF and the VBQ score has not been directly compared. Additionally, despite using the same principle, the VBQ score has not been utilized for differentiating benign and malignant lesions. If the VBQ score has the ability to differentiate between the two lesions, it could serve as an additional tool for distinguishing indeterminate lesions and providing diagnostic confidence when conventional imaging alone is insufficient. Therefore, in our study, we aimed to use GRE-based CSE-MRI as the gold standard to investigate the relationship between SE-based CSE-MRI or the VBQ score. We investigated whether there is a correlation with aging for the three techniques and explored their ability to distinguish between benign and malignant lesions.

2. Materials and Methods

2.1. Patient Selection

This retrospective study was approved by our institutional review board, and the requirement for informed consent was waived. Between January 2021 and February 2022, patients who underwent lumbar spine MRI were included in the study. The inclusion criteria were patients who underwent MRI that included both GRE- and SE-based CSE-MRI as well as T1-weighted images. The exclusion criteria were as follows: (1) errors in GRE- or SE-based CSE-MRI; (2) history of hematopoietic diseases; (3) structural abnormalities in two or more vertebra due to fracture, severe degeneration, infection, tumor or previous surgery; (4) previous radiation treatment.

2.2. Magnetic Resonance Imaging

The lumbar spine MRI was conducted using a 3-T MRI scanner (Ingenia Elition X, Philips Healthcare, Best, The Netherlands). Initially, conventional MRI was obtained, including sagittal T1-weighted SE (repetition time [TR]/echo time [TE], 400–650 ms/10–15 ms) and flexible 2-point sagittal mDixon-XD T2-weighted SE (TR/echo spacing/delta TE, 2000–2900 ms/90–100 ms/6 ms). The other parameters of sagittal images were as follows: field of view (FOV), 280 × 280 mm; matrix, 280 × 240–510 × 310; section thickness, 3.5 mm; intersection gap, 0.5–0.35 mm. Axial T1-weighted SE (TR/TE, 500–720 ms/10 ms) and T2-weighted SE (TR/TE, 3300–5600 ms/80–120 ms) were also included, and the parameters were as follows: FOV, 240 × 240 mm; matrix, 340–370 × 330–370; section thickness, 4 mm; intersection gap, 0.4 mm.
Subsequently, 3D GRE-modified CSE-MRI (mDixon Quant, Philips Healthcare, Best, The Netherlands) were obtained. The imaging parameters were as follows: TR, 8 ms; six TEs (echo spacing/delta TE, 1.26 ms/1.0 ms); flip angle, 3°, FOV, 280 × 280 mm; matrix, 192 × 192; section thickness, 3.85 mm; intersection gap, 0 mm. Following acquisition, each image was reconstructed automatically and simultaneously into the FF map.

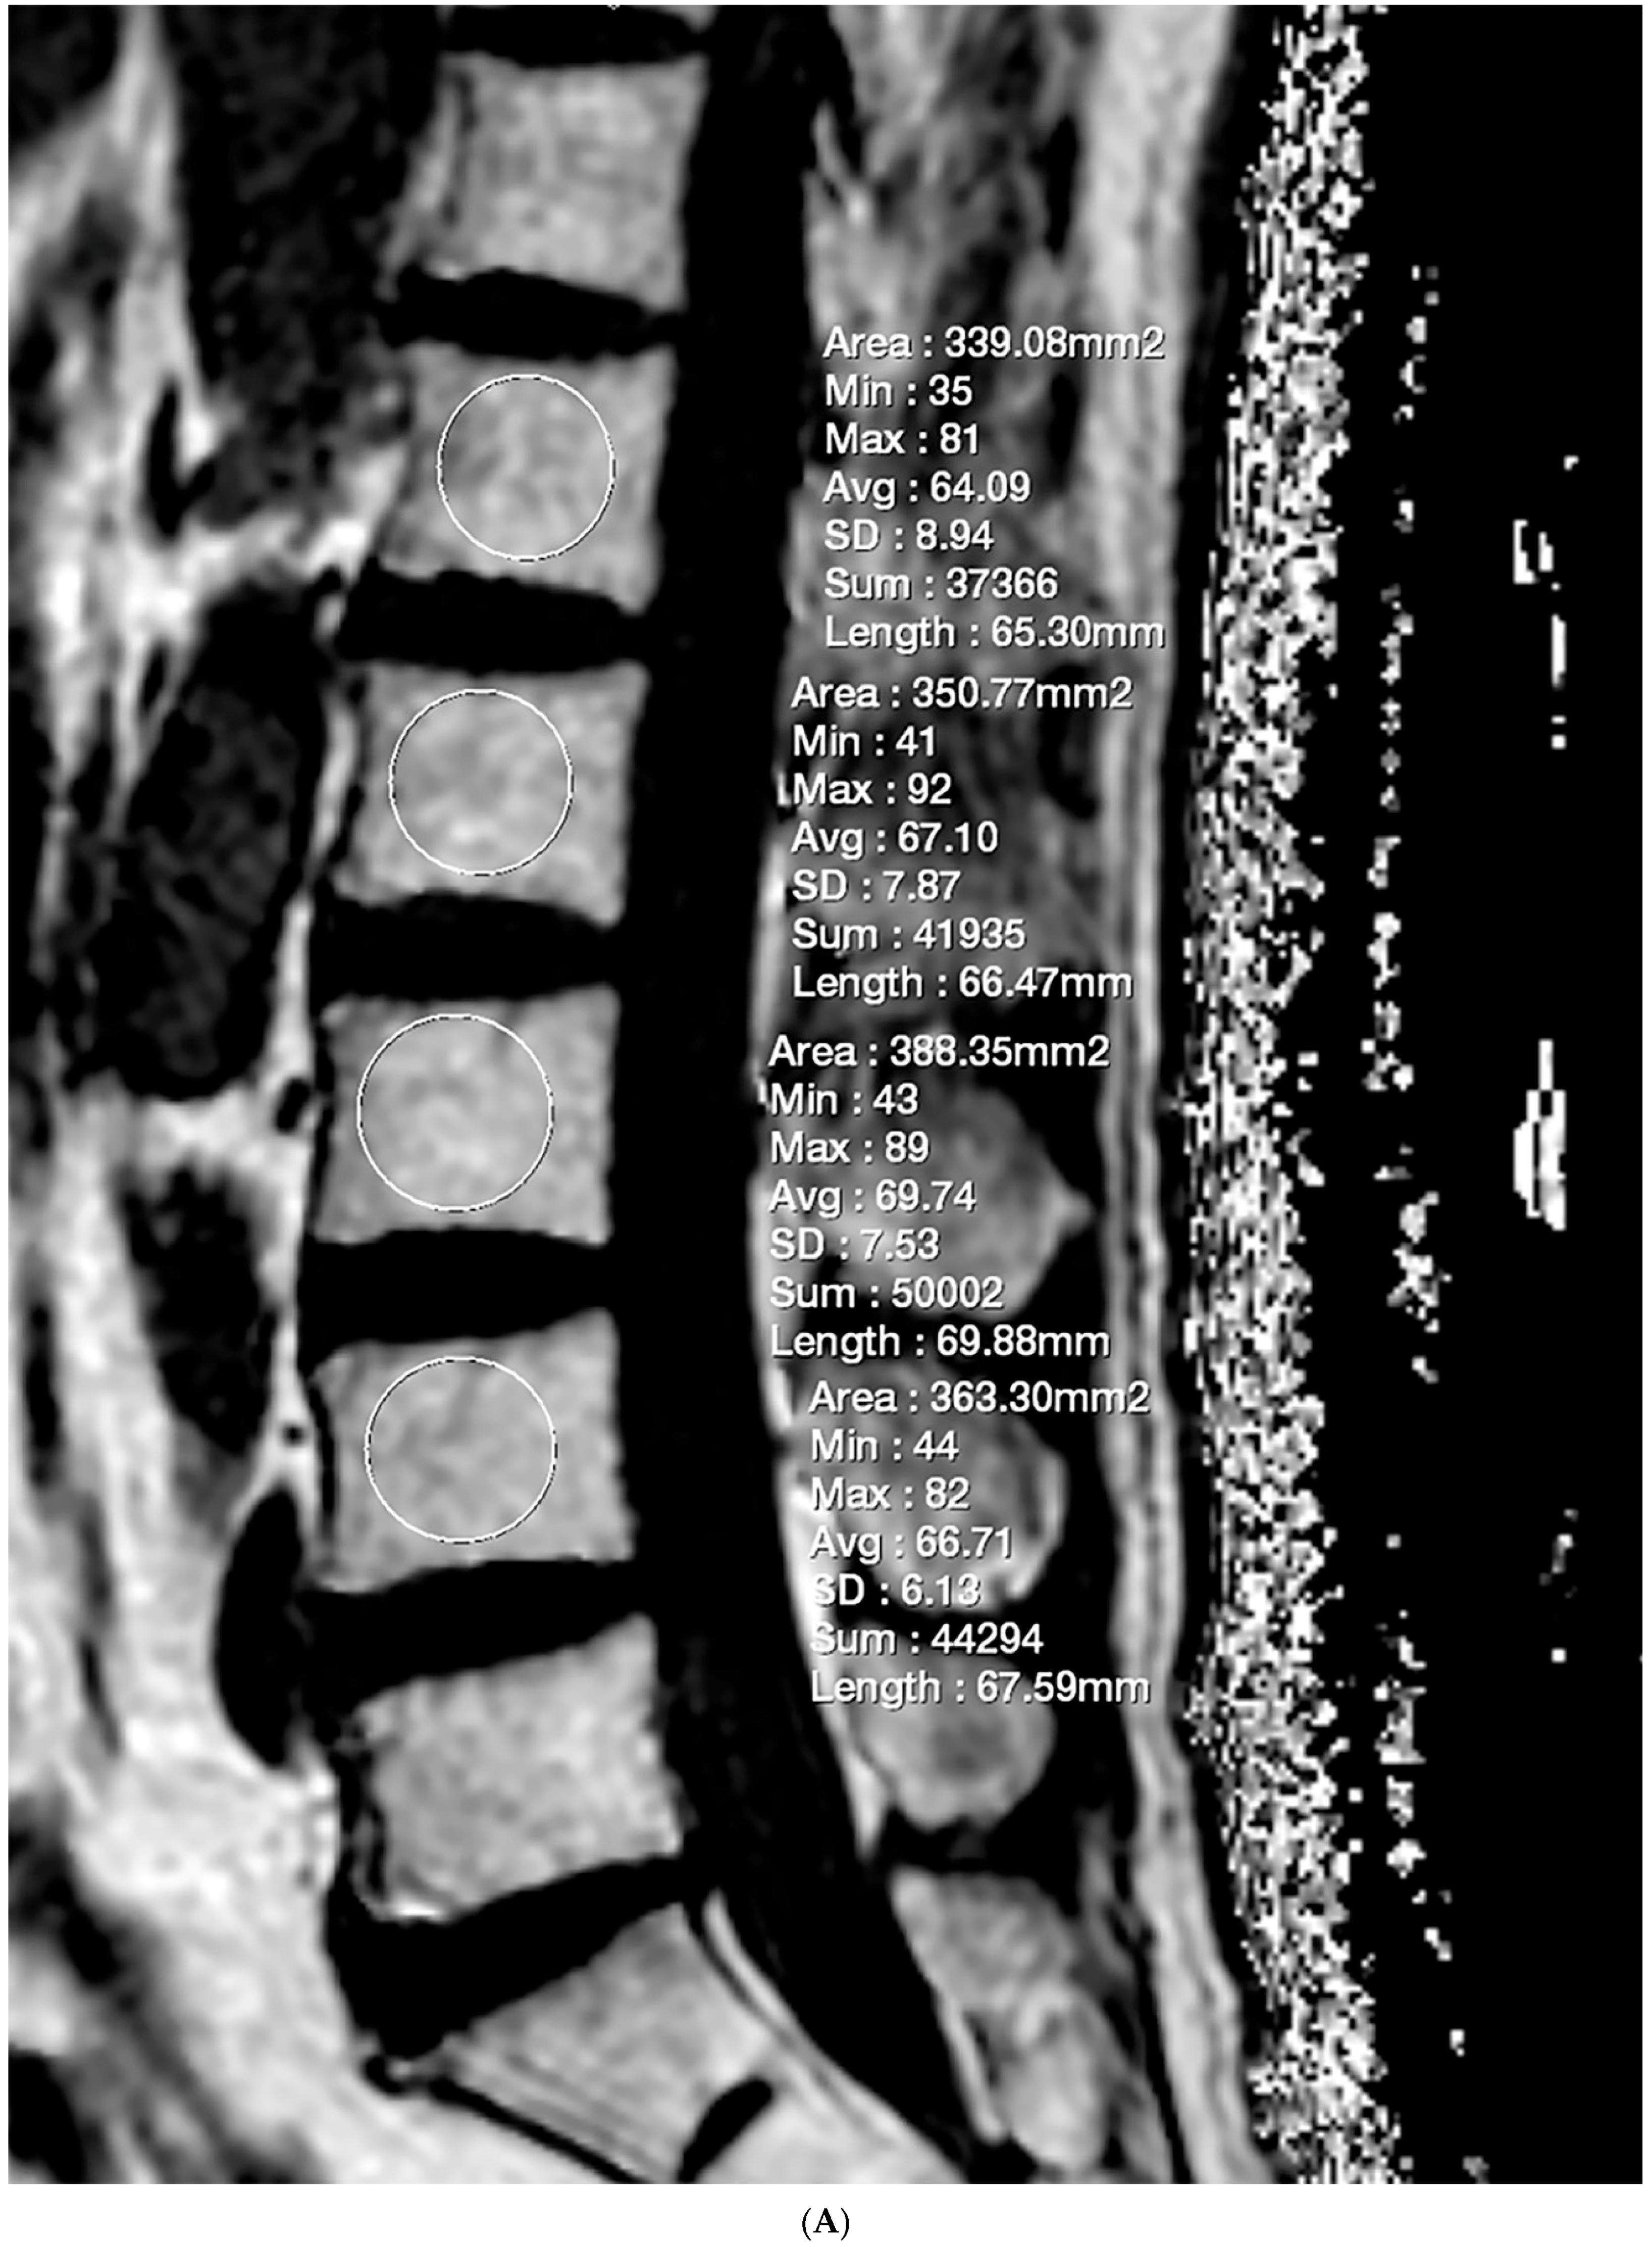
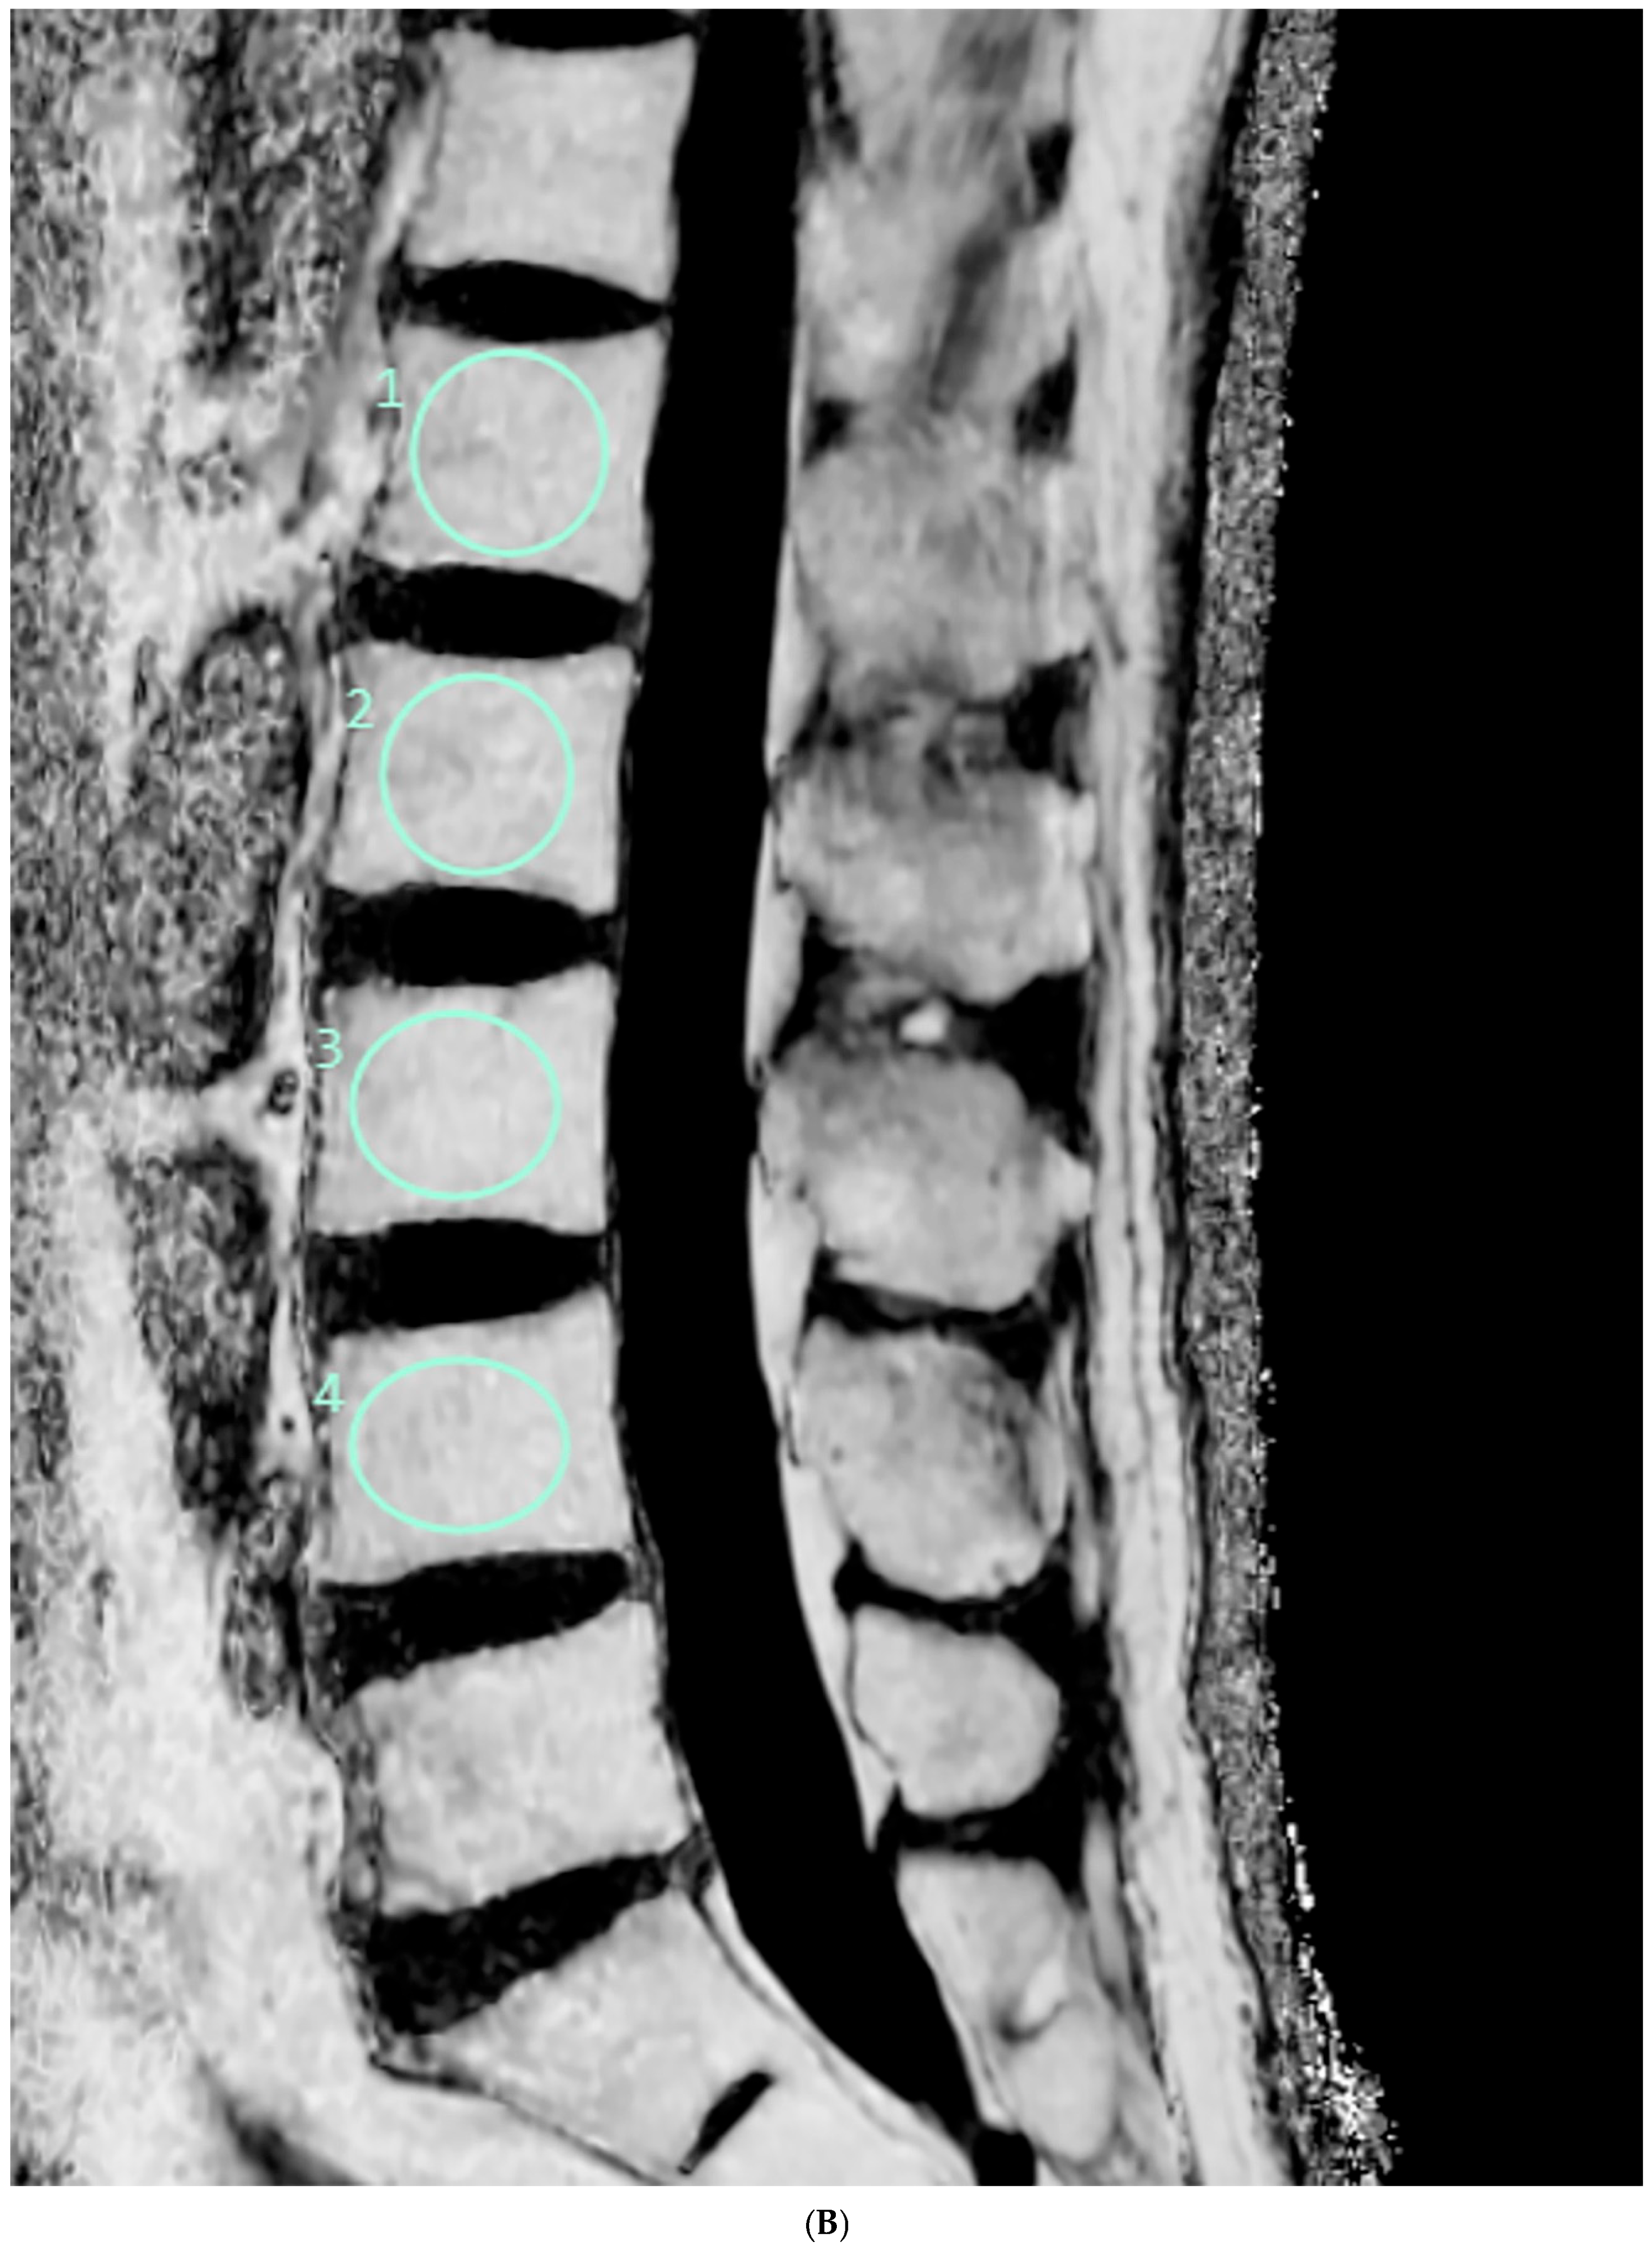
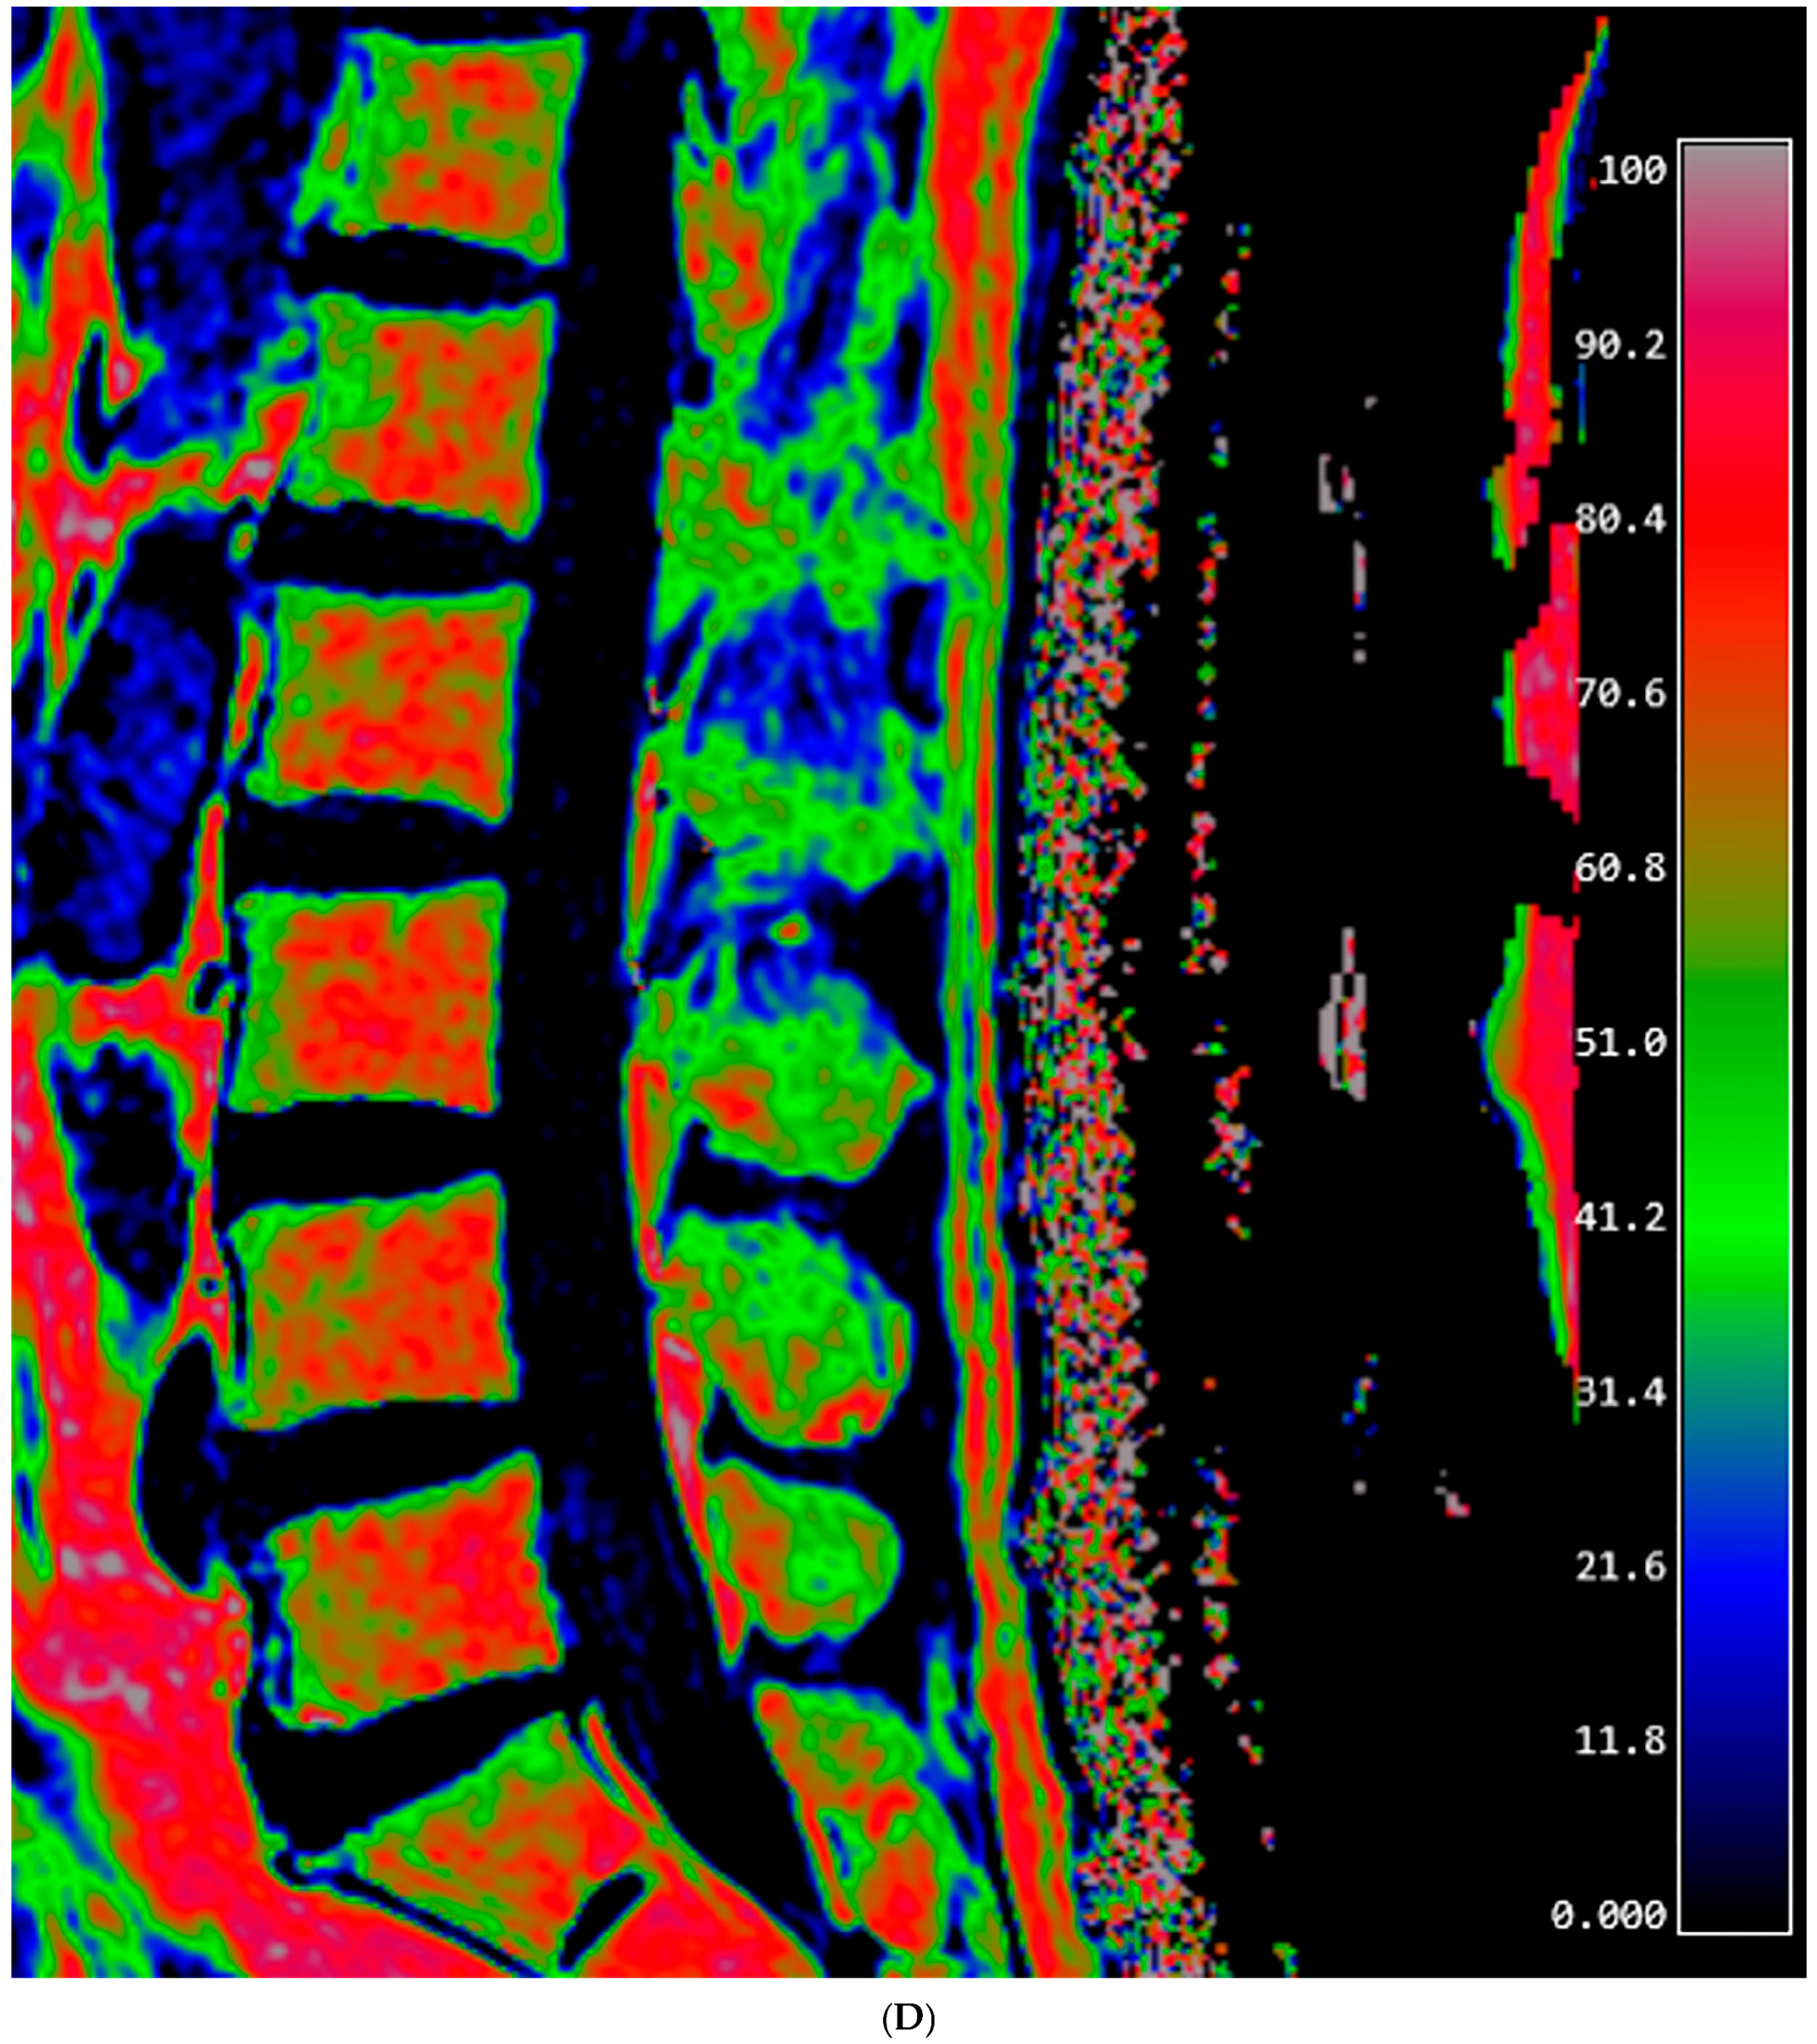
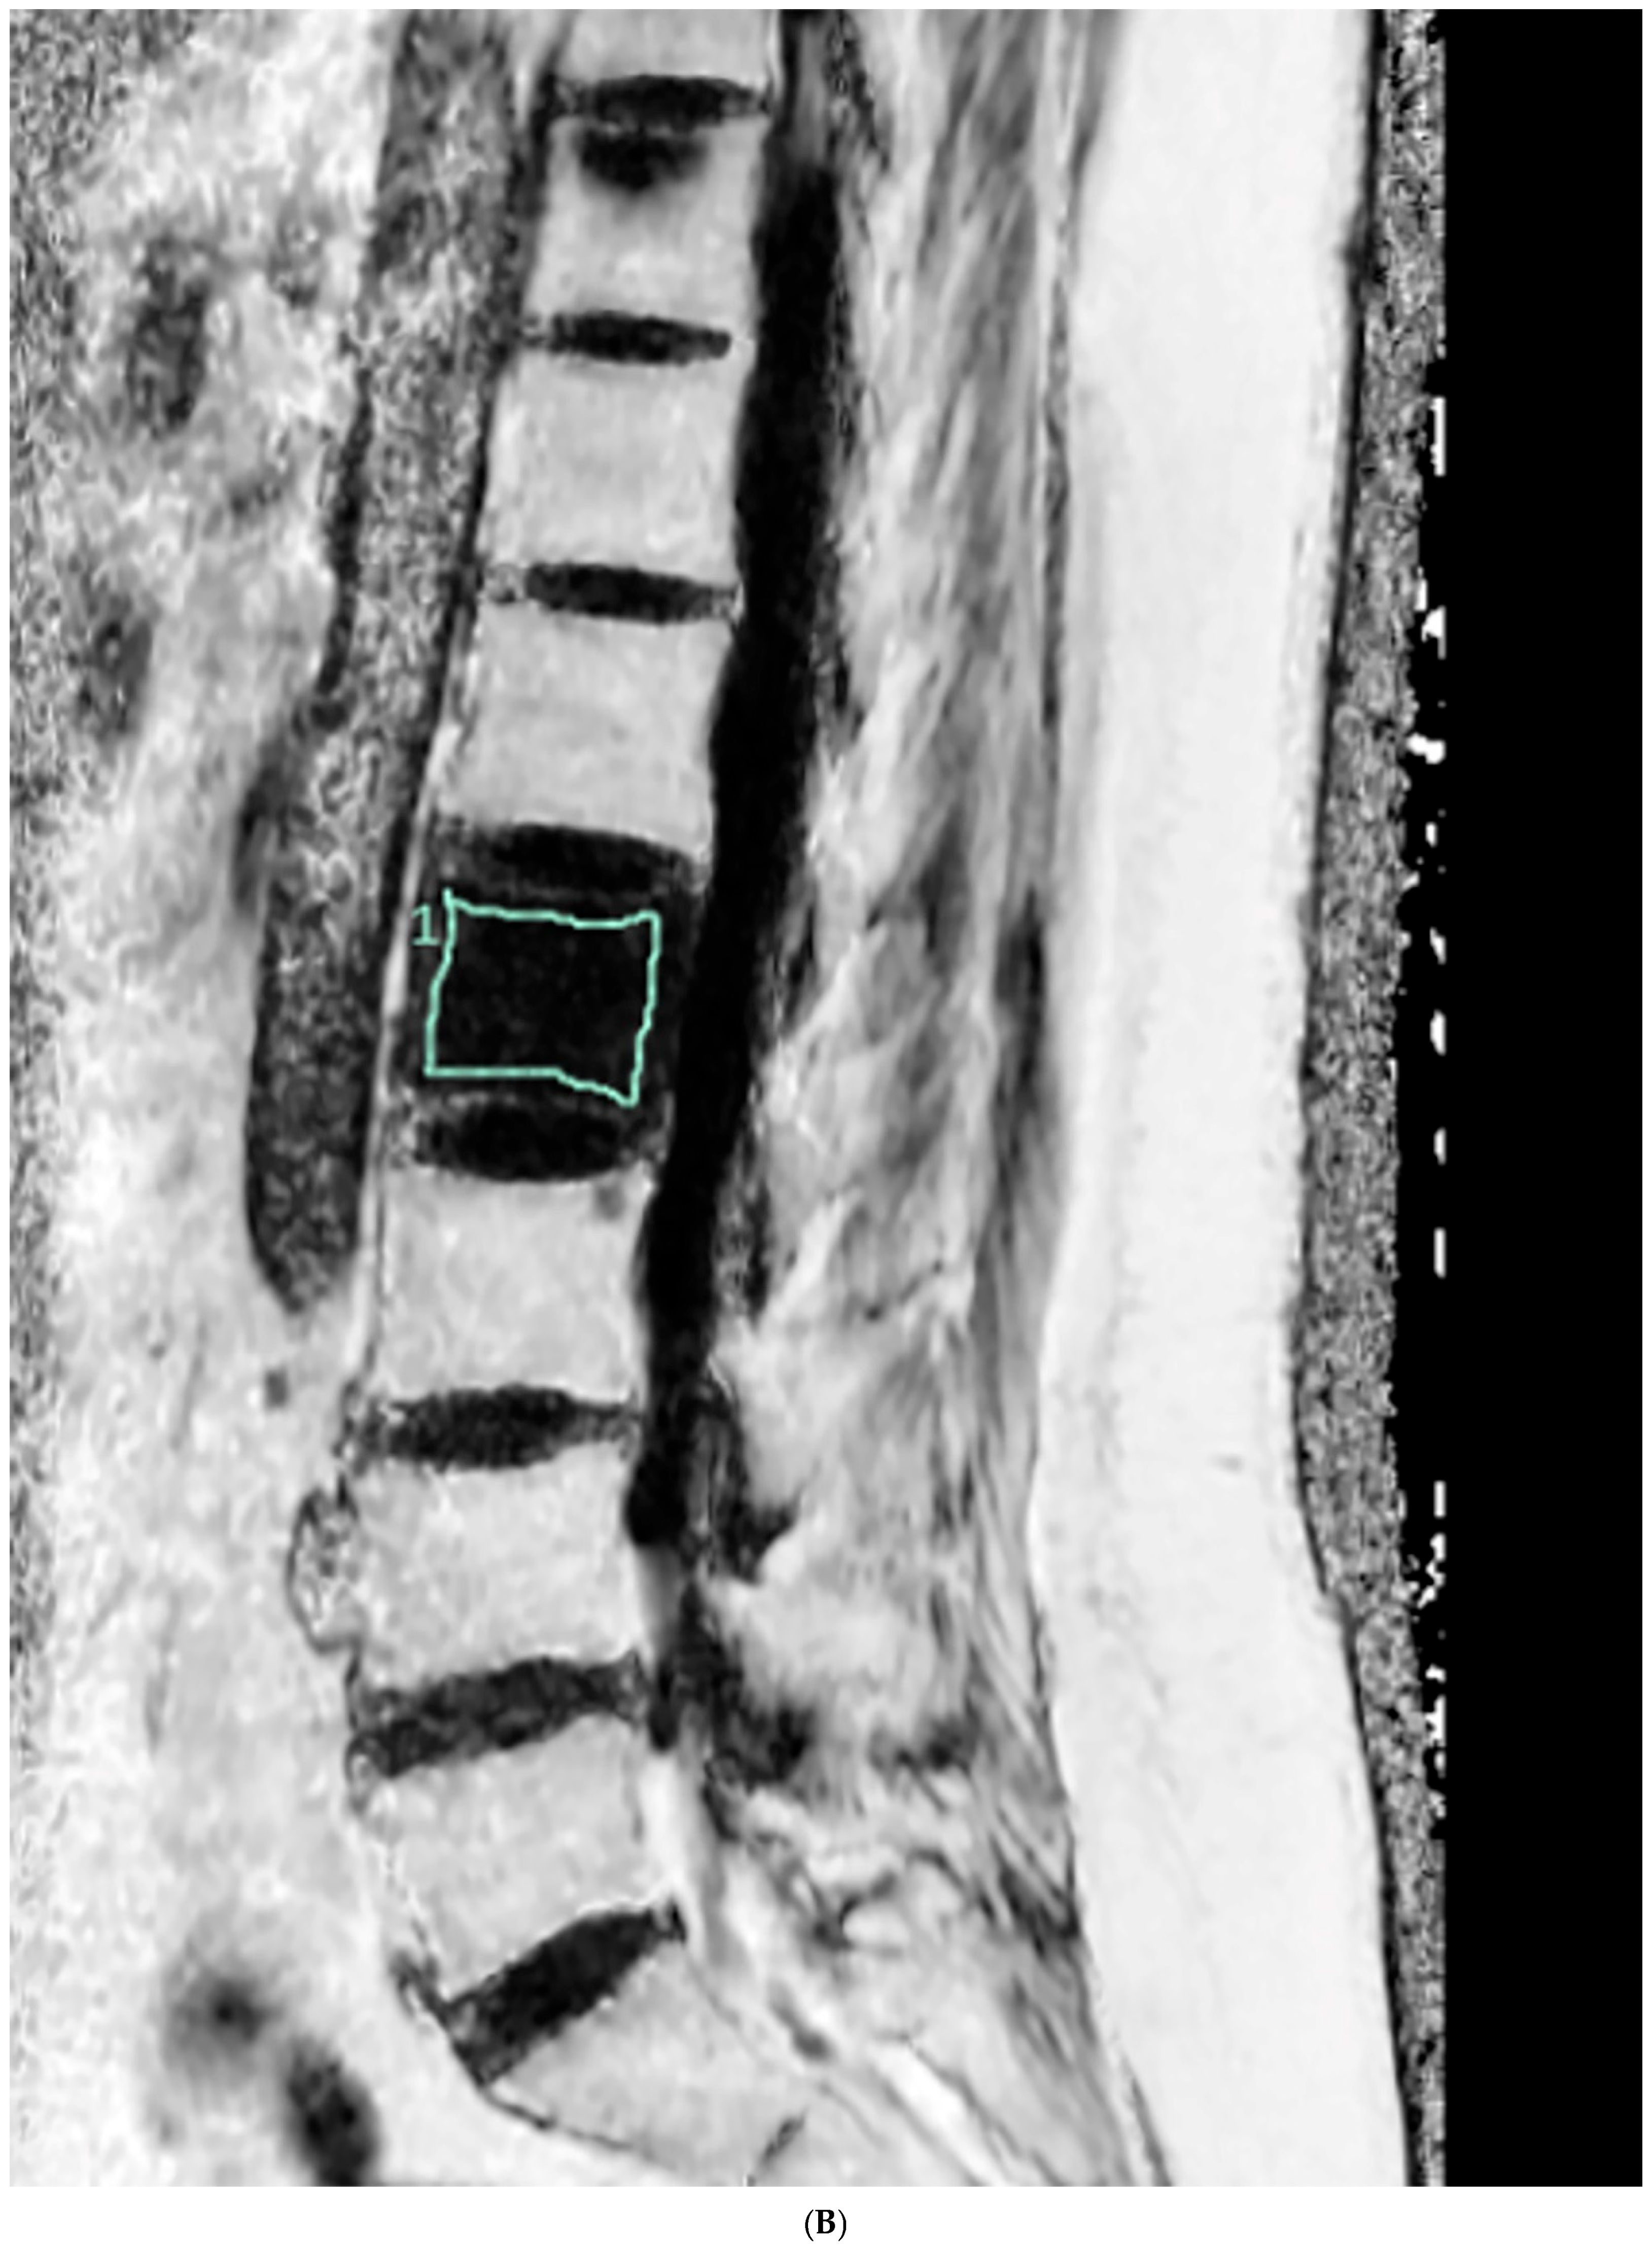
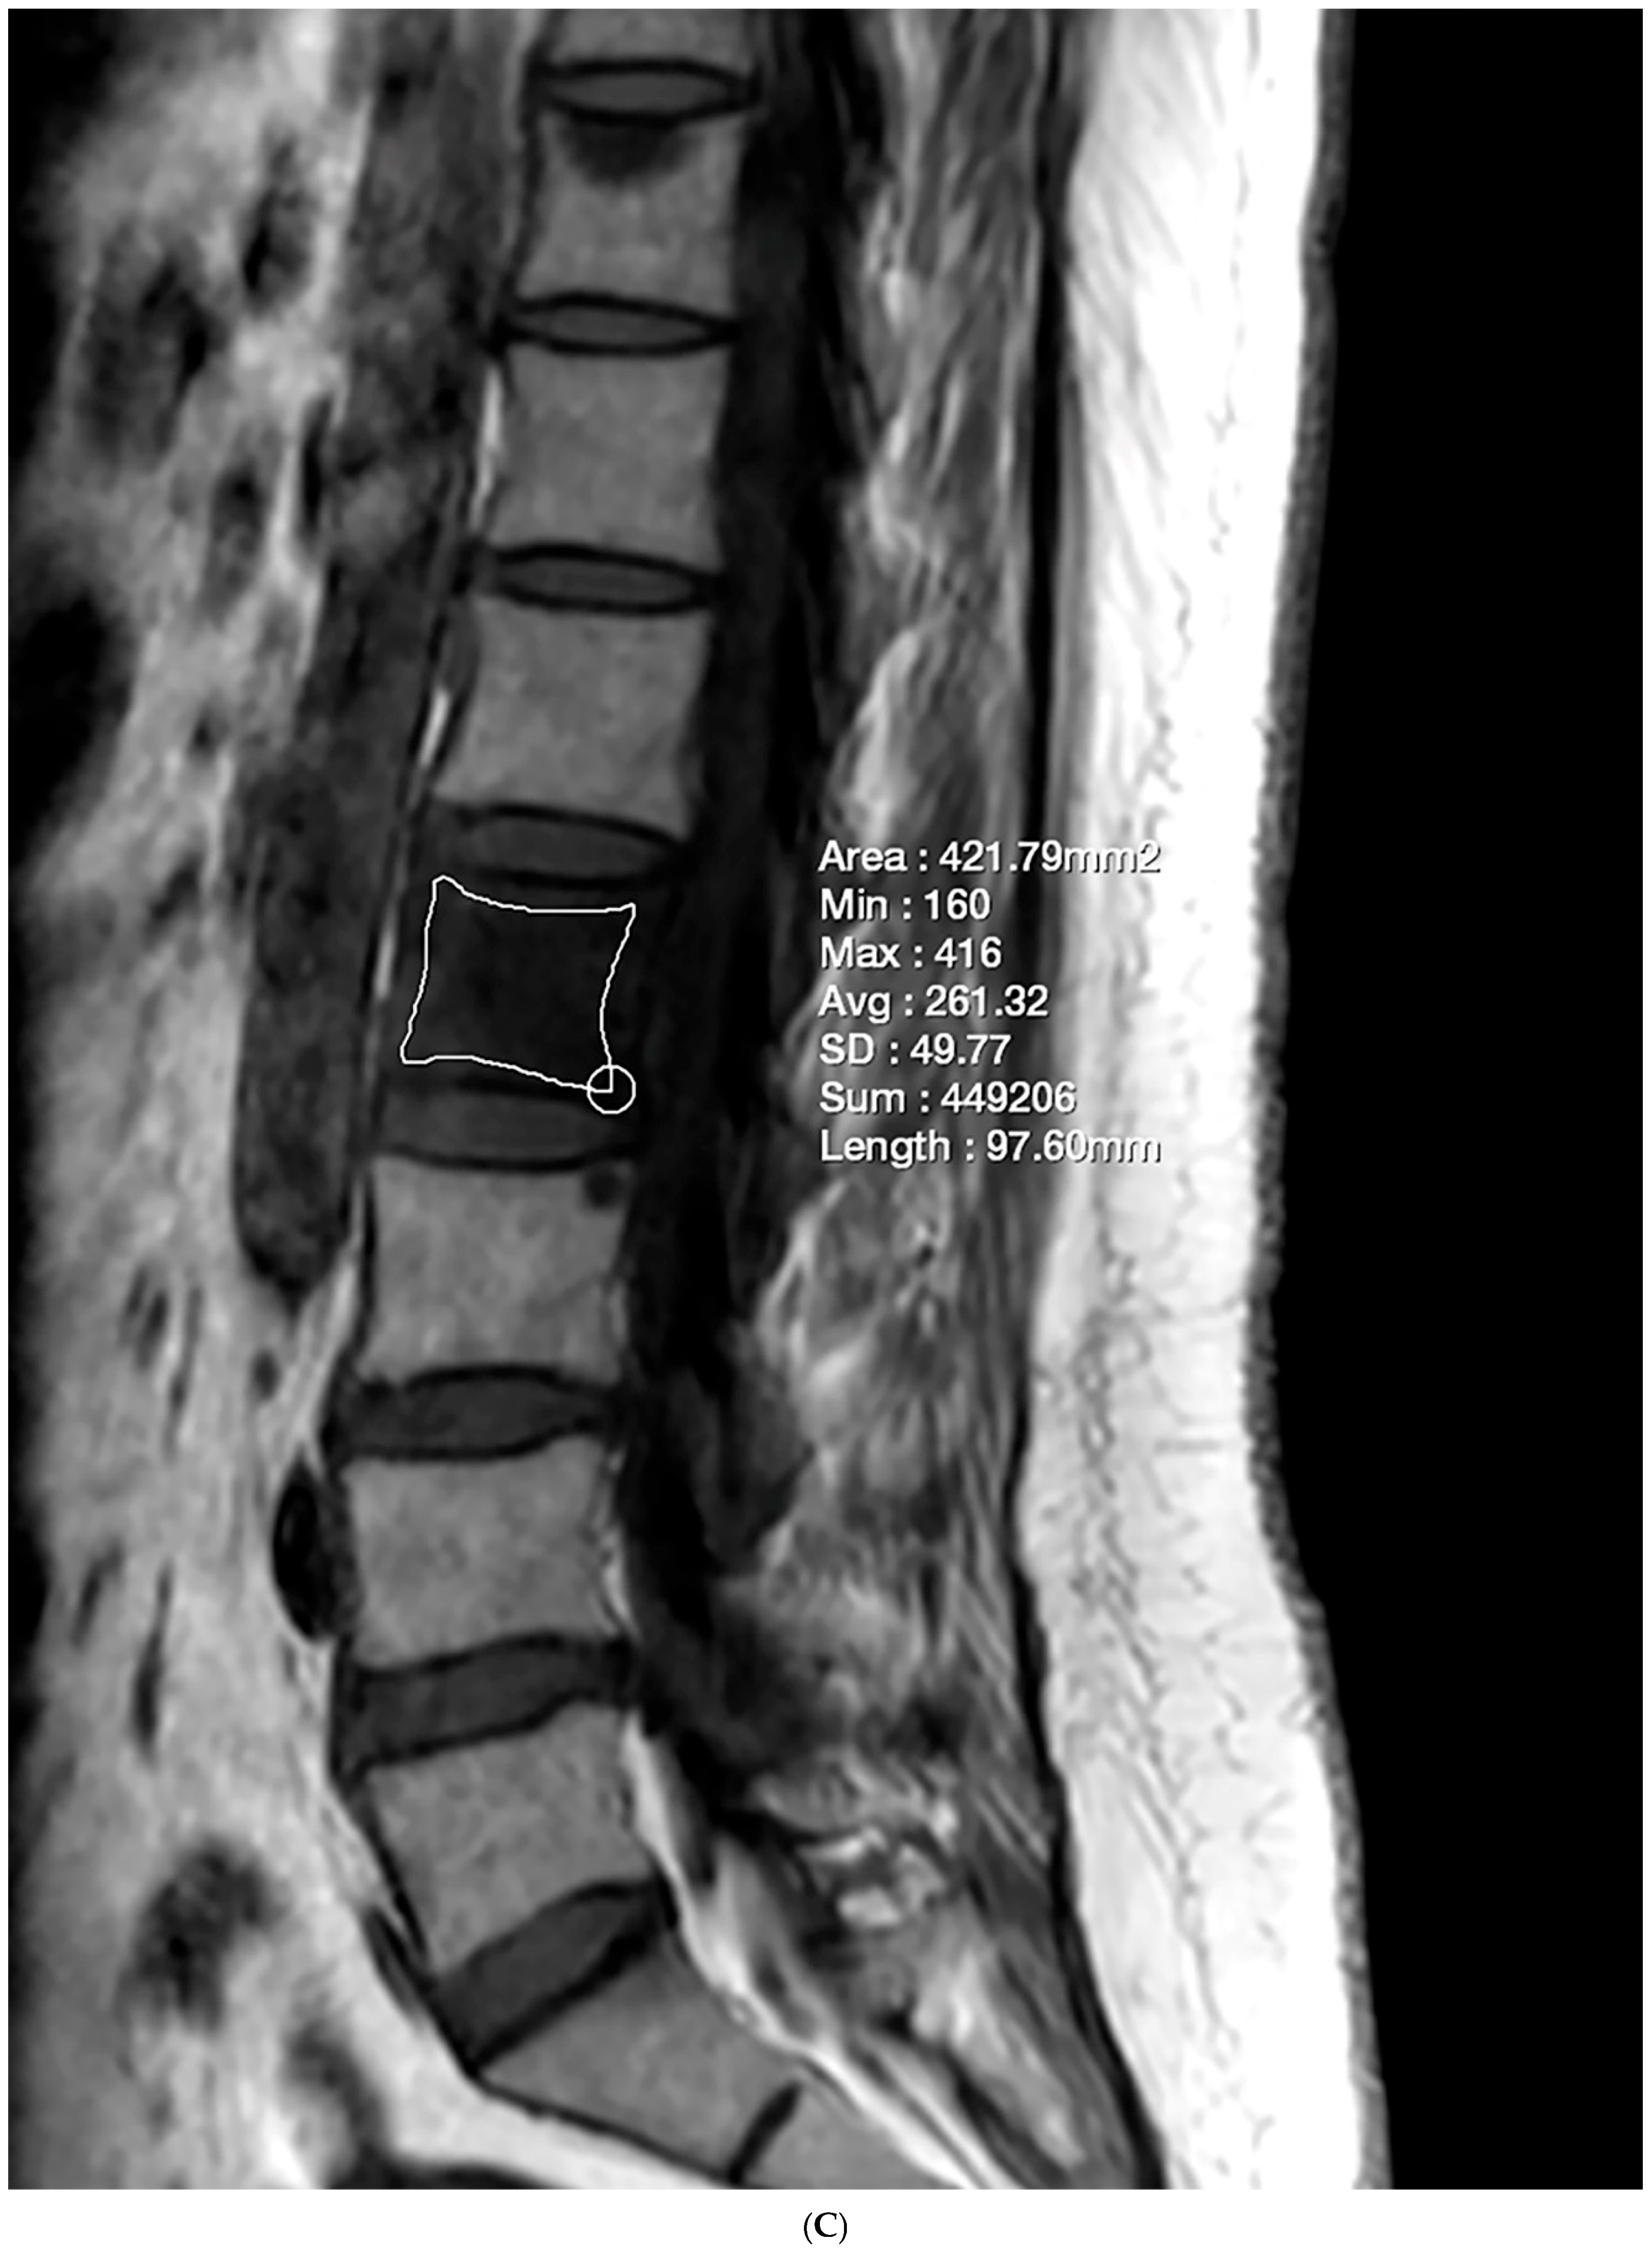
2.3. Fat Fraction Measurement

The FF measurement was independently performed by two radiologists who were unaware of the clinical information. Firstly, the FF measurements in GRE-based CSE-MRI were conducted using the INFINITT picture archiving and communication system. Elliptical regions of interest (ROIs) were drawn on the FF map, excluding the posterior venous complex and cortical bone, to encompass cancellous bone as much as possible (Figure 1). ROIs were delineated to the mid-sagittal image. In cases where obtaining information from the central image was challenging, ROIs were drawn on parasagittal images. Measurements were conducted on the L1–L4 bodies, and, in cases where abnormalities invaded all sagittal slices, this level was excluded from the measurements. The median values of the measurements were utilized as representative values (FFGRE). Next, the FF measurement in SE-based CSE-MRI was determined using diffusion analysis software (EXPRESS version 1.0, Philips Healthcare, Seoul, Republic of Korea). This program generates a fat fraction map by simply dividing the signal from the fat-only image by the sum of the signals from the water-only and fat-only images. After creating the FF map using mDixon-XD images, using the same criteria and methodology as in GRE-based CSE-MRI measurements, FF values were obtained from L1–L4 bodies (Figure 1), and the median was used as the representative value (FFSE).

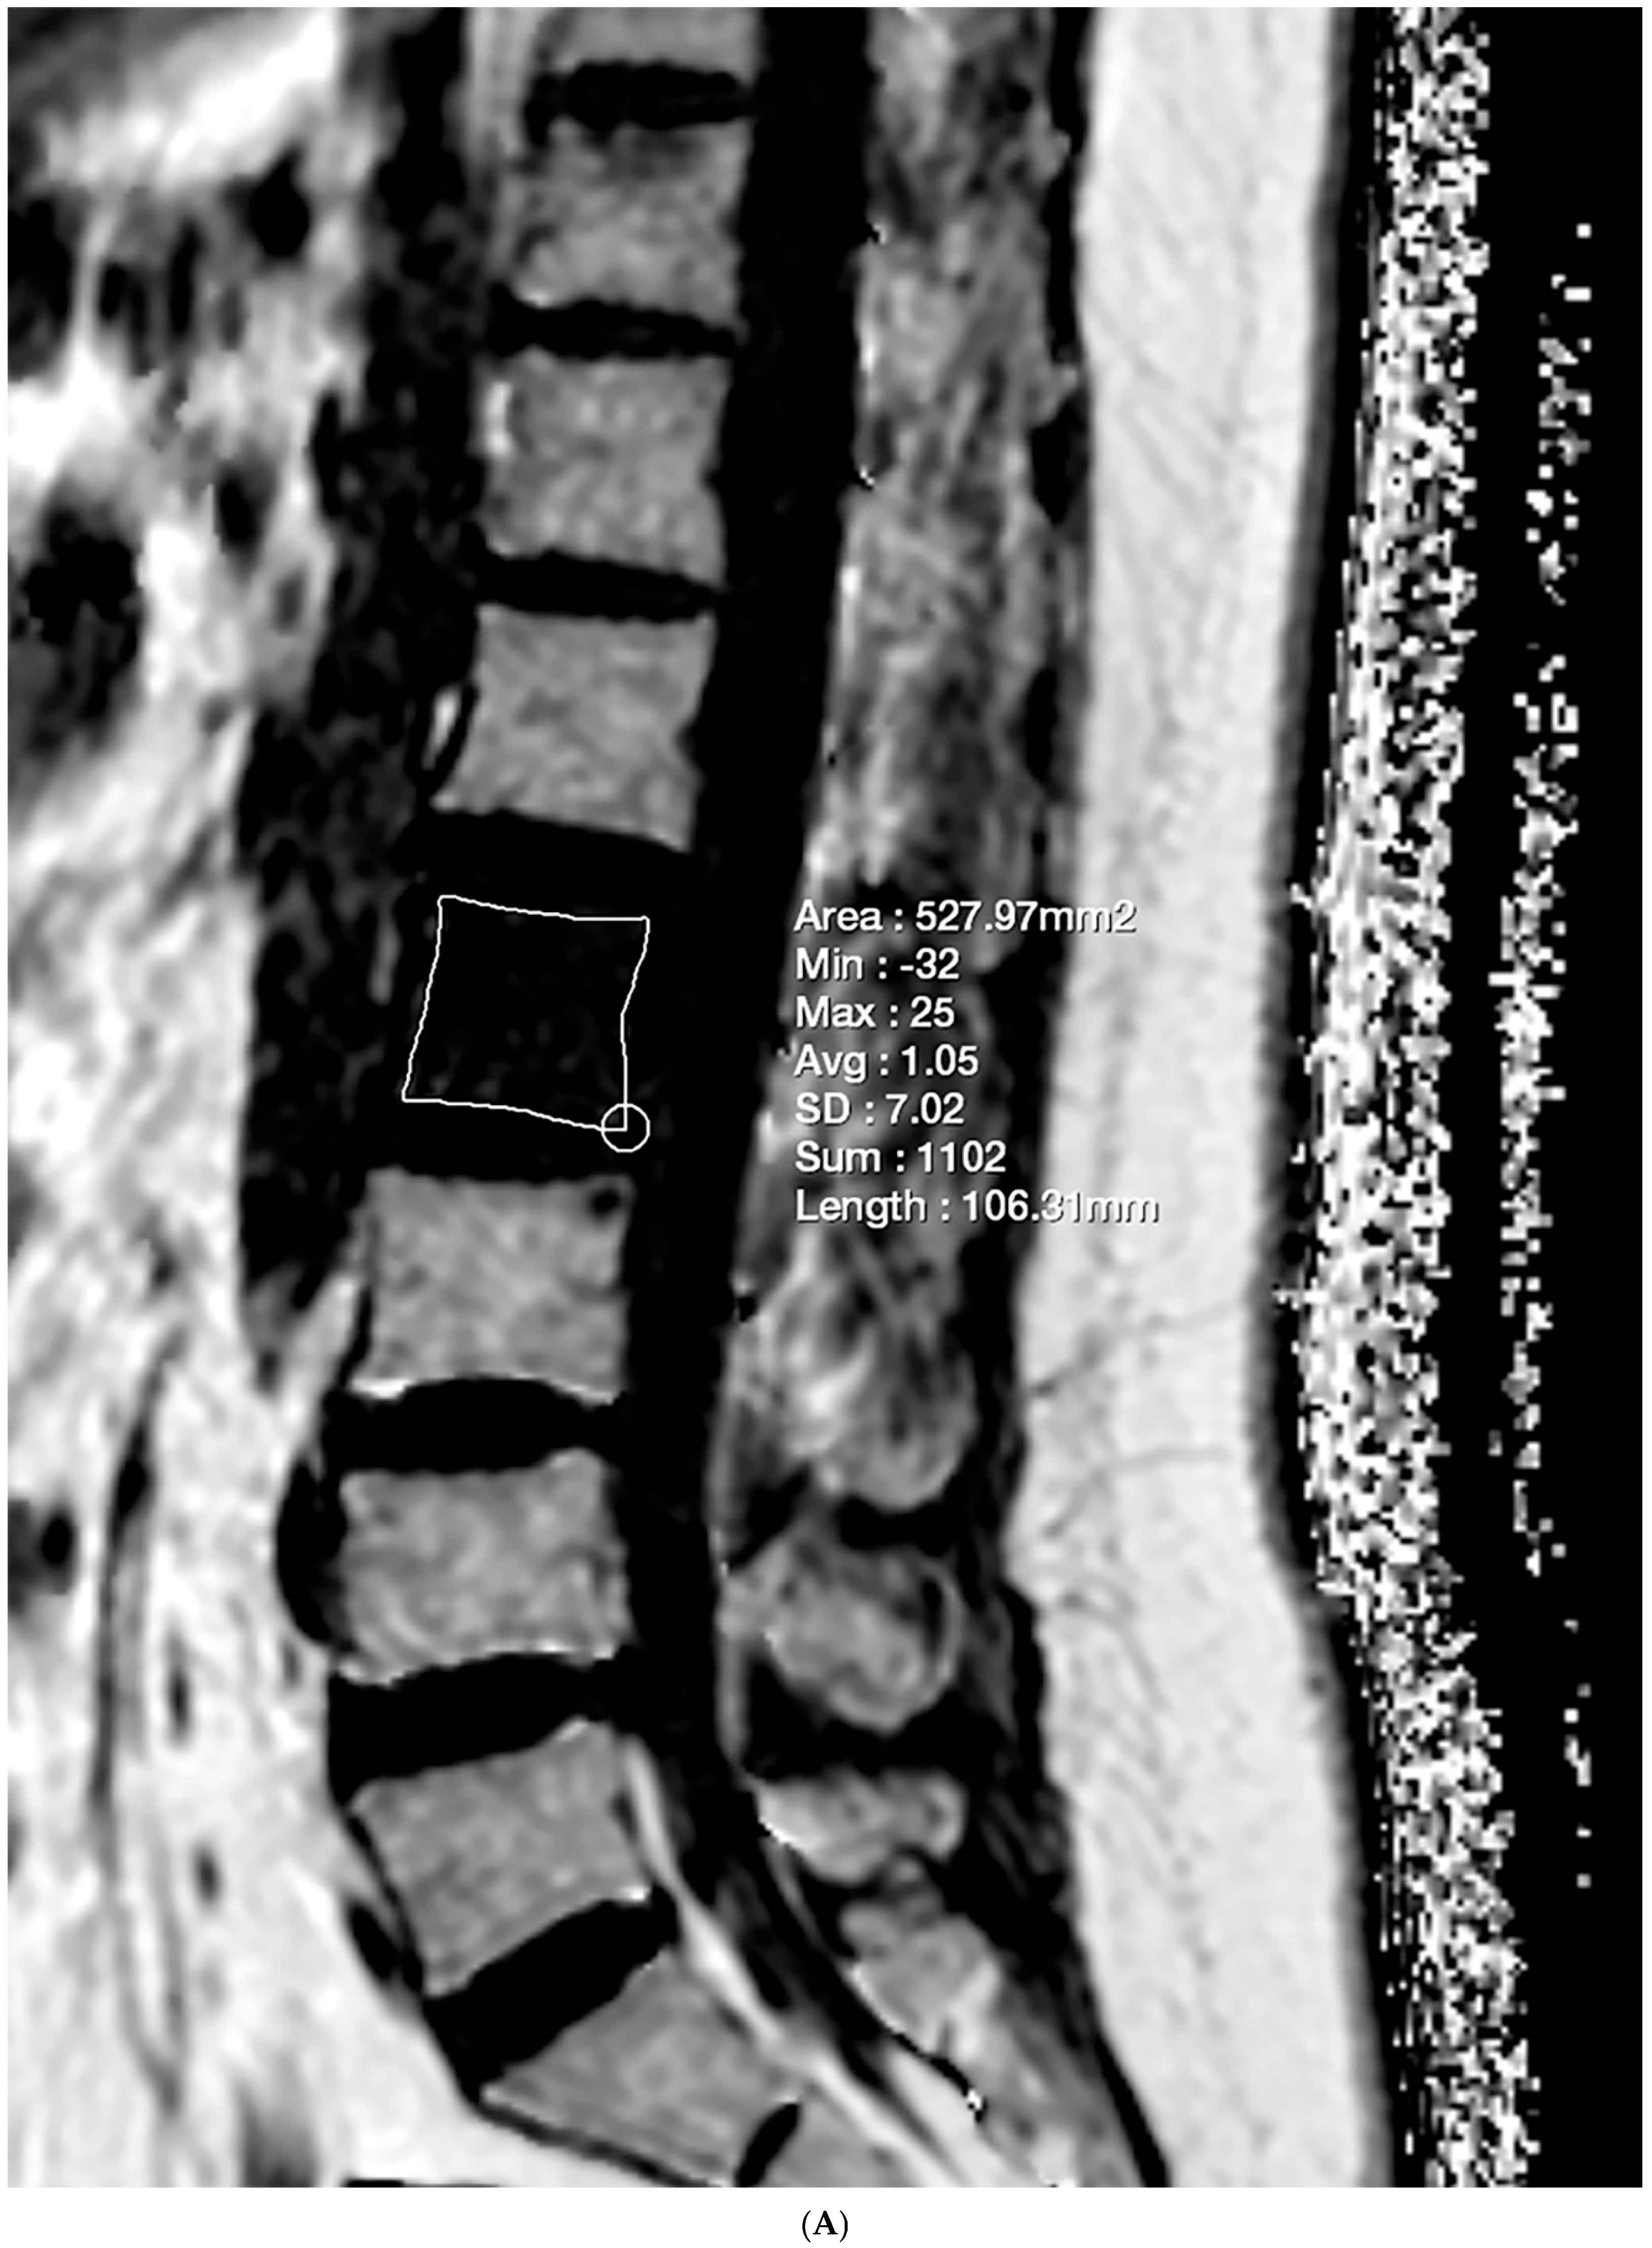
2.4. Vertebral Bone Quality Score Measurement

The VBQ score measurement was performed on sagittal T1-weighted images using the method described by Ehresman et al. [16]. Similarly to FF measurements, elliptical ROIs were independently drawn by two investigators on the midline sagittal image (Figure 1). If measurements were challenging on the mid-sagittal image, they were either taken on the parasagittal image or excluded from the assessment following the same criteria as the FF measurement. The median signal intensity (SI) of L1–L4 bodies was chosen as the representative value (SIVB). Additionally, the SI of ventral cerebrospinal fluid (CSF) was measured at the L3 level (SICSF). If severe stenosis prevented the measurement of CSF SI at the L3 level, measurements were taken at the L2 or L4 level. The VBQ score was calculated by dividing SIL1-L4 by SICSF.

2.5. Evaluation for Vertebral Lesions

Based on morphologic MRI findings, focal vertebral lesions were defined. Focal vertebral lesions were included when two radiologists independently reviewed the images without clinical information and consistently identified them as true lesions. In case of disagreement between the two radiologists, a third reader independently reviewed the images to determine whether to include the lesion. If an individual had multiple lesions, the largest one was selected when considering it as the same diagnosis. If deemed as different diagnostic entities, each lesion was individually selected. In cases where there was a prior history of biopsy for each lesion, histopathologic confirmation was employed as the diagnostic reference standard. In the absence of available biopsy, diagnosis was based on the following criteria of imaging findings.
  • The typical imaging finding in all conventional MRI sequences.
  • In cases of an acute vertebral fracture, findings diagnosed with CT or plain radiography, with accompanying trauma history.
  • In cases other than fractures, the typical imaging appearance in MRI was taken at least 6 months before or after the evaluation.
Lesions meeting the criteria of the first and either the second or third condition were included in the evaluation. The imaging criterion standards were determined through a consensus reading by two researchers. Subsequently, the lesions were classified as either benign or malignant. Another researcher manually delineated the ROI on FF maps and sagittal T1-weighted images for each selected lesion to ensure maximum coverage, enabling the calculation of FF and VBQ scores (Figure 2).

2.6. Statistical Analysis

Statistical analyses were performed using commercially available software (MedCalc version 22.016; MedCalc Software, Ostend, Belgium). All continuous values were reported as the mean ± standard deviation. To assess reproducibility for each variable, an interobserver agreement was evaluated using the intraclass correlation coefficient (ICC) with a 95% confidence interval (CI). The correlation between FFGRE and FFSE/VBQ score was analyzed using a linear regression and Pearson correlation (r). A Lin’s concordance correlation coefficient (ρc) was used to measure the consistency between FFGRE and FFSE. FFGRE and FFSE were compared using a paired t-test. To explore the correlation between age and each variable, Pa earson’s correlation was used. For benign and malignant vertebral lesions, the FF and the VBQ score were compared using the Mann–Whitney U test.

3. Results

The number of patients who met the inclusion criteria was 380. Out of these, 36 patients were excluded because of errors in GRE (n = 13) or SE (n = 2) CSE-MRI, hematopoietic disorder (n = 1), fracture (n = 12), infection (n = 1), tumor (n = 2), degeneration (n = 3), prior surgery (n = 1), or radiation treatment (n = 1). Therefore, a total of 344 patients were included, with 152 males and 192 females, and the average age was 59.7 ± 16.8 years. The mean FF and VBQ score of the study population are shown in Table 1.

3.1. Reproducibility

The ICCs were 0.979 (95% CI, 0.973–0.983) for FFGRE and 0.992 (0.989–0.993) for FFSE, demonstrating excellent reliability for FF. The ICC for VBQ score was 0.949 (0.937–0.959), also indicating a high level of agreement. More specifically, the ICCs for SIVB and SICSF were 0.993 (0.992–0.995) and 0.956 (0.946–0.965), respectively.

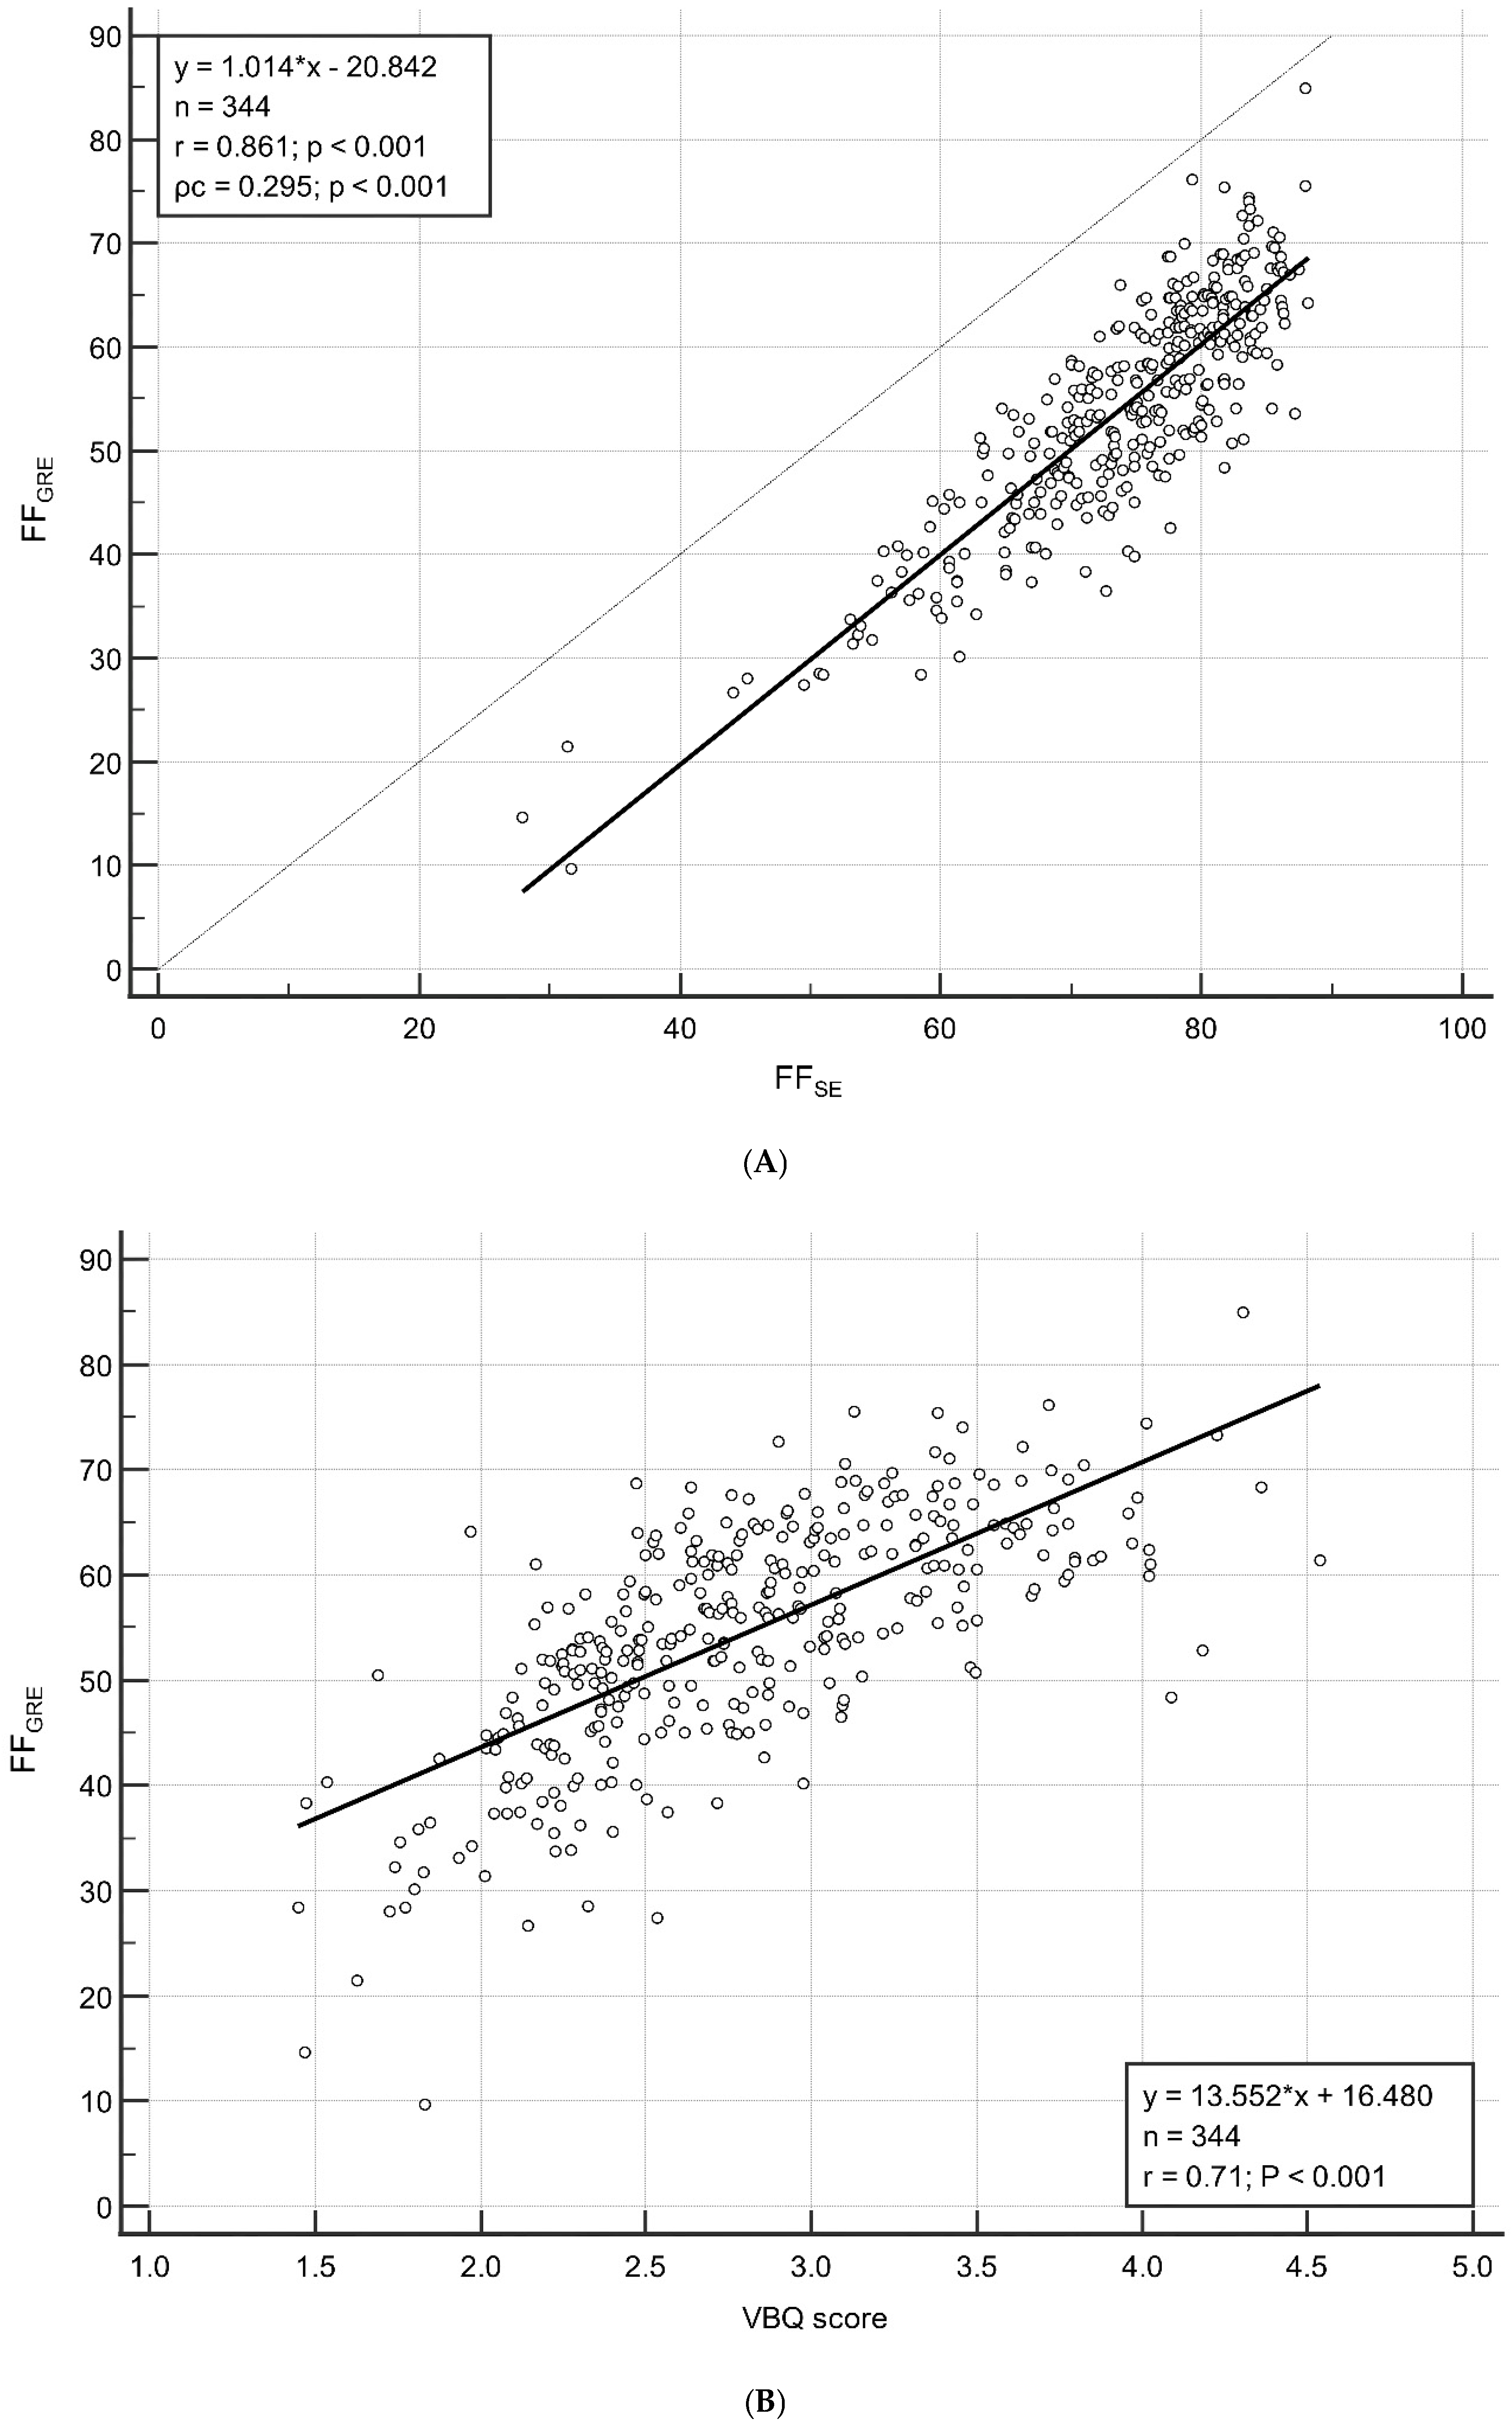
3.2. Correlation Between FFGRE and FFSE/VBQ Score

Figure 3 shows the correlation between FFGRE and FFSE/VBQ score. According to linear regression analysis, FFGRE exhibited strong correlations with FFSE (r = 0.861; p < 0.001) and the VBQ score (r = 0.708; p < 0.001). Although the correlation between FFGRE and FFSE was high, the consistency between the two variables was not favorable. A Lin’s concordance correlation coefficient (ρc) of 0.295 (p < 0.001) indicated a poor correlation between FFGRE and FFSE (Figure 3). When comparing the means, FFSE was measured to be 19.82% higher than FFGRE (54.31% vs. 74.13%; p < 0.001).

3.3. Correlation Between Age and FF/VBQ Score

Age and FFGRE exhibited a moderate correlation (r = 0.583; p < 0.001). Both FFSE and the VBQ score showed a somewhat lower yet still moderate correlation to FFGRE (r = 0.477 and 0.468, respectively; both p < 0.001). When dividing participants by age (50 years at the threshold), FFGRE, FFSE and the VBQ scores exhibited a lower correlation in the older group than the younger group (Table 2).

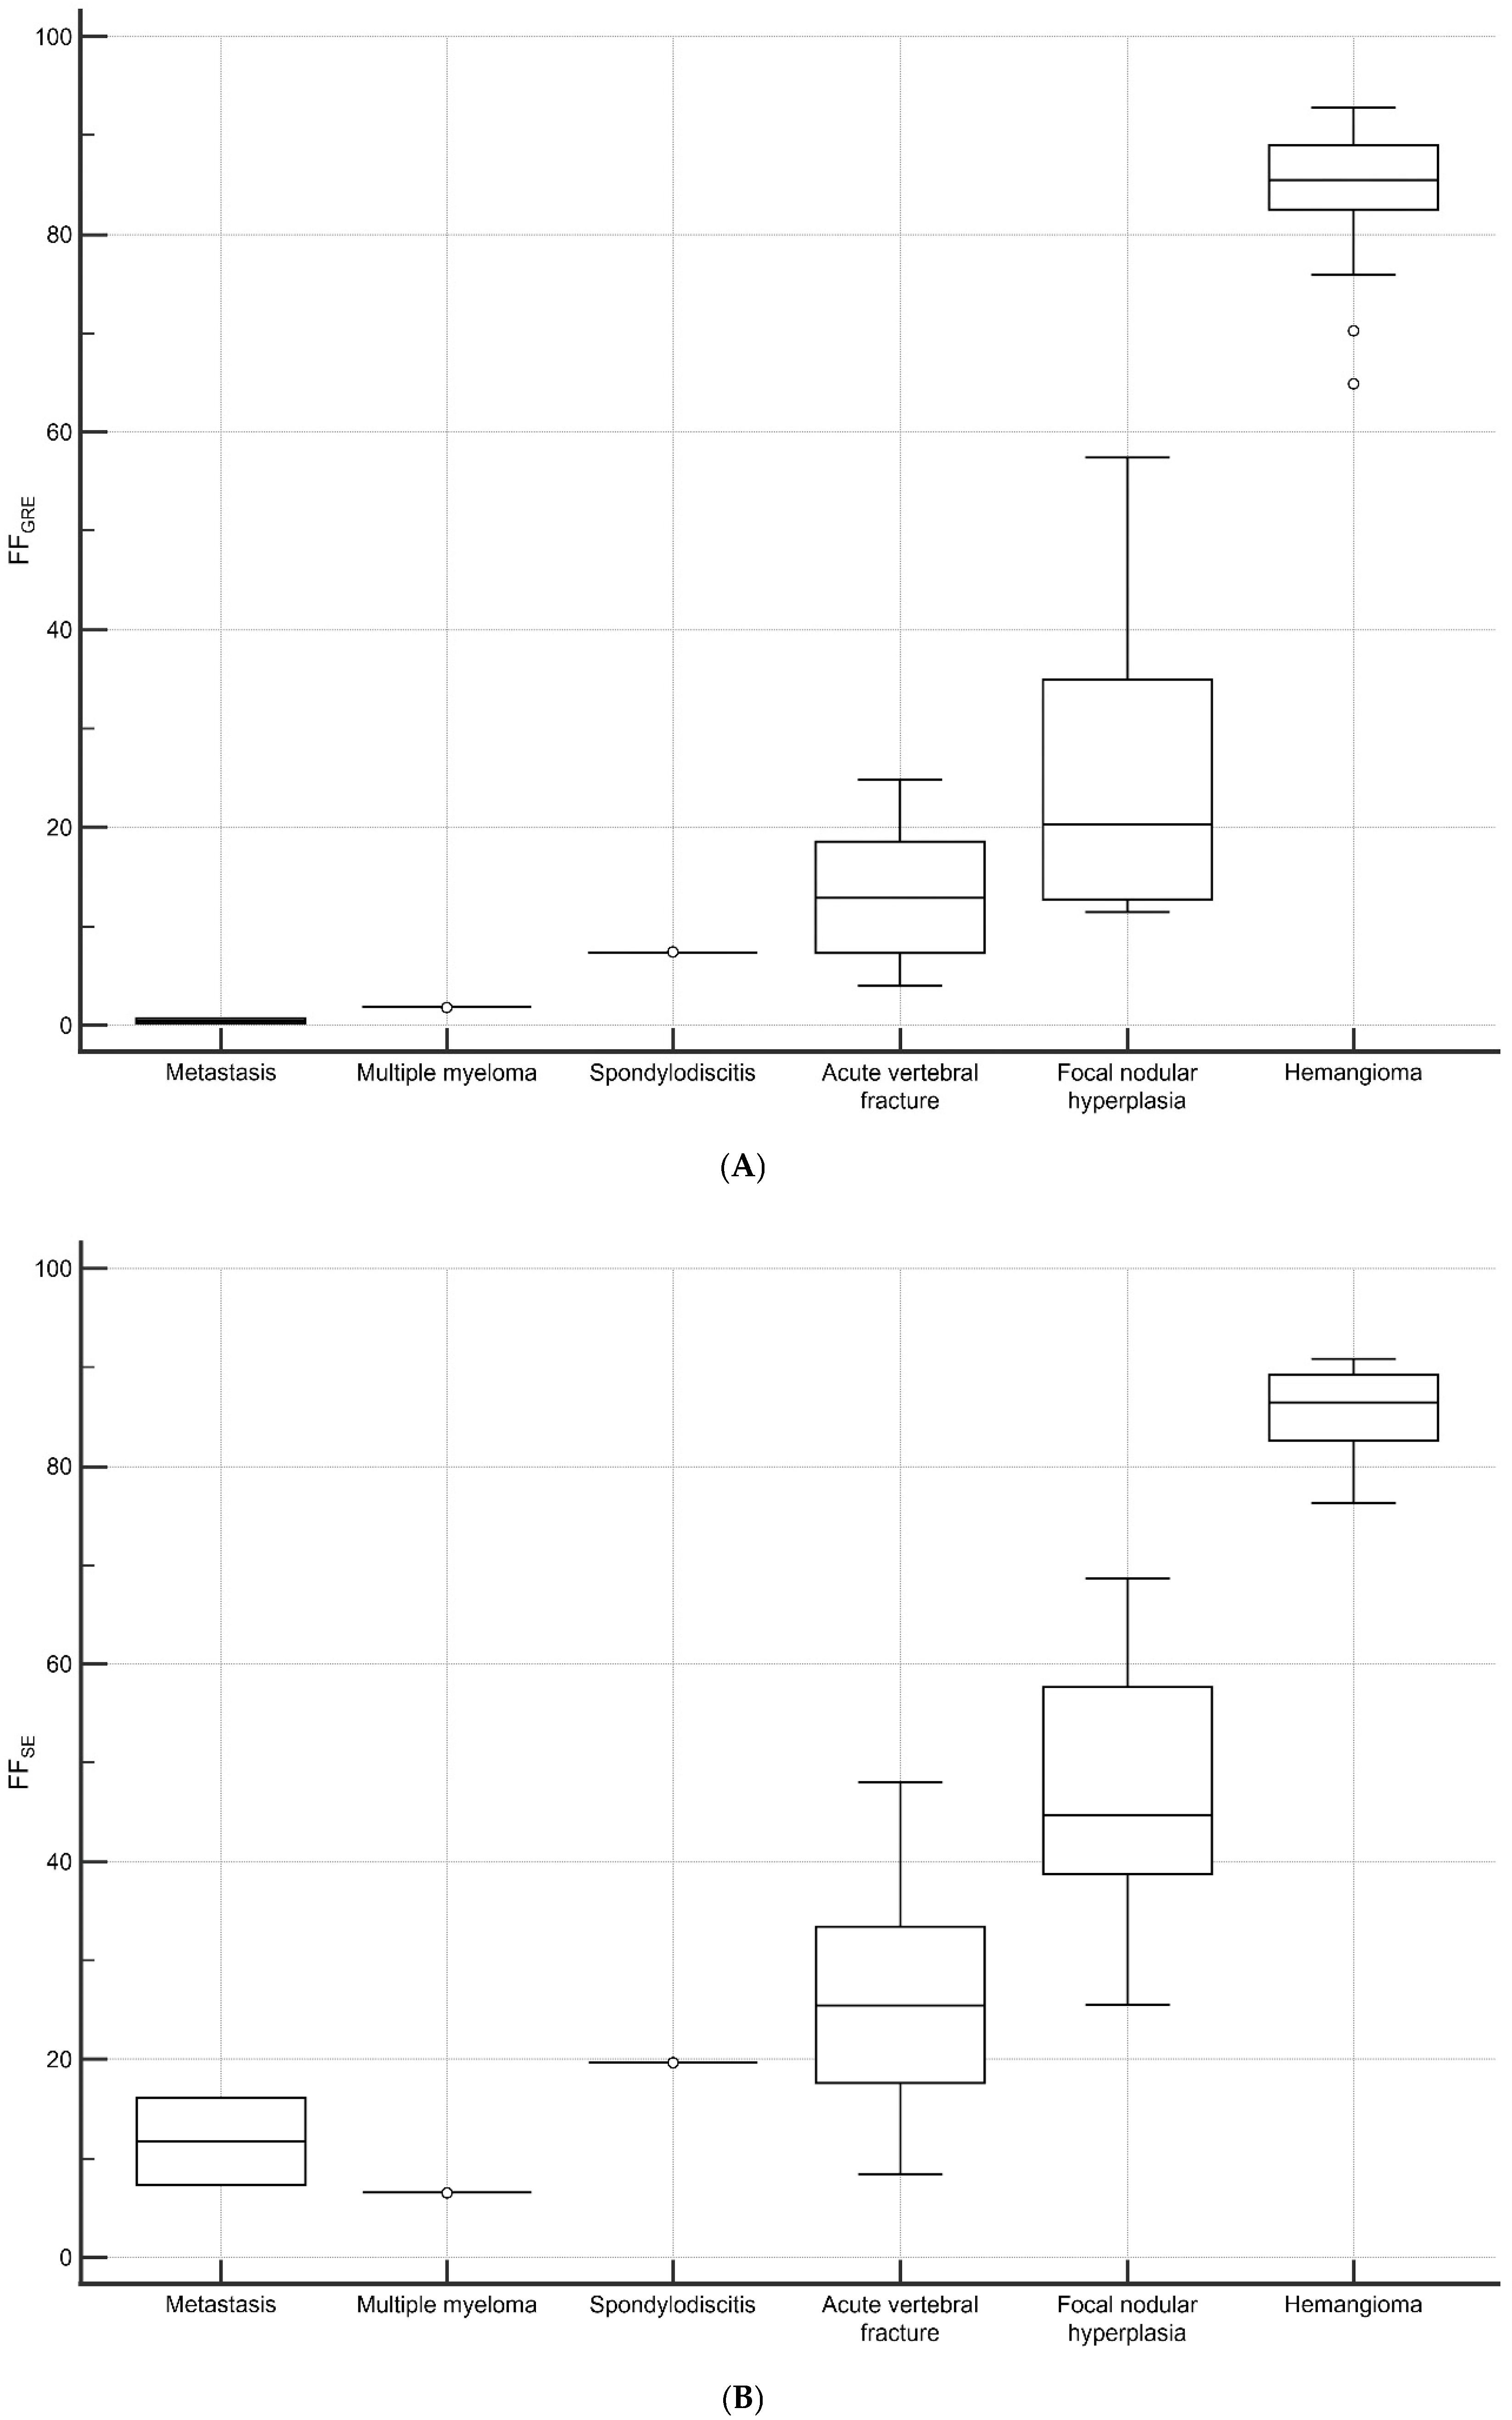
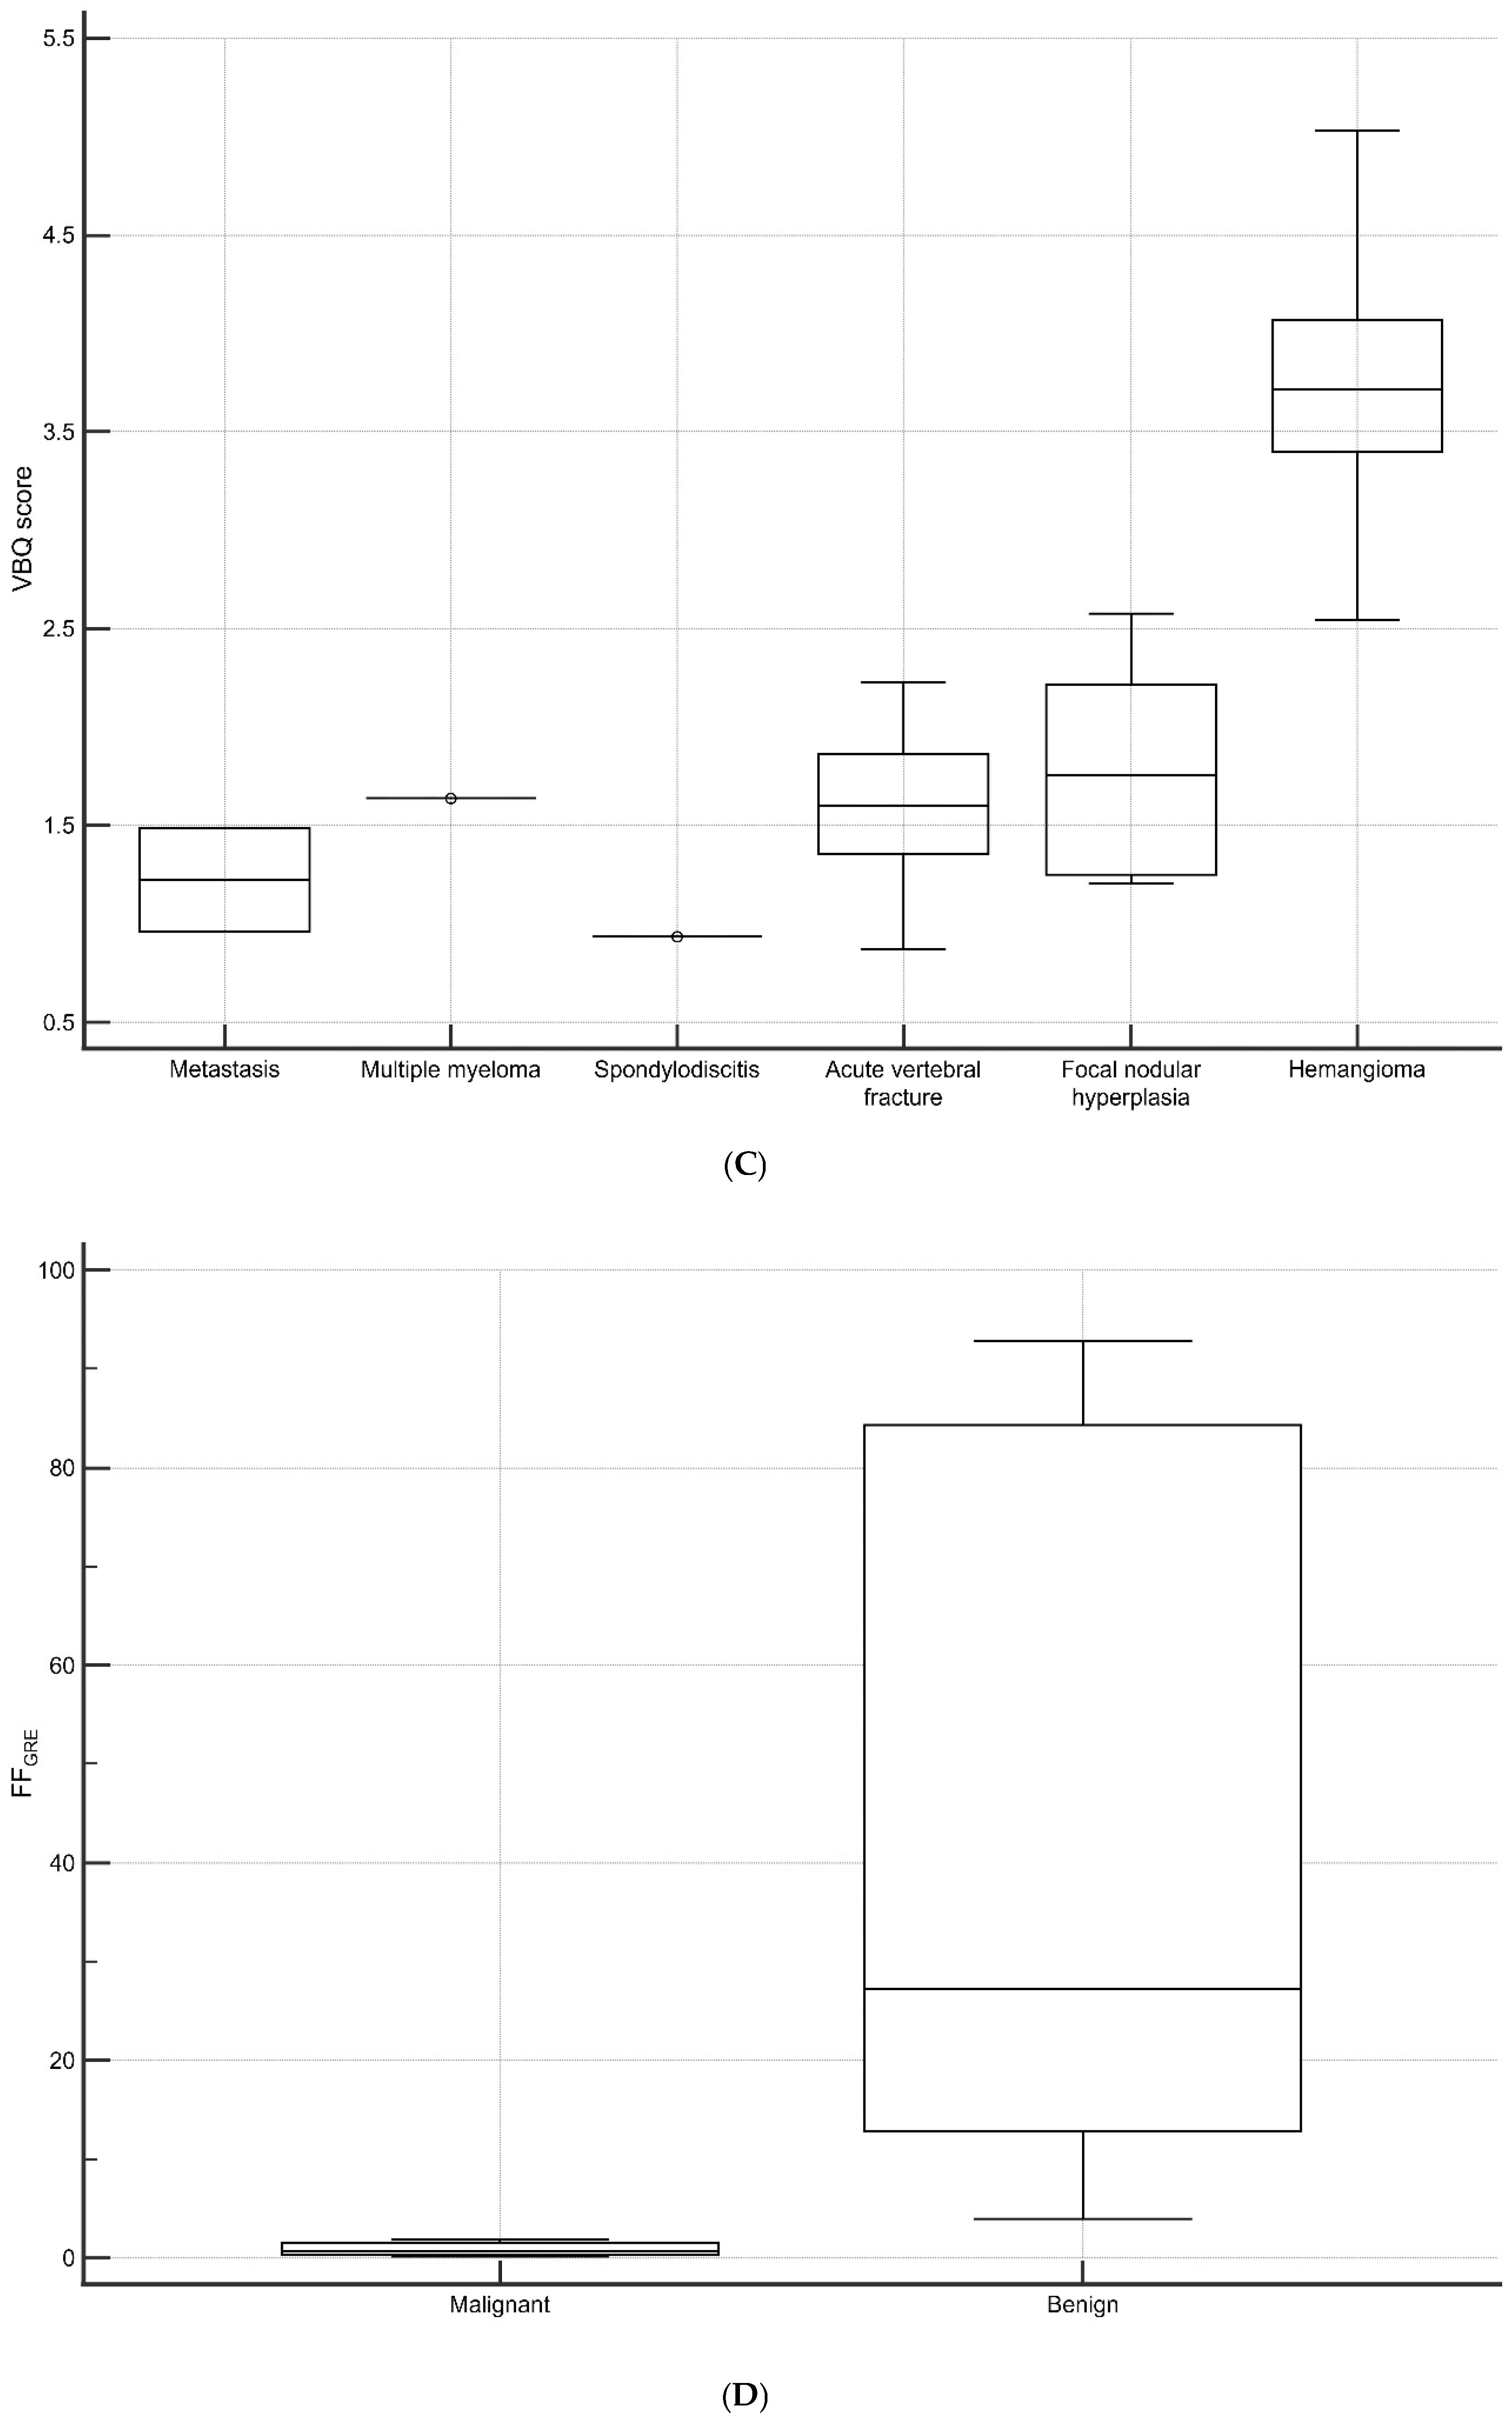
3.4. Vertebral Lesions Analyses

In total, 41 lesions were demonstrated in 40 patients. Hemangioma was the most prevalent with 15 cases, followed by acute vertebral fracture (n = 13), focal nodular marrow hyperplasia (n = 9), metastasis (n = 2), multiple myeloma (n = 1), and spondylodiscitis (n = 1). One patient had both hemangioma and focal nodular hyperplasia. Among these, multiple myeloma and spondylodiscitis were histopathologically confirmed. Two metastases originated from the adenoid cystic carcinoma of the parotid gland and adenocarcinoma of the lung, with multiple bone metastases in the spine. Biopsy confirmed bone metastasis in the left humerus and T8 body, respectively. Among the six types of lesions, metastases and multiple myeloma were classified as malignant, while the others were categorized as benign lesions.
FF and the VBQ score for each lesion were presented in Figure 4. Benign lesions exhibited an FFGRE of 44.11 ± 34.29%, while malignant lesions showed 0.91 ± 0.86%. The two groups showed statistically significant differences (p = 0.004). Benign lesions were statistically significantly higher than malignant lesions in FFSE (54.46 ± 28.36% vs. 9.99 ± 5.32%; p = 0.007). However, the difference in VBQ score was not statistically significant (2.48 ± 1.18 vs. 1.36 ± 0.36; p = 0.089).

4. Discussion

Our research demonstrated excellent inter-reader agreement for FFGRE, FFSE, and the VBQ scores. FFGRE exhibited a strong correlation with FFSE and the VBQ scores. However, Lin’s concordance correlation coefficient showed a low value, indicating that the consistency between FFGRE and FFSE was not favorable. There was a somewhat higher correlation between age and FFGRE, but all three measures—FFGRE, FFSE, and the VBQ scores—exhibited a moderate correlation with age. Clinically, this could be used to evaluate of changes in vertebral bone quality and marrow fat content. In the analysis of vertebral lesions, FF showed significant differences between both benign and malignant cases, whereas the VBQ scores did not show a statistically significant difference.
The CSE-MRI technique allows for the simultaneous acquisition of water and fat signals, enabling fat quantification [23]. However, there are multiple confounders such as T1 bias, T2* shortening effect, and multiple peaks in the fat spectrum that can interfere with accurate fat quantification [7,9,24]. The six-echo GRE CSE-MRI technique, which we adopted as the standard for fat fraction, has been reported to demonstrate high accuracy by correcting for these confounders [7,9]. On the contrary, the SE-based CSE-MRI technique did not correct for these confounders. As a result, the SE-based CSE-MRI technique leads to inaccurate fat quantification, contributing to a high correlation but low concordance between the two techniques. In other words, while FFSE tends to show high values when FFGRE is high (high correlation), the values of FFGRE and FFSE are not the same and exhibit differences (low concordance). As shown in Figure 3A, FFSE is generally higher compared to FFGRE. These results are consistent with findings from a recent study [25]. The statistically significant difference, despite measuring the same FF, indicates that it is not feasible to simply replace FFGRE with FFSE.
T1-weighted SE images are excellent for evaluating the cellular component of bone marrow. The SI of bone marrow is determined by the proportion of yellow marrow, which is composed of fat, and red marrow, which is composed of hematopoietic elements [26,27]. However, it is important to note that yellow marrow is not exclusively composed of fat, and red marrow also contains fat [3,28]. As the FF increases, there is a likelihood of an increase in SI on T1-weighted images, indicating a higher proportion of yellow marrow. However, precise measurement can be challenging. The correlation coefficient of 0.708 for the VBQ score in our study appears to reflect the influence of this background knowledge. Another weakness of the VBQ score is using of SICSF to correct SIVB. Despite strong interobserver agreement, the VBQ score concordance was relatively lower than FF, a trend noted in previous studies [11,16,17,18,29,30]. Our study found a lower concordance in SICSF compared to SIVB, aligning with prior research [18]. A small SICSF ROI may affect accuracy and stability. Unlike the fixed vertebral body, CSF flow may impact SICSF heterogeneity. The diverse degrees of stenosis in the CSF space and the varying conditions of the cauda equina among patients can also influence the measurements. Therefore, to enhance the interobserver agreement of VBQ scores, more detailed criteria for measuring SICSF may be needed.
There is a tendency for an increase in the volume of bone marrow fat with aging and osteoporosis [31,32,33]. In our study as well, age showed statistically significant positive correlations with both FF and the VBQ score. However, FFGRE showed a slightly higher correlation with FFSE and the VBQ score in our study. This difference is likely indicative of variations in the accuracy of fat quantification, as mentioned earlier. One important factor to consider is that, given that the elderly are primarily at higher risk for osteoporosis, the fact that the correlation of FF or the VBQ score decreases in this age group raises further questions as to whether these indicators can be reliably used in discriminating osteoporosis.
According to previous studies, FF has been reported to show a significant difference between malignant and benign lesions [7,13]. This is because malignant neoplasms completely replace cellular and fatty components, while benign lesions retain the fatty component [34,35]. We assumed that the VBQ score, which operates on a similar principle as FF, could also discriminate between benign and malignant lesions. The research results showed that there was a statistically significant difference in FF in both SE and GRE sequences, but the VBQ score did not exhibit such a difference. Our study suggests that, although the accuracy may be somewhat limited, not only FFGRE but also FFSE may potentially assist in distinguishing between benign and malignant lesions. However, considering the theoretical background that, in malignant lesions, the fatty component is replaced by cellular components, leading to a decreased in FF, relatively high and inaccurate FF values obtained from SE may cause misdiagnoses. Therefore, caution is required when interpreting these results. Further studies involving a larger patient cohort, including ROC analysis to determine the appropriate cut-off values, are necessary. There was no difference in the VBQ scores; however, this may be due to a limitation, given the small number of malignant lesions. Additional evaluation with a larger number of cases is necessary.
This study has several limitations. First, this study was conducted as a retrospective study, so there may be a selection bias. For example, there may be sex differences in FF inside the vertebral bodies, but gender was not considered in the selection of patients. Additionally, our study includes a very limited number of benign or malignant lesions. In particular, since the malignant lesions include only two metastases and one multiple myeloma, it is difficult to consider these as representative of malignant lesions. Additionally, although spondylodiscitis is a benign lesion, there is a report indicating that it may show low FF [36]. Therefore, future research should involve a larger number of benign and malignant cases and further investigate the differences in FF and the VBQ scores according to specific pathologic conditions. Second, while the VBQ score was developed as a tool to detect osteoporosis, our study did not consider its relationship with osteoporosis. The VBQ score and FF have been used for osteoporosis screening through MR [9,11,16]. However, to our knowledge, there has not been a study comparing these methods in the same patient cohort. It would be beneficial to evaluate osteoporosis screening using both the VBQ score and FF in the same patients. However, this falls outside the scope of our study and would require further research in the future. Third, many vertebral lesions were not histologically confirmed. However, especially for typical benign lesions, it is ethically challenging to confirm them histologically, and this limitation must be accepted as inherent.

5. Conclusions

In conclusion, FFGRE showed a high correlation with both FFSE and the VBQ score. Nevertheless, replacing FFGRE with FFSE proves to be challenging. All three indicators showed a moderate positive correlation with age. Unlike FF, the VBQ score could not distinguish between benign and malignant lesions.

Author Contributions

Conceptualization, S.P. and J.S.Y.; methodology, S.P., J.H. and J.S.Y.; software, J.H.; validation, K.-S.K. and K.H.L.; formal analysis, S.P., K.-S.K. and J.S.Y.; investigation, K.H.L. and J.S.Y.; visualization, K.H.L. and S.P.; writing—original draft, S.P.; writing—review and editing, J.S.Y.; supervision: J.S.Y. All authors have read and agreed to the published version of the manuscript.

Funding

This study was supported by grant from the Central Medical Service (CMS) Co., Ltd. Research Fund.

Institutional Review Board Statement

The study was conducted in accordance with the Declaration of Helsinki. The study was approved by the Institutional Review Board of Ajou University Hospital (AJOUIRB-DB-2023-444) on 02 September 2023, and individual consent for this retrospective analysis was waived.

Informed Consent Statement

The requirement for written informed consent was waived by the Institutional Review Board due to the retrospective nature of the study.

Data Availability Statement

The data presented in this study are available on request from the corresponding author. The data are not publicly available due to the need for approval from the affiliated institution’s DRB (Data Review Board), which is required for disclosure or export.

Acknowledgments

We would like to thank Wade Martin for English language editing.

Conflicts of Interest

Author Jinwoo Hwang was employed by the company Philips Healthcare. The remaining authors declare that the research was conducted in the absence of any commercial or financial relationships that could be construed as a potential conflict of interest.

Abbreviations

BMATBone marrow adipose tissue
CSE-MRIChemical shift-encoded magnetic resonance imaging
GREGradient-echo
FFFat fraction
SESpin-echo
VBQVertebral bone quality
TRRepetition time
TEEcho time
FOVField of view
ROIsregions of interest
SISignal intensity
CSFCerebrospinal fluid
CIconfidence interval

References

  1. Veldhuis-Vlug, A.G.; Rosen, C.J. Clinical implications of bone marrow adiposity. J. Intern. Med. 2018, 283, 121–139. [Google Scholar] [CrossRef]
  2. Piotrowska, K.; Tarnowski, M. Bone Marrow Adipocytes-Role in Physiology and Various Nutritional Conditions in Human and Animal Models. Nutrients 2021, 13, 1412. [Google Scholar] [CrossRef]
  3. Hanrahan, C.J.; Shah, L.M. MRI of spinal bone marrow: Part 2, T1-weighted imaging-based differential diagnosis. Am. J. Roentgenol. 2011, 197, 1309–1321. [Google Scholar] [CrossRef]
  4. Martel, D.; Leporq, B.; Bruno, M.; Regatte, R.R.; Honig, S.; Chang, G. Chemical shift-encoded MRI for assessment of bone marrow adipose tissue fat composition: Pilot study in premenopausal versus postmenopausal women. Magn. Reson. Imaging 2018, 53, 148–155. [Google Scholar] [CrossRef]
  5. Santopaolo, M.; Gu, Y.; Spinetti, G.; Madeddu, P. Bone marrow fat: Friend or foe in people with diabetes mellitus? Clin. Sci. 2020, 134, 1031–1048. [Google Scholar] [CrossRef]
  6. Karampinos, D.C.; Melkus, G.; Baum, T.; Bauer, J.S.; Rummeny, E.J.; Krug, R. Bone marrow fat quantification in the presence of trabecular bone: Initial comparison between water-fat imaging and single-voxel MRS. Magn. Reson. Med. 2014, 71, 1158–1165. [Google Scholar] [CrossRef]
  7. Yoo, H.J.; Hong, S.H.; Kim, D.H.; Choi, J.Y.; Chae, H.D.; Jeong, B.M.; Ahn, J.M.; Kang, H.S. Measurement of fat content in vertebral marrow using a modified dixon sequence to differentiate benign from malignant processes. J. Magn. Reson. Imaging 2017, 45, 1534–1544. [Google Scholar] [CrossRef] [PubMed]
  8. Qayyum, A. MR spectroscopy of the liver: Principles and clinical applications. Radiographics 2009, 29, 1653–1664. [Google Scholar] [CrossRef]
  9. Kim, D.; Kim, S.K.; Lee, S.J.; Choo, H.J.; Park, J.W.; Kim, K.Y. Simultaneous Estimation of the Fat Fraction and R(2)(*) via T(2)(*)-Corrected 6-Echo Dixon Volumetric Interpolated Breath-hold Examination Imaging for Osteopenia and Osteoporosis Detection: Correlations with Sex, Age, and Menopause. Korean J. Radiol. 2019, 20, 916–930. [Google Scholar] [CrossRef]
  10. Lee, S.H.; Yoo, H.J.; Yu, S.M.; Hong, S.H.; Choi, J.Y.; Chae, H.D. Fat Quantification in the Vertebral Body: Comparison of Modified Dixon Technique with Single-Voxel Magnetic Resonance Spectroscopy. Korean J. Radiol. 2019, 20, 126–133. [Google Scholar] [CrossRef]
  11. Li, G.; Xu, Z.; Li, X.; Zuo, X.; Chang, S.; Wu, D.; Dai, Y. Adding marrow R2 * to proton density fat fraction improves the discrimination of osteopenia and osteoporosis in postmenopausal women assessed with 3D FACT sequence. Menopause 2021, 28, 800–806. [Google Scholar] [CrossRef] [PubMed]
  12. Lu, F.; Zhao, Y.J.; Ni, J.M.; Jiang, Y.; Chen, F.M.; Wang, Z.J.; Zhang, Z.Y. Adding liver R2* quantification to proton density fat fraction MRI of vertebral bone marrow improves the prediction of osteoporosis. Eur. Radiol. 2022, 32, 7108–7116. [Google Scholar] [CrossRef] [PubMed]
  13. Schmeel, F.C.; Luetkens, J.A.; Wagenhauser, P.J.; Meier-Schroers, M.; Kuetting, D.L.; Feisst, A.; Gieseke, J.; Schmeel, L.C.; Traber, F.; Schild, H.H.; et al. Proton density fat fraction (PDFF) MRI for differentiation of benign and malignant vertebral lesions. Eur. Radiol. 2018, 28, 2397–2405. [Google Scholar] [CrossRef] [PubMed]
  14. Park, S.; Do Huh, J. Differentiation of bone metastases from benign red marrow depositions of the spine: The role of fat-suppressed T2-weighted imaging compared to fat fraction map. Eur. Radiol. 2022, 32, 6730–6738. [Google Scholar] [CrossRef]
  15. Zanchi, F.; Richard, R.; Hussami, M.; Monier, A.; Knebel, J.F.; Omoumi, P. MRI of non-specific low back pain and/or lumbar radiculopathy: Do we need T1 when using a sagittal T2-weighted Dixon sequence? Eur. Radiol. 2020, 30, 2583–2593. [Google Scholar] [CrossRef]
  16. Ehresman, J.; Pennington, Z.; Schilling, A.; Lubelski, D.; Ahmed, A.K.; Cottrill, E.; Khan, M.; Sciubba, D.M. Novel MRI-based score for assessment of bone density in operative spine patients. Spine J. 2020, 20, 556–562. [Google Scholar] [CrossRef]
  17. Salzmann, S.N.; Okano, I.; Jones, C.; Zhu, J.; Lu, S.; Onyekwere, I.; Balaji, V.; Reisener, M.J.; Chiapparelli, E.; Shue, J.; et al. Preoperative MRI-based vertebral bone quality (VBQ) score assessment in patients undergoing lumbar spinal fusion. Spine J. 2022, 22, 1301–1308. [Google Scholar] [CrossRef]
  18. Pu, M.; Zhong, W.; Heng, H.; Yu, J.; Wu, H.; Jin, Y.; Zhang, P.; Shen, Y. Vertebral bone quality score provides preoperative bone density assessment for patients undergoing lumbar spine surgery: A retrospective study. J. Neurosurg. Spine 2023, 38, 705–714. [Google Scholar] [CrossRef]
  19. Li, R.; Yin, Y.; Ji, W.; Wu, X.; Jiang, H.; Chen, J.; Zhu, Q. MRI-based vertebral bone quality score effectively reflects bone quality in patients with osteoporotic vertebral compressive fractures. Eur. Spine J. 2022, 31, 1131–1137. [Google Scholar] [CrossRef]
  20. Kadri, A.; Binkley, N.; Hernando, D.; Anderson, P.A. Opportunistic Use of Lumbar Magnetic Resonance Imaging for Osteoporosis Screening. Osteoporos. Int. 2022, 33, 861–869. [Google Scholar] [CrossRef]
  21. Li, W.; Wang, F.; Chen, J.; Zhu, H.; Tian, H.; Wang, L. MRI-based vertebral bone quality score is a comprehensive index reflecting the quality of bone and paravertebral muscle. Spine J. 2024, 24, 472–478. [Google Scholar] [CrossRef] [PubMed]
  22. Wang, S.; Liu, L.; Liu, H.; Zhang, X.; Liao, H.; He, P.; Yang, H.; Yang, H.; Qu, B. Comprehensive Diagnostic Value of Vertebral Bone Quality Scores and Paravertebral Muscle Quality Parameters in Osteoporotic Vertebral Fractures. World Neurosurg. 2025, 194, 123503. [Google Scholar] [CrossRef] [PubMed]
  23. Eggers, H.; Bornert, P. Chemical shift encoding-based water-fat separation methods. J. Magn. Reson. Imaging 2014, 40, 251–268. [Google Scholar] [CrossRef] [PubMed]
  24. Li, G.; Xu, Z.; Gu, H.; Li, X.; Yuan, W.; Chang, S.; Fan, J.; Calimente, H.; Hu, J. Comparison of chemical shift-encoded water-fat MRI and MR spectroscopy in quantification of marrow fat in postmenopausal females. J. Magn. Reson. Imaging 2017, 45, 66–73. [Google Scholar] [CrossRef]
  25. Haueise, T.; Schick, F.; Stefan, N.; Machann, J. Comparison of the accuracy of commercial two-point and multi-echo Dixon MRI for quantification of fat in liver, paravertebral muscles, and vertebral bone marrow. Eur. J. Radiol. 2024, 172, 111359. [Google Scholar] [CrossRef]
  26. Shah, L.M.; Hanrahan, C.J. MRI of spinal bone marrow: Part I, techniques and normal age-related appearances. Am. J. Roentgenol. 2011, 197, 1298–1308. [Google Scholar] [CrossRef]
  27. Ehresman, J.; Schilling, A.; Pennington, Z.; Gui, C.; Chen, X.; Lubelski, D.; Ahmed, A.K.; Cottrill, E.; Khan, M.; Redmond, K.J.; et al. A novel MRI-based score assessing trabecular bone quality to predict vertebral compression fractures in patients with spinal metastasis. J. Neurosurg. Spine 2019, 32, 499–506. [Google Scholar] [CrossRef]
  28. Malkiewicz, A.; Dziedzic, M. Bone marrow reconversion—imaging of physiological changes in bone marrow. Pol. J. Radiol. 2012, 77, 45–50. [Google Scholar] [CrossRef]
  29. Liu, Z.; Huang, D.; Jiang, Y.; Ma, X.; Zhang, Y.; Chang, R. Correlation of R2* with fat fraction and bone mineral density and its role in quantitative assessment of osteoporosis. Eur. Radiol. 2023, 33, 6001–6008. [Google Scholar] [CrossRef]
  30. Gassert, F.G.; Kranz, J.; Gassert, F.T.; Schwaiger, B.J.; Bogner, C.; Makowski, M.R.; Glanz, L.; Stelter, J.; Baum, T.; Braren, R.; et al. Longitudinal MR-based proton-density fat fraction (PDFF) and T2* for the assessment of associations between bone marrow changes and myelotoxic chemotherapy. Eur. Radiol. 2023, 34, 2437–2444. [Google Scholar] [CrossRef]
  31. Al Saedi, A.; Chen, L.; Phu, S.; Vogrin, S.; Miao, D.; Ferland, G.; Gaudreau, P.; Duque, G. Age-Related Increases in Marrow Fat Volumes have Regional Impacts on Bone Cell Numbers and Structure. Calcif. Tissue Int. 2020, 107, 126–134. [Google Scholar] [CrossRef] [PubMed]
  32. Singh, L.; Tyagi, S.; Myers, D.; Duque, G. Good, Bad, or Ugly: The Biological Roles of Bone Marrow Fat. Curr. Osteoporos. Rep. 2018, 16, 130–137. [Google Scholar] [CrossRef] [PubMed]
  33. Griffith, J.F.; Yeung, D.K.; Ma, H.T.; Leung, J.C.; Kwok, T.C.; Leung, P.C. Bone marrow fat content in the elderly: A reversal of sex difference seen in younger subjects. J. Magn. Reson. Imaging 2012, 36, 225–230. [Google Scholar] [CrossRef]
  34. Zajick, D.C., Jr.; Morrison, W.B.; Schweitzer, M.E.; Parellada, J.A.; Carrino, J.A. Benign and malignant processes: Normal values and differentiation with chemical shift MR imaging in vertebral marrow. Radiology 2005, 237, 590–596. [Google Scholar] [CrossRef]
  35. Douis, H.; Davies, A.M.; Jeys, L.; Sian, P. Chemical shift MRI can aid in the diagnosis of indeterminate skeletal lesions of the spine. Eur. Radiol. 2016, 26, 932–940. [Google Scholar] [CrossRef]
  36. Schmeel, F.C.; Lakghomi, A.; Lehnen, N.C.; Haase, R.; Banat, M.; Wach, J.; Handke, N.; Vatter, H.; Radbruch, A.; Attenberger, U.; et al. Proton Density Fat Fraction Spine MRI for Differentiation of Erosive Vertebral Endplate Degeneration and Infectious Spondylitis. Diagnostics 2021, 12, 78. [Google Scholar] [CrossRef]
Figure 1. Lumbar spine MRI of a 59-year-old male. (A) Fat fraction (FF) measurement on gradient-echo (GRE)-based chemical-shift-encoded magnetic resonance imaging (CSE-MRI). The FFGRE in this patient was 66.91%, representing the median value of the L1–L4 vertebral bodies. (B) FF measurement on spin-echo (SE)-based CSE-MRI. The FFSE was 85.84%. The numbers in the figure indicate the ROI numbering in the EXPRESS program. (C) Measurement of the vertebral bone quality (VBQ) score was calculated by dividing the median value of T1-weighted signal of L1–L4 vertebral bodies by the cerebrospinal fluid (CSF) signal at the L3 level. The VBQ score for this patient was 2.63. (D,E) FF color maps were created through GRE- and SE-based CSE-MRI.
Diagnostics 15 00503 g001aDiagnostics 15 00503 g001bDiagnostics 15 00503 g001cDiagnostics 15 00503 g001dDiagnostics 15 00503 g001e
Figure 2. Lumbar spine MRI of a 48-year-old female with multiple bone metastases from adenoid cystic carcinoma of the parotid gland. (A) GRE-based CSE-MRI reveals an FF of 1.05% in the metastatic lesion of the L2 vertebral body. (B) On SE-based CSE-MRI, the FF of the corresponding lesion was 7.30%. The number in the figure indicate the ROI numbering in the EXPRESS program. (C) Multiple bone metastases are observed in the T11, L2, and L3 vertebral bodies on the T1-weighted image. The VBQ score for the L2 vertebral body lesion was 0.96.
Diagnostics 15 00503 g002aDiagnostics 15 00503 g002bDiagnostics 15 00503 g002c
Figure 3. The correlation between FFGRE and FFSE (A), the VBQ score (B).
Diagnostics 15 00503 g003
Figure 4. (AC) The distribution of FFGRE (A), FFSE (B), and the VBQ score (C) in vertebral lesions. (DF) The differences between malignant and benign lesions in FFGRE (D), FFSE (E), VBQ score (F). There was a statistically significant difference between FFGRE and FFSE (p = 0.004 and 0.007, respectively), but the VBQ score did not show a significant difference (p = 0.089).
Diagnostics 15 00503 g004aDiagnostics 15 00503 g004bDiagnostics 15 00503 g004c
Table 1. Mean FF and VBQ scores of the study population.
Mean ± Standard Deviationp
FFGRE54.31 ± 11.04<0.001
FFSE74.13 ± 9.37
VBQ score2.79 ± 0.58
Table 2. The correlation between age and FF/VBQ score.
FFGREFFSEVBQ Score
rprprp
All (n = 344)0.583<0.0010.477<0.0010.468<0.001
Age < 50 (n = 79)0.538<0.0010.488<0.0010.3720.001
Age ≥ 50 (n = 265)0.1990.0010.1110.0700.1830.003
FFGRE, fat fraction (FF) measured using gradient-echo based chemical shift-encoded MRI (CSE-MRI); FFSE, FF measured using spin-echo based CSE-MRI; the VBQ score, vertebral bone quality score.
Disclaimer/Publisher’s Note: The statements, opinions and data contained in all publications are solely those of the individual author(s) and contributor(s) and not of MDPI and/or the editor(s). MDPI and/or the editor(s) disclaim responsibility for any injury to people or property resulting from any ideas, methods, instructions or products referred to in the content.

