Abstract
Epithelial ovarian cancer (EOC) is the18th most common cancer worldwide and the 8th most common in women. The aim of this study was to diagnose the potential importance of, as well as novel genes linked with, EOC and to provide valid biological information for further research. The gene expression profiles of E-MTAB-3706 which contained four high-grade ovarian epithelial cancer samples, four normal fallopian tube samples and four normal ovarian epithelium samples were downloaded from the ArrayExpress database. Pathway enrichment and Gene Ontology (GO) enrichment analysis of differentially expressed genes (DEGs) were performed, and protein-protein interaction (PPI) network, microRNA-target gene regulatory network and TFs (transcription factors) -target gene regulatory network for up- and down-regulated were analyzed using Cytoscape. In total, 552 DEGs were found, including 276 up-regulated and 276 down-regulated DEGs. Pathway enrichment analysis demonstrated that most DEGs were significantly enriched in chemical carcinogenesis, urea cycle, cell adhesion molecules and creatine biosynthesis. GO enrichment analysis showed that most DEGs were significantly enriched in translation, nucleosome, extracellular matrix organization and extracellular matrix. From protein-protein interaction network (PPI) analysis, modules, microRNA-target gene regulatory network and TFs-target gene regulatory network for up- and down-regulated, and the top hub genes such as E2F4, SRPK2, A2M, CDH1, MAP1LC3A, UCHL1, HLA-C (major histocompatibility complex, class I, C), VAT1, ECM1 and SNRPN (small nuclear ribonucleoprotein polypeptide N) were associated in pathogenesis of EOC. The high expression levels of the hub genes such as CEBPD (CCAAT enhancer binding protein delta) and MID2 in stages 3 and 4 were validated in the TCGA (The Cancer Genome Atlas) database. CEBPD andMID2 were associated with the worst overall survival rates in EOC. In conclusion, the current study diagnosed DEGs between normal and EOC samples, which could improve our understanding of the molecular mechanisms in the progression of EOC. These new key biomarkers might be used as therapeutic targets for EOC.
1. Introduction
Epithelial ovarian cancer (EOC) is one of the most common gynecological malignancies. At present, the therapy of ovarian cancer patients depends broadly on pathologic staging, while pathological biopsies still play a crucial role during diagnosis. The majority of patients with EOC exhibit a poor prognosis, and the disease is characterized by a high mortality rate [1]. Although various breakthroughs in this field allow for the clinical management of EOC, its underlying molecular mechanisms remain poorly understood. The mortality caused by EOC has lowered dramatically in the last decade due to great developments in early diagnosis and treatment [2]. The essential clinical diversity is most likely due to the genetic heterogeneity of each EOC patient [3]. Therefore, determining the diversity in the genetic profile of EOC that controls the prognosis, as well as specific risk evaluation based on genetic screening, would lead to novel and more powerful clinical strategies for treatment.
A large number of reports have been published to explore the molecular mechanism of EOC advancement. It has been shown that stimulation of oncogenes and inactivation of tumor suppressor genes are important for the induction and development of EOC [4,5,6].Nakayama et al. [7] found that multiple subsets of biomarkers undergo genetic changes, i.e., either activation or inactivation, during advancements and improvements of EOC Moreover, the deregulation of molecules in several cell signaling pathways, such as PI3K, AKT1 (AKT serine/threonine kinase 1), MET (MET proto-oncogene, receptor tyrosine kinase), HGF (Hepatocyte growth factor precursor), and their molecular crosstalk also play crucial roles in the molecular pathogenesis of E [8,9]. In addition, epigenetic alterations, such as DNA methylation and chromatin adjustment, are also accepted as crucial sharing factors in OC, and may provide useful molecular markers for disease advancement [10,11]. Though great advances have been made, the molecular mechanisms of EOC arefar from beingfully understood.
In recent years, microarray technology has been widely used to effect general genetic modifications during cancer progression [12,13]. Bioinformatics approaches are necessary to process the large amount of data that is generated by the microarray technology. In this analysis, we chose E-MTAB-3706 from array express, and used the limma R bioconductor package tool to detect differentially expressed genes (DEGs). Pathway enrichment analysis and gene enrichment analysis of up and down-regulated DEGs were carried out. We established a PPI network of the up- and down-regulated DEGs and picked out hub genes with high degrees of connectivity, high betweenness centrality, high stress centrality, high closeness centrality and low clustering coefficients. In addition, module analyses were performed. We also constructed a miRNA-target gene and TF- target gene interaction network. Overall survival (OS) analyses of these DEGs were made. Then, a correlation analysis based on TCGA database was performed to anticipate the probable relationship between genes, and served to inform the specific medicine treatment for patients. Therefore, it is a better way for us to further understand the molecular mechanisms of EOC.
2. Materials and Methods
2.1. Microarray Data
The microarray expression profile dataset E-MTAB-3706, which is based on the Illumina HumanHT-12_V4_0_R2_15002873_B Expression BeadChip (Illumina Way, San Diego, CA, USA), was downloaded from the European Bioinformatics Institute ArrayExpress database (https://www.ebi.ac.uk/arrayexpress/experiments/E-MTAB-3706/). The dataset contained 12 samples, including four high-grade ovarian epithelial cancer samples, four normal fallopian tube samples and four normal ovarian epithelium samples.
2.2. Identification of DEGs
Gene microarray analysis was handled through the R programming software (https://www.r-project.org/). Briefly, raw txt data were imported into R through lumi and beadarray version 3.6 package [14,15] and background correction, quantile normalization and microarray data condensation were performed. The common DEGs between high-grade ovarian epithelial cancer and normal ovarian epithelium were considered as the hub gens using limma package in R Bioconductor [16]. Genes with fold changes> 1 for up-regulated genes, fold changes >−1 for down-regulated genes and FDR (false discovery rate) < 0.0000015 were considered as highly significant.
2.3. Pathway Enrichment Analysis
Pathway enrichment analysis was performed using the online tool ToppCluster (http://toppcluster.cchmc.org) [17], which integrates different pathway databases such as The Kyoto Encyclopedia of Genes and Genomes (KEGG) (http://www.genome.jp/kegg/) [18], BIOCYC (https://biocyc.org/) [19], Pathway Interaction Database (PID) (http://pid.nci.nih.gov) [20], Reactome (http://www.reactome.org) [21], GenMAPP (http://www.genmapp.org/) [22], MSigDB C2 BIOCARTA (http://software.broadinstitute.org/gsea/msigdb/collections.jsp) [23], PantherDB (http://www.pantherdb.org/) [24], Pathway Ontology (https://bioportal.bioontology.org/ontologies/PW) [25] and SMPDB (http://smpdb.ca/) [26]. p ≤ 0.05 were considered to be significantly enriched pathways.
2.4. Gene Ontology (GO)Enrichment Analysis
Gene Ontology (GO) (http://www.geneontology.org/) includes the biological processes (BP), cellular components (CC) and molecular functions (MF) which are associated with genes and their products [27]. Gene ontology (GO) enrichment analysis was completed separately, using the ToppCluster (http://toppcluster.cchmc.org/) [17] online tool. p ≤ 0.05 was considered as the GO terms.
2.5. PPI Network Constructionand Analysis
To determine the interactive associations among the genes (up and down regulated) at the protein level, genes obtained from the EOC were mapped against protein-protein interaction (PPI) data using the online tool, InnateDB (http://www.innatedb.com) [28], which incorporates different PPI databases such as IntAc (https://www.ebi.ac.uk/intact/) [29], The Database of Interacting Proteins(DIP, https://dip.doe-mbi.ucla.edu/dip/Main.cgi) [30], The Molecular INTeraction Database (MINT, https://mint.bio.uniroma2.it/) [31], The Biomolecular Interaction Network Database (BIND, http://bind.ca) [32] and The Biological General Repository for Interaction Datasets (BioGRID, https://thebiogrid.org/) [33]. The topological properties (such as Node degree, betweenness centrality, stress centrality, closeness centrality and clustering coefficient) of the constructed PPI network were calculated using NetworkAnalyzer in Cytoscape (http://www.cytoscape.org/) [34].Briefly, in the networks, the nodes represent genes; the edges hinted at interactional relationships among them. The centrality of a network is expressed by the central degree, which is the granting of one gene to the genes in the proximity; this is expressed by the area of the nodes.The higher the degree value, the higher the area of the node. Therefore, important genes may be found from the PPI networks.
2.6. Module Analysis
To find modules ofhub genes in the PPI network, PEWCC1 [35] from Cytoscape (www.cytoscape.org/) [34] was subsequently applied. Module analysis resolves the associations between genes, and can help in the search for an important gene based upon complex regulatory associations.
2.7. Construction of the microRNA-Target Gene Regulatory Network
We obtained correlations between miRNAs and target genes using TarBase (http://www.diana.pcbi.upenn.edu/tarbase) [36] and the miRTarBase database (http://miRTarBase.mbc.nctu.edu.tw/) [37] through an online graph file generator NetworkAnalyst (http://www.networkanalyst.ca/) [38], which was visualized using Cytoscape version 3.6.0 (www.cytoscape.org/) [34].
2.8. Construction of the TFs-Target Gene Regulatory Network
The control of gene expression by TFs is crucial. The analysis of TF binding sites is necessary for research into gene control systems. In the present study, a transcriptional regulatory network was constructed using ChIP-X database (ChEA) (http://amp.pharm.mssm.edu/lib/chea.jsp) [39] using an online graph file generator NetworkAnalyst (http://www.networkanalyst.ca/) [38] and visualized using Cytoscape software version 3.6.0 (www.cytoscape.org/) [34].
2.9. Validation of the Expression Level of Hub Genes in PPI Network
The mRNA expression of the DEGs was analyzed in different stages of EOC with the assistance of UALCAN (http://ualcan.path.uab.edu/index.html) [40], which is an online tool thatdelivers customizable functionalities based on The Cancer Genome Atlas (TCGA).In the present study, the web tool was used to validate the expression levels of hub genes in the PPI network. A boxplot was generated to visualize any modified expression of hub genes.
2.10. Association of Hub Genes Expression with Survival of Patients with EOC
The online tool, UALCAN (http://ualcan.path.uab.edu/index.html) [40], was used to determine whether the hub genes could predict EOC patients’ survival. UALCAN integrates gene expression data with relapse-free and overall survival information from TCGA. Patients were categorized into high and low expression categories, according to the median value of hub gene expression. p-value < 0.05 was considered to be statistically significant.
3. Results
3.1. Data Source and DEGs Screening
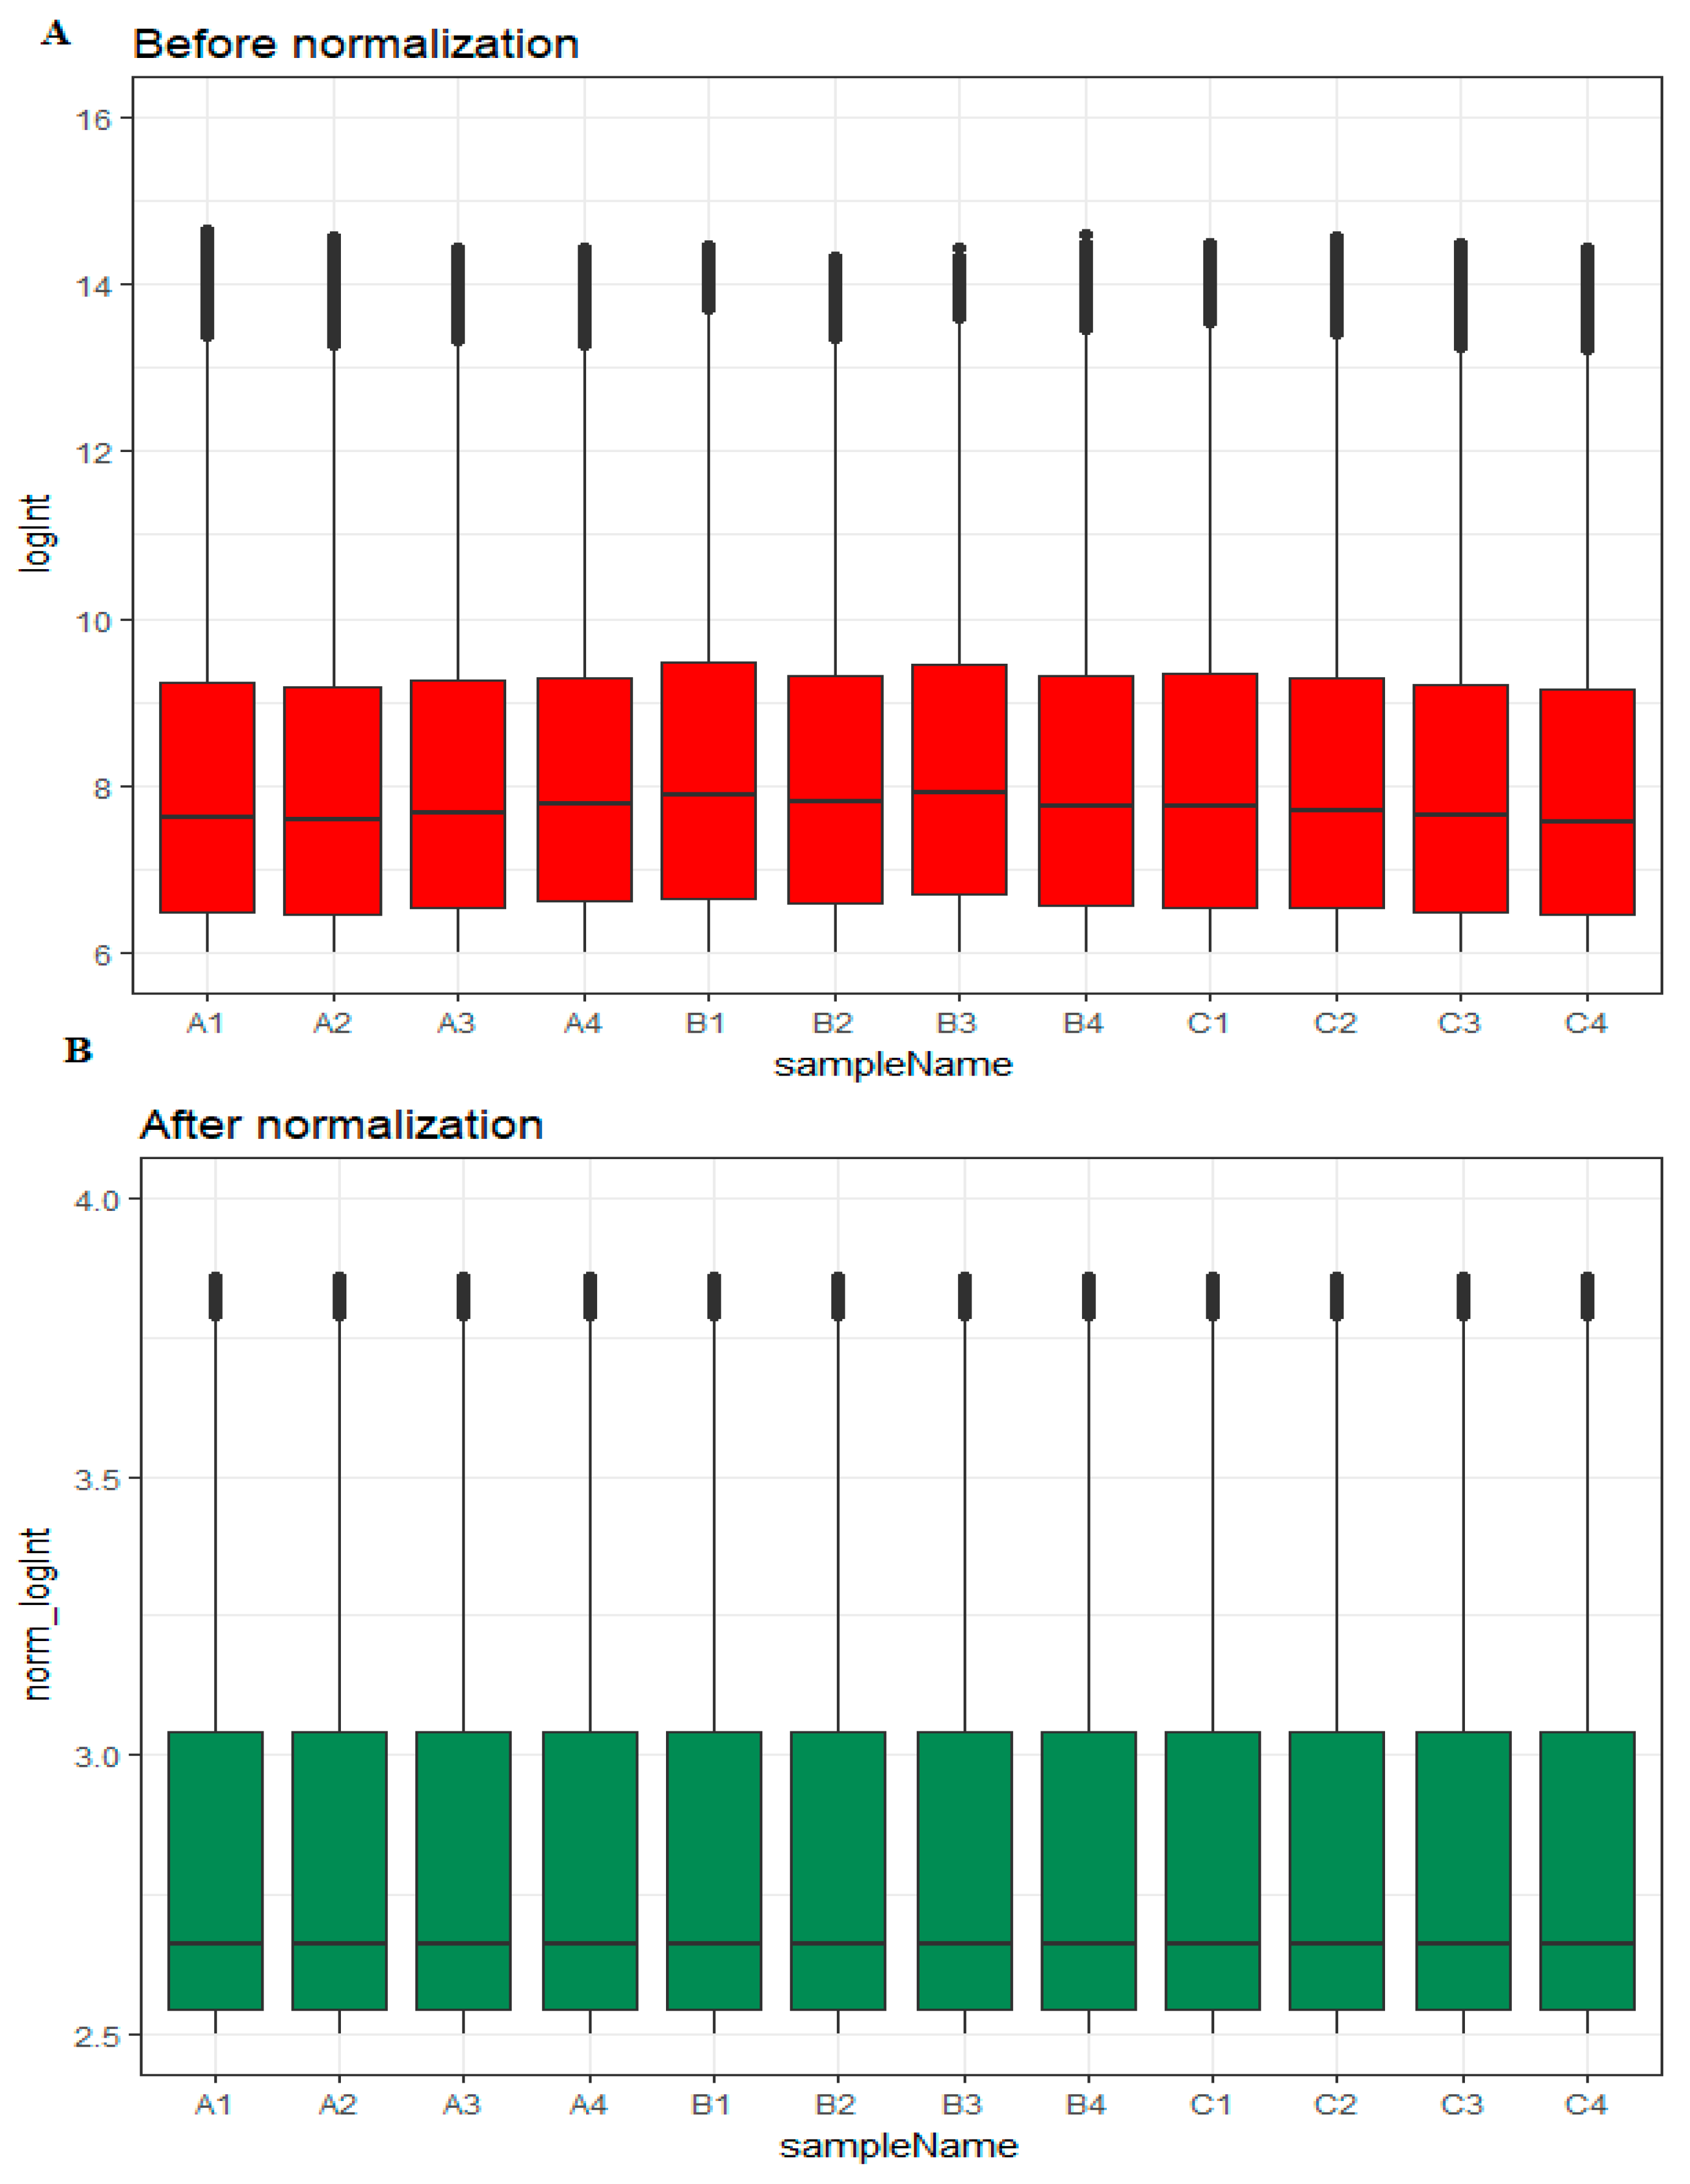
Box plots before and after normalization of the raw data is shown in Figure 1A,B, respectively. Based on their EOC status, samples were divided into three groups: high-grade ovarian epithelial cancer (n = 4), normal fallopian tube (n = 4) and normal ovarian epithelium (n = 4).
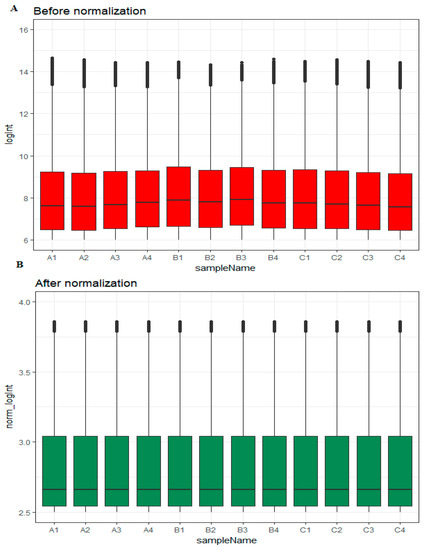
Figure 1.
Box plots of the expression profiles. (A): Before normalization (red) and (B): after normalization (green). (A1, A2, A3, A4 = high-grade ovarian epithelial cancer, B1, B2, B3, B4 = normal fallopian tube samples, C1, C2, C3, C4 = normal ovarian epithelium samples).
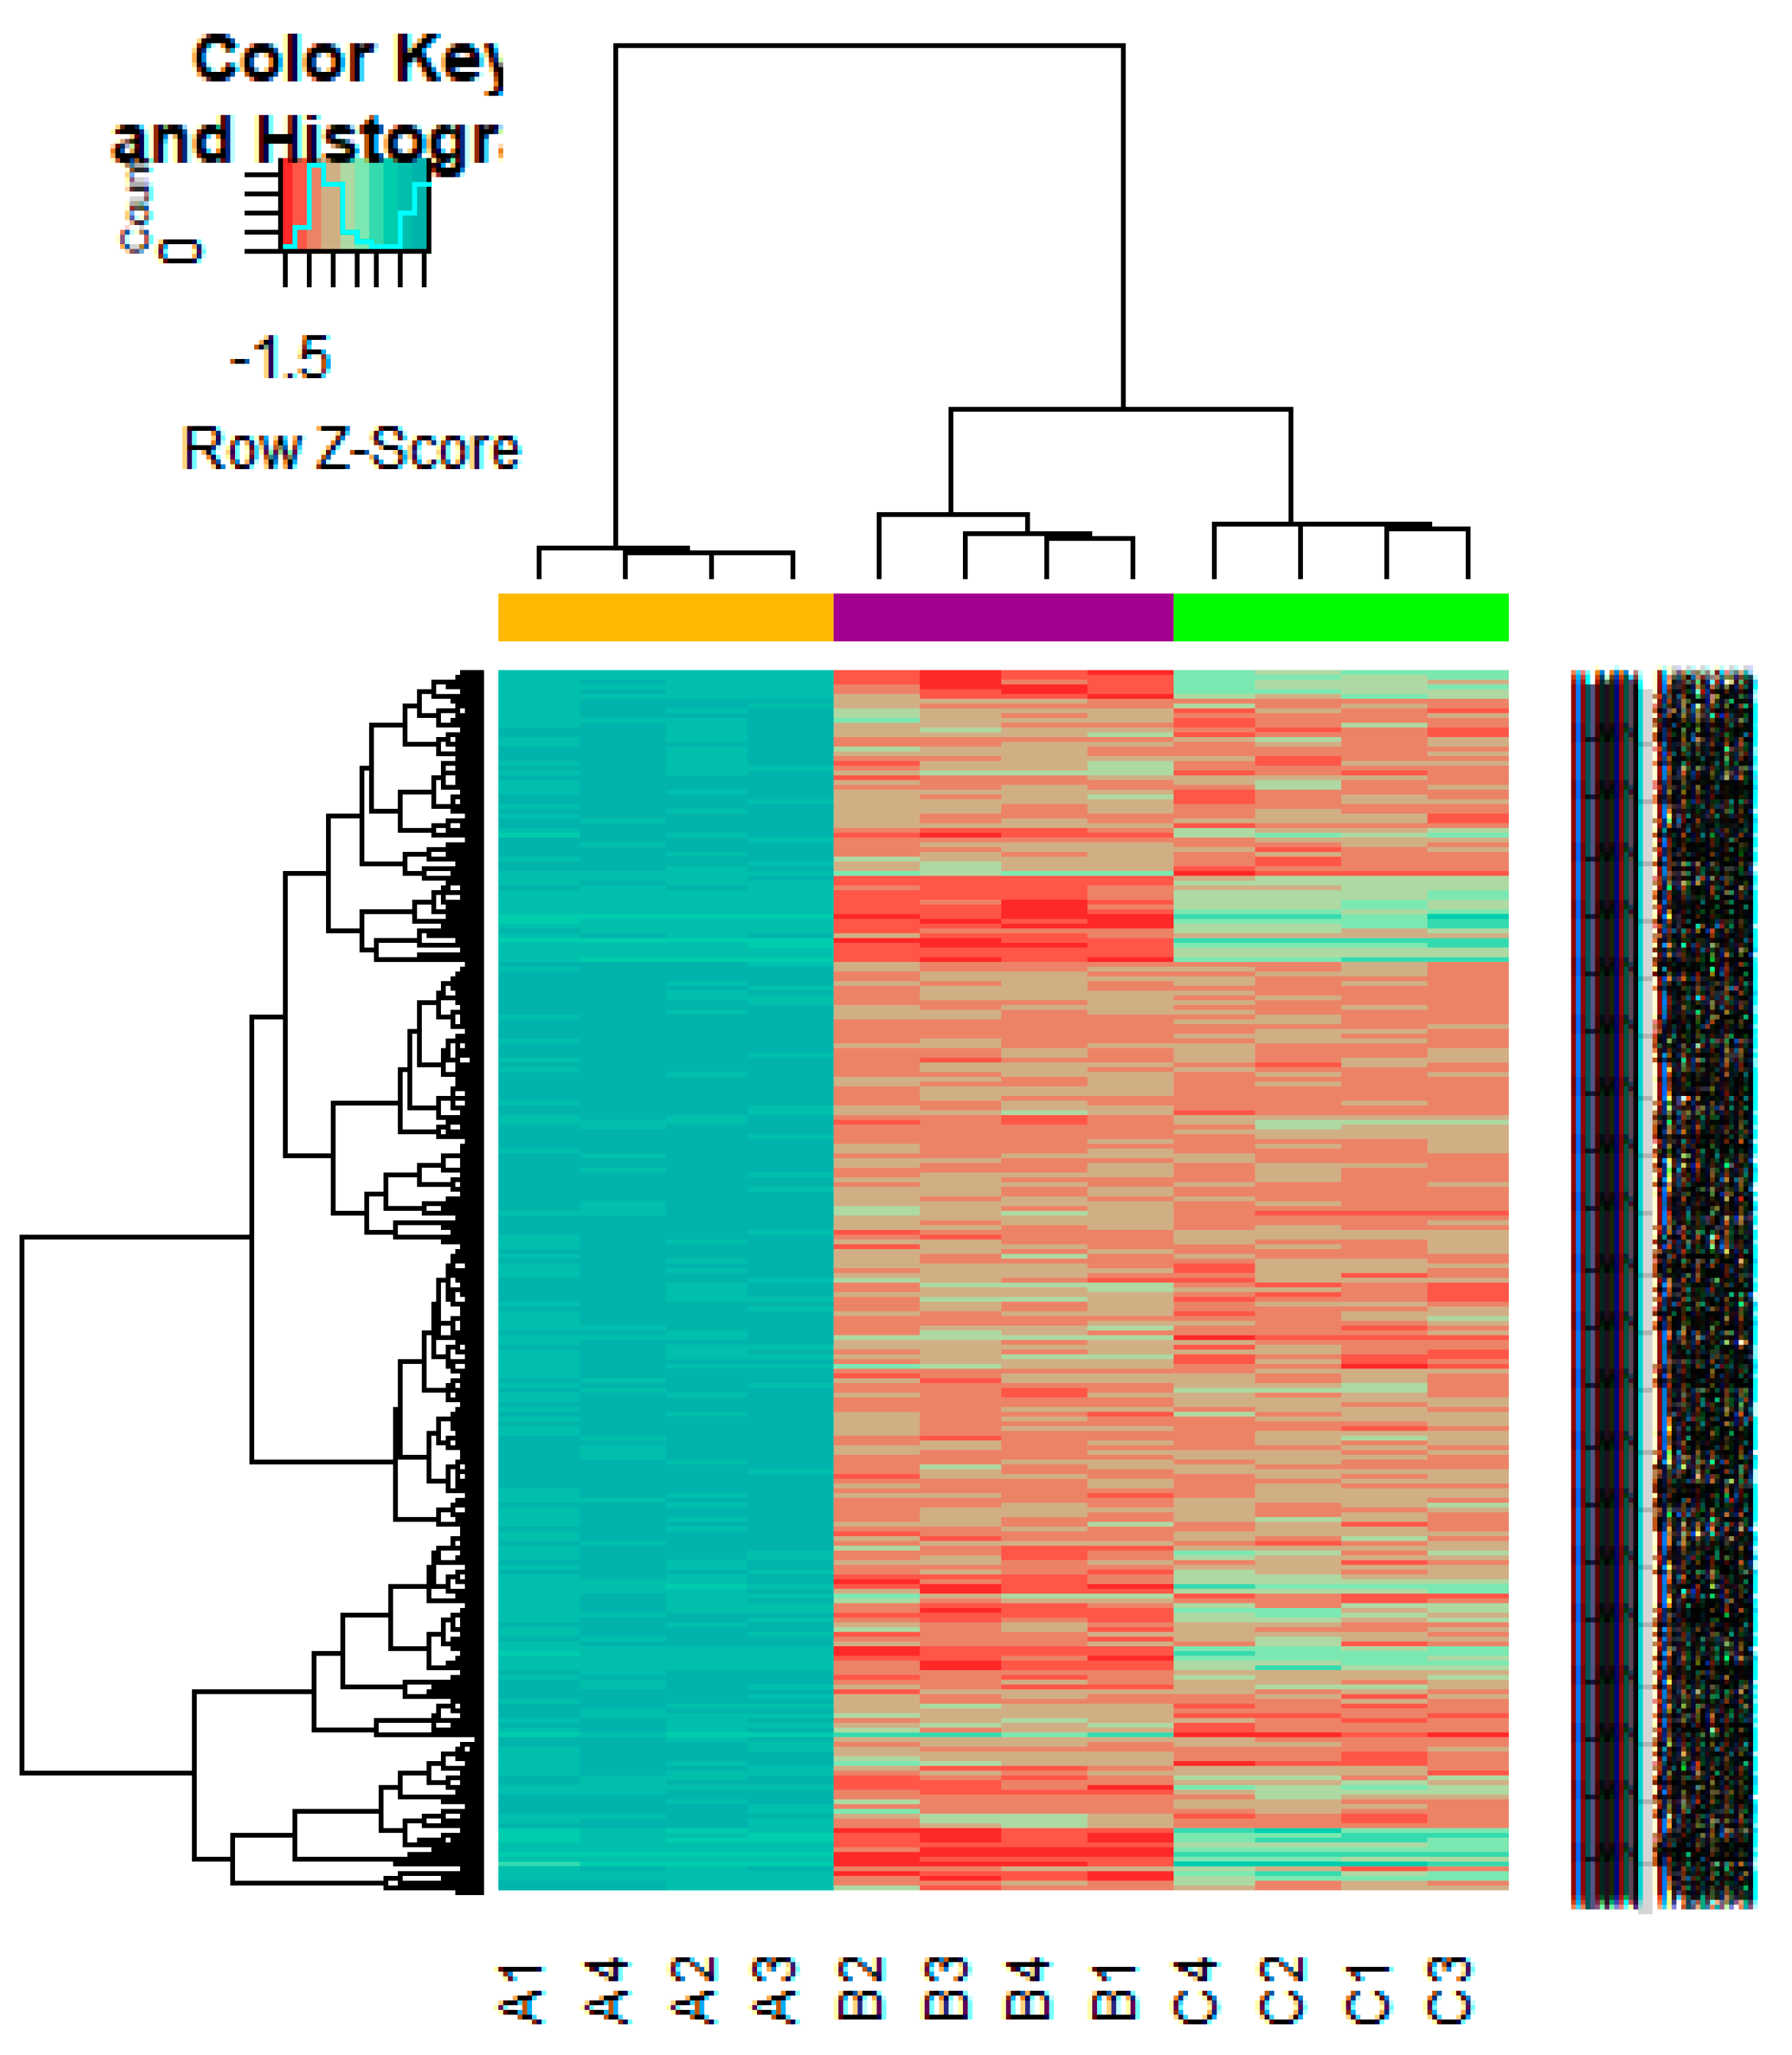
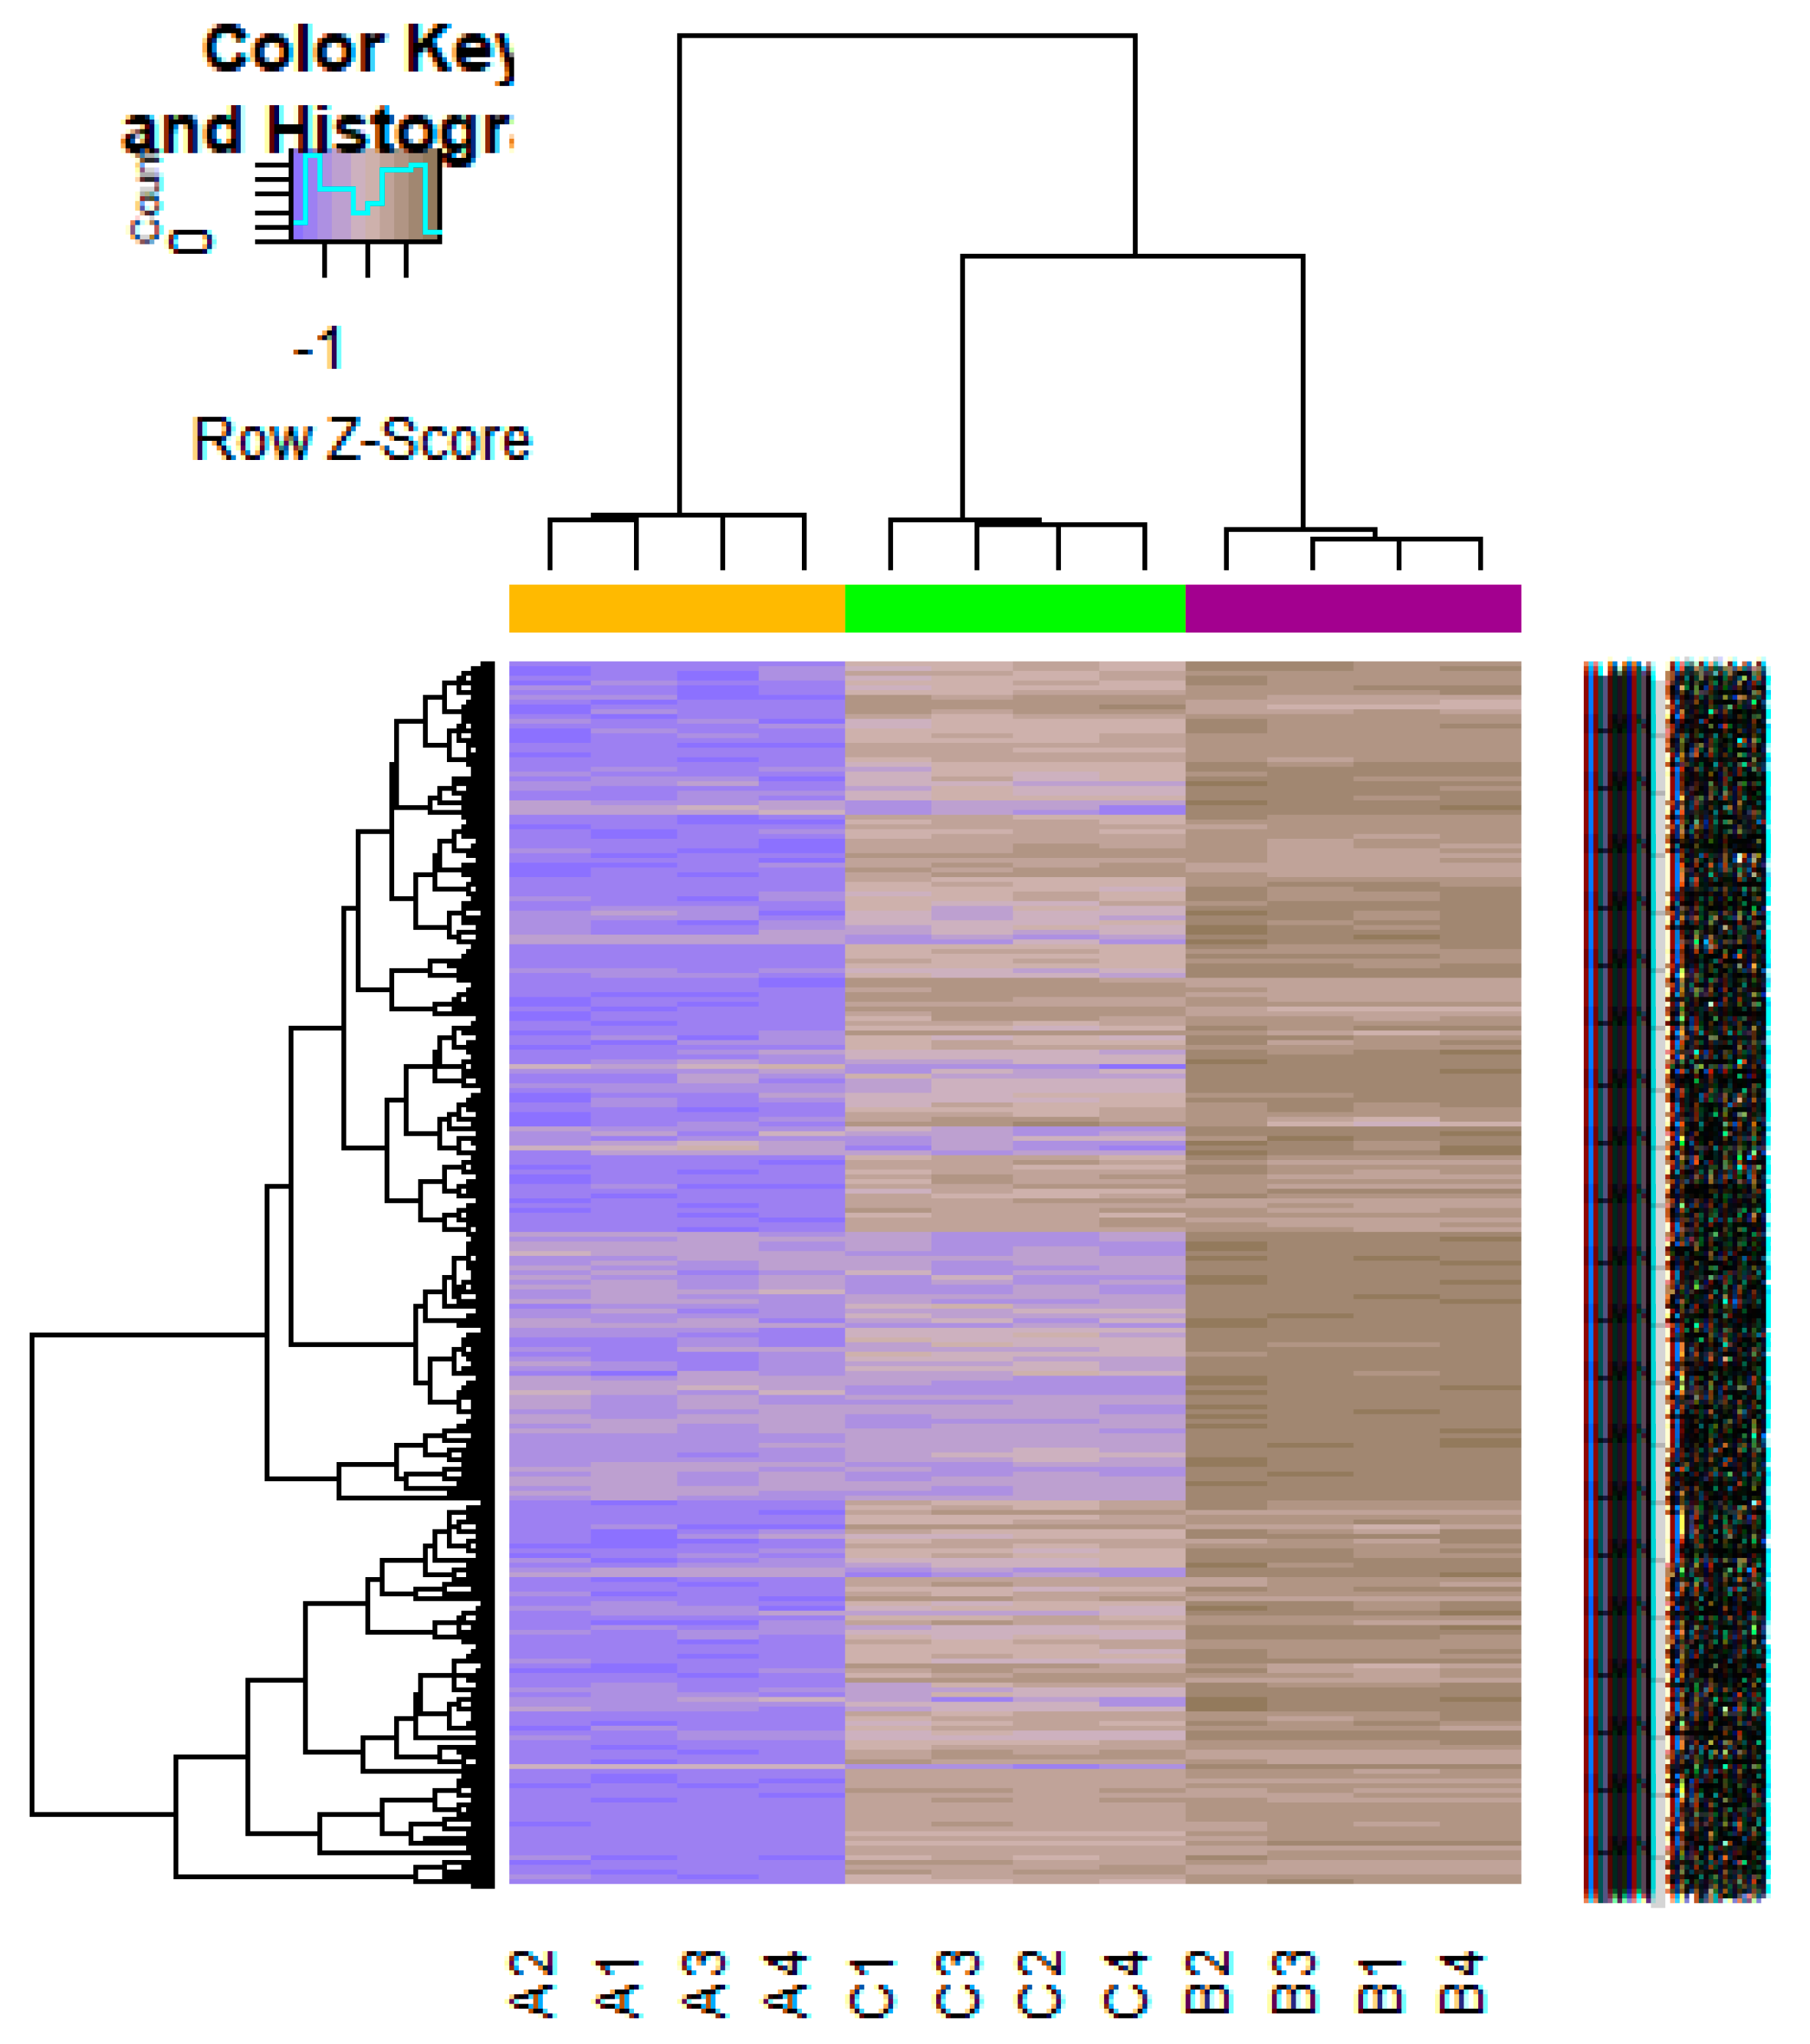
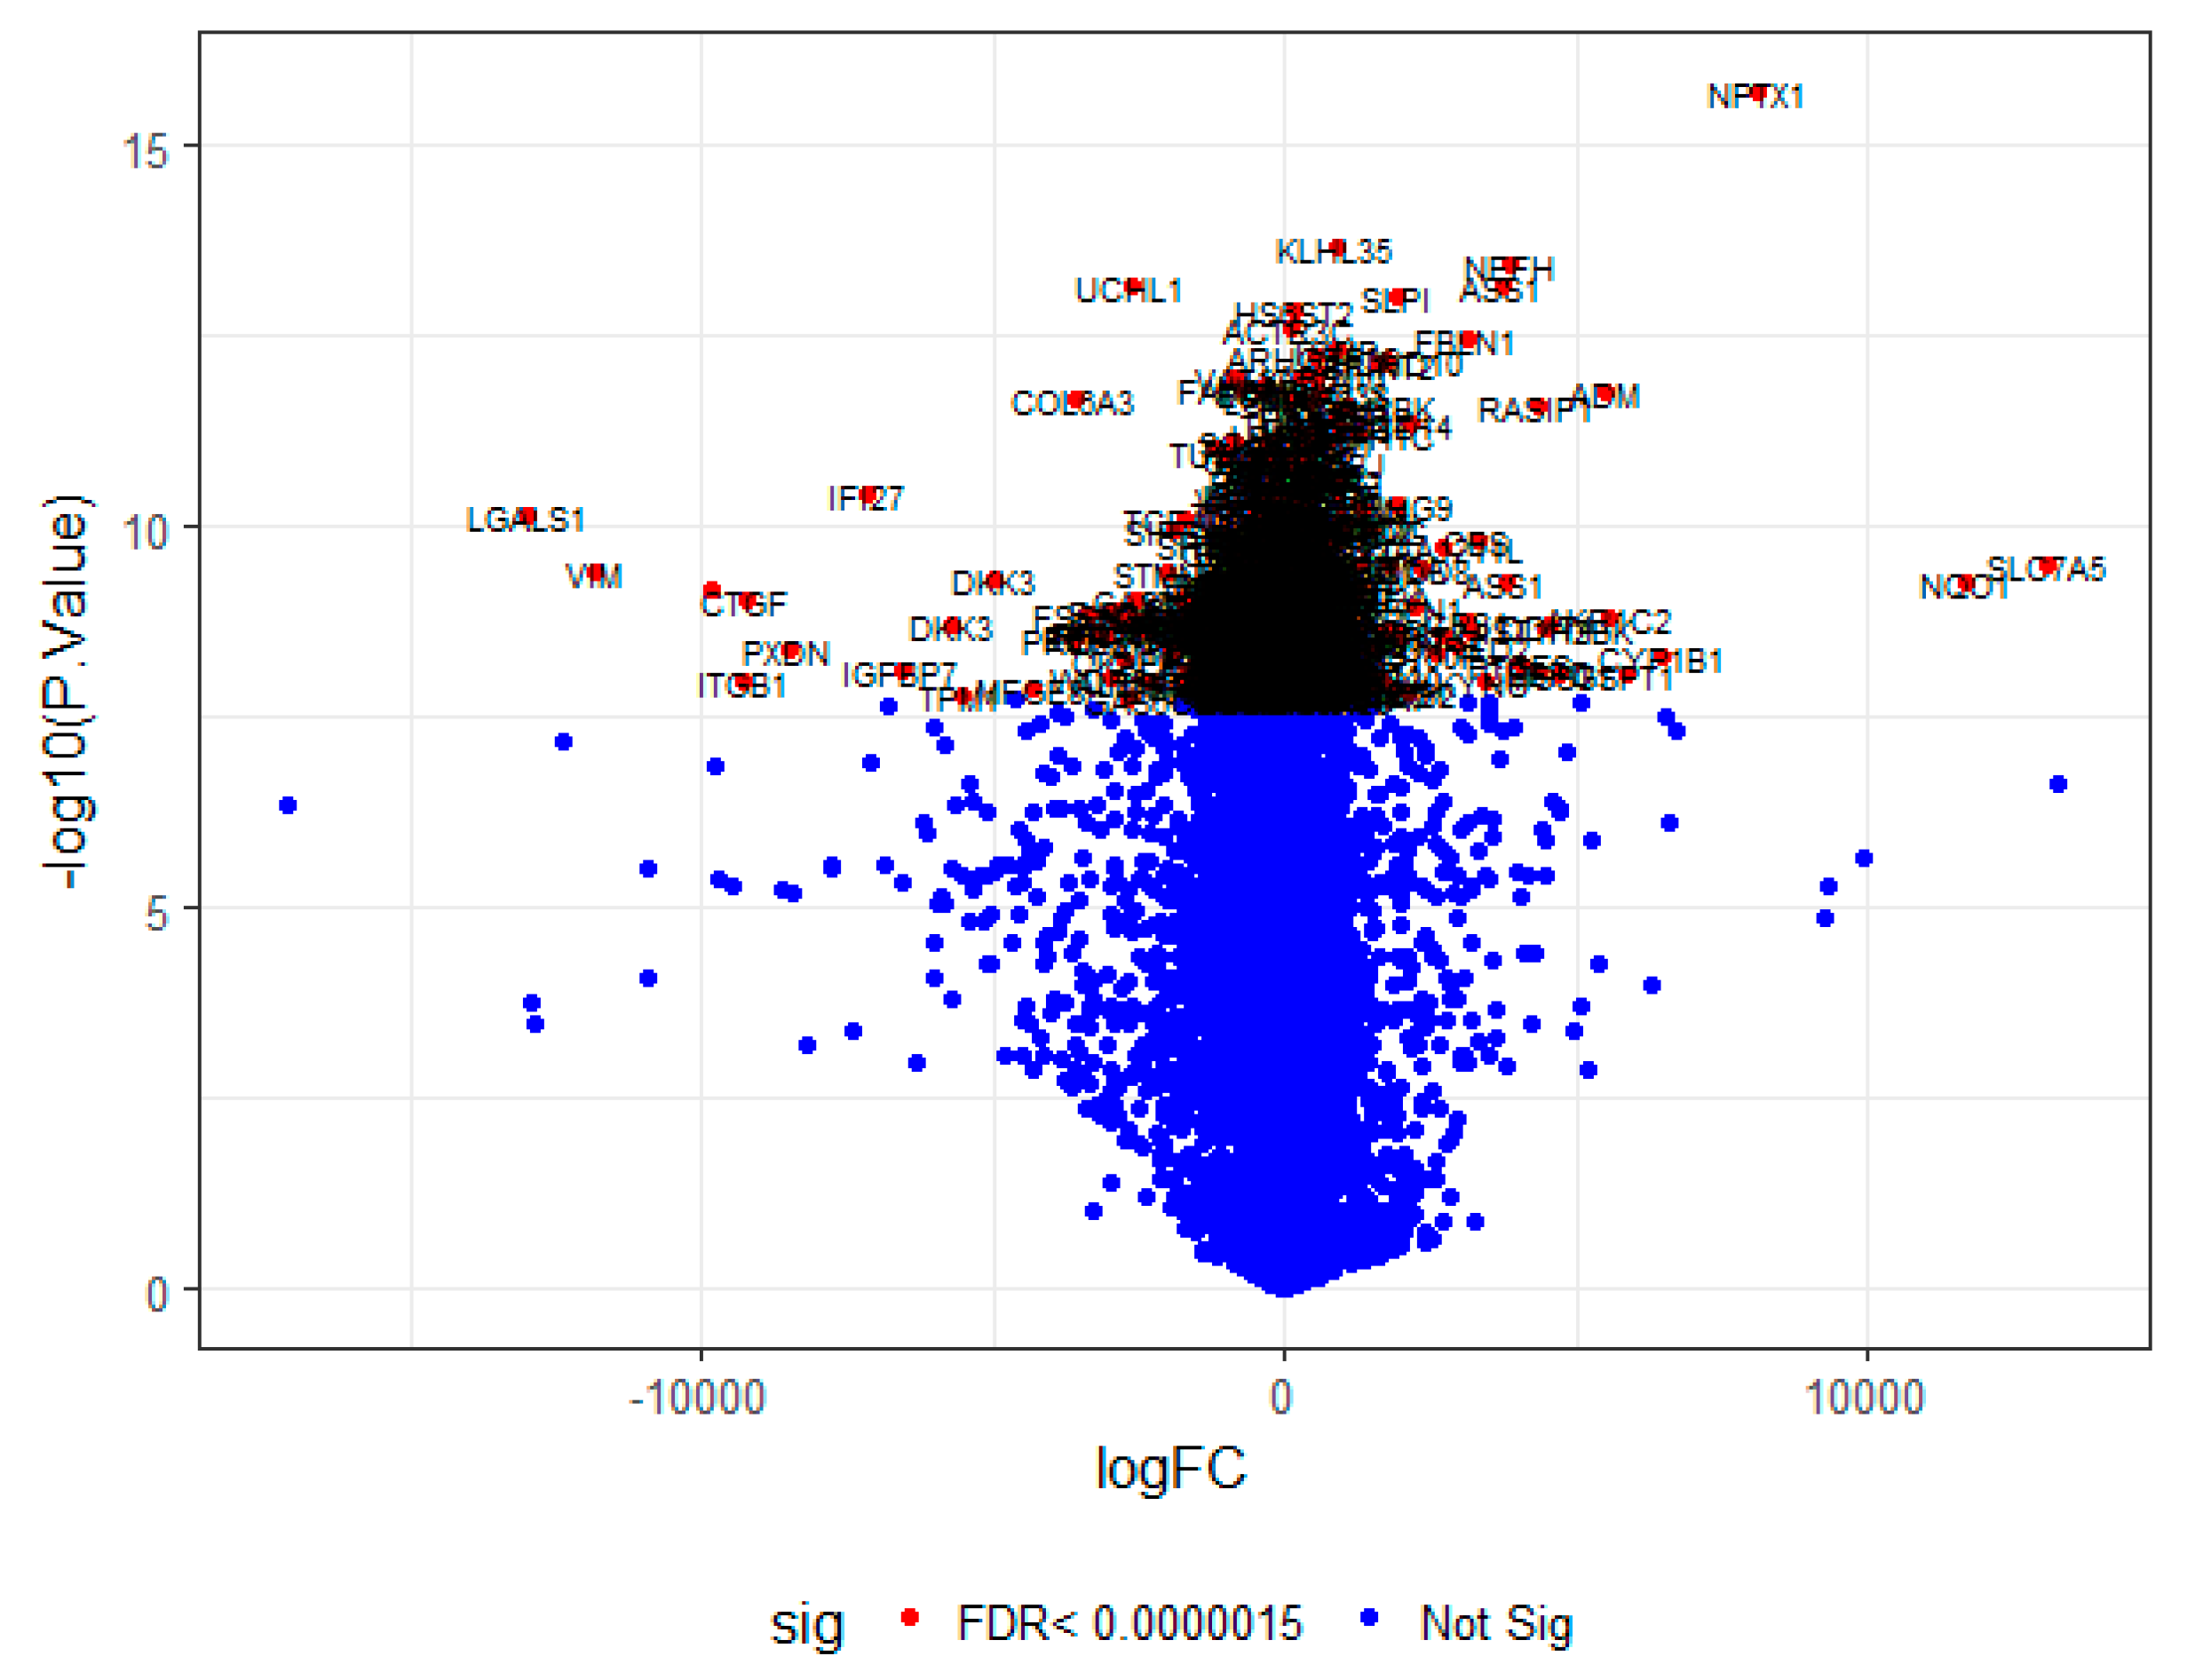
On the basis of the threshold criteria, a total of 552 DEGs were obtained, including 276up-regulated and 276 down-regulated genes in high-grade ovarian epithelial cancer samples, compared with normal ovarian epithelium samples (supplementary Table S1). FDR< 0.0000015, |logFC (fold change)| > 1 for up-regulated genes and |logFC| >− 1 for down-regulated genes. The hierarchical clustering analysis of up and down regulated genes in the dataset is shown in Figure 2 and Figure 3. A volcano plot was constructed to show the DEGs which might play key roles in EOC (Figure 4).
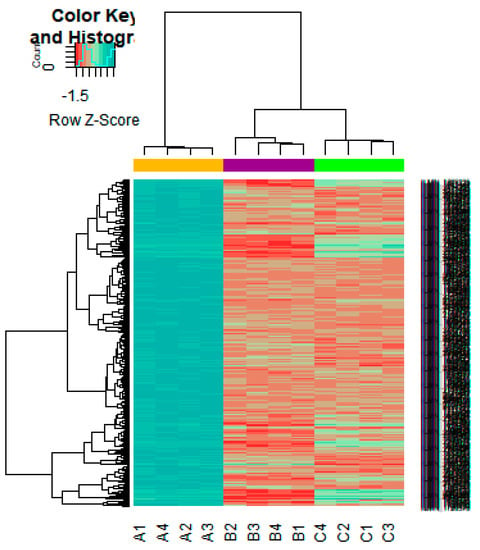
Figure 2.
Heat map of gene expression (Up-regulated genes). The color key represents the logFCofDEGs. FC, fold change (A1, A2, A3, A4 = high-grade ovarian epithelial cancer, B1, B2, B3, B4 = normal fallopian tube samples, C1, C2, C3, C4 = normal ovarian epithelium samples).
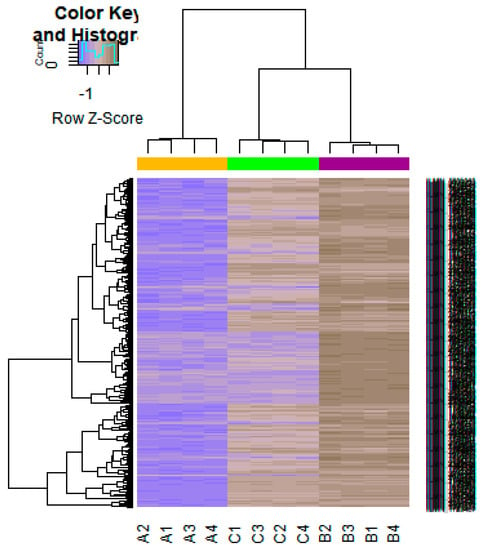
Figure 3.
Heat map of gene expression (Down-regulated genes). The color key represents the logFC ofDEGs. FC, fold change (A1, A2, A3, A4 = high-grade ovarian epithelial cancer, B1, B2, B3, B4 = normal fallopian tube samples, C1, C2, C3, C4 = normal ovarian epithelium samples).
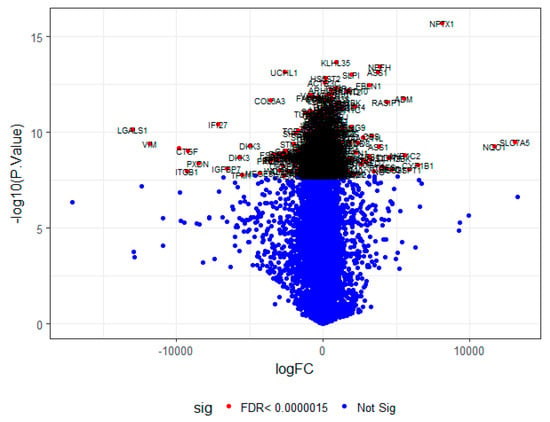
Figure 4.
A volcano plot of differentially-expressed genes.
3.2. Pathway Enrichment Analysis
To initially comprehend the action of the genes, we submitted up and down regulated genes, respectively, to the online software, ToppCluster, to identify related pathways from different pathway databases such as KEGG, BIOCYC, PID, Reactome, GenMAPP, MSigDB C2 BIOCARTA, PantherDB, Pathway Ontology and SMPDB. Pathway enrichment analysis results showed that up-regulated genes were significantly enriched in chemical carcinogenesis, cell adhesion molecules (CAMs), urea cycle, creatine biosynthesis, EPHA2 forward signaling, syndecan-4-mediated signaling events, packaging of telomere ends, extracellular matrix organization, arginine and proline metabolism, glutathione metabolism, genes encoding enzymes and their regulators involved in the remodeling of the extracellular matrix, ensemble of genes encoding core extracellular matrix including ECM (Extracellular matrix) glycoproteins, collagens and proteoglycans, nicotine degradation, integrin signaling pathway, arginine and proline metabolic, ubiquitin/proteasome degradation, verapamil pathway and diltiazem pathway (supplementary Table S2).Down-regulated genes were mainly significantly enriched in the cell adhesion molecules (CAMs), axon guidance, creatine biosynthesis, 1D-myo-inositol hexakisphosphate biosynthesis II (mammalian), syndecan-4-mediated signaling events, amb2 integrin signaling, extracellular matrix organization, integrin cell surface interactions, glutathione metabolism, ensemble of genes encoding core extracellular matrix including ECM glycoproteins, collagens and proteoglycans, genes encoding structural ECM, integrin signaling pathway, methionine biosynthesis, ubiquitin/proteasome degradation, altered ubiquitin/proteasome degradation, guanidinoacetatemethyltransferase deficiency (GAMT Deficiency) and inositol metabolism(supplementary Table S3).
3.3. Gene Ontology Enrichment Analysis
According to the functional annotation in the GO database, the up-regulated geneswere mostly enriched in biological processes (BP) related to the translation andpeptide biosynthetic process, cellular component (CC) terms such as nucleosome and DNA packaging complex, and molecular function (MF) terms related to serine-type endopeptidase inhibitor activity and peptidase regulator activity. The GO enrichment terms of BP, CC, and MF for up-regulated genes are listed in supplementary Table S4. Meanwhile, the down-regulated genes were enriched in BP terms such as extracellular matrix organization and extracellular structure organization, CC terms such as extracellular matrix and proteinaceous extracellular matrix and MF terms such as cell adhesion molecule binding and peroxidase activity. The GO enrichment terms of BP, CC, and MF for down-regulated genes are listed in supplementary Table S5.
3.4. PPI Network Construction
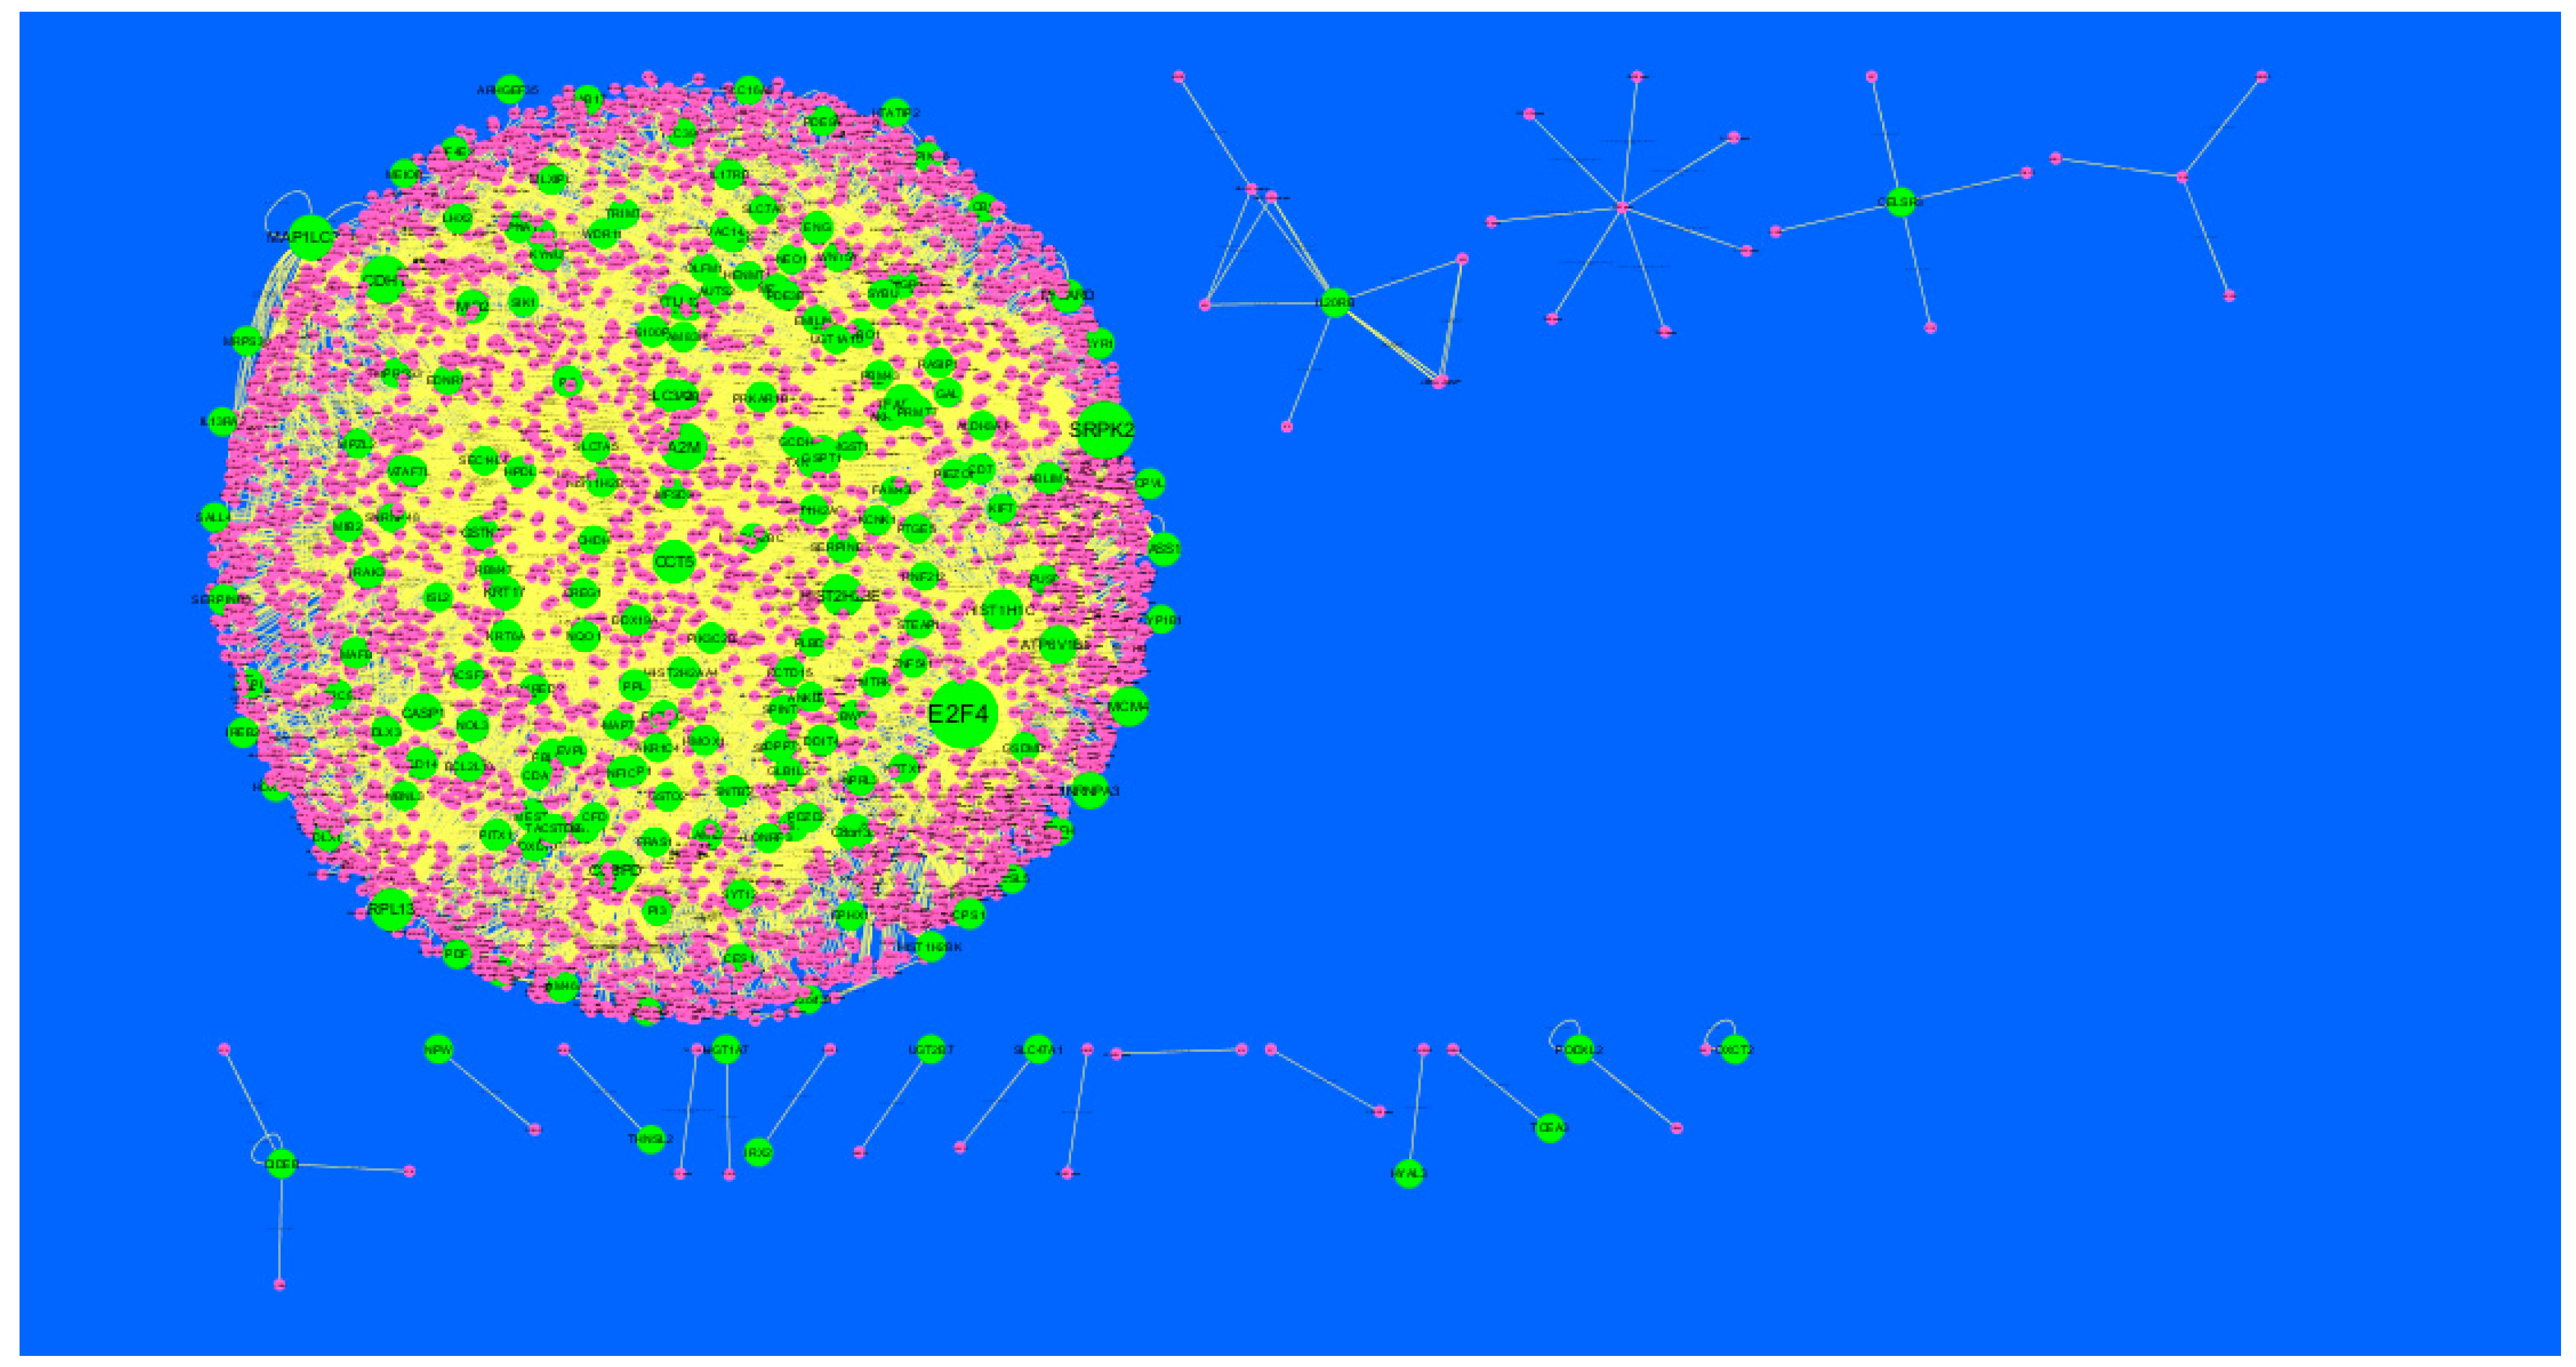
Node degree distribution was defined as the number of actual binding partners of a given protein [41]. The PPI network had (up-regulated) 4288 nodes and 8466 interactions (Figure 5). The hub gene with grater degrees such as E2F4 (degree = 479), SRPK2 (degree = 288), A2M (degree = 169), CDH1 (degree = 479) and MAP1LC3A (degree = 153) are listed in supplementary Table S6.
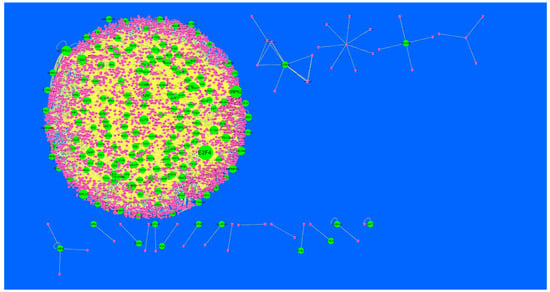
Figure 5.
Protein-protein interaction (PPI) networks for differentially-expressed genes (DEGs). (Dark green round shape node represents up-regulated genes). Pink dots are also genes which are not hub or differential expressed genes. White rod shape is interaction with adjutant genes.
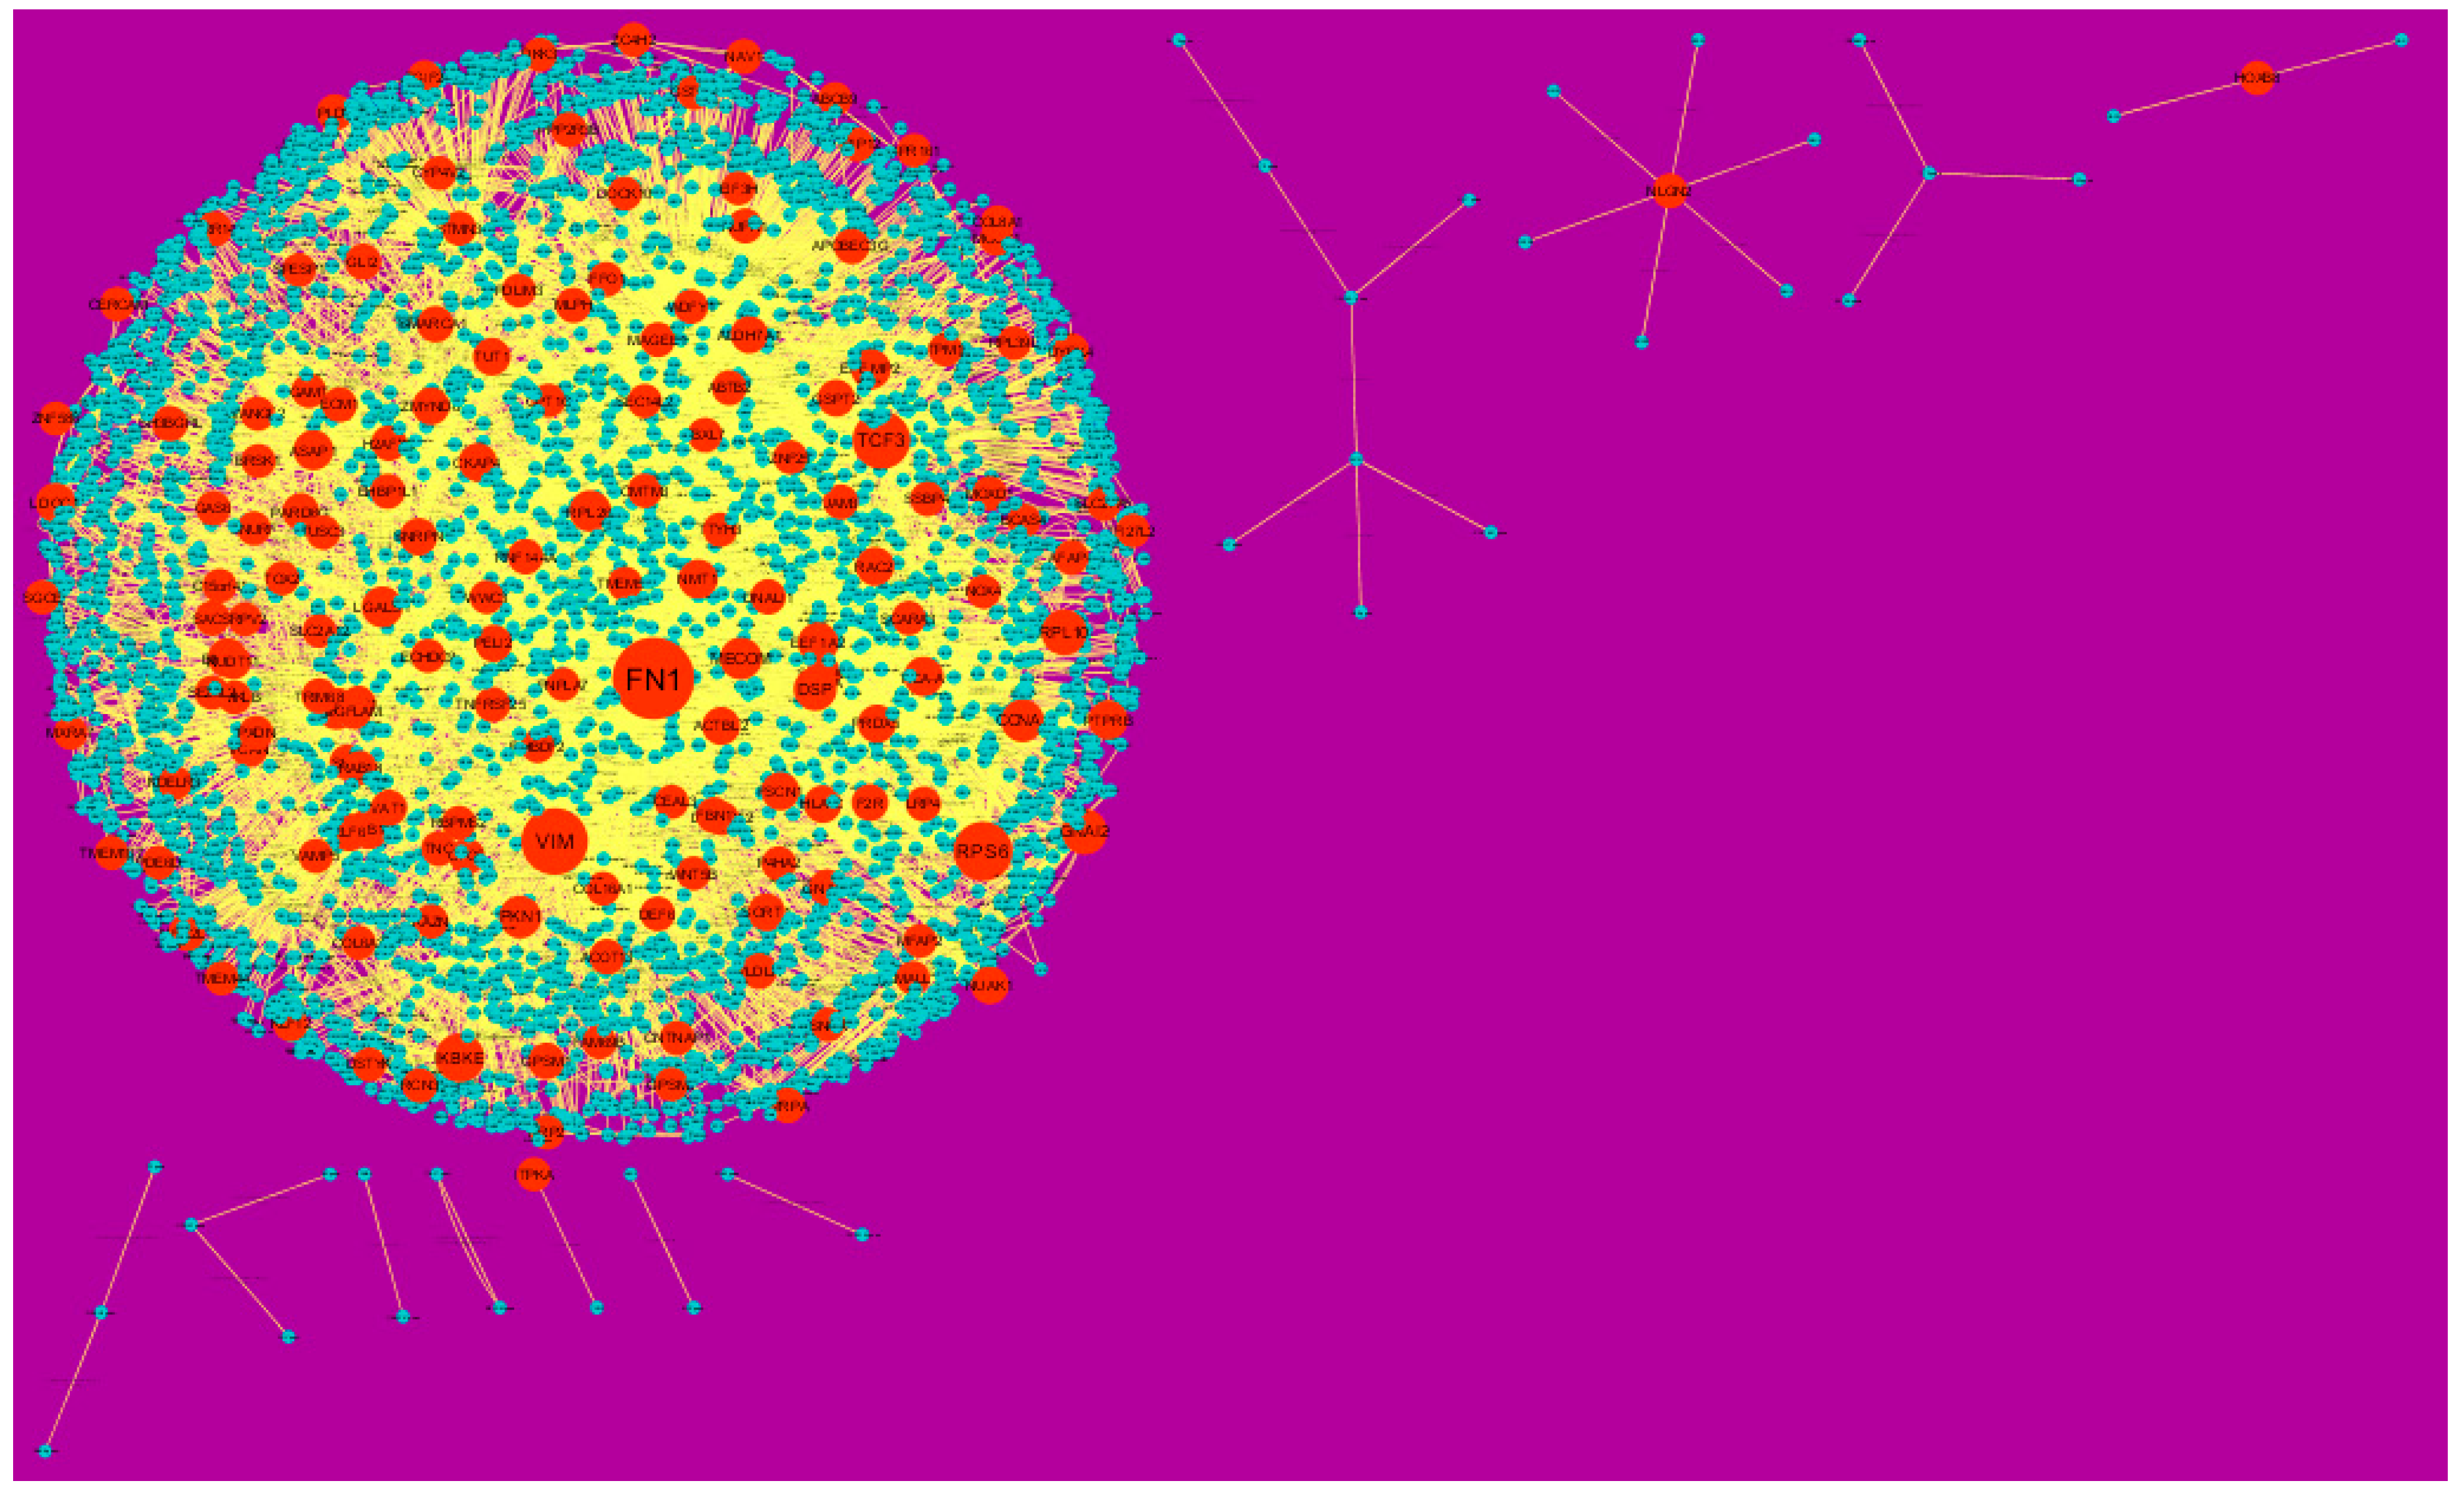
In the PPI network (down-regulated) had 3644 nodes and 7700 interactions (Figure 6).Hub genes with higher degrees such as FN1 (degree = 755), VIM (vimentin) (degree = 268), RPS6 (degree = 197), TCF3 (degree = 187) and IKBKE (inhibitor of nuclear factor kappa B kinase subunit epsilon) (degree = 117) are listed in supplementary Table S6. R square = 0.793 and correlation coefficient = 0.984 for node up regulated) (Figure 7A), meanwhile R square = 0.692 and correlation coefficient = 0.985 for node degree (down regulated) (Figure 7B).
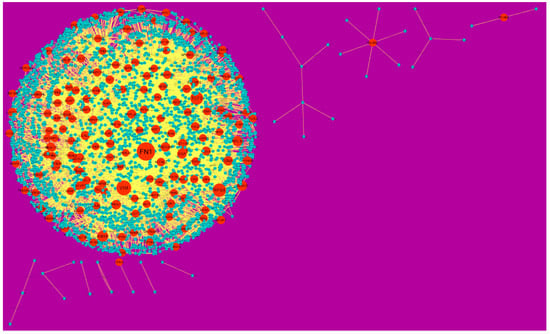
Figure 6.
Protein-protein interaction (PPI) networks for differentially-expressed genes (DEGs). (Orange round shape node represents down-regulated genes). Green dots are also genes which are not hub or differential expressed genes. orange rod shape is interaction with adjutant genes.

Figure 7.
Node degree distribution for up (A) and down (B) regulated genes. Red lines: regression lines.
3.5. Analysis of Topological Features of Nodes in PPI Network
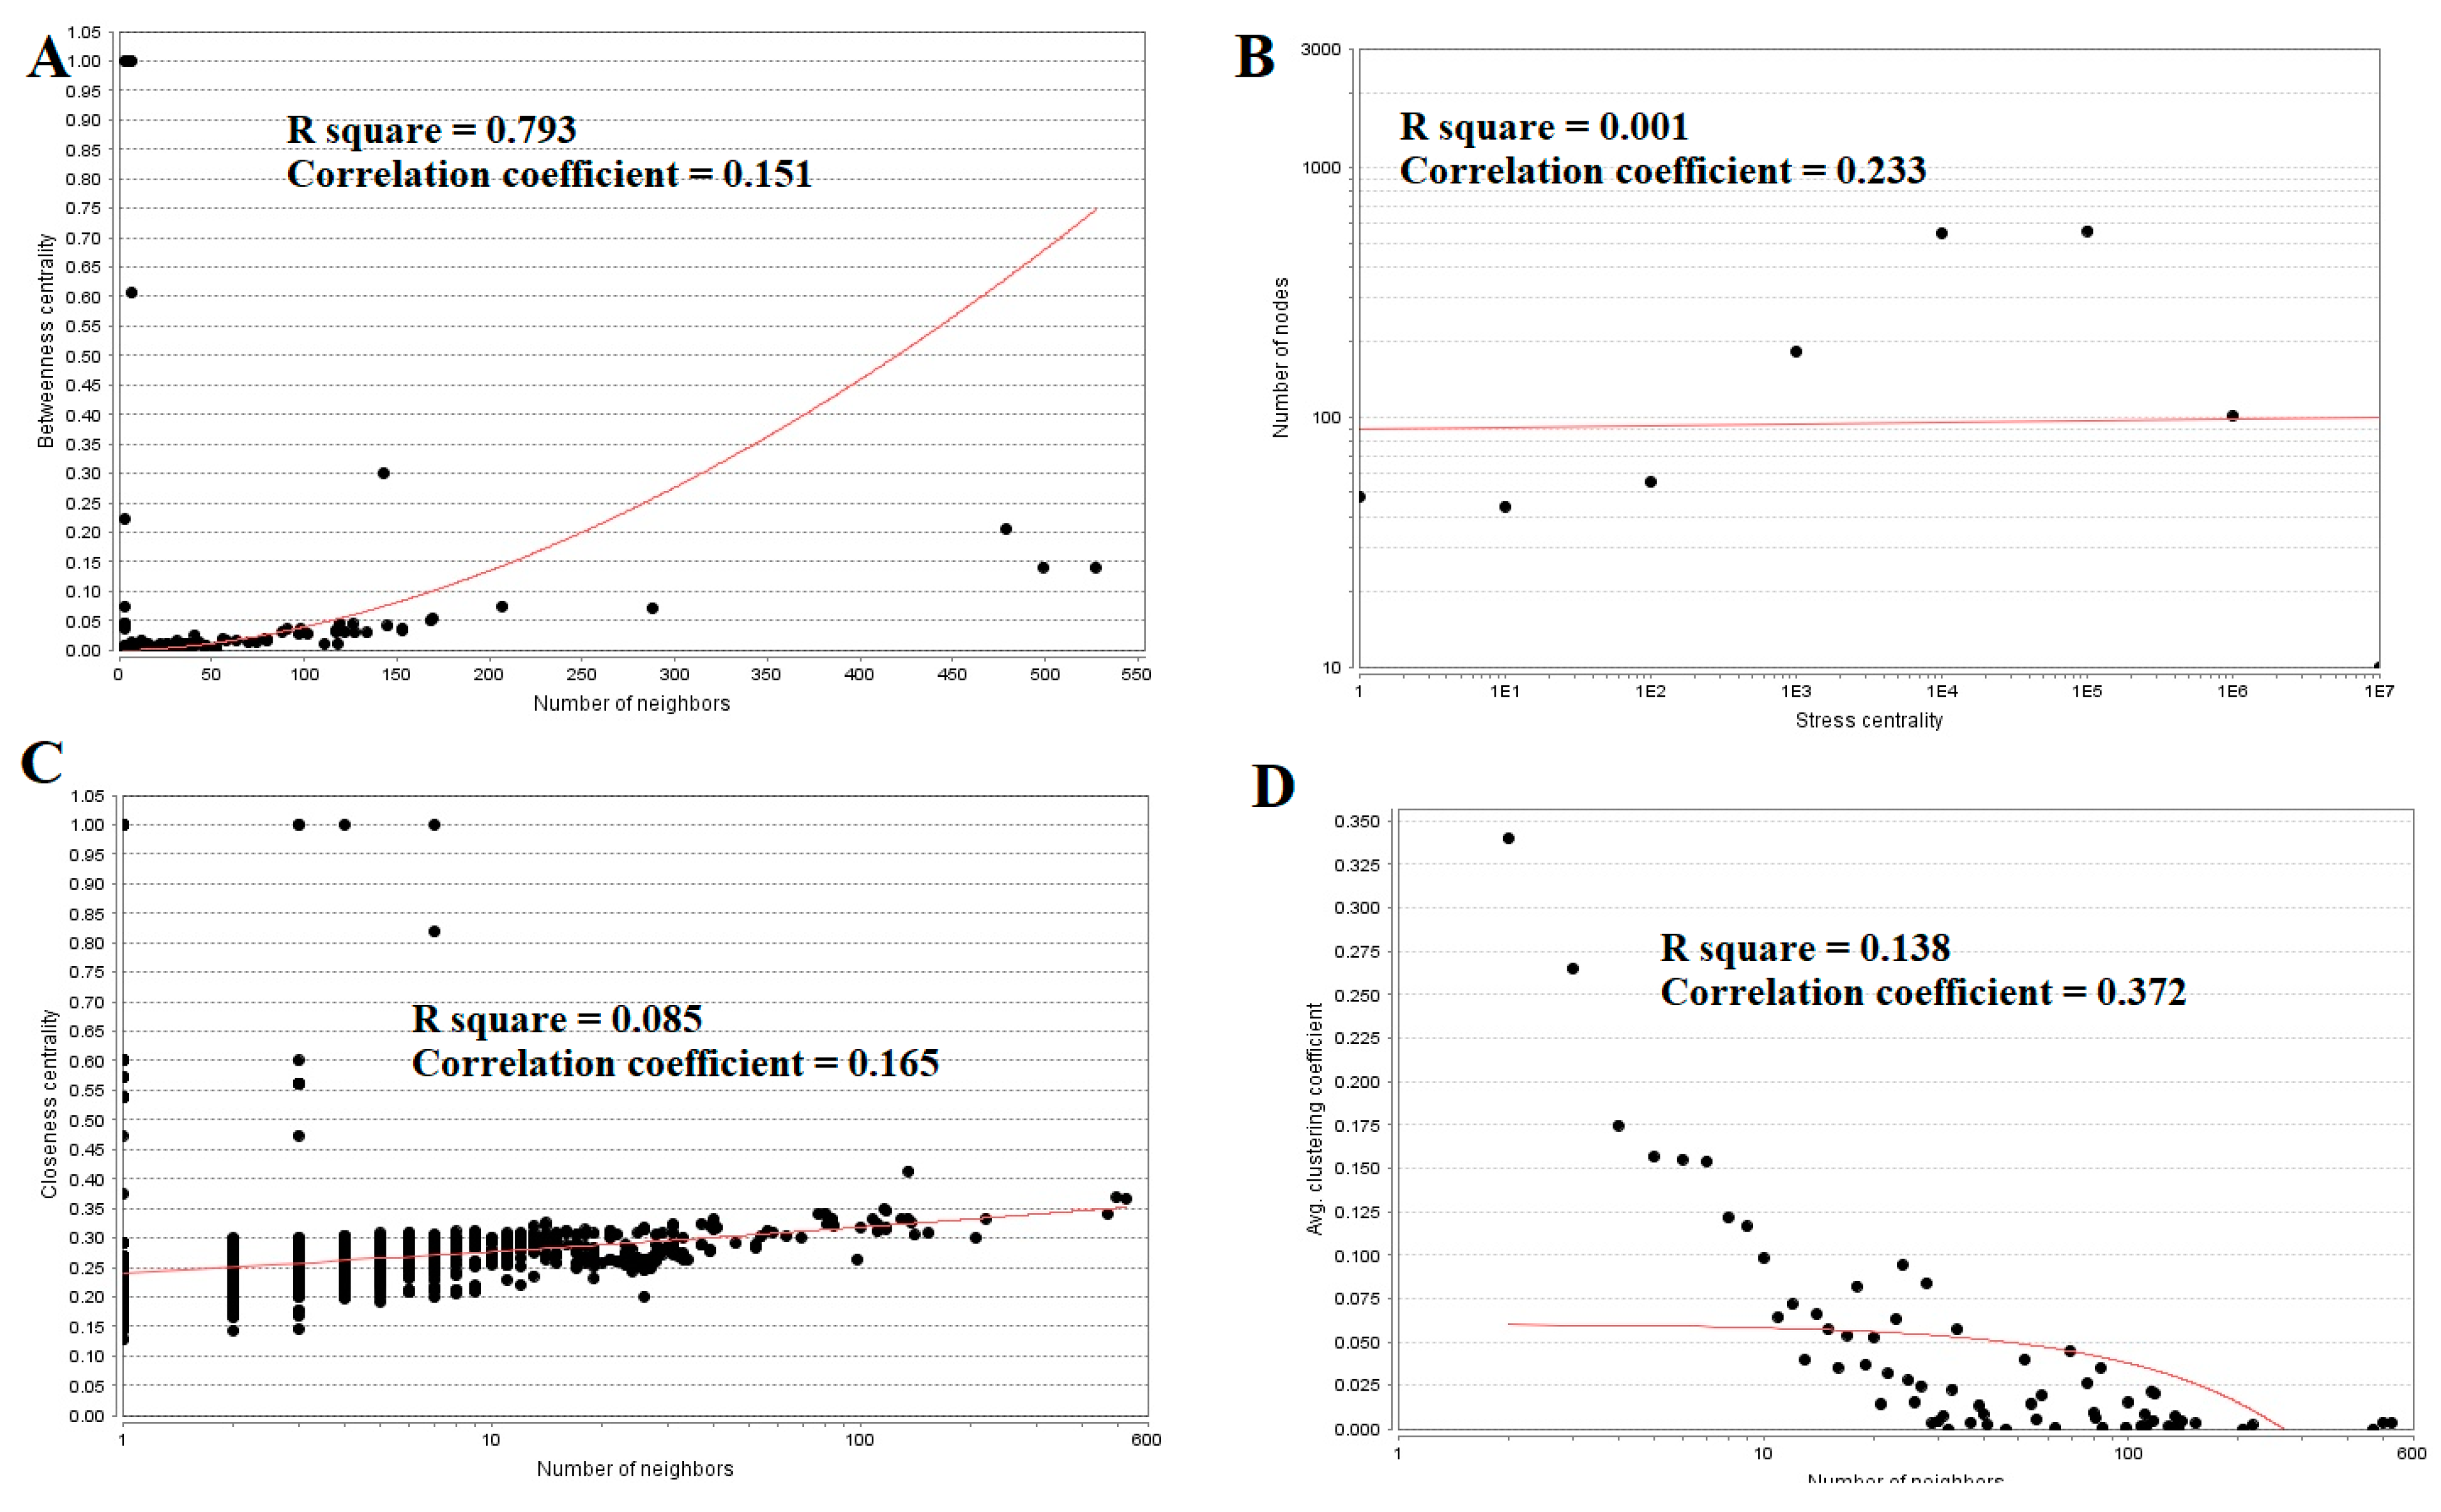
Topological properties (betweenness centrality, stress centrality, closeness centrality and clustering coefficient) were analyzed for the PPI network.Betweenness centrality calibrates the progress of information through a node in the PPI network and helps in locating crucial but not very highly-connected nodes [42]. Hub genes(up-regulated) with high betweennesssuch as E2F4 (betweenness = 0.205549), CEBPD (betweenness = 0.046304), CCT5 (betweenness = 0.046304), ATP6V1B1 (betweenness = 0.032117) and MCM4 (betweenness = 0.027287) are listed in supplementary Table S6. R square = 0.270 and correlation coefficient = 0.151 for betweenness centrality (Figure 8A). The stress centrality of a node n is the number of shortest paths fleeting through n. A node has greater stress if it is crossed by a greater number of shortest paths [43]. Hub genes (up-regulated) with high stress such as SRPK2 (stress = 22460310), E2F4 (stress = 20592222), CDH1 (stress = 20592222), CCT5 (stress = 10033170) and HIST2H2BE (stress = 8392118) are listed in supplementary Table S6. R square = 0.001 and correlation coefficient = 0.233 for stress centrality (Figure 8B).Closeness centrality is a quota of centrality in a PPI network, which illustrates the moderate speed with which around walking processes influence a node from other nodes of the PPI network [44]. Hub genes (up-regulated) with high closeness centrality such asIL20RB (closeness = 0.818182), HNRNPA3 (closeness = 0.341767), HIST1H1C (closeness = 0.336839), MCM4 (closeness = 0.332809) and SRPK2 (closeness = 0.332547) are listed in supplementary Table S6. R square = 0.085 and correlation coefficient = 0.165 for closeness centrality (Figure 8C). A crucial peculiarity of scale-free PPI networks is the clustering coefficient, which indicates the reduction of node degree expansion [45]. Hub genes (up-regulated) with low clustering coefficients such as NPTX1 (clustering coefficient = 0), KLHL35 (clustering coefficient = 0), NEFH (neurofilament heavy) (clustering coefficient = 0), SLPI (clustering coefficient = 0) and TYMP (thymidine phosphorylase) (clustering coefficient = 0) are listed in supplementary Table S6. R square = 0.138 and correlation coefficient = 0.372 for clustering coefficient (Figure 8D).
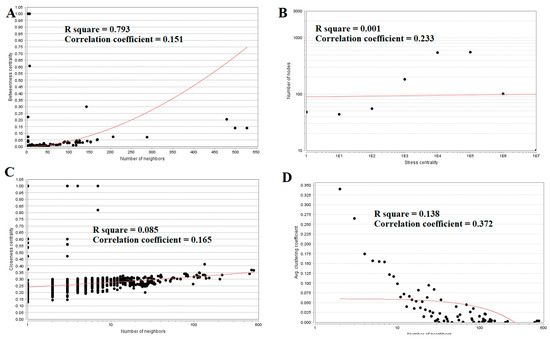
Figure 8.
Regression diagrams for up-regulated genes ((A) Betweenness centrality; (B) Stress centrality; (C) Closeness centrality; (D) Clustering coefficient). The red straight lines and the red curve lines: regression lines.
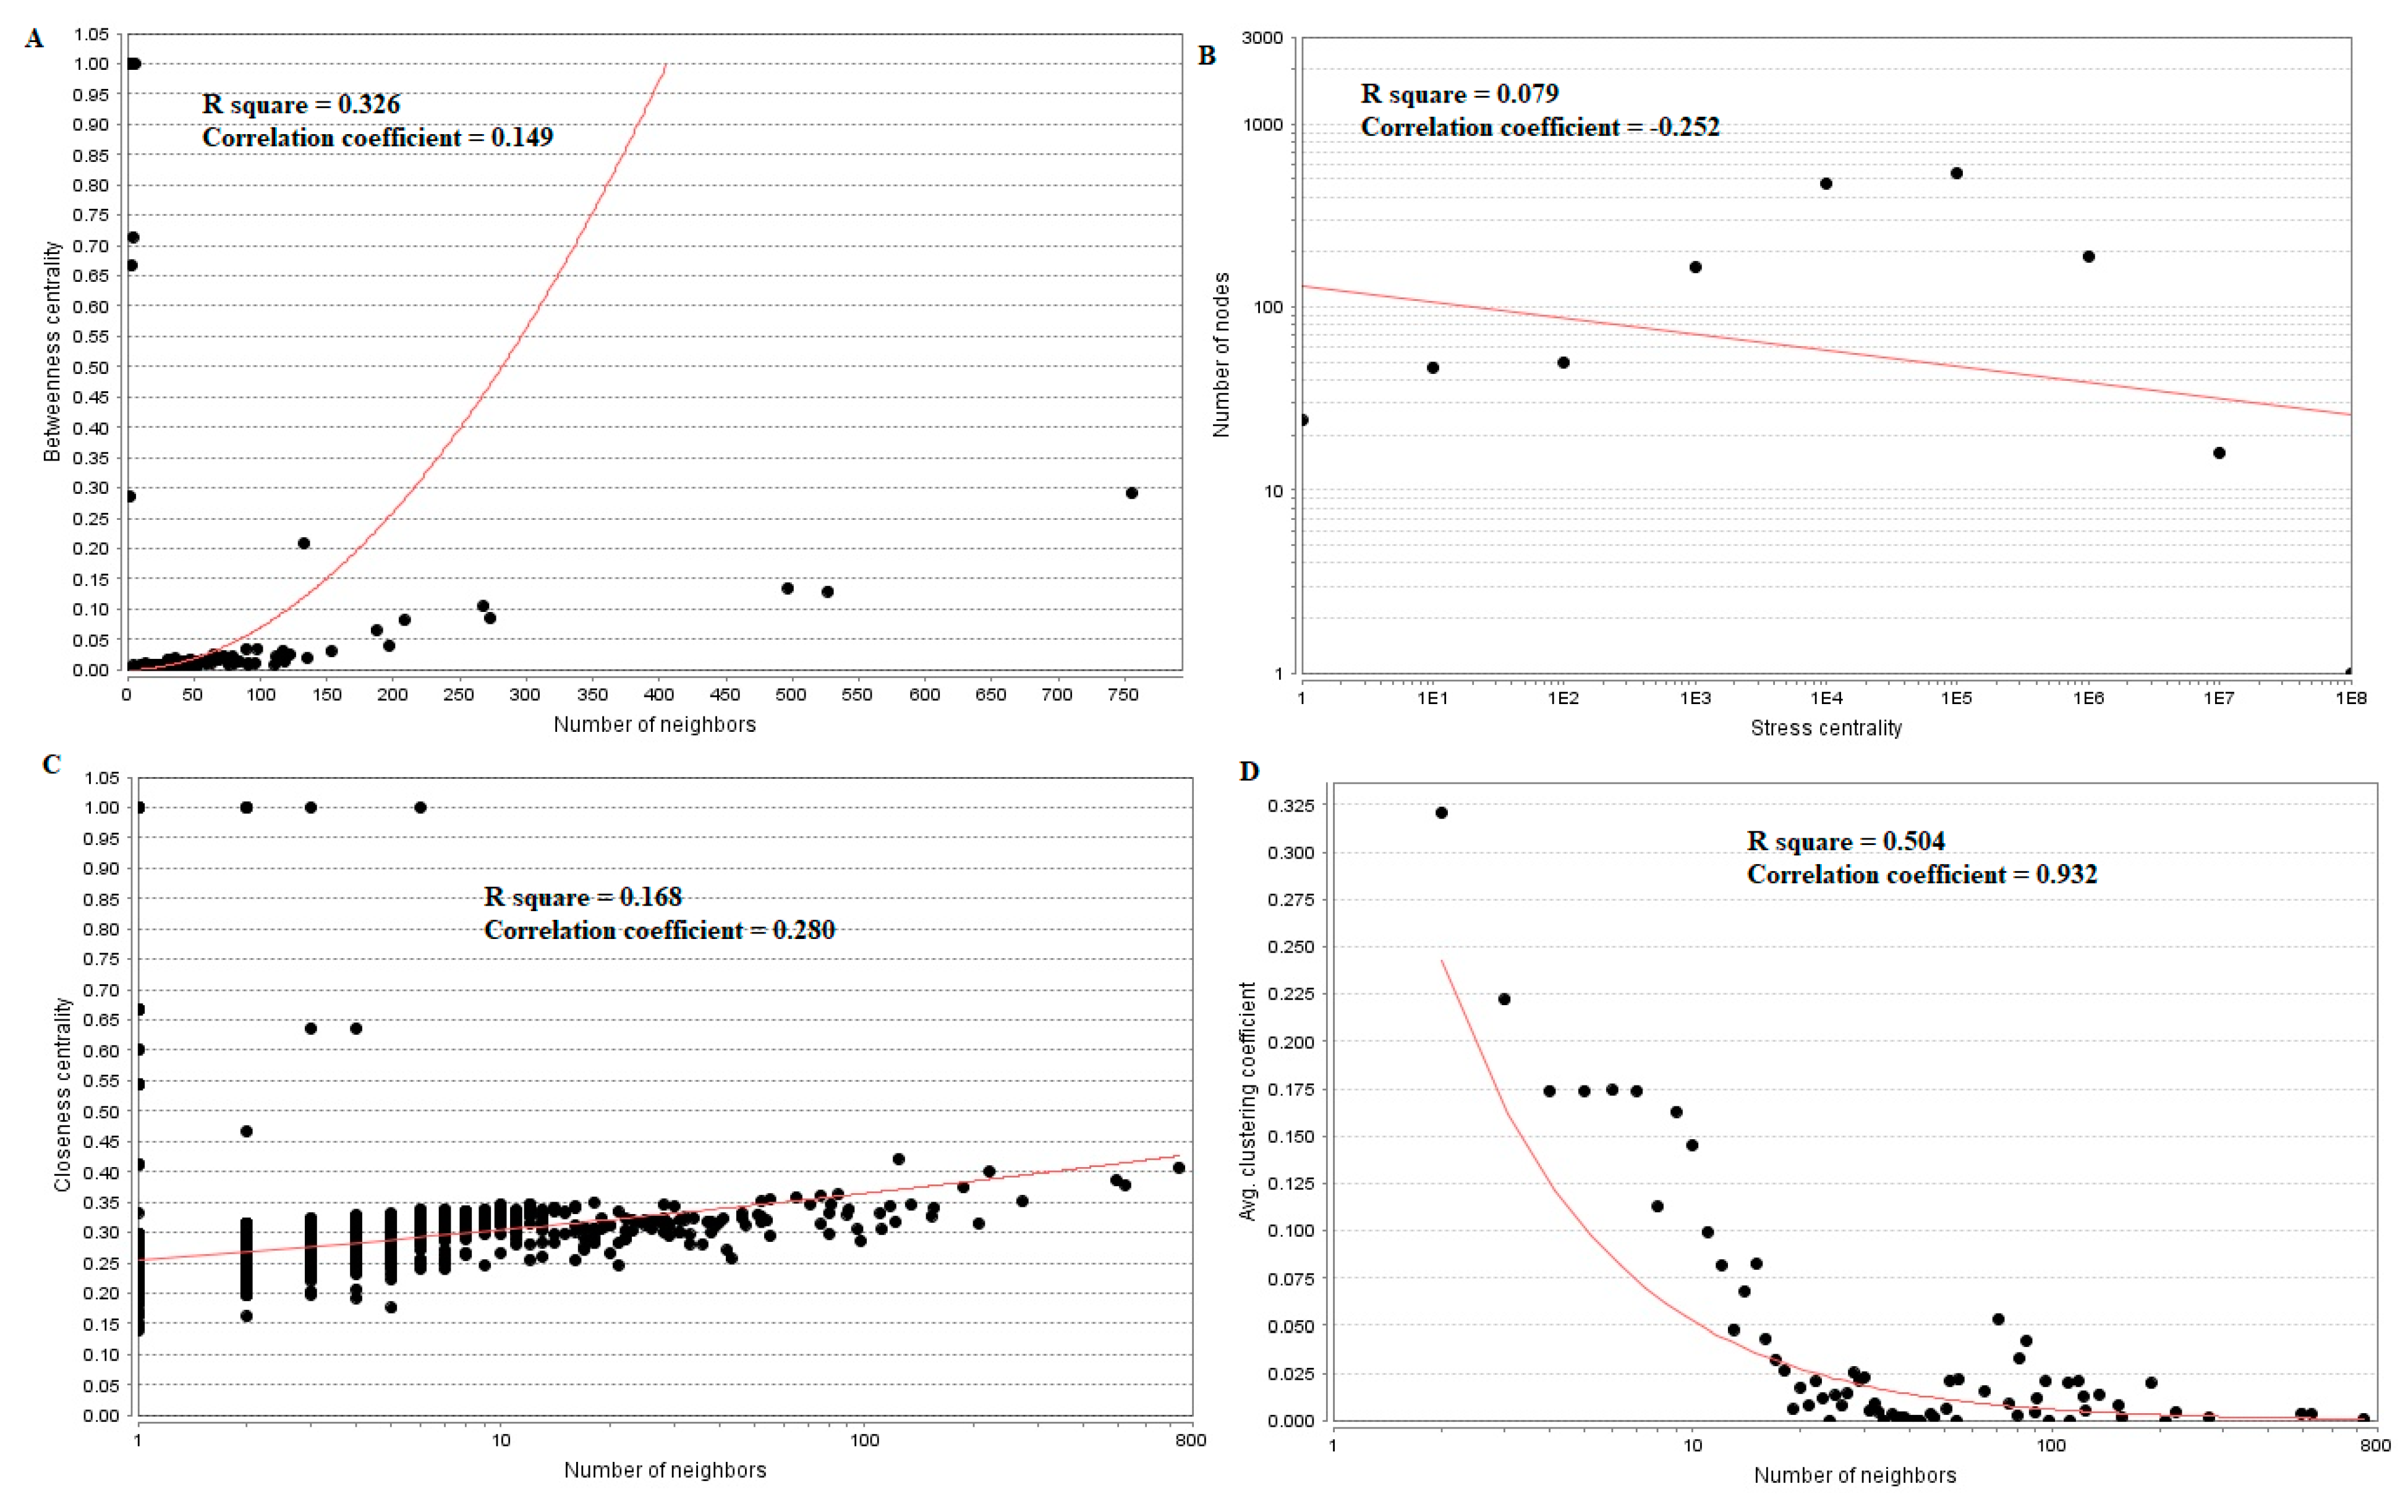
Hub genes (down-regulated) with high betweenness centralitysuch as UCHL1 (betweeness = 0.015169), HLA-C (major histocompatibility complex, class I, C) (betweeness = 0.015169), VAT1 (betweeness = 0.007237), ECM1 (betweeness = 0.007237) and SNRPN (small nuclear ribonucleoprotein polypeptide N) (betweeness = 0.006875) are listed in supplementary Table S6. R square = 0.326 and correlation coefficient = 0.149 for betweenness centrality (Figure 9A). Hub genes (down-regulated) with high stress such as FN1 (stress = 213338628), TCF3 (stress = 18049254), RPS6 (stress = 11434072), EFEMP2 (stress = 10312416) and MECOM (MDS1 and EVI1 complex locus) (stress = 8070650) are listed in supplementary Table S6. R square = 0.079 and correlation coefficient = −0.252 for stress centrality (Figure 9B). Hub genes (down-regulated) with high closeness centrality, such as FN1 (closeness = 0.407621), VIM (closeness = 0.400111), RPS6 (closeness = 0.373924), RPL26 (closeness = 0.354613) and LGALS1 (closeness = 0.351433),are listed in supplementary Table S6. R square = 0.168 and correlation coefficient = 0.280 for closeness centrality (Figure 9C). Hub genes (down-regulated) with low clustering coefficientsuch as FAM69B (clustering coefficient = 0), COL6A3 (clustering coefficient = 0), SNURF (SNRPN upstream reading frame) (clustering coefficient = 0), SCARA3 (clustering coefficient = 0) and TMEM107 (clustering coefficient = 0) are listed in supplementary Table S6. R square = 0.504 and correlation coefficient = 0.932 for clustering coefficient (Figure 9D).
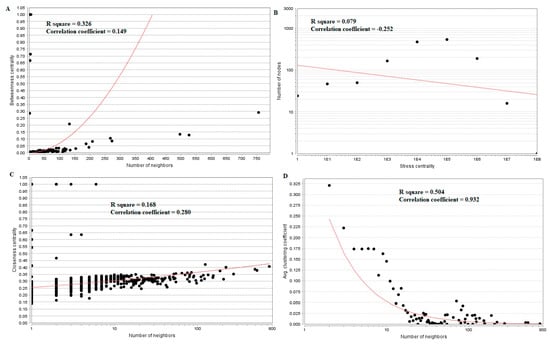
Figure 9.
Regression diagrams for Down-regulated genes ((A) Betweenness centrality; (B) Stress centrality; (C) Closeness centrality; (D) Clustering coefficient). The red straight lines and the red curve lines: regression lines.
3.6. Module Analysis
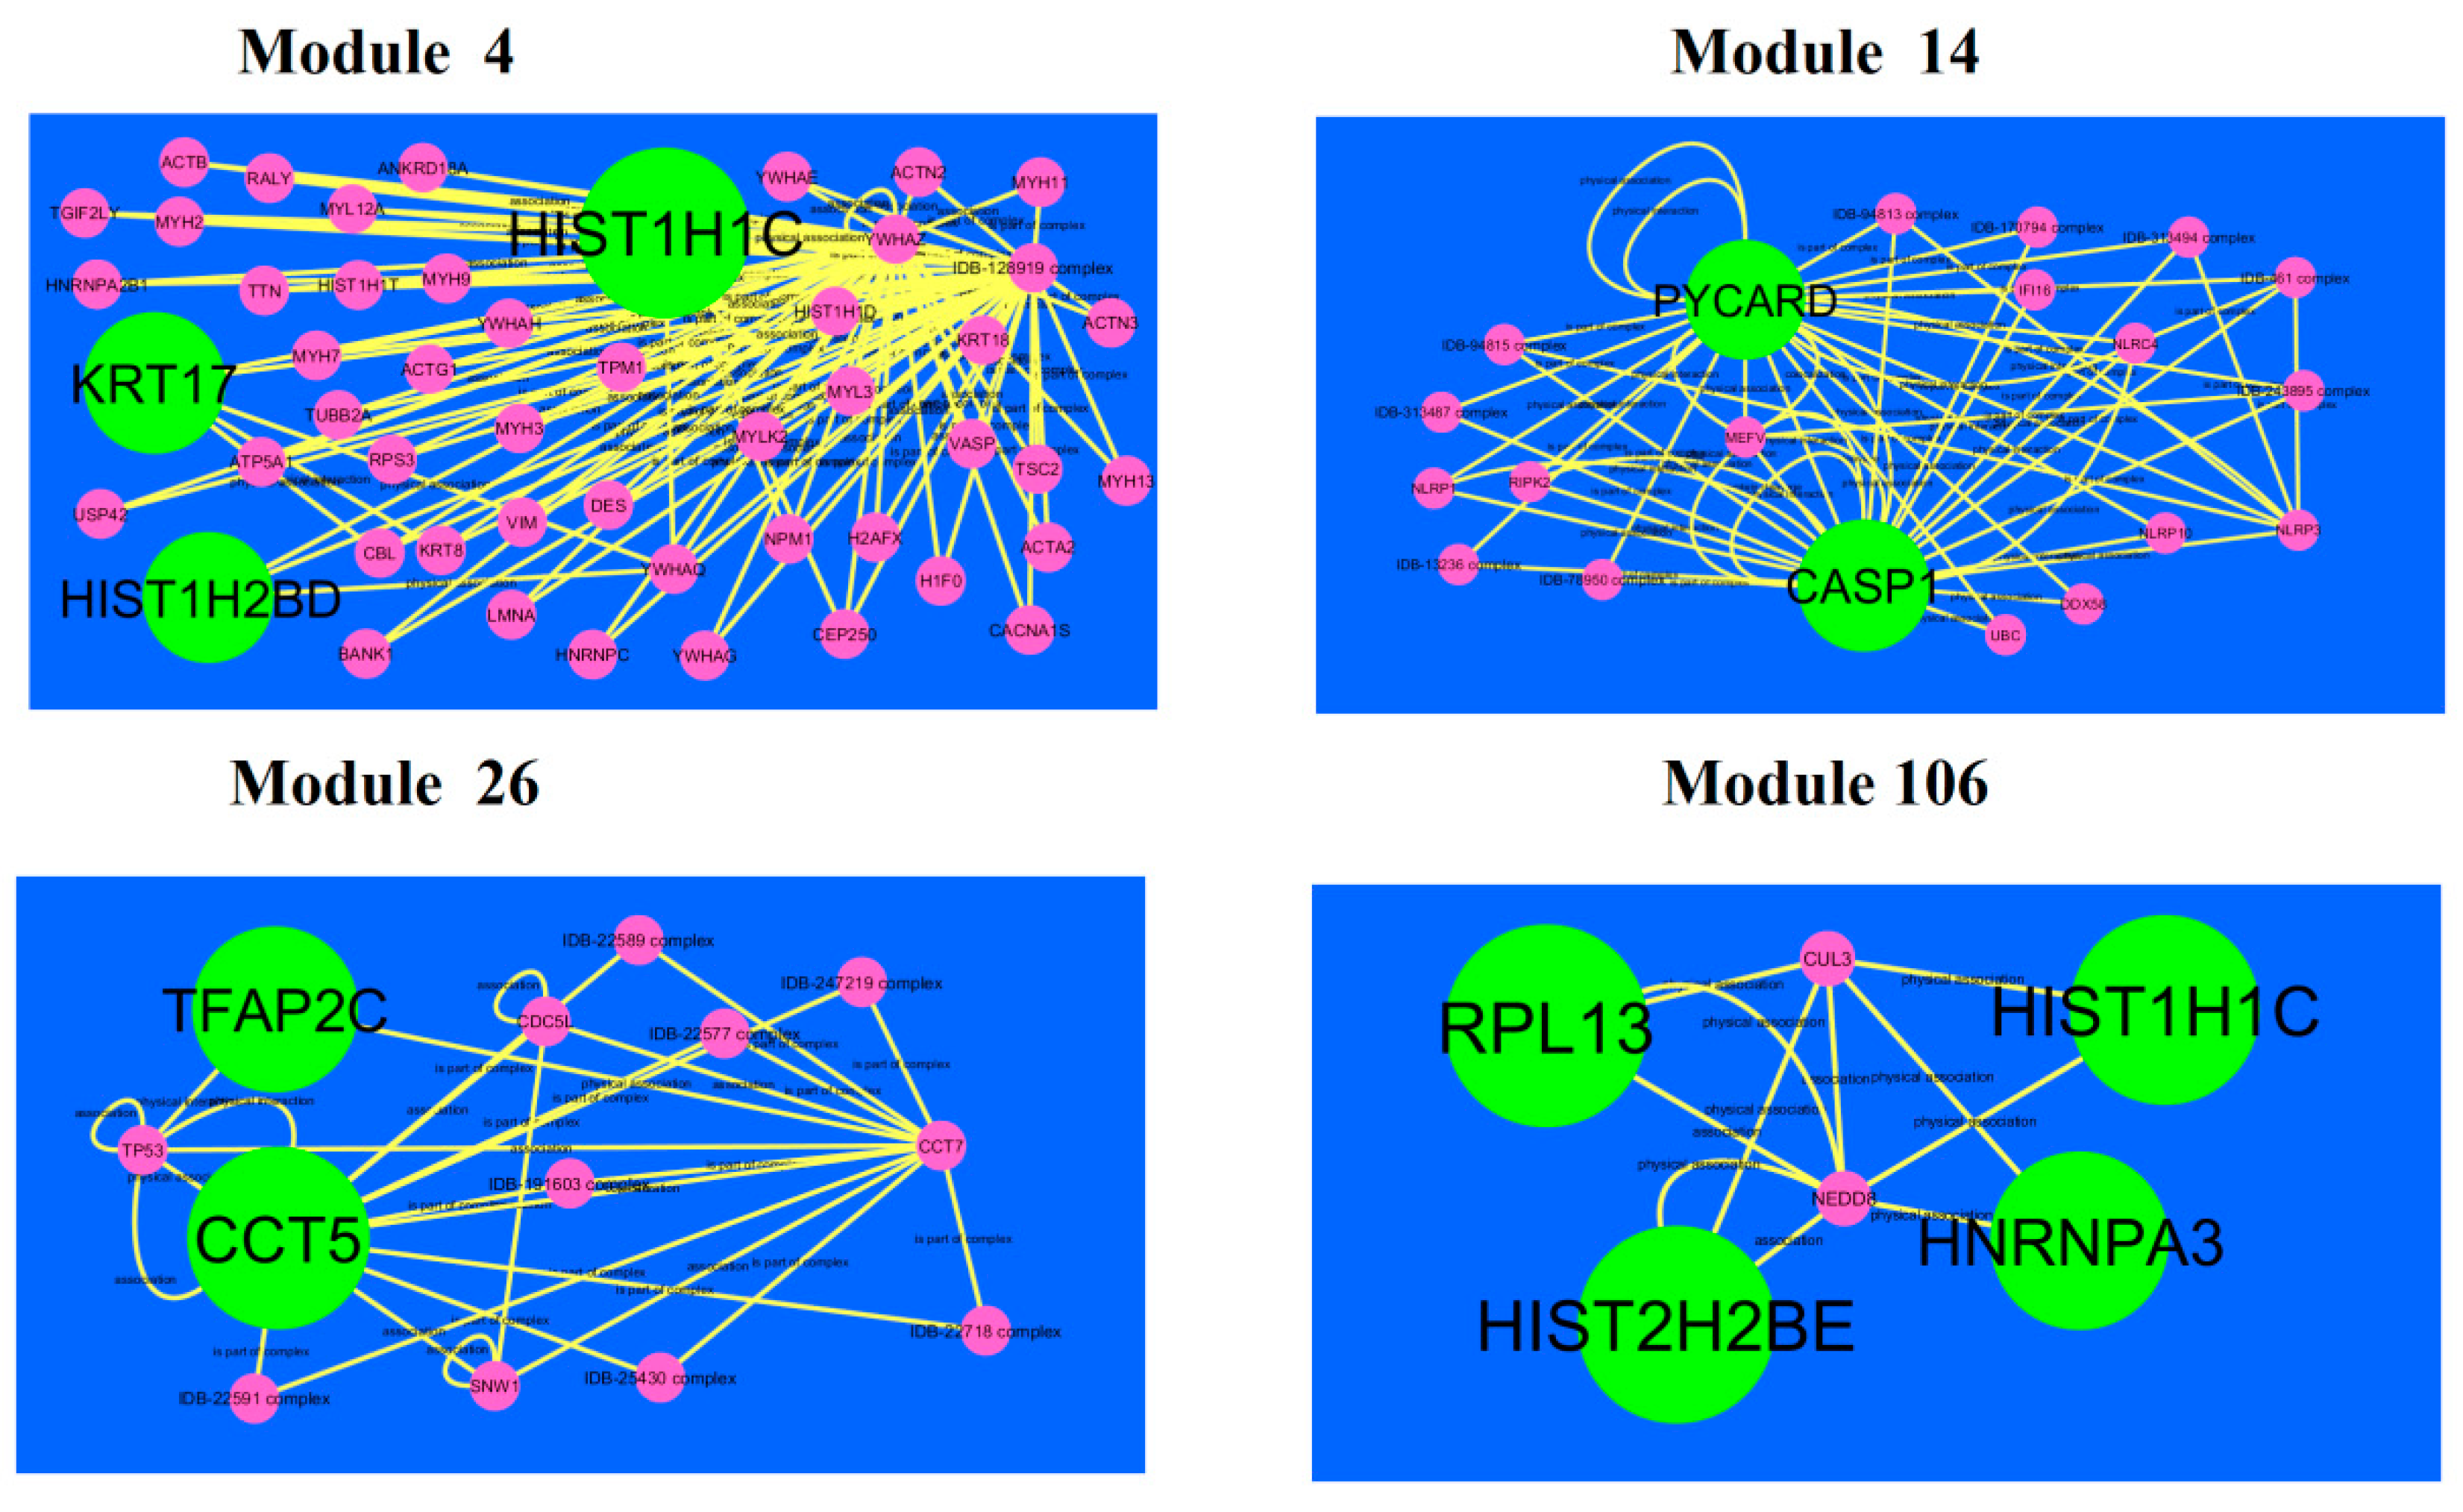
A total of 921 modules were extracted from PPI network (up-regulated).Modules 4, 14, 26 and 106 were more significant (Figure 10). Module 4 had 50 nodes and 106 edges. Hub genes such as HIST1H2BD (degree = 18), HIST1H1C (degree = 102) and KRT17 (degree = 41) were involved in module 4.Module 14wascomposed of 20 nodes and 56 edges. Hub genes such as PYCARD (PYD and CARD domain containing) (degree = 47) and CASP1 (degree = 79) were involved in module 14.Module 26 had13 nodes and 29 edges. Hub genes such as TFAP2C (degree = 91) and CCT5 (degree = 126) were involved in module 29.Module 106had 6 nodes and 11 edges. Hub genes such as RPL13 (degree = 127), HIST1H1C (degree = 102), HNRNPA3 (degree = 80) and HIST2H2BE (degree = 117) were involved in module 29.
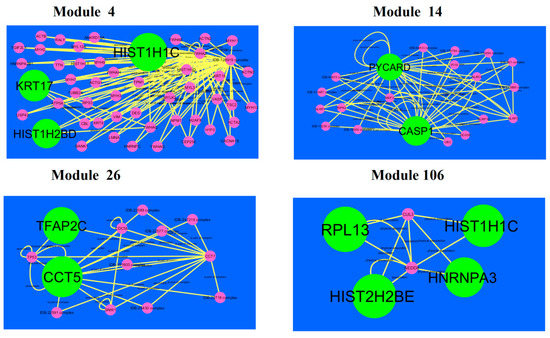
Figure 10.
Modules in PPI network. Thedark green round shape nodes denote the up-regulated genes. Pink dots are also genes which are not hub or differential expressed genes. Yellow curve lines is interaction with adjutant genes.
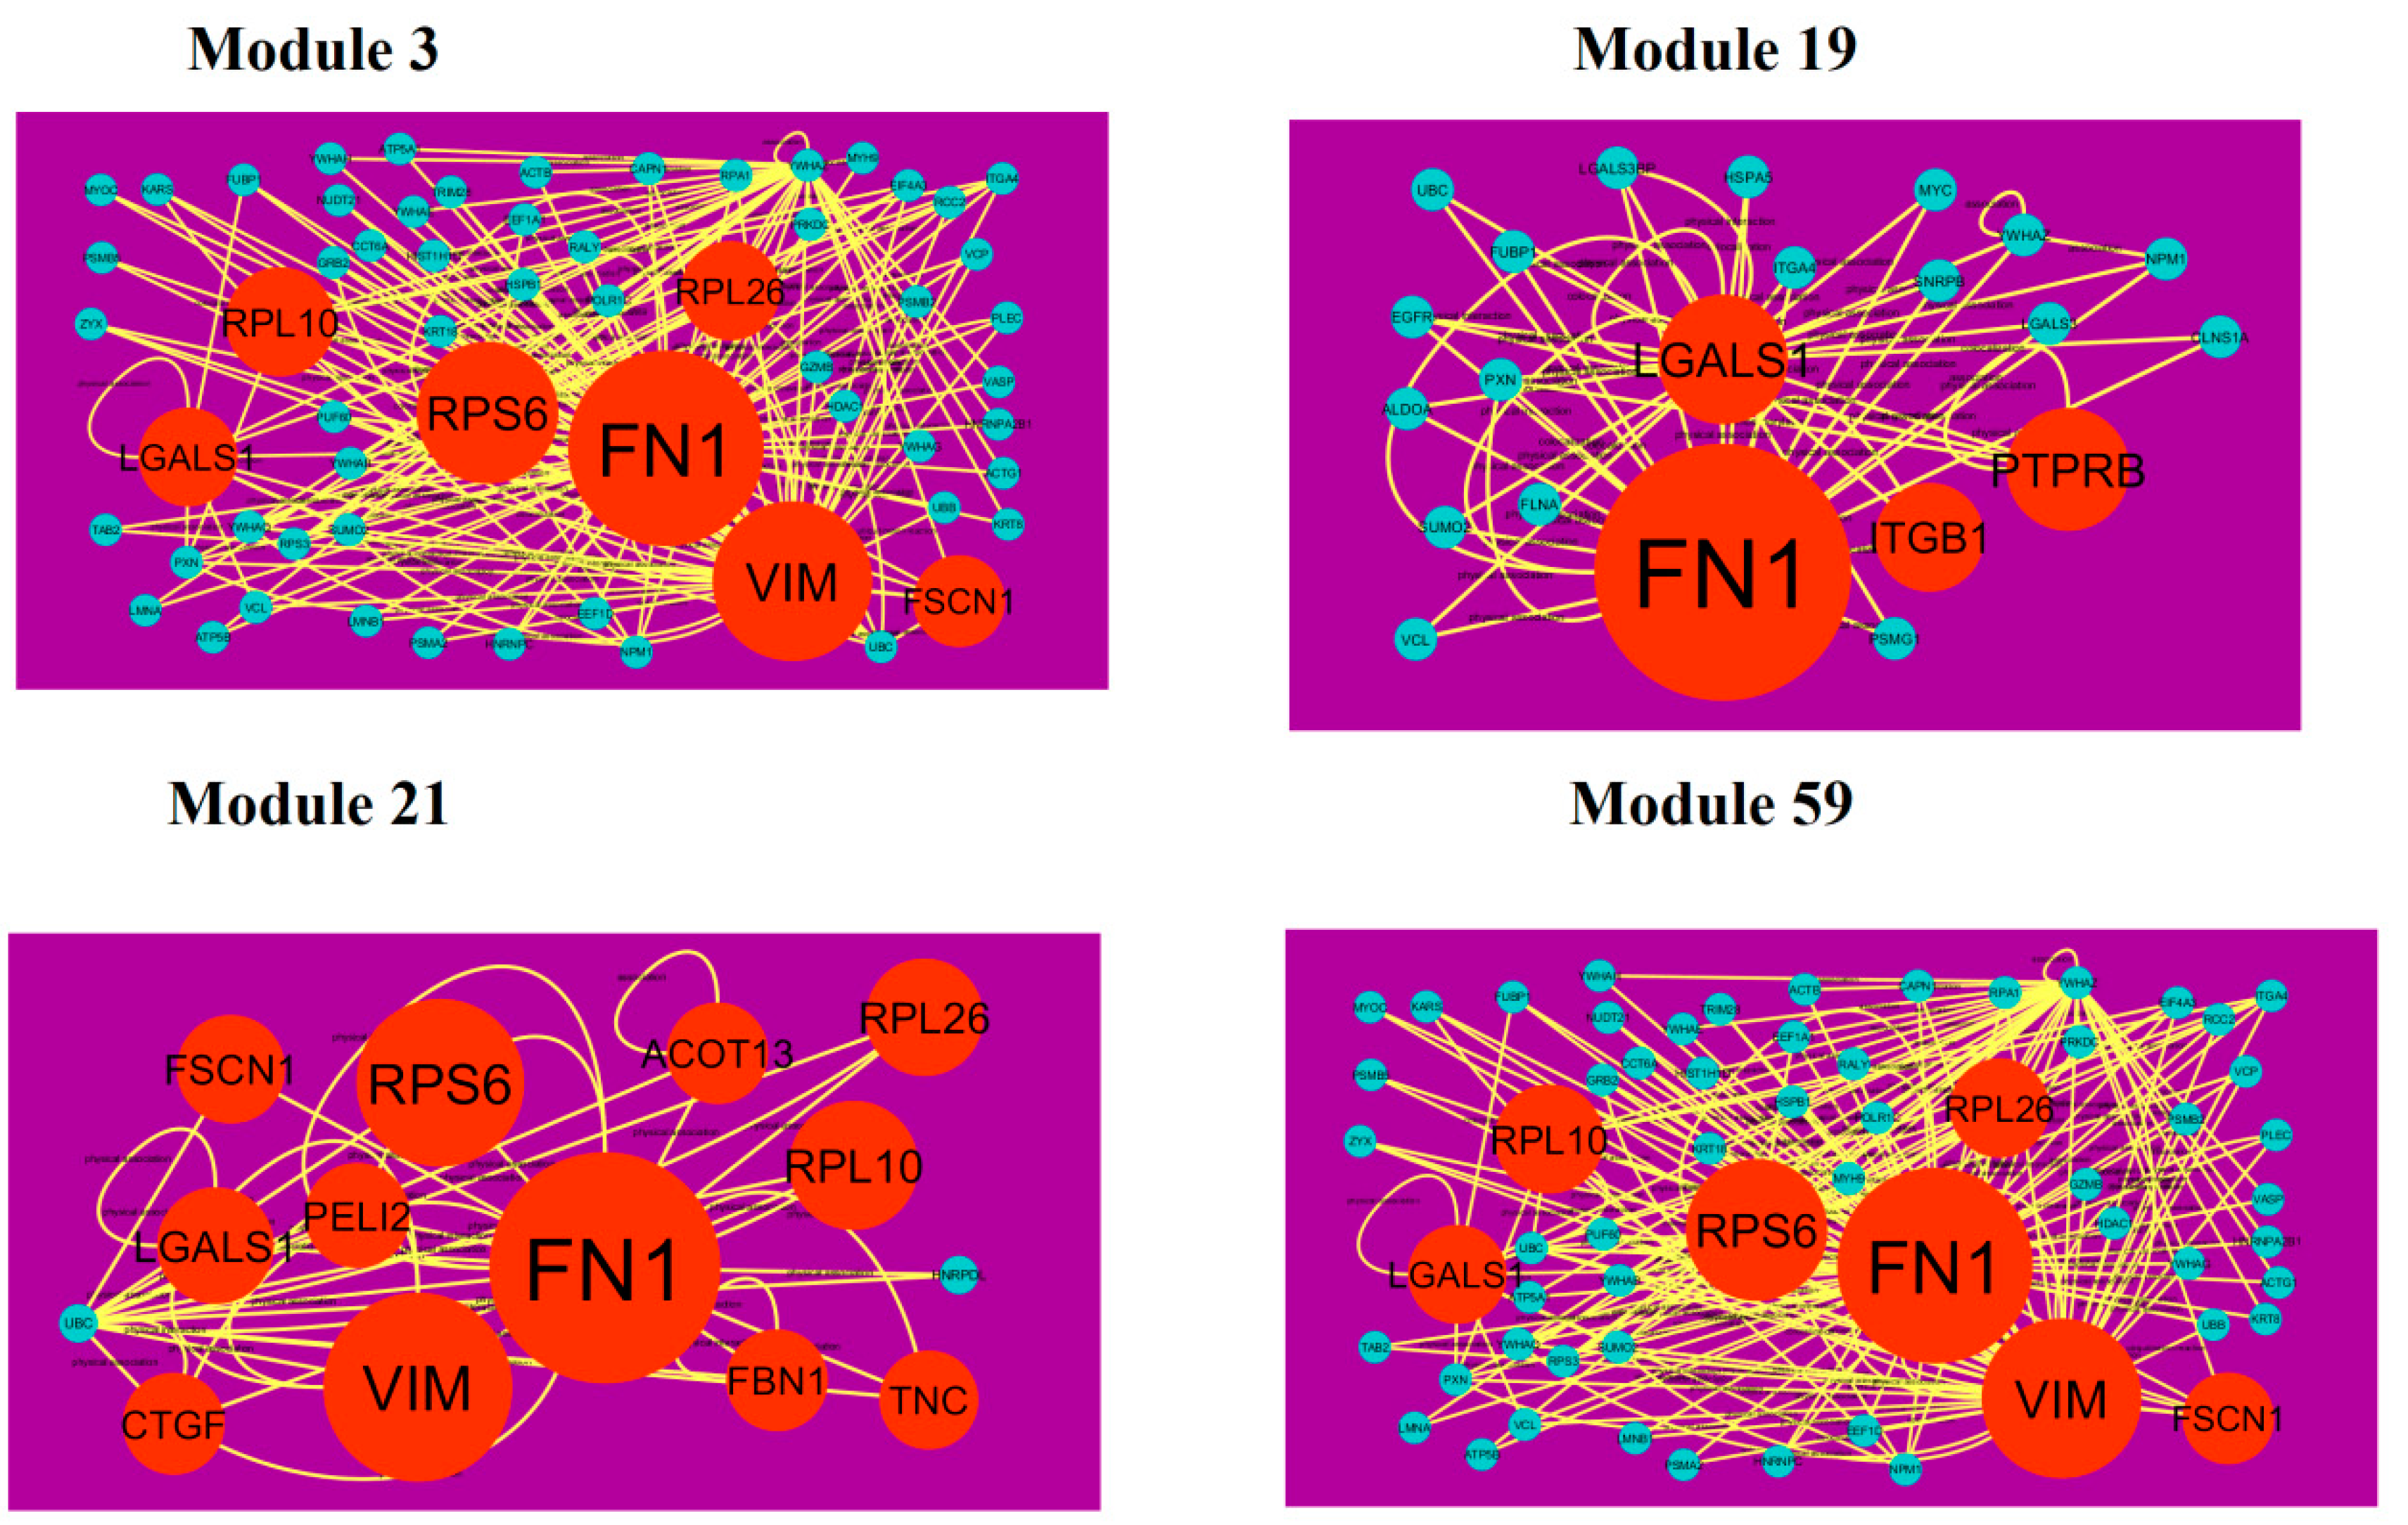
A total of 939 modules were extracted from the PPI network (down-regulated). Modules 3, 19, 21 and 59 were more significant (Figure 11). Module 3 had 61 nodes and 173 edges. Hub genes such as FN1 (degree = 755), FSCN1 (degree = 34), RPL10 (degree = 91), VIM (degree = 268), RPS6 (degree = 197), LGALS1 (degree = 57) and RPL26 (degree = 59) were involved in module 3. Module 19 had 22 nodes and 51 edges. Hub genes such as ITGB1 (degree = 5), PTPRB (protein tyrosine phosphatase, receptor type B) (degree = 40), FN1 (degree = 755) and LGALS1 (degree = 57) were involved in module 19. Module 21 had 14 nodes and 38 edges. Hub genes such as FSCN1 (degree = 755), RPL26 (degree = 72), FN1 (degree = 72), RPS6 (degree = 197), RPL10 (degree = 197), VIM (degree = 91), LGALS1 (degree = 57), CTGF (connective tissue growth factor) (degree = 16), PELI2 (degree = 25), ACOT13 (degree = 15), FBN1 (degree = 1) and TNC (tenascin C) (degree = 8) were involved in module 21. Module 59 had 7 nodes and 15 edges. Hub genes such as EEF1A2 (degree = 54), ACTBL2 (degree = 54), RPS6 (degree = 197) and DSP (desmoplakin) (degree = 72) were involved in module 59.
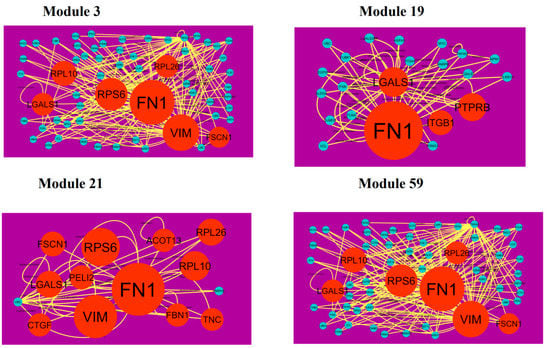
Figure 11.
Modules in PPI network. The orange round nodes denote down-regulated genes. Green dots are also genes which are not hub or differential expressed genes. Yellow curve lines is interaction with adjutant genes.
3.7. Construction of the miRNA-Target Gene Regulatory Network
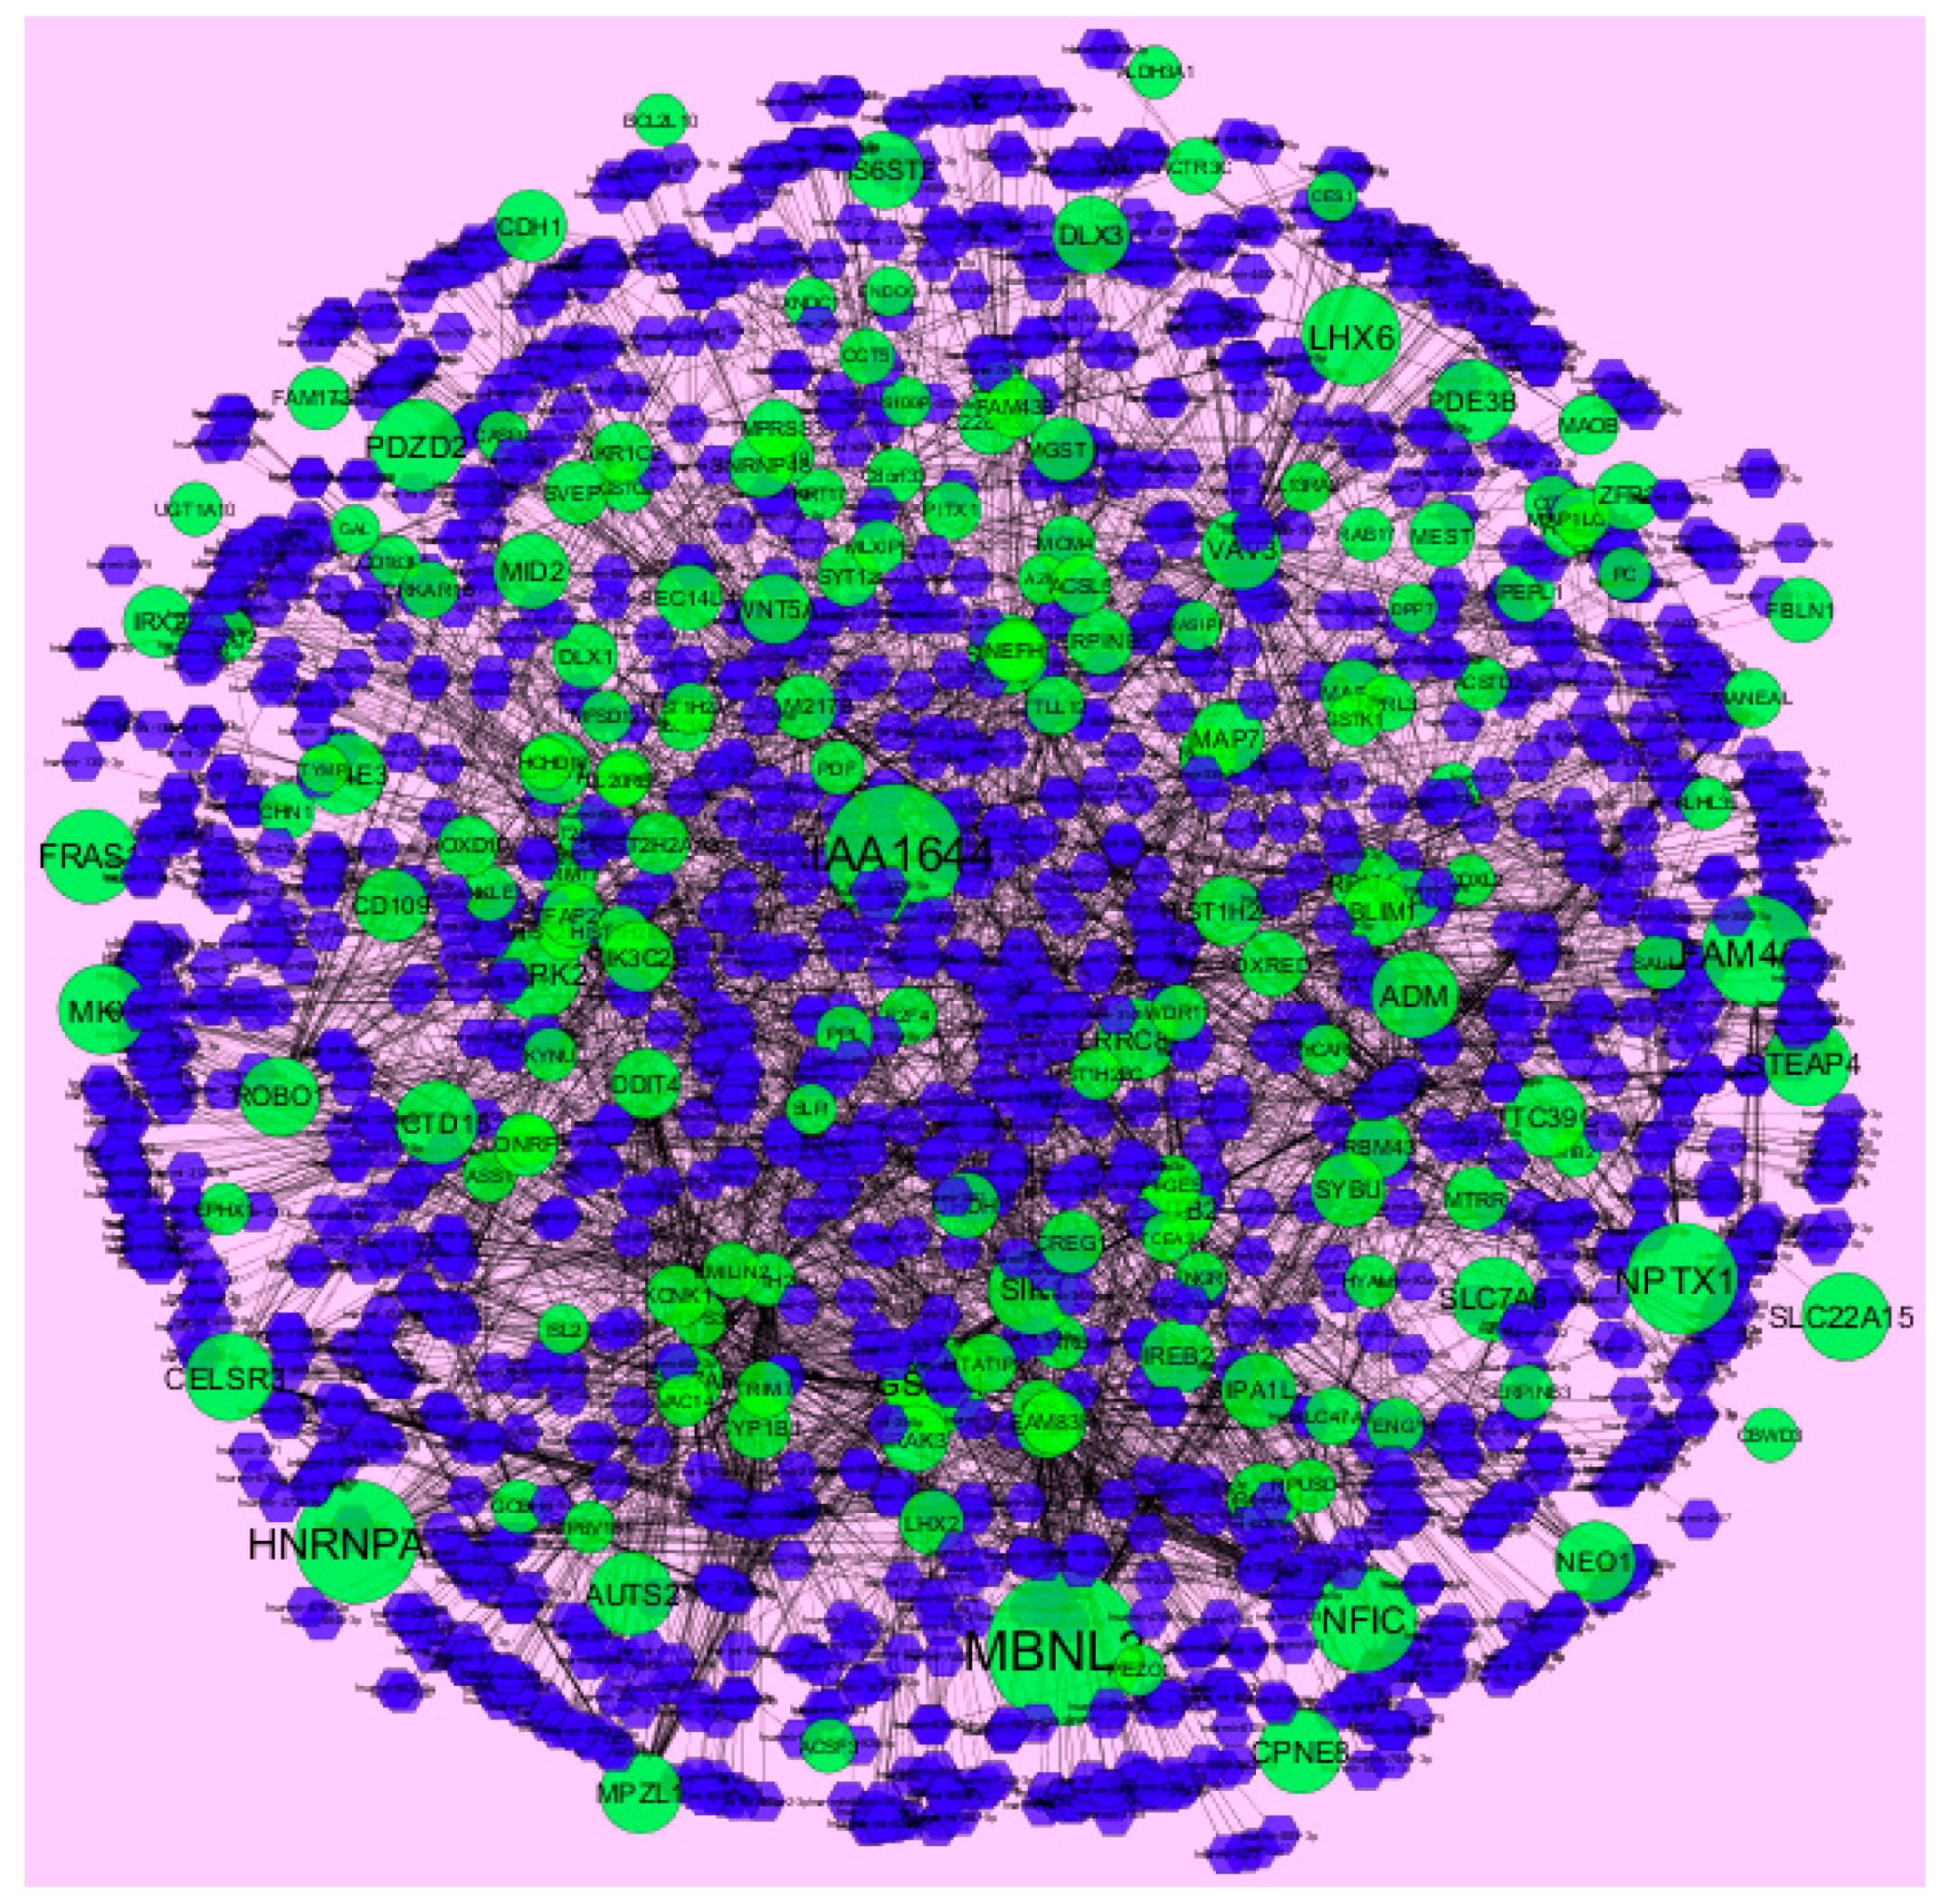
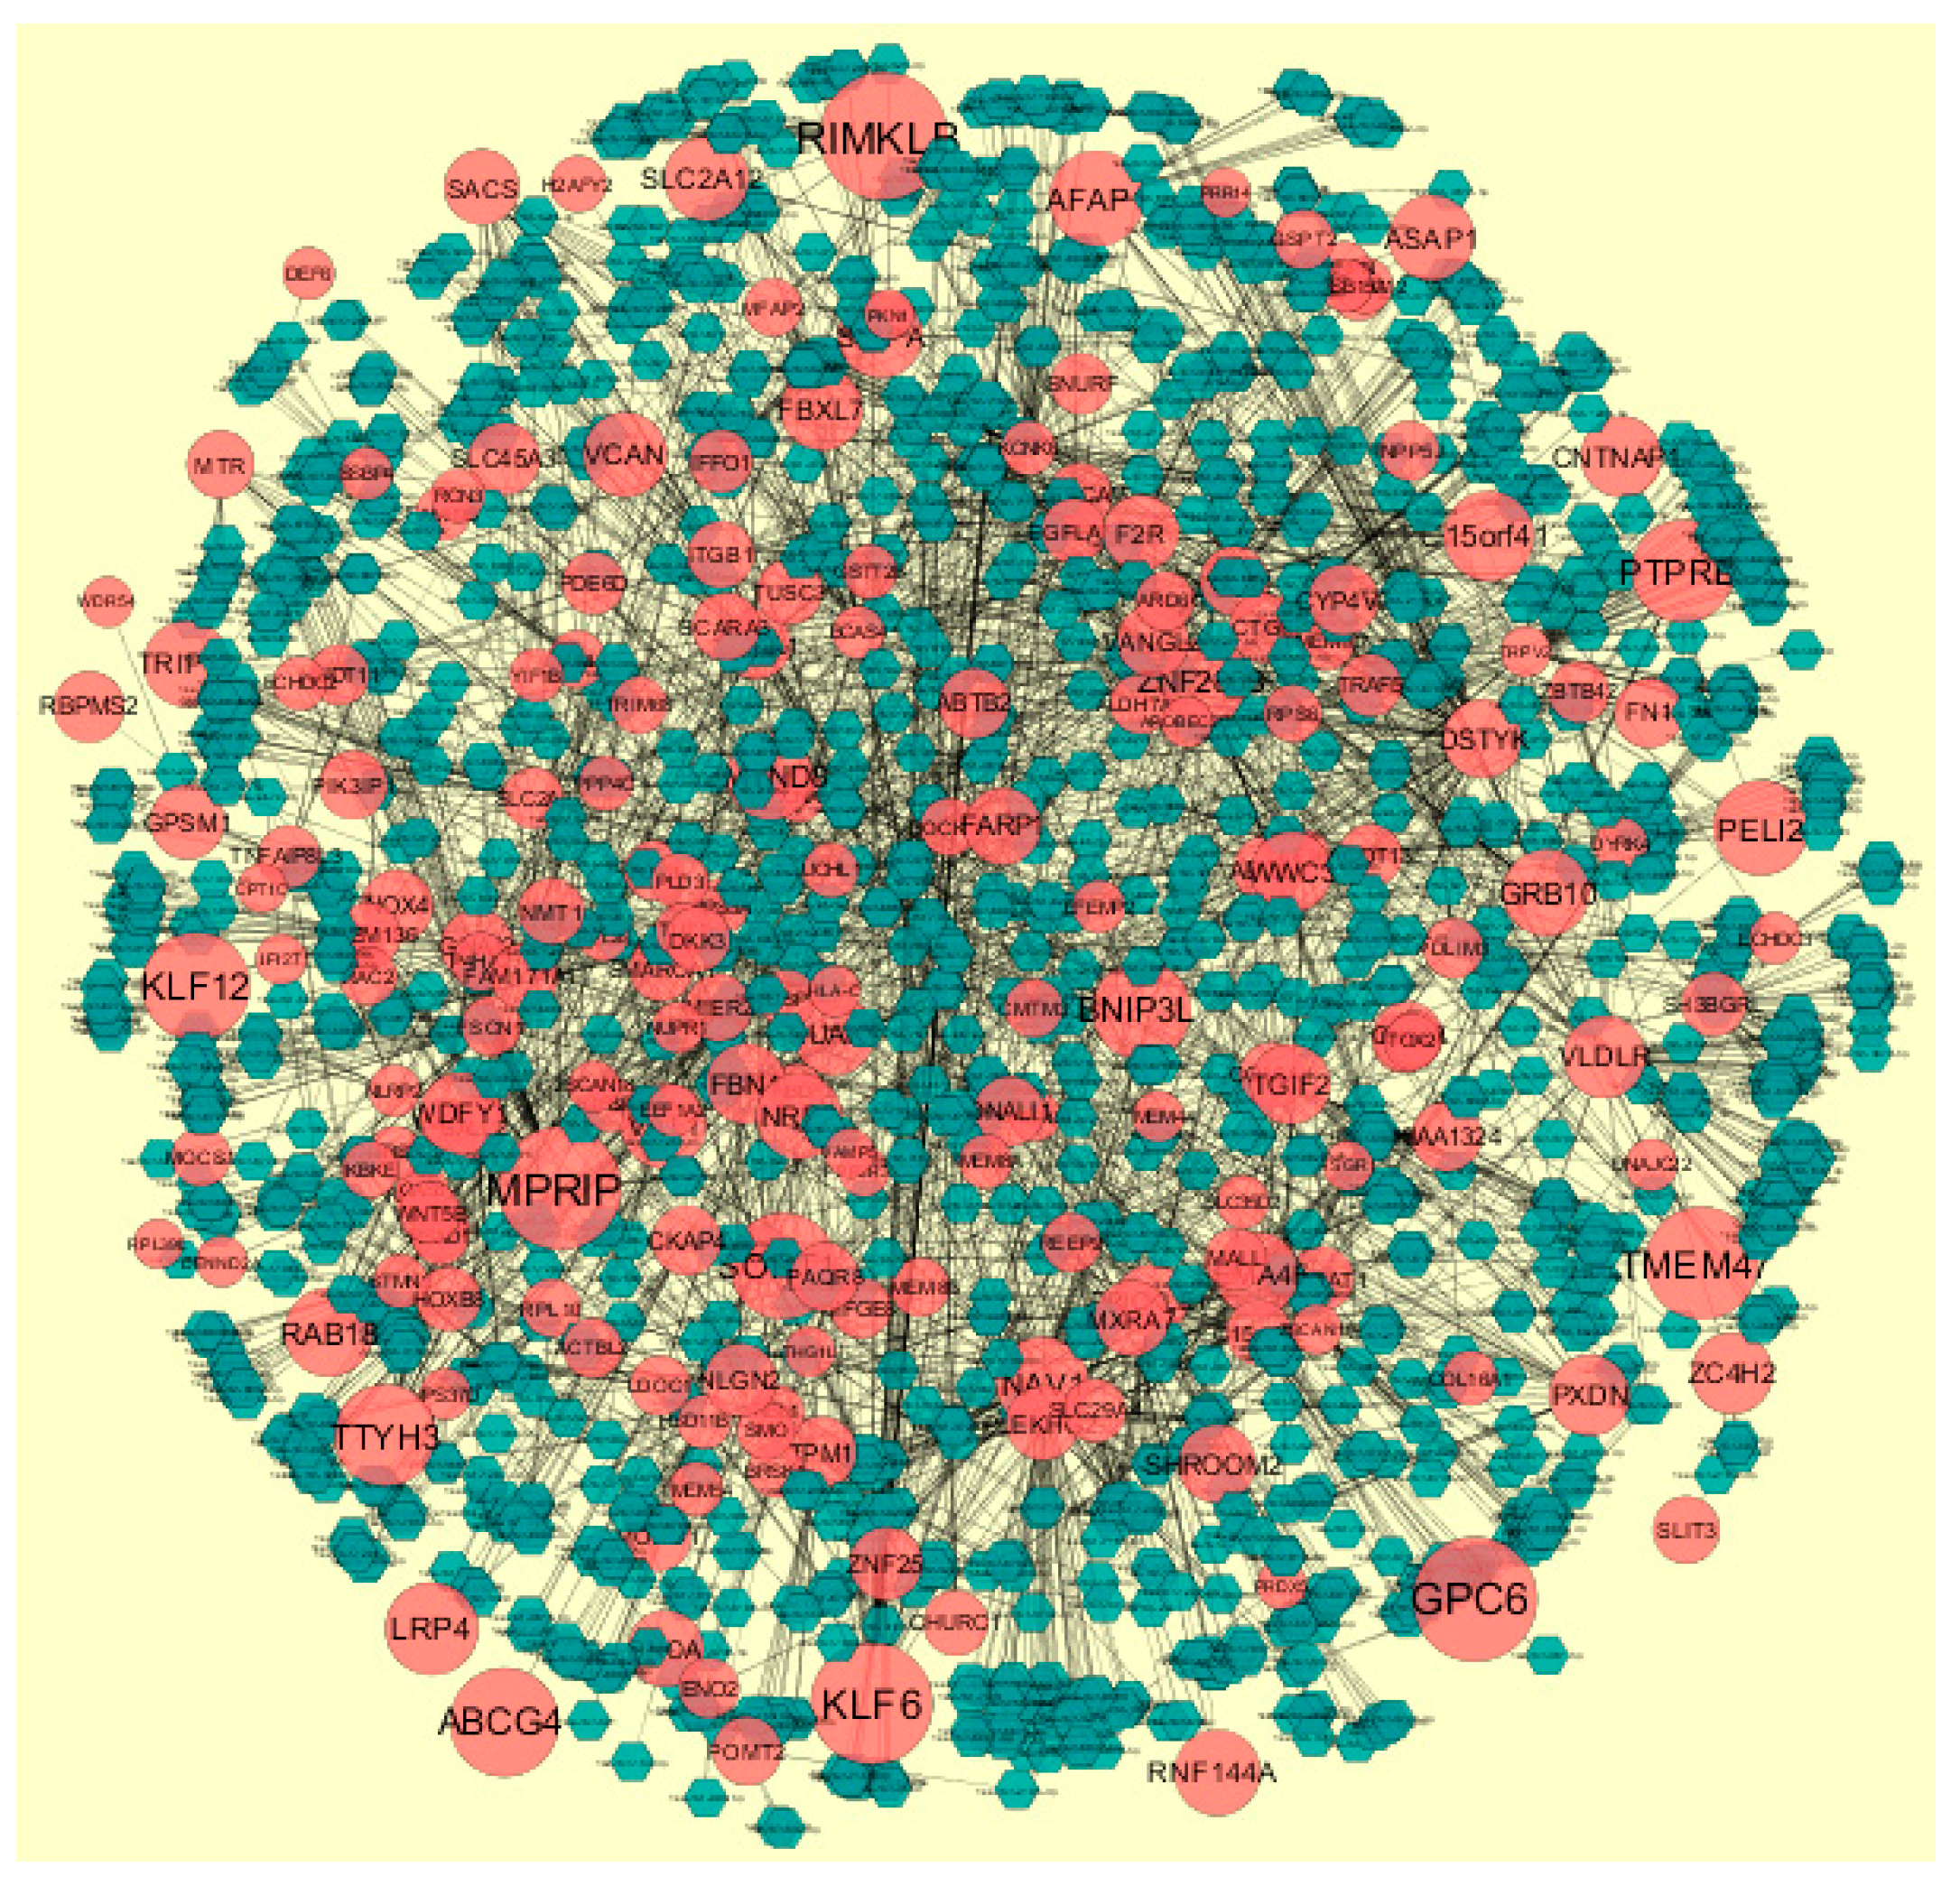
MicroRNAs (miRNAs) are endogenous, small non-coding RNAs whose actions control biomarker expression. The use of miRNAs as potential molecular markers for human cancer diagnosis, prognosis and therapeutic targets or tools, urgently study further examination and acceptance [46]. The miRNA for target up- and down-regulated genes is shown in Figure 12 and Figure 13. Of the up regulated hub genes, e.g., MBNL3 interacts with 308 miRNAs, KIAA1644 interacts with 265 miRNAs, HNRNPA3 interacts with 227 miRNAs and NPTX1 interacts with 200 miRNAs, as listed in supplementary Table S7. Of the down regulated hub genes, e.g., DSP (ribosomal modification protein rimK like family member B) interacts with 242 miRNAs, GPC6 interacts with 233 miRNAs, MPRIP (myosin phosphatase Rho interacting protein) interacts with 230 miRNAs, KLF6 interacts with 227 miRNAs and TMEM47 interacts with 203 miRNAs, as listed in supplementary Table S7.
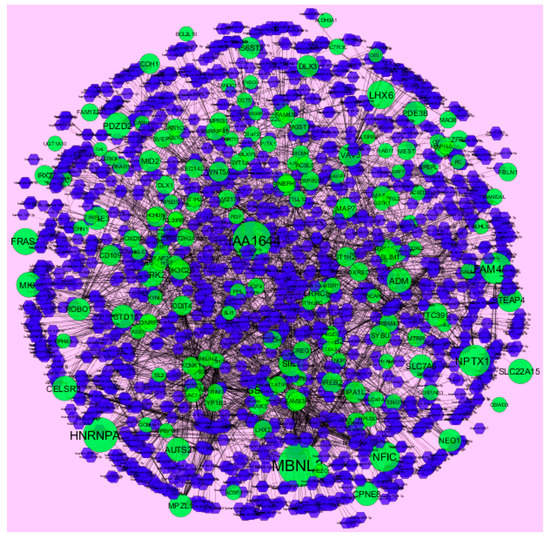
Figure 12.
The network of up-regulated DEGs and their related miRNAs. The green circles nodes are up-regulated DEGs, and blue diamond nodes are miRNAs. Black lines means interaction with adjutant genes or miRNAs.
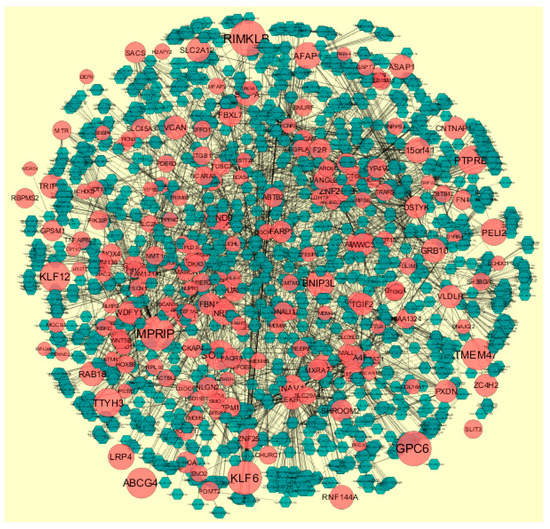
Figure 13.
The network of down-regulated DEGs and their related miRNAs. The red circle nodes are the down-regulated DEGs, and green diamond nodes are miRNAs. Black lines means interaction with adjutant genes or miRNAs.
3.8. Construction of the TFs-Target Gene Regulatory Network
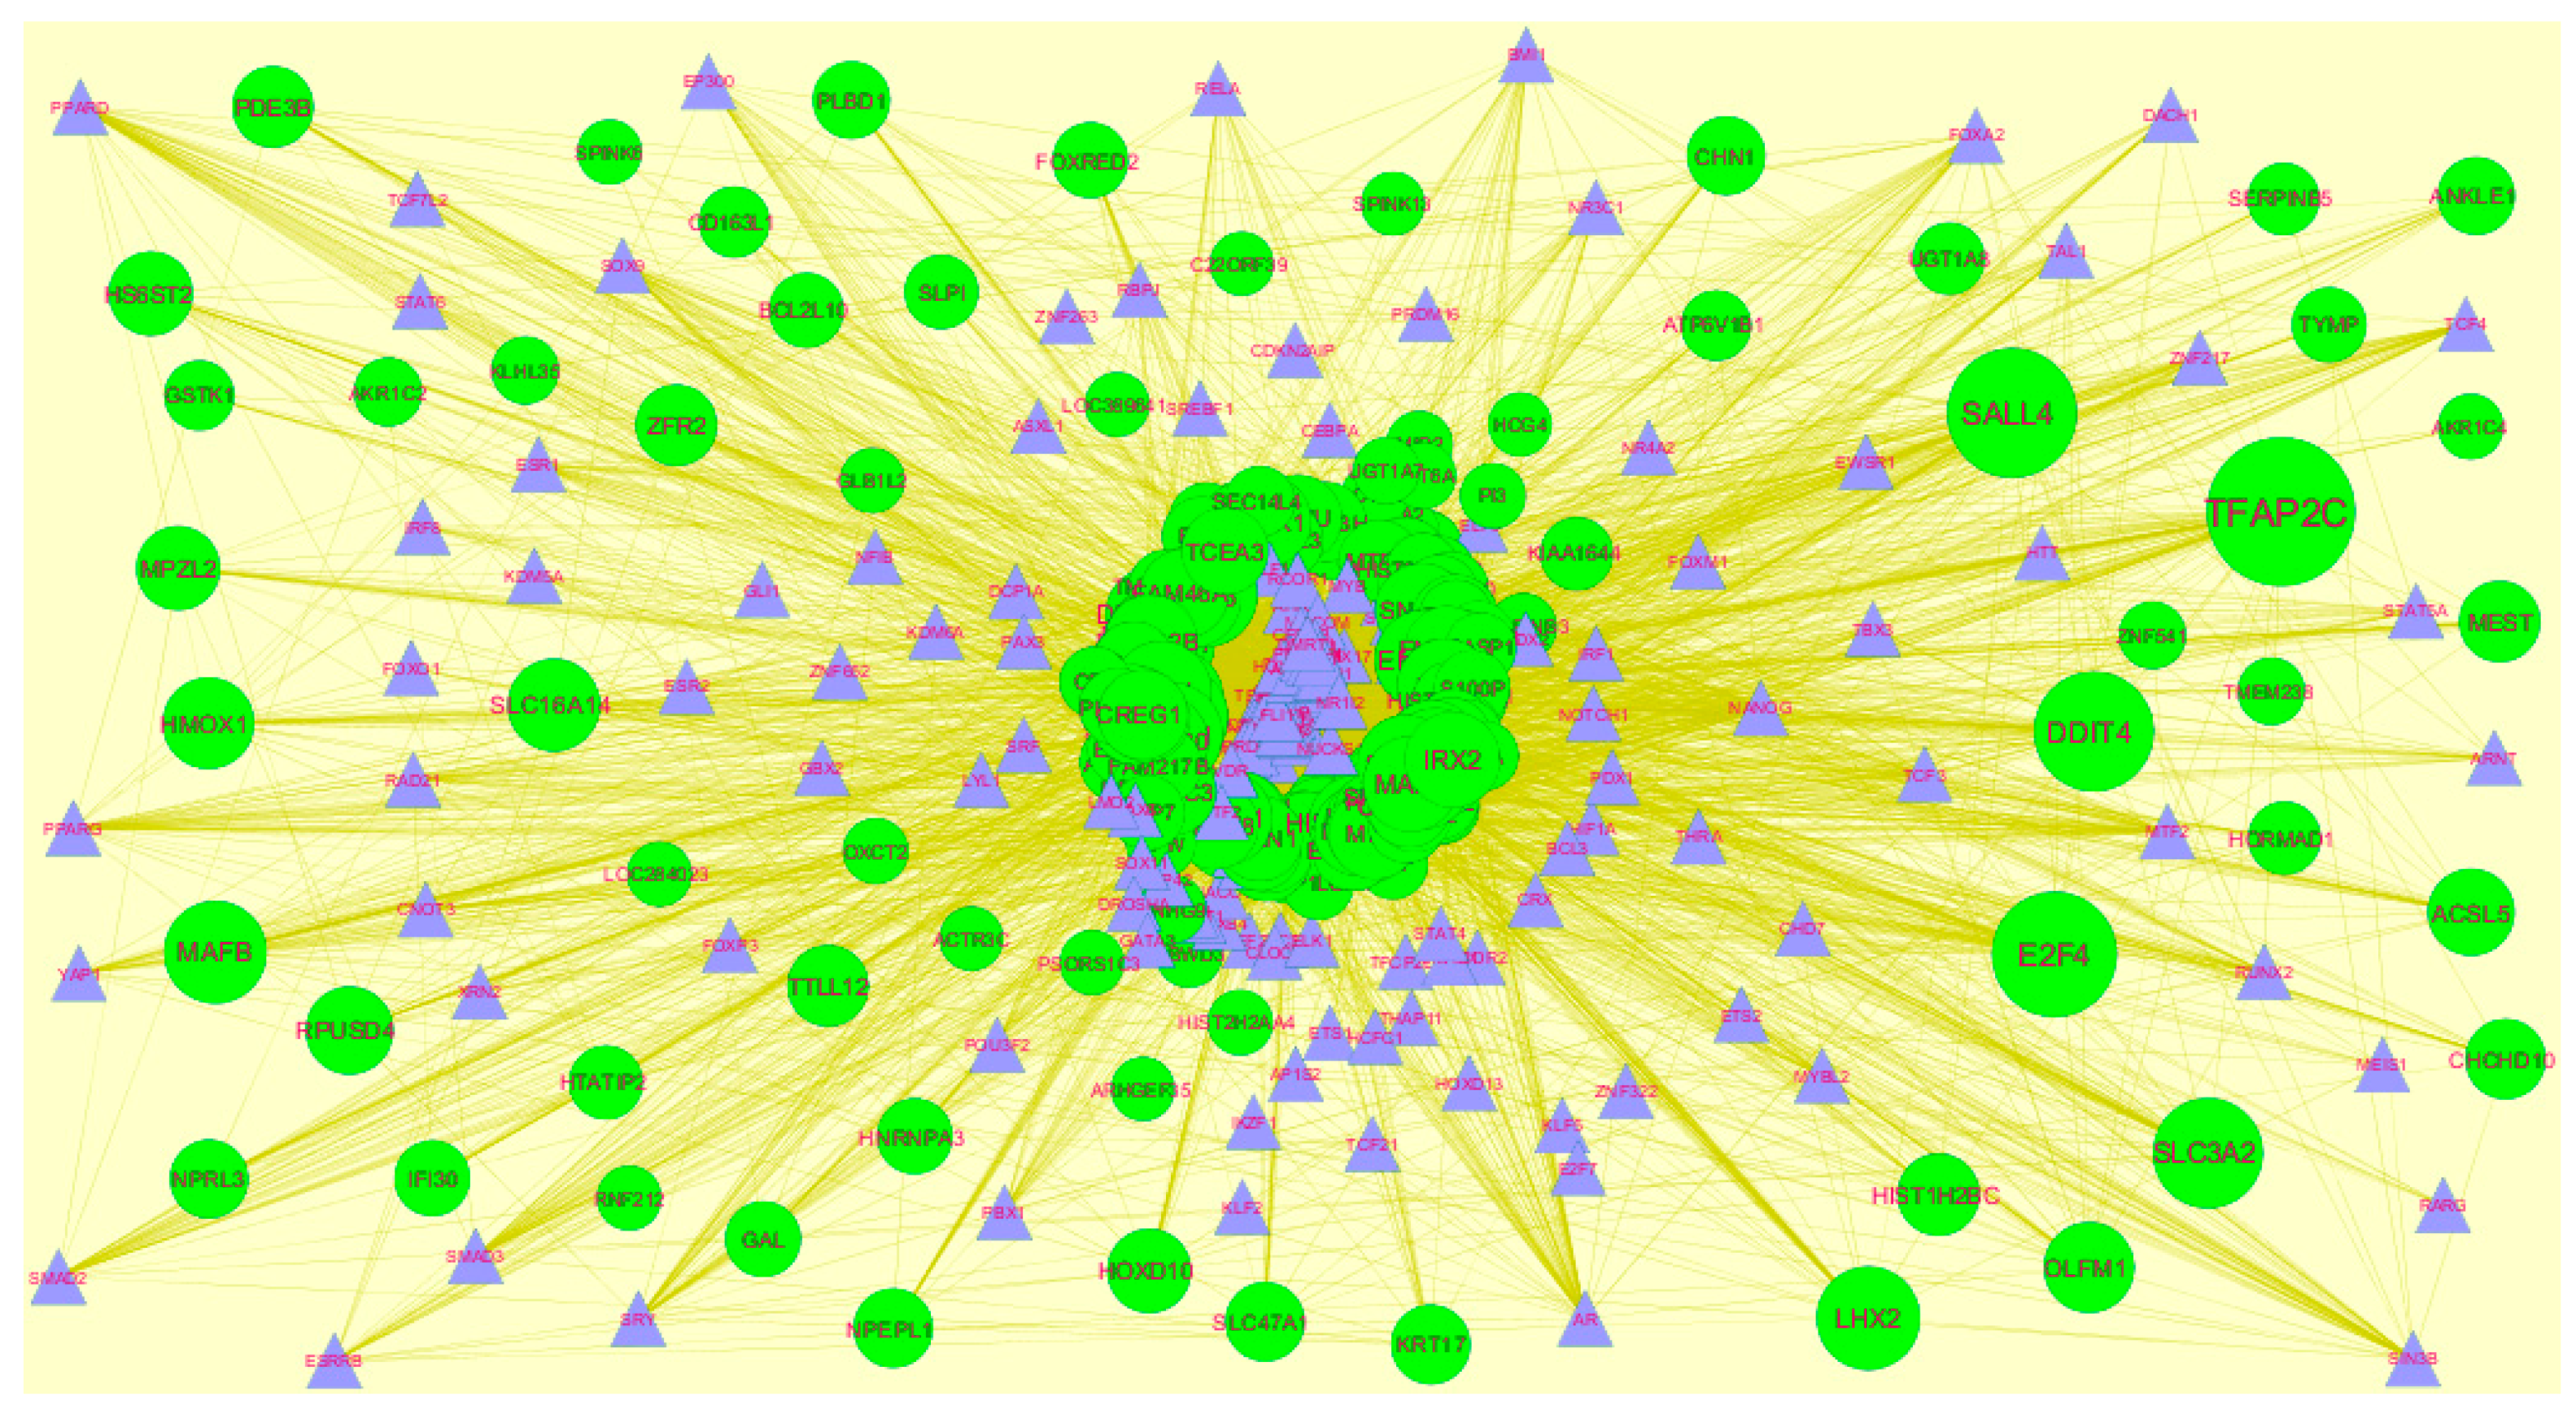
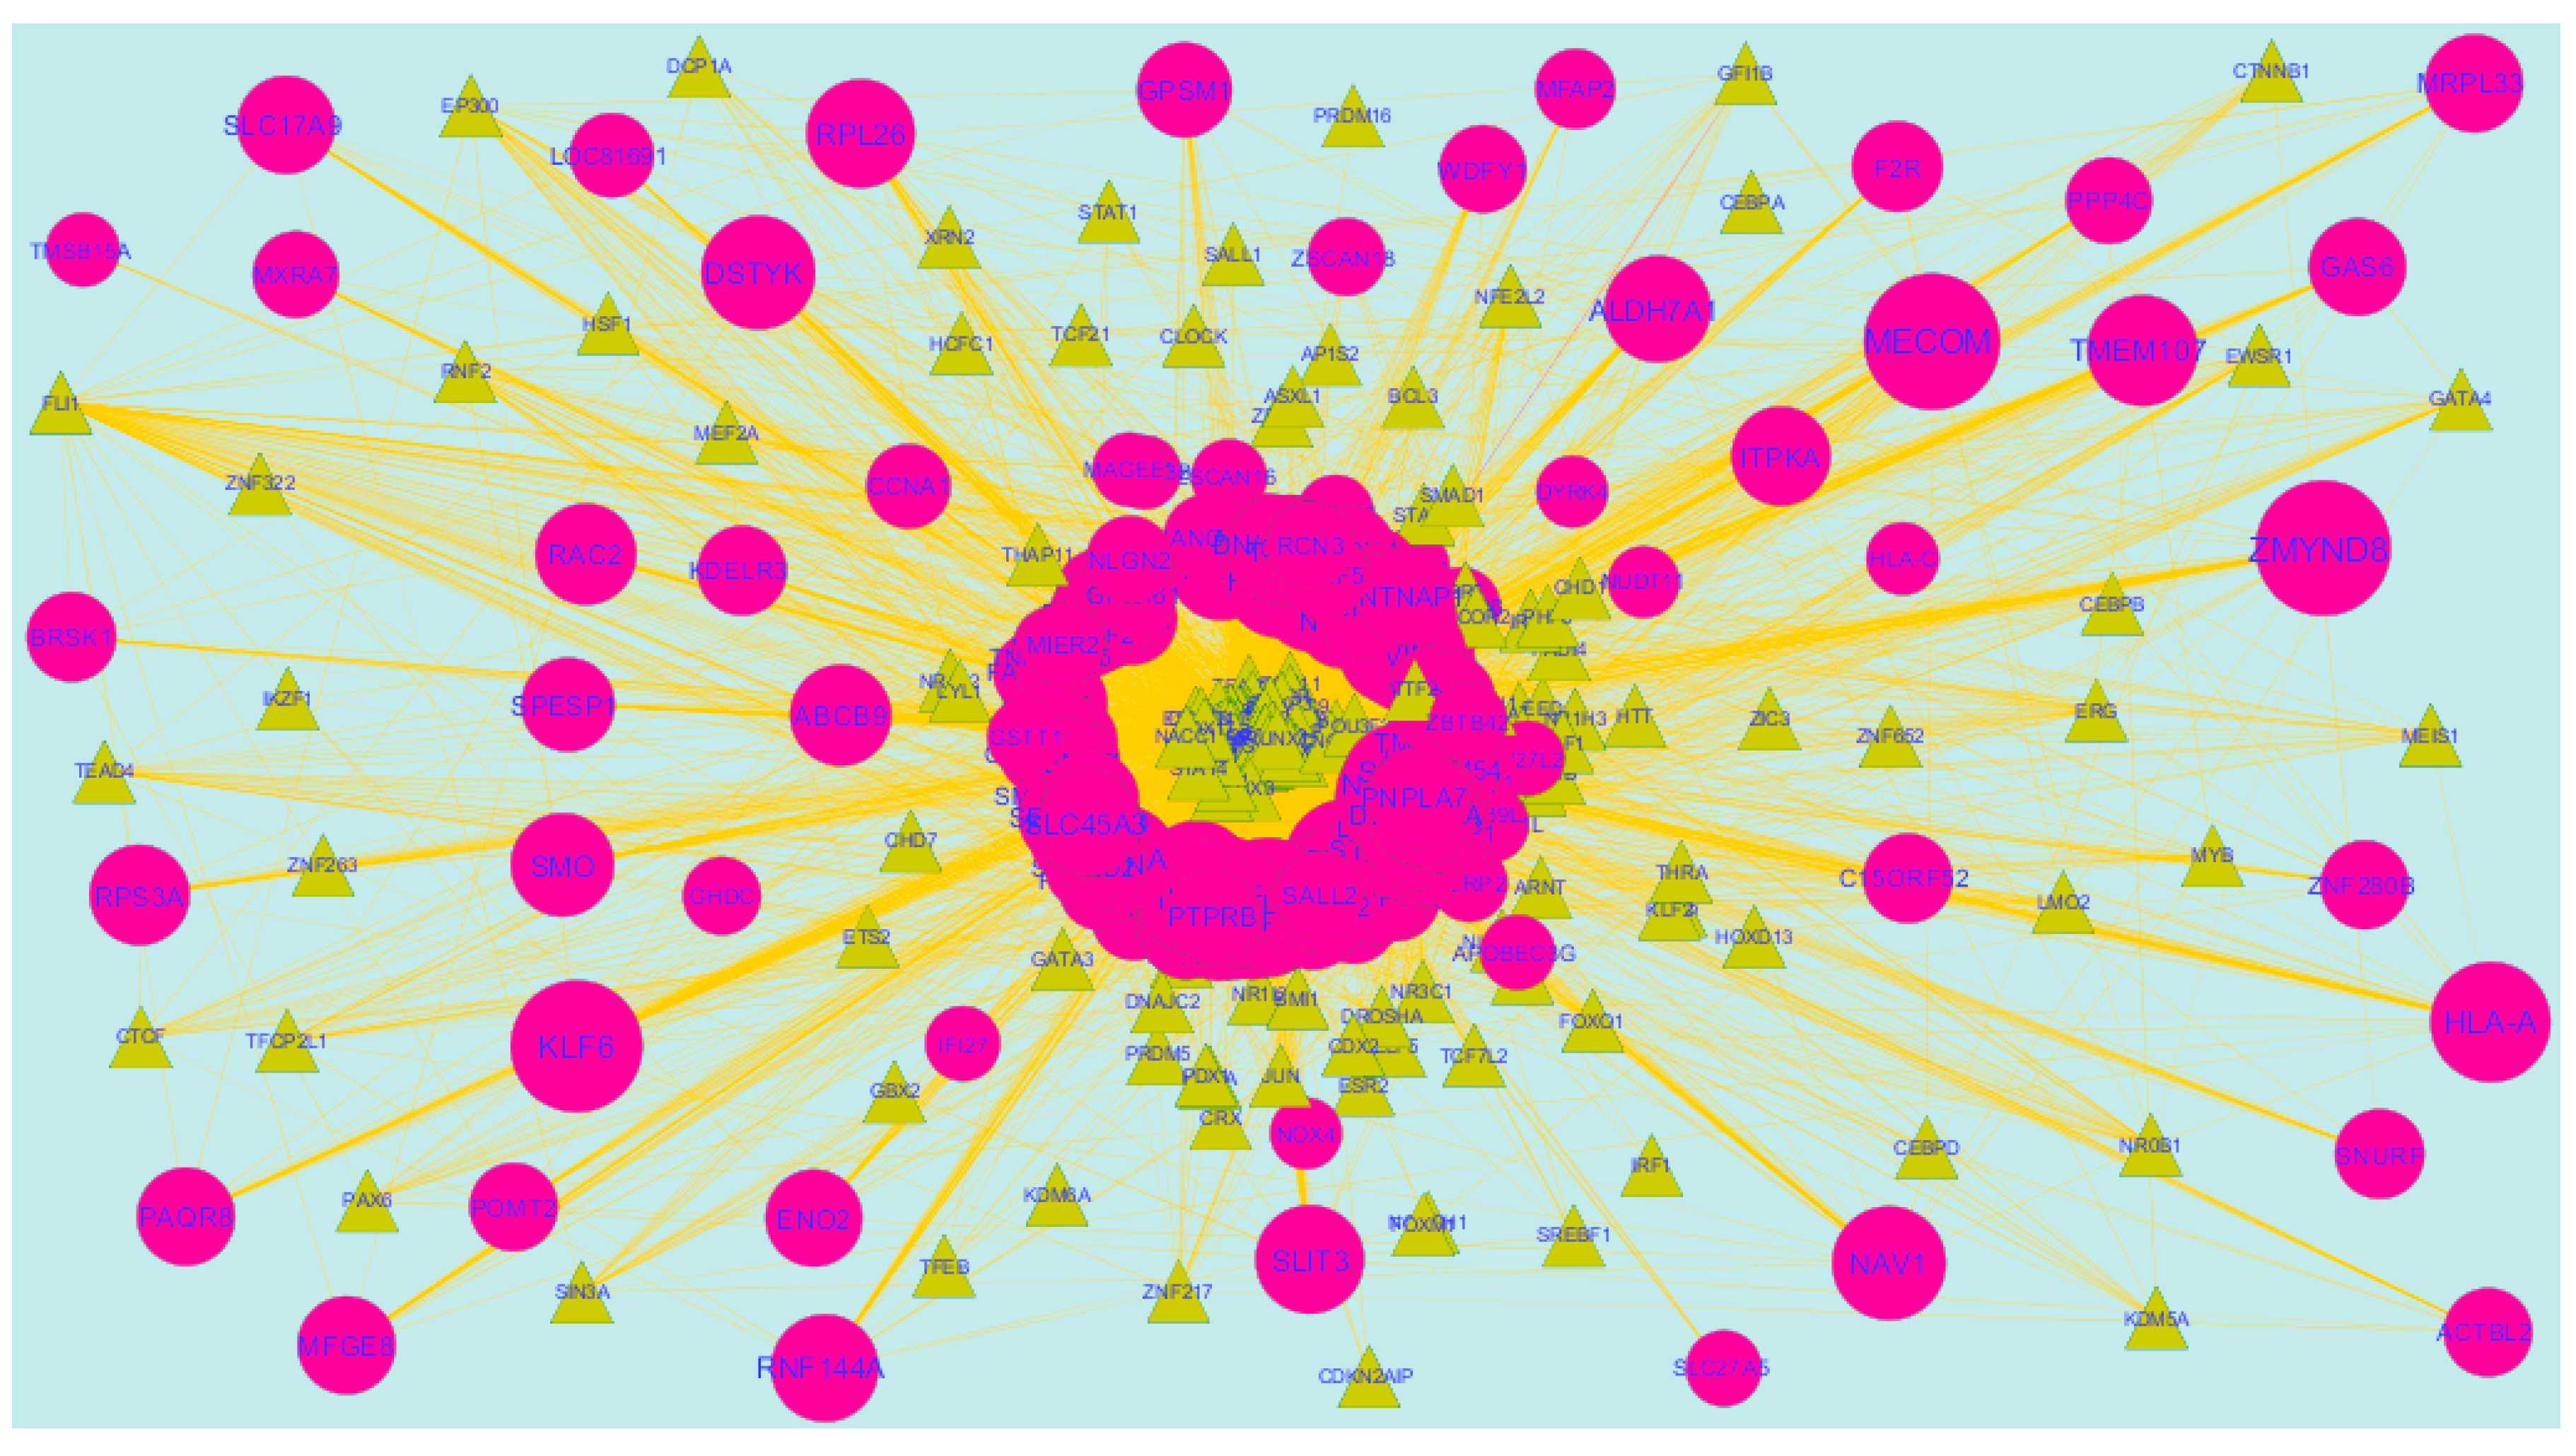
Transcription factors (TFs)were responsible for the advancement of many cancer types [47]. The TFs for target up- and down-regulated genes are shown in Figure 14 and Figure 15, respectively.O fht up-regulated hub genes, e.g.,KRT6A interacts with 124 TFs, MRPS30 interacts with 109 TFs, FAM217B interacts with 100 TFs, MFSD3 interacts with 95 TFs and KIAA1644 interacts with 92 TFs, as listed in supplementary Table S8. Of the down-regulated hub genes, e.g., TMSB15A interacts with 120 TFs, ZNF280B interacts with 100 TFs, BRSK1 interacts with 105 TFs, IFI27L2 interacts with 103 TFs and RIMKLB interacts 99 TFs, as listed in supplementary Table S8.
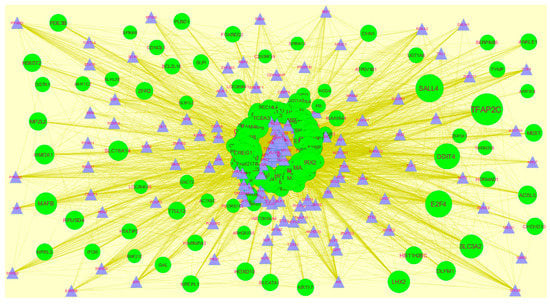
Figure 14.
TF- gene network of predicted target up-regulated genes. Blue triangles are TFs and green circles are target up-regulated genes. Yellow lines means interaction with adjutant genes or TFs.
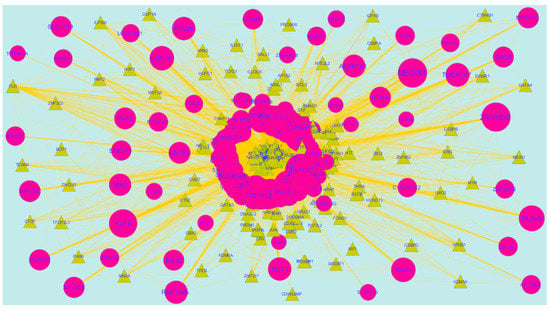
Figure 15.
TF- gene network of predicted target down-regulated genes. Yellow triangles are TFs and pink circles are target down-regulated genes. Yellow lines means interaction with adjutant genes or TFs.
3.9. Validation of the Expression Level of Key Genes in PPI Network
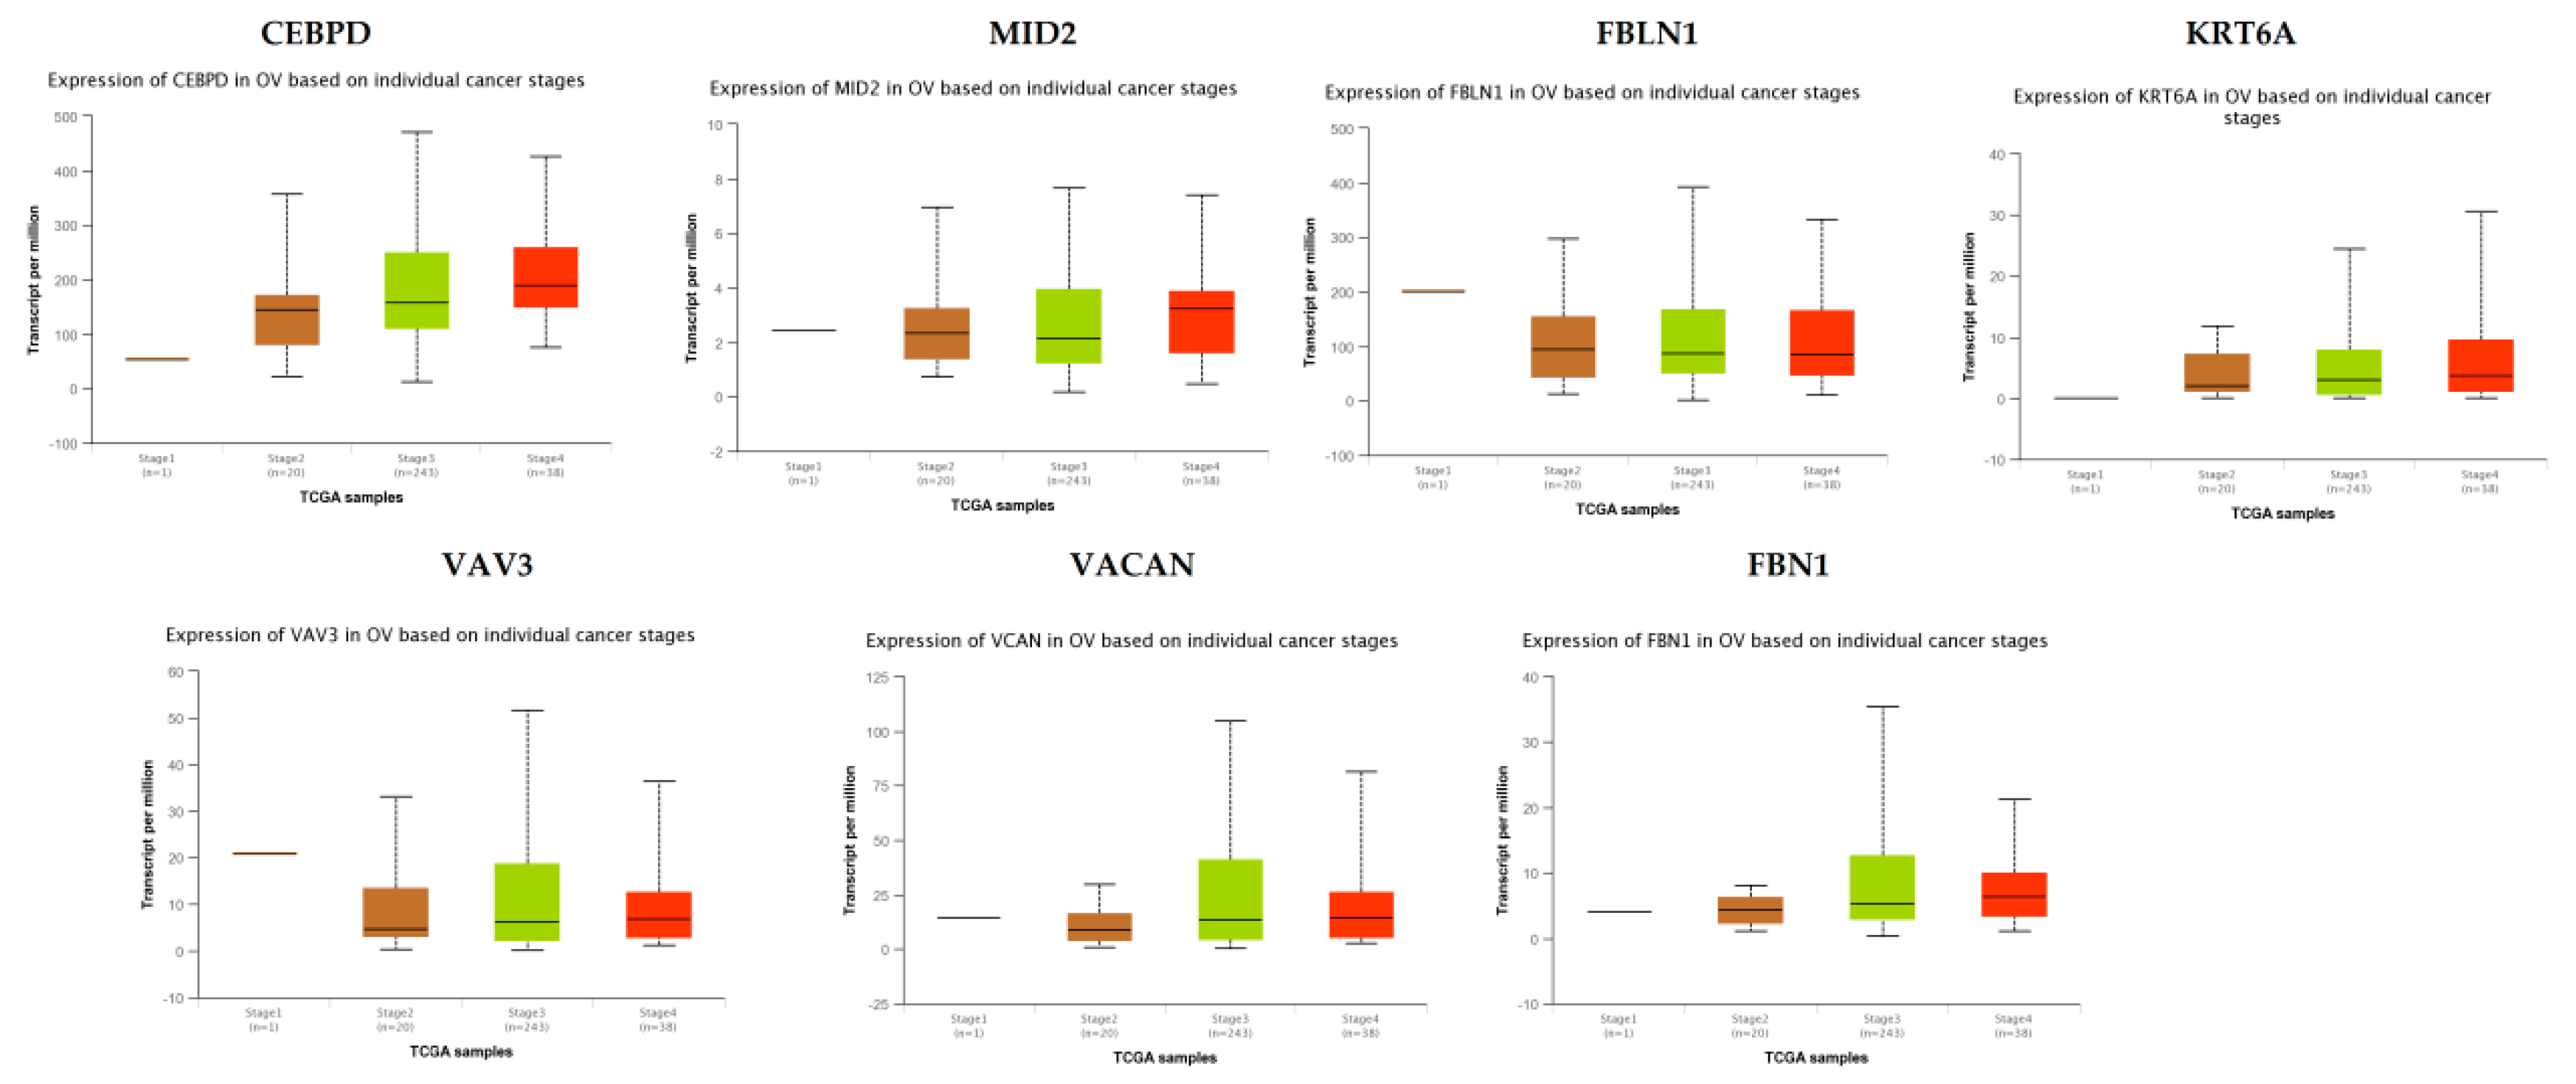
TCGA data analysis showed that hub genes such as CEBPD, MID2, FBLN1, KRT6A, VAV3, VACAN and FBN1 were highly expressed in stages 3 and 4 compared to other stages (Figure 16), while hub genes such as HLA-A (major histocompatibility complex, class I, A), KLF6 and SACS (sacsin molecular chaperone) were highly expressed in stages 2 and 4 compared to other stages(Figure 17); these findings were consistent with the results of the microarray analysis.
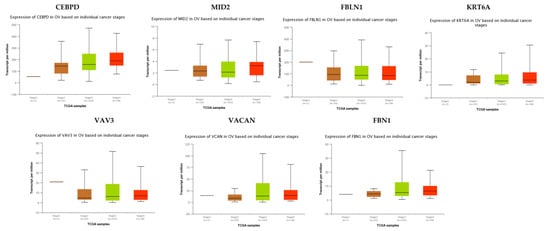
Figure 16.
Validation of the expression of hub genes in TCGA database. High expression of hub genes in stages 3 and 4. CEBPD: CCAAT enhancer binding protein delta; OV: ovarian cancer.

Figure 17.
Validation of the expression of hub genes in the TCGA database. High expression of hub genes in stages 2 and 4.
3.10. Association of Hub Genes Expression with Survival of Patients with EOC
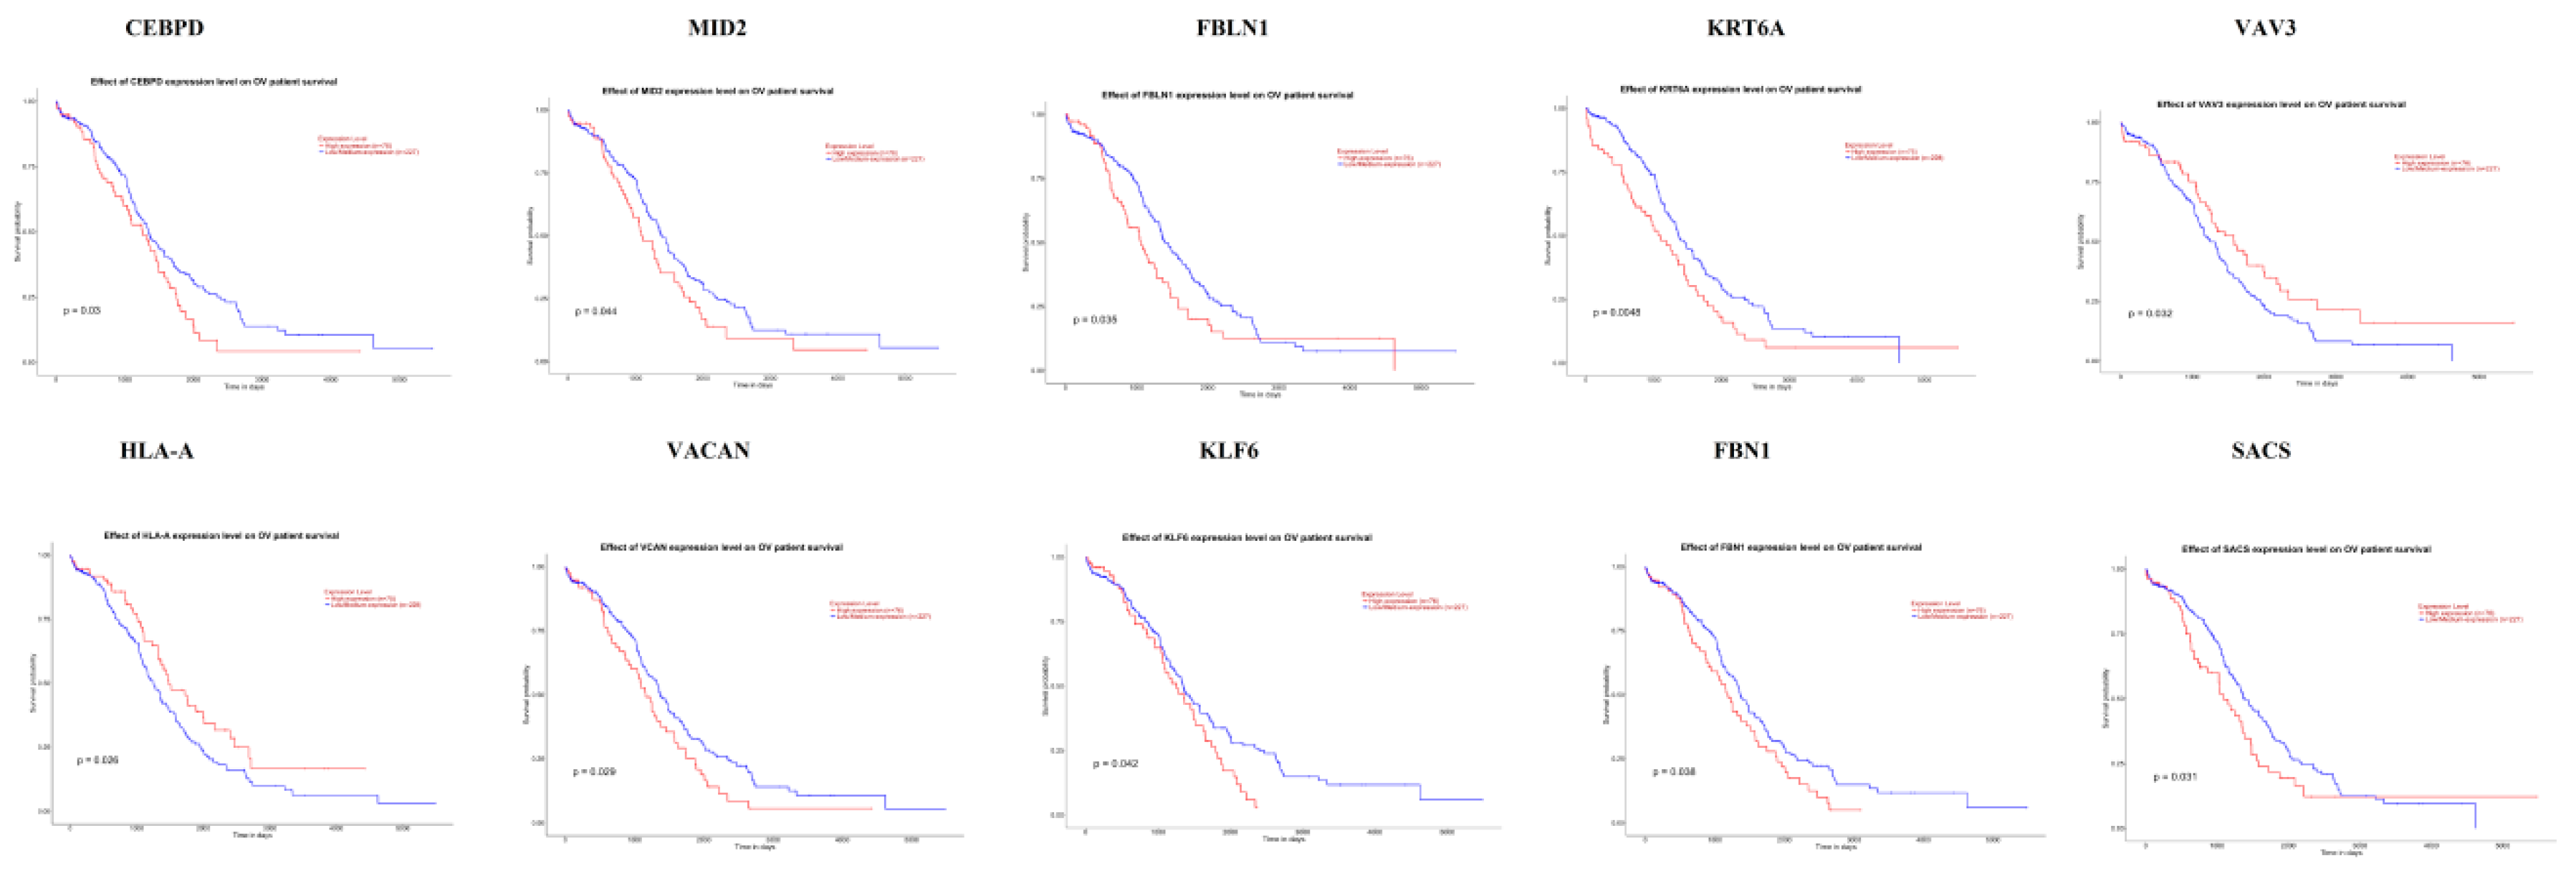
The UALCAN online analysis tool was used to analyze the prognosis of EOC according to the expression (low and high) of the hub genes. The analysis tool can do Kaplan–Meier prognosis analyses based on hub gene expression (low and high) and prognostic correlations in the TCGA database. As shown in Figure 18, the high expression levels of the hub genes such as FBLN1, VAV3, HLA-A and SACS correlated with favorable overall survival (OS) for EOC, while hub genes such as CEBPD, MID2, KRT6A, VACAN, KLF6 and FBN1 correlated with worst overall survival (OS) for EOC.
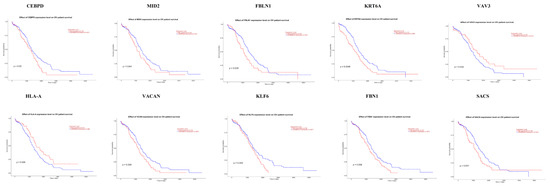
Figure 18.
Kaplan-Meier survival curves using TCGA data validate the prognostic value of genes expressed in EOC. Blue is low expression and Red is high expression).
4. Discussion
Symbolic progress has been accomplished in the diagnosis and treatment of EOC. However, EOC remains the fifth most common cancer worldwide [48]. Due to the high risk of recurrence and the poor survival rates of metastatic EOC patients, high-grade ovarian epithelial cancer, normal ovarian epithelium and normal fallopian tube were used to investigate the molecular mechanisms which are associated with metastasis. In previous studies, gene expression profiling has been used to identify the biomarkers and pathways which are associated with EOC [49], as well as genome-wide changes in EOC [50].Based on the cutoff criteria, a total of 276 up-regulated and 276 down-regulated genes were diagnosed from E-MTAB-3706. Methylation inactivation ASS1 was linked with cisplatin resistance in EOC [51]. Over expression of SLPI was associated with pathogenesis of EOC [52,53]. HS6ST2 was critical for fibroblast growth factor 2 activation [54]. HS6ST2 was responsible for angiogenesis in colorectal cancer [55]. HS6ST2 is associated with angiogenesis in EOC [56]. FBLN1 was associated with invasion of EOC cells [57,58]. ADM (adrenomedullin) was linked with angiogenesis in EOC [59]. ADM was responsible forpathogenesis of EOC [60]. UCHL1 was associated with growth breast cancer [61]. The loss of tumor suppressor UCHL1 was responsible for the inactivation of apoptosis, as well as cisplatin resistance, in EOC [62]. Methylation inactivation of tumor suppressors such as UCHL1 [63] and TUSC3 [64] were diagnosed with EOC.IFI27 was responsible for the proliferation of epithelial cancer cells [65].Li IFI27 was associated with invasion and drug resistance in EOC [66]. The loss of tumor suppressor DKK3 was important for invasion of cervical cancer [67]. The methylation inactivation of tumor suppressor DKK3 was linked with pathogenesis of gastric cancer [68].The loss of DKK3 was responsible for the progression of EOC [69].The loss of GSTT1 was responsible for the inactivation of the detoxification processes in EOC [70]. Polymorphism in GSTT1 is important for the improvement of EOC [71,72].
In pathway enrichment analyses, chemical carcinogenesis, urea cycle, packaging of telomere ends, arginine and proline metabolism, genes encoding enzymes and their regulators involved in the remodeling of the extracellular, nicotine degradation, EPHA2 forward signaling, arginine and proline metabolic, and verapamil pathway were the most significant pathways from different pathway databases such as KEGG, BIOCYC, PID, Reactome, GenMAPP, MSigDB C2 BIOCARTA, PantherDB, Pathway Ontology and SMPDB for up-regulated genes.CYP1B1 was responsible for drug resistance in EOC [73]. Polymorphisms in EPHX1 [74] and GSTO2 [75] were responsible for the pathogenesis of EOC. MGST1 was linked with the invasion and chemoresistance in EOC [76].The loss of AKR1C2 was responsible for the advancement of prostate cancer [77], but the inactivation of this gene may be associated with the development of EOC. ALDH3A1 was responsible for drug resistance in breast cancer [78], but this gene may be associated with drug resistance in EOC. Polymorphism in UGT1A7 was an indicator of drug toxicity in colorectal cancer [79], but this polymorphic gene may be associated with drug toxicity in EOC. Mutation in UGT2B7 was important for the growth of breast cancer [80], but mutations in this gene may be responsible for the development of EOC. Mutations in ASS1 were involved in the development of lung cancer [81], but mutations in this gene may be linked with pathogenesis of EOC. VAV3 was linked with metastasis of EOC [82]. Single nucleotide polymorphism (SNP) in EFNA1 was important for the progression of gastric cancer [83], but SNP in this gene may be associated with development of EOC. SERPINB3 was associated with invasion of EOC cells [84,85]. CD109 was found to be associated with the growth of small cell lung cancer [86], but this gene may be associated with the pathogenesis of EOC. Methylation inactivation of EDNRB (endothelin receptor type B) was linked with the development ofprostate cancer [87], but the inactivation of this gene may be responsible for the progression of EOC. GSTK1, UGT1A10, UGT1A8, HIST1H2AC, HIST1H2BC, HIST1H2BD, HIST1H2BJ, HIST1H2BK, HIST2H2AA3, HIST2H2AA4, HIST2H2BE, MAOB (monoamine oxidase B), A2M, PI3, HYAL3, KCNK1, SNTB1 and SNTB2 were novel biomarkers for pathogenesis of EOC in these pathways. Meanwhile, cell adhesion molecules, creatine biosynthesis, syndecan-4-mediated signaling event, extracellular matrix organization, glutathione metabolism, the ensemble of genes encoding core extracellular matrix, integrin signaling pathway, ubiquitin/proteasome degradation and guanidinoacetatemethyltransferase deficiency (GAMT Deficiency) were the most significant pathways from different pathway databases such as KEGG, BIOCYC, PID, Reactome, GenMAPP, MSigDB C2 BIOCARTA, PantherDB, Pathway Ontology and SMPDB for down-regulated genes.NECTIN2was linked with cell adhesion and the migration of pancreatic ductal adenocarcinomas cells [88]. NECTIN2 was important for invasion and metastasis in colorectal carcinoma [89]. NECTIN2 was important for the pathogenesis of EOC [90]. VCAN was associated with the progression of prostate cancer [91]. VCAN was responsible for invasion of EOC cells [92]. Loss of HLA-A was found to correlated with pathogenesis of colorectal cancer, but the reduced expression of this gene may be associated with EOC [93]. ITGB1 was involved in cell adhesion and invasion of prostate cancer cells [94], but this gene may be associated with invasion of EOC. NECTIN3 was associated with the proliferation of colon cancer cells [95], but this gene may be linked with the development of EOC. TNC (tenascin C) was responsible for invasion of colon cancer cells [96] but was important for metastasis and angiogenesis in EOC [97]. FN1 was linked with the suppression of apoptosis in renal cancer [98], but this gene may be associated with the suppression of apoptosis in EOC. COL6A3 was responsible for the advancement of EOC [99]. FBN1 was responsible for the pathogenesis of EOC [100]. Polymorphism in GSTM1 was associated with cancer risk [101,102,103]. CTGF (connective tissue growth factor) was involved in the growth of breast cancer [104]. Methylation inactivation of tumor suppressor gene CTGF was responsible for the development of EOC [105]. GAS6 was important for the migration and invasion of prostate cancer cells [106]. GAS6 was associated with invasion of EOC cells [107]. Low expression of tumor suppressor IGFBP7 was responsible for angiogenesis in hepatocellular carcinoma [108]. The loss of IGFBP7 was found to be associated with angiogenesis in EOC [109]. MFGE8 was important for pathogenesis of prostate cancer [110]. MFGE8 was associated with the adhesion and migration of EOC cells [111]. Metylation inactivation of tumor suppressor SLIT3 was responsible for invasion of thyroid cancer cells [112], but silencing this gene may be associated with invasion of EOC. ECM1 was linked with angiogenesis and metastasis of breast cancer cells [113], but this gene may be responsible for metastasis of EOC. RAC2 was diagnosed with the growth ofbrain cancer [114], but this gene may be linked with the development of EOC. CNTNAP1, HLA-C, JAM3,NLGN2, COL16A1, COL8A1, EFEMP2, LRP4, MFAP2, P3H3, P4HA2, GSTT2, EGFLAM (EGF like, fibronectin type III and laminin G domains), PXDN (peroxidasin), ACTBL2, SNCA (synuclein alpha) and GAMT (guanidinoacetate N-methyltransferase) were novel biomarkers for pathogenesis of EOC in these pathways.
In GO enrichment analysis, cellular response to xenobiotic stimulus, nucleosome and serine-type endopeptidase inhibitor activity were the most significant GO terms, i.e., for BP, CC and MF for up-regulated genes. Polymorphism in NQO1 was associated with drug resistance in non-small cell lung cancer [115]. Polymorphism in NQO1 was responsible for the development of EOC [116]. Low expression of tumor suppressor SPINK13 was linked with invasion of EOC cells [117]. Methylation inactivation of tumor suppressor SPINT2 was diagnosed with the growth of melanoma [118], but the inactivation of this gene may be associated with the development of EOC.CES1, HIST1H1C andSPINK6 were novel biomarkers for pathogenesis of EOC in these GO terms. Meanwhile, extracellular matrix organization, extracellular matrix and cell adhesion molecule binding were the most significant GO terms for e.g. BP, CC and MF for down-regulated genes. FSCN1 was responsible for invasion of bladder cancer cells [119]. FSCN1 was linked with invasion of EOC cells [120]. GPC6 was involved in invasion of EOC cells [121]. Metylation inactivation of LGALS1 was associated with angiogenesis in colorectal cancer [122], but silencing this gene may be responsible for angiogenesis in EOC. NECTIN2 was associated with the proliferation of EOC cells [90].WNT5B and DSP were novel biomarker for pathogenesis of EOC in these GO terms.
In the PPI network (up regulated), hub genes such as E2F4, SRPK2, A2M, CDH1 and MAP1LC3A were identified with high node degrees. E2F4was linked with the proliferation of breast cancer cells [123], but this gene may be responsible for the proliferation of EOC cells. CDH1 was responsible for metastasis of gastric cancer and colorectal cancer [124]. Mutation in CDH1 was responsible for metastasis of EOC [125]. Hub genes with highest betweenness centralities such as E2F4, CEBPD, CCT5, ATP6V1B1 and MCM4. MCM4 was identified with the proliferation of non small cell lung cancer cells [126], but this gene may be responsible for the proliferation of EOC cells. Hub genes with highest stress centralities such as SRPK2, E2F4, CDH1, CCT5 and HIST2H2BE.Hub genes with highest closeness centrality such as IL20RB, HNRNPA3, HIST1H1C, MCM4 and SRPK2. Hub genes with lowest clustering coefficient such as NPTX1, KLHL35, NEFH, SLPI and TYMP. SRPK2, MAP1LC3A, CEBPD, CCT5, ATP6V1B1 and IL20RB were novel biomarkers for pathogenesis of EOC in this PPI network. Meanwhile, PPI network (down-regulated), hub genes such as UCHL1, HLA-C, VAT1, ECM1 and SNRPN were identified with high node degree. Hub genes with high betweenness such as UCHL1, HLA-C, VAT1, ECM1 and SNRPN. Hub genes with high stress such as FN1, TCF3, RPS6, EFEMP2 and MECOM. TCF3 was linked with drug resistance in gastric cancer [127], but this gene may be responsible for drug resistance in EOC. TCF3 was found to be associated with the growth of EOC [128]. MECOM was associated with the proliferation of glioblastoma multiforme cells [129]. MECOM was responsible for pathogenesis of EOC [130]. RPS6 was associated with drug resistance in colorectal cancer [131], but this gene may be responsible for drug resistance in EOC. Hub genes with high closeness such as FN1, VIM, RPS6, RPL26 and LGALS1. Hub genes with low clustering coefficient such as FAM69B, COL6A3, SNURF, SCARA3 and TMEM107. SCARA3 was associated with metastasis in EOC [132]. SNRPN, VIM, RPL26 and LGALS1 were novel biomarkers for pathogenesis of EOC in this PPI network.
In a module analysis for PPI network (up-regulated), hub genes such as HIST1H2BD, HIST1H1C, KRT17, PYCARD, CASP1, TFAP2C, CCT5, HNRNPA3 and HIST2H2BE were in all four modules. KRT17, KIF7, SLC7A5 and SLC3A2 were novel biomarkers for EOC in these modules. Meanwhile, in a module analysis for the PPI network (down-regulated), hub genes such as FN1, FSCN1, RPL10, VIM, RPS6, LGALS1,RPL26, ITGB1, PTPRB, LGALS1, CTGF, PELI2, ACOT13, FBN1, TNC, EEF1A2, ACTBL2and DSP were found to be in all four modules. EEF1A2 was associated with angiogenesis in breast cancer [133]. EEF1A2 was linked with pathogenesis of EOC [134]. RPL10, PTPRB, PELI2 and DSP were novel biomarkers for pathogenesis of EOC in these modules.
In the miRNA-target gene regulatory network (up-regulated), hub genes such as MBNL3, KIAA1644, HNRNPA3, NPTX1 and FAM46A. MBNL3, KIAA1644 and FAM46A were novel biomarkers for pathogenesis of EOC in this network. Meanwhile, in the miRNA-target gene regulatory network (down-regulated), hub genes such as RIMKLB, GPC6, MPRIP, KLF6 and TMEM47. The modification in tumor suppressor KLF6 was responsible for the advancement of prostate cancer [135]. The loss of tumor suppressor KLF6 was responsible for pathogenesis of EOC [136]. RIMKLB, MPRIP and TMEM47 were novel biomarkers for pathogenesis of EOC in this network.
In TF-target gene regulatory network (up-regulated), hub genes such as KRT6A, MRPS30, FAM217B, MFSD3 and KIAA1644. SNP in tumor suppressor MRPS30 was associated with advancement of breast cancer [137], but SNP in this gene may be responsible for pathogenesis of EOC. KRT6A, FAM217B and MFSD3 were novel biomarkers for pathogenesis of EOC in this network. In the TF-target gene regulatory network (down-regulated), hub genes such as TMSB15A, ZNF280B, BRSK1, IFI27L2 and RIMKLB. TMSB15A, ZNF280B, BRSK1 and IFI27L2 were novel biomarkers for pathogenesis of EOC in this network.
Survival analysis revealed that hub genes with high expression, such as FBLN1, VAV3, HLA-A and SACS were associated with improved survival in EOC, while hub genes with high expression such as CEBPD, MID2, KRT6A, VACAN, KLF6 and FBN1 showed the opposite tendency. Expression levels revealed that hub genes such as CEBPD, MID2, FBLN1, KRT6A, VAV3, VACAN and FBN1were highly expressed in EOC (stages 3 and 4), meanwhile those such as HLA-A, KLF6 and SACS were highly expressed in EOC (stages 2 and 4).
5. Conclusions
In conclusion, the purpose of this study was to improve our understanding of the molecular mechanisms underlying the progression of EOC through an integrated bioinformatics analysis that aimed to diagnose DEGs and the related pathways associated with the advancement of EOC. Our research also identified several hub genes and biological pathways that could aid in the search for novel biomarkers and therapeutic targets for the treatment ofEOC. However, further molecular biology experiments are required to validate the findings of this study.
Supplementary Materials
The following are available online at https://www.mdpi.com/2075-4418/9/2/39/s1.
Author Contributions
V.C.A. and V.R. collected important background information, data collection, C.V. performed R-programming (Software), statistical analysis (Formal Analysis) and investigation. B.V. carried out the design of this study (methodology), performed the statistical analysis (Formal Analysis), visualizations and drafted the manuscript.
Acknowledgments
We thank Li, Xiang, Duke-NUS Medical School, Singapore, very much, the author who deposited their microarray dataset, E-MTAB-3706, into the public Array Express database.
Conflicts of Interest
The authors declare that they have no conflict of interest.
References
- Schwartz, D.R.; Kardia, S.L.; Shedden, K.A.; Kuick, R.; Michailidis, G.; Taylor, J.M.; Misek, D.E.; Wu, R.; Zhai, Y.; Darrah, DM.; et al. Gene expression in ovarian cancer reflects both morphology and biological behavior, distinguishing clear cell from other poor-prognosis ovarian carcinomas. Cancer Res. 2002, 62, 4722–4729. [Google Scholar] [PubMed]
- Jelovac, D.; Armstrong, D.K. Recent progress in the diagnosis and treatment of ovarian cancer. CA Cancer J. Clin. 2011, 61, 183–203. [Google Scholar] [CrossRef] [PubMed]
- Claus, E.B.; Schildkraut, J.M.; Thompson, W.D.; Risch, N.J. The genetic attributable risk of breast and ovarian cancer. Cancer 1996, 77, 2318–2324. [Google Scholar] [CrossRef]
- Berchuck, A.; Kohler, M.F.; Bast, R.C. Oncogenes in ovarian cancer. Hematol. Oncol. Clin. N. Am. 1992, 6, 813–827. [Google Scholar] [CrossRef]
- Aunoble, B.; Sanches, R.; Didier, E.; Bignon, Y.J. Major oncogenes and tumor suppressor genes involved in epithelial ovarian cancer (review). Int. J. Oncol. 2000, 16, 567–576. [Google Scholar] [CrossRef]
- Liu, X.; Gao, Y.; Lu, Y.; Zhang, J.; Li, L.; Yin, F. Oncogenes associated with drug resistance in ovarian cancer. J. Cancer Res. Clin. Oncol. 2015, 141, 381–395. [Google Scholar] [CrossRef] [PubMed]
- Nakayama, K.; Nakayama, N.; Katagiri, H.; Miyazaki, K. Mechanisms of ovarian cancer metastasis: Biochemical pathways. Int. J. Mol. Sci. 2012, 13, 11705–11717. [Google Scholar] [CrossRef]
- Cheaib, B.; Auguste, A.; Leary, A. The PI3K/Akt/mTOR pathway in ovarian cancer: Therapeutic opportunities and challenges. Chin. J. Cancer. 2015, 34, 4–16. [Google Scholar] [CrossRef] [PubMed]
- Mhawech-Fauceglia, P.; Afkhami, M.; Pejovic, T. MET/HGF Signaling Pathway in Ovarian Carcinoma: Clinical Implications and Future Direction. Patholog. Res. Int. 2012, 2012, 960327. [Google Scholar] [CrossRef] [PubMed]
- Zhang, L.; Volinia, S.; Bonome, T.; Calin, G.A.; Greshock, J.; Yang, N.; Liu, C.G.; Giannakakis, A.; Alexiou, P.; Hasegawa, K.; et al. Genomic and epigenetic alterations deregulate microRNA expression in human epithelial ovarian cancer. Proc. Natl. Acad. Sci. USA 2008, 105, 7004–7009. [Google Scholar] [CrossRef]
- Murphy, S.K.; Huang, Z.; Wen, Y.; Spillman, M.A.; Whitaker, R.S.; Simel, L.R.; Nichols, T.D.; Marks, J.R.; Berchuck, A. Frequent IGF2/H19 domain epigenetic alterations and elevated IGF2 expression in epithelial ovarian cancer. Mol. Cancer Res. 2006, 4, 283–292. [Google Scholar] [CrossRef] [PubMed]
- Mok, S.C.; Chao, J.; Skates, S.; Wong, K.; Yiu, G.K.; Muto, M.G.; Berkowitz, R.S.; Cramer, D.W. Prostasin, a potential serum marker for ovarian cancer: Identification through microarray technology. J. Natl. Cancer Inst. 2001, 93, 1458–1464. [Google Scholar] [CrossRef] [PubMed]
- Kallioniemi, O.P.; Wagner, U.; Kononen, J.; Sauter, G. Tissue microarray technology for high-throughput molecular profiling of cancer. Hum. Mol. Genet. 2001, 10, 657–662. [Google Scholar] [CrossRef] [PubMed]
- Dunning, M.J.; Smith, M.L.; Ritchie, M.E.; Tavaré, S. Beadarray: R classes and methods for Illumina bead-based data. Bioinformatics. 2007, 23, 2183–2184. [Google Scholar] [CrossRef]
- Du, P.; Kibbe, W.A.; Lin, S.M. Lumi: A pipeline for processing Illumina microarray. Bioinformatics 2008, 24, 1547–1548. [Google Scholar] [CrossRef]
- Ritchie, M.E.; Phipson, B.; Wu, D.; Hu, Y.; Law, C.W.; Shi, W.; Smyth, G.K. limma powers differential expression analyses for RNA-sequencing and microarray studies. Nucleic Acids Res. 2000, 43, e47. [Google Scholar] [CrossRef]
- Kaimal, V.; Bardes, E.E.; Tabar, S.C.; Jegga, A.G.; Aronow, B.J. ToppCluster: A multiple gene list feature analyzer for comparative enrichment clustering and network-based dissection of biological systems. Nucleic Acids Res. 2010, 38, W96–W102. [Google Scholar] [CrossRef]
- Aoki, K.F.; Kanehisa, M. Using the KEGG database resource. Curr. Protoc. Bioinform. 2005, 11, 1–12. [Google Scholar] [CrossRef]
- Caspi, R.; Billington, R.; Ferrer, L.; Foerster, H.; Fulcher, C.A.; Keseler, I.M.; Kothari, A.; Krummenacker, M.; Latendresse, M.; Mueller, L.A.; et al. The MetaCyc database of metabolic pathways and enzymes and the BioCyc collection of pathway/genome databases. Nucleic Acids Res. 2016, 44, D471–D480. [Google Scholar] [CrossRef]
- Schaefer, C.F.; Anthony, K.; Krupa, S.; Buchoff, J.; Day, M.; Hannay, T.; Buetow, K.H. PID: The Pathway Interaction Database. Nucleic Acids Res. 2009, 37, D674–D679. [Google Scholar] [CrossRef]
- Haw, R.; Hermjakob, H.; D’Eustachio, P.; Stein, L. Reactome pathway analysis to enrich biological discovery in proteomics data sets. Proteomics 2011, 11, 3598–3613. [Google Scholar] [CrossRef]
- Dahlquist, K.D.; Salomonis, N.; Vranizan, K.; Lawlor, S.C.; Conklin, B.R. GenMAPP, a new tool for viewing and analyzing microarray data on biological pathways. Nat. Genet. 2002, 31, 19–20. [Google Scholar] [CrossRef]
- Liberzon, A.; Birger, C.; Thorvaldsdóttir, H.; Ghandi, M.; Mesirov, J.P.; Tamayo, P. The Molecular Signatures Database (MSigDB) hallmark gene set collection. Cell Syst. 2015, 1, 417–425. [Google Scholar] [CrossRef]
- Mi, H.; Muruganujan, A.; Thomas, P.D. PANTHER in 2013: Modeling the evolution of gene function, and other gene attributes, in the context of phylogenetic trees. Nucleic Acids Res. 2013, 41, D377–D386. [Google Scholar] [CrossRef]
- Petri, V.; Jayaraman, P.; Tutaj, M.; Hayman, G.T.; Smith, J.R.; De Pons, J.; Laulederkind, S.J.; Lowry, T.F.; Nigam, R.; Wang, S.J.; et al. The pathway ontology-updates and applications. J. Biomed. Semant. 2014, 5, 7. [Google Scholar] [CrossRef]
- Jewison, T.; Su, Y.; Disfany, F.M.; Liang, Y.; Knox, C.; Maciejewski, A.; Poelzer, J.; Huynh, J.; Zhou, Y.; Arndt, D.; et al. SMPDB 2.0: Big improvements to the Small Molecule Pathway Database. Nucleic Acids Res. 2014, 42, D478–D484. [Google Scholar] [CrossRef]
- Ashburner, M.; Ball, C.A.; Blake, J.A.; Botstein, D.; Butler, H.; Cherry, J.M.; Davis, A.P.; Dolinski, K.; Dwight, S.S.; Eppig, J.T.; et al. Gene ontology: Tool for the unification of biology. Nat. Genet. 2000, 25, 25–29. [Google Scholar] [CrossRef]
- Breuer, K.; Foroushani, A.K.; Laird, M.R.; Chen, C.; Sribnaia, A.; Lo, R.; Winsor, G.L.; Hancock, R.E.; Brinkman, F.S.; Lynn, D.J. InnateDB: Systems biology of innate immunity and beyond--recent updates and continuing curation. Nucleic Acids Res. 2013, 41, D1228–D1233. [Google Scholar] [CrossRef]
- Orchard, S.; Ammari, M.; Aranda, B.; Breuza, L.; Briganti, L.; Broackes-Carter, F.; Campbell, N.H.; Chavali, G.; Chen, C.; del-Toro, N.; et al. The MIntAct project--IntAct as a common curation platform for 11 molecular interaction databases. Nucleic Acids Res. 2014, 42, D358–D363. [Google Scholar] [CrossRef]
- Salwinski, L.; Miller, C.S.; Smith, A.J.; Pettit, F.K.; Bowie, J.U.; Eisenberg, D. The Database of Interacting Proteins: 2004 update. Nucleic Acids Res. 2004, 32, D449–D451. [Google Scholar] [CrossRef]
- Licata, L.; Briganti, L.; Peluso, D.; Perfetto, L.; Iannuccelli, M.; Galeota, E.; Sacco, F.; Palma, A.; Nardozza, A.P.; Santonico, E.; et al. MINT, the molecular interaction database: 2012 update. Nucleic Acids Res. 2011, 40, D857–D861. [Google Scholar] [CrossRef]
- Bader, G.D.; Betel, D.; Hogue, C.W. BIND: The Biomolecular Interaction Network Database. Nucleic Acids Res. 2003, 31, 248–250. [Google Scholar] [CrossRef]
- Oughtred, R.; Stark, C.; Breitkreutz, B.J.; Rust, J.; Boucher, L.; Chang, C.; Kolas, N.; O’Donnell, L.; Leung, G.; McAdam, R.; et al. The BioGRID interaction database: 2019 update. Nucleic Acids Res. 2019, 47, D529–D541. [Google Scholar] [CrossRef]
- Shannon, P.; Markiel, A.; Ozier, O.; Baliga, N.S.; Wang, J.T.; Ramage, D.; Amin, N.; Schwikowski, B.; Ideker, T. Cytoscape: A software environment for integrated models of biomolecular interaction networks. Genome Res. 2003, 13, 2498–2504. [Google Scholar] [CrossRef]
- Zaki, N.; Efimov, D.; Berengueres, J. Protein complex detection using interaction reliability assessment and weighted clustering coefficient. BMC Bioinform. 2013, 14, 163. [Google Scholar] [CrossRef]
- Sethupathy, P.; Corda, B.; Hatzigeorgiou, A.G. TarBase: A comprehensive database of experimentally supported animal microRNA targets. RNA. 2006, 12, 192–197. [Google Scholar] [CrossRef]
- Chou, C.H.; Shrestha, S.; Yang, C.D.; Chang, N.W.; Lin, Y.L.; Liao, K.W.; Huang, W.C.; Sun, T.H.; Tu, S.J.; Lee, W.H.; et al. miRTarBase update 2018: A resource for experimentally validated microRNA-target interactions. Nucleic Acids Res. 2018, 46, D296–D302. [Google Scholar] [CrossRef]
- Xia, J.; Gill, E.E.; Hancock, R.E. NetworkAnalyst for statistical, visual and network-based meta-analysis of gene expression data. Nat. Protoc. 2015, 10, 823–844. [Google Scholar] [CrossRef]
- Lachmann, A.; Xu, H.; Krishnan, J.; Berger, S.I.; Mazloom, A.R.; Ma’ayan, A. ChEA: Transcription factor regulation inferred from integrating genome-wide ChIP-X experiments. Bioinformatics. 2010, 26, 2438–2444. [Google Scholar] [CrossRef]
- Chandrashekar, D.S.; Bashel, B.; Balasubramanya, S.A.H.; Creighton, C.J.; Ponce-Rodriguez, I.; Chakravarthi, B.V.; Varambally, S. UALCAN: A Portal for Facilitating Tumor Subgroup Gene Expression and Survival Analyses. Neoplasia. 2017, 19, 649–658. [Google Scholar] [CrossRef]
- Li, M.; Lu, Y.; Wang, J.; Wu, F.X.; Pan, Y. A Topology Potential-Based Method for Identifying Essential Proteins from PPI Networks. IEEE/ACM Trans. Comput. Biol. Bioinform. 2015, 12, 372–383. [Google Scholar] [CrossRef]
- Azevedo, H.; Moreira-Filho, C.A. Topological robustness analysis of protein interaction networks reveals key targets for overcoming chemotherapy resistance in glioma. Sci. Rep. 2015, 5, 16830. [Google Scholar] [CrossRef] [PubMed]
- Pavlopoulos, G.A.; Secrier, M.; Moschopoulos, C.N.; Soldatos, T.G.; Kossida, S.; Aerts, J.; Schneider, R.; Bagos, P.G. Using graph theory to analyze biological networks. BioData Min. 2011, 4, 10. [Google Scholar] [CrossRef] [PubMed]
- Ozgür, A.; Vu, T.; Erkan, G.; Radev, D.R. Identifying gene-disease associations using centrality on a literature mined gene-interaction network. Bioinformatics 2008, 24, i277–i285. [Google Scholar] [CrossRef] [PubMed]
- Hao, D.; Ren, C.; Li, C. Revisiting the variation of clustering coefficient of biological networks suggests new modular structure. BMC Syst. Biol. 2012, 6, 34. [Google Scholar] [CrossRef] [PubMed]
- Tan, W.; Liu, B.; Qu, S.; Liang, G.; Luo, W.; Gong, C. MicroRNAs and cancer: Key paradigms in molecular therapy. Oncol. Lett. 2018, 15, 2735–2742. [Google Scholar] [CrossRef]
- Smith, L.M.; Birrer, M.J. Use of transcription factors as agents and targets for drug development. Oncology 1996, 10, 1532–1538. [Google Scholar]
- Bast, R.C.; Urban, N.; Shridhar, V.; Smith, D.; Zhang, Z.; Skates, S.; Lu, K.; Liu, J.; Fishman, D.; Mills, G. Early detection of ovarian cancer: Promise and reality. In Ovarian Cancer; Springer: Boston, MA, USA, 2002; Volume 107, pp. 61–97. [Google Scholar]
- Yuan, Z.Q.; Sun, M.; Feldman, R.I.; Wang, G.I.; Ma, X.I.; Jiang, C.I.; Coppola, D.I.; Nicosia, S.V.I.; Cheng, J.Q. Frequent activation of AKT2 and induction of apoptosis by inhibition of phosphoinositide-3-OH kinase/Akt pathway in human ovarian cancer. Oncogene. 2000, 19, 2324–2330. [Google Scholar] [CrossRef]
- Suzuki, S.; Moore, D.H.; Ginzinger, D.G.; Godfrey, T.E.; Barclay, J.; Powell, B.; Pinkel, D.; Zaloudek, C.; Lu, K.; Mills, G.; et al. An approach to analysis of large-scale correlations between genome changes and clinical endpoints in ovarian cancer. Cancer Res. 2000, 60, 5382–5385. [Google Scholar]
- Nicholson, L.; Smith, P.R.; Hiller, L.; Szlosarek, P.W.; Kimberley, C.; Sehouli, J.; Koensgen, D.; Mustea, A.; Schmid, P.; Crook, T. Epigenetic silencing of argininosuccinatesynthetase confers resistance to platinum-induced cell death but collateral sensitivity to arginine auxotrophy in ovarian cancer. Int. J. Cancer 2009, 125, 1454–1463. [Google Scholar] [CrossRef]
- Devoogdt, N.; HassanzadehGhassabeh, G.; Zhang, J.; Zhang, J.; Brys, L.; De Baetselier, P.; Revets, H. Secretory leukocyte protease inhibitor promotes the tumorigenic and metastatic potential of cancer cells. Proc. Natl. Acad. Sci. USA 2003, 100, 5778–5782. [Google Scholar] [CrossRef]
- Israeli, O.; Goldring-Aviram, A.; Rienstein, S.; Ben-Baruch, G.; Korach, J.; Goldman, B.; Friedman, E. In silico chromosomal clustering of genes displaying altered expression patterns in ovarian cancer. Cancer Genet. Cytogenet. 2005, 160, 35–42. [Google Scholar] [CrossRef] [PubMed]
- Pye, D.A.; Vives, R.R.; Turnbull, J.E.; Hyde, P.; Gallagher, J.T. Heparan sulfate oligosaccharides require 6-O-sulphation for promotion of basic fibroblast growth factor mitogenic activity. J. Biol. Chem. 1998, 273, 22936–22942. [Google Scholar] [CrossRef] [PubMed]
- Hatabe, S.; Kimura, H.; Arao, T.; Kato, H.; Hayashi, H.; Nagai, T.; Matsumoto, K.; DE Velasco, M.; Fujita, Y.; Yamanouchi, G.; et al. Overexpression of heparan sulfate 6-O-sulfotransferase-2 in colorectal cancer. Mol. Clin. Oncol. 2013, 1, 845–850. [Google Scholar] [CrossRef] [PubMed]
- Backen, A.C.; Cole, C.L.; Lau, S.C.; Clamp, A.R.; McVey, R.; Gallagher, J.T.; Jayson, G.C. Heparansulphate synthetic and editing enzymes in ovarian cancer. Br. J. Cancer 2007, 96, 1544–1548. [Google Scholar] [CrossRef] [PubMed]
- Moll, F.; Katsaros, D.; Lazennec, G.; Hellio, N.; Roger, P.; Giacalone, P.L.; Chalbos, D.; Maudelonde, T.; Rochefort, H.; Pujol, P. Estrogen induction and overexpression of fibulin-1C mRNA in ovarian cancer cells. Oncogene 2002, 21, 1097–1107. [Google Scholar] [CrossRef] [PubMed]
- Hayashido, Y.; Lucas, A.; Rougeot, C.; Godyna, S.; Argraves, W.S.; Rochefort, H. Estradiol and fibulin-1 inhibit motility of human ovarian- and breast-cancer cells induced by fibronectin. Int. J. Cancer 1998, 75, 654–658. [Google Scholar] [CrossRef]
- Roger, P.; Pujol, P.; Lucas, A.; Baldet, P.; Rochefort, H. Increased immunostaining of fibulin-1, an estrogen-regulated protein in the stroma of human ovarian epithelial tumors. Am. J. Pathol. 1998, 53, 1579–1588. [Google Scholar] [CrossRef]
- Zhang, Y.; Xu, Y.; Ma, J. Adrenomedullin promotes angiogenesis in epithelial ovarian cancer through upregulating hypoxia-inducible factor-1α and vascular endothelial growth factor. Sci. Rep. 2017, 7, 40524. [Google Scholar] [CrossRef]
- Frede, S.; Freitag, P.; Otto, T.; Heilmaier, C.; Fandrey, J. The proinflammatory cytokine interleukin 1beta and hypoxia cooperatively induce the expression of adrenomedullin in ovarian carcinoma cells through hypoxia inducible factor 1 activation. Cancer Res. 2005, 65, 4690–4697. [Google Scholar] [CrossRef]
- Xiang, T.; Li, L.; Yin, X.; Yuan, C.; Tan, C.; Su, X.; Xiong, L.; Putti, T.C.; Oberst, M.; Kelly, K.; et al. The ubiquitin peptidase UCHL1 induces G0/G1 cell cycle arrest and apoptosis through stabilizing p53 and is frequently silenced in breast cancer. PLoS ONE 2012, 7, e29783. [Google Scholar] [CrossRef]
- Jin, C.; Yu, W.; Lou, X.; Zhou, F.; Han, X.; Zhao, N.; Lin, B. UCHL1 Is a Putative Tumor Suppressor in Ovarian Cancer Cells and Contributes to Cisplatin Resistance. J. Cancer 2013, 4, 662–670. [Google Scholar] [CrossRef] [PubMed]
- Okochi-Takada, E.; Nakazawa, K.; Wakabayashi, M.; Mori, A.; Ichimura, S.; Yasugi, T.; Ushijima, T. Silencing of the UCHL1 gene in human colorectal and ovarian cancers. Int. J. Cancer 2006, 119, 1338–1344. [Google Scholar] [CrossRef] [PubMed]
- Kratochvílová, K.; Horak, P.; Ešner, M.; Souček, K.; Pils, D.; Anees, M.; Tomasich, E.; Dráfi, F.; Jurtíková, V.; Hampl, A.; et al. Tumor suppressor candidate 3 (TUSC3) prevents the epithelial-to-mesenchymal transition and inhibits tumor growth by modulating the endoplasmic reticulum stress response in ovarian cancer cells. Int. J. Cancer 2015, 137, 1330–1340. [Google Scholar] [CrossRef]
- Suomela, S.; Cao, L.; Bowcock, A.; Saarialho-Kere, U. Interferon alpha-inducible protein 27 (IFI27) is upregulated in psoriatic skin and certain epithelial cancers. J. Investig. Dermatol. 2004, 122, 717–721. [Google Scholar] [CrossRef]
- Li, S.; Xie, Y.; Zhang, W.; Gao, J.; Wang, M.; Zheng, G.; Yin, X.; Xia, H.; Tao, X. Interferon alpha-inducible protein 27 promotes epithelial-mesenchymal transition and induces ovarian tumorigenicity and stemness. J. Surg. Res. 2015, 193, 255–264. [Google Scholar] [CrossRef] [PubMed]
- Lee, E.J.; Jo, M.; Rho, S.B.; Park, K.; Yoo, Y.N.; Park, J.; Chae, M.; Zhang, W.; Lee, J.H. Dkk3, downregulated in cervical cancer, functions as a negative regulator of beta-catenin. Int. J. Cancer 2009, 124, 287–297. [Google Scholar] [CrossRef] [PubMed]
- Yu, J.; Tao, Q.; Cheng, Y.Y.; Lee, K.Y.; Ng, S.S.; Cheung, K.F.; Tian, L.; Rha, S.Y.; Neumann, U.; Röcken, C.; et al. Promoter methylation of the Wnt/beta-catenin signaling antagonist Dkk-3 is associated with poor survival in gastric cancer. Cancer 2009, 115, 49–60. [Google Scholar] [CrossRef]
- You, A.; Fokas, E.; Wang, L.F.; He, H.; Kleb, B.; Niederacher, D.; Engenhart-Cabillic, R.; An, H.X. Expression of the Wnt antagonist DKK3 is frequently suppressed in sporadic epithelial ovarian cancer. J. Cancer Res. Clin. Oncol. 2011, 137, 621–627. [Google Scholar] [CrossRef]
- Spurdle, A.B.; Webb, P.M.; Purdie, D.M.; Chen, X.; Green, A.; Chenevix-Trench, G. Polymorphisms at the glutathione S-transferase GSTM1, GSTT1 and GSTP1 loci: Risk of ovarian cancer by histological subtype. Carcinogenesis 2001, 22, 67–72. [Google Scholar] [CrossRef]
- Oliveira, C.; Lourenço, G.J.; Sagarra, R.A.; Derchain, S.F.; Segalla, J.G.; Lima, C.S. Polymorphisms of glutathione S-transferase Mu 1 (GSTM1), Theta 1 (GSTT1), and Pi 1 (GSTP1) genes and epithelial ovarian cancer risk. Dis. Mark. 2012, 33, 155–159. [Google Scholar] [CrossRef]
- McFadyen, M.C.; Cruickshank, M.E.; Miller, I.D.; McLeod, H.L.; Melvin, W.T.; Haites, N.E.; Parkin, D.; Murray, G.I. Cytochrome P450 CYP1B1 over-expression in primary and metastatic ovarian cancer. Br. J. Cancer 2001, 85, 242–246. [Google Scholar] [CrossRef]
- Lancaster, J.M.; Brownlee, H.A.; Bell, D.A.; Futreal, P.A.; Marks, J.R.; Berchuck, A.; Wiseman, R.W.; Taylor, J.A. Microsomal epoxide hydrolase polymorphism as a risk factor for ovarian cancer. Mol. Carcinog. 1996, 17, 160–162. [Google Scholar] [CrossRef]
- Pongstaporn, W.; Rochanawutanon, M.; Wilailak, S.; Linasamita, V.; Weerakiat, S.; Petmitr, S. Genetic alterations in chromosome 10q24.3 and glutathione S-transferase omega 2 gene polymorphism in ovarian cancer. J. Exp. Clin. Cancer Res. 2006, 25, 107–114. [Google Scholar]
- Hetland, T.E.; Nymoen, D.A.; Emilsen, E.; Kærn, J.; Tropé, C.G.; Flørenes, V.A.; Davidson, B. MGST1 expression in serous ovarian carcinoma differs at various anatomic sites, but is unrelated to chemoresistance or survival. Gynecol. Oncol. 2012, 126, 460–465. [Google Scholar] [CrossRef] [PubMed]
- Ji, Q.; Chang, L.; VanDenBerg, D.; Stanczyk, F.Z.; Stolz, A. Selective reduction of AKR1C2 in prostate cancer and its role in DHT metabolism. Prostate 2003, 54, 275–289. [Google Scholar] [CrossRef]
- Sládek, N.E.; Kollander, R.; Sreerama, L.; Kiang, D.T. Cellular levels of aldehyde dehydrogenases (ALDH1A1 and ALDH3A1) as predictors of therapeutic responses to cyclophosphamide-based chemotherapy of breast cancer: A retrospective study. Rational individualization of oxazaphosphorine-based cancer chemotherapeutic regimens. Cancer Chemother. Pharmacol. 2002, 9, 309–321. [Google Scholar] [CrossRef]
- Carlini, L.E.; Meropol, N.J.; Bever, J.; Andria, M.L.; Hill, T.; Gold, P.; Rogatko, A.; Wang, H.; Blanchard, R.L. UGT1A7 and UGT1A9 polymorphisms predict response and toxicity in colorectal cancer patients treated with capecitabine/irinotecan. Clin. Cancer Res. 2005, 11, 1226–1236. [Google Scholar]
- Rae, J.M.; Drury, S.; Hayes, D.F.; Stearns, V.; Thibert, J.N.; Haynes, B.P.; Salter, J.; Sestak, I.; Cuzick, J.; Dowsett, M. CYP2D6 and UGT2B7 genotype and risk of recurrence in tamoxifen-treated breast cancer patients. J. Natl. Cancer Inst. 2012, 104, 452–460. [Google Scholar] [CrossRef] [PubMed]
- Kim, J.; Hu, Z.; Cai, L.; Li, K.; Choi, E.; Faubert, B.; Bezwada, D.; Rodriguez-Canales, J.; Villalobos, P.; Lin, Y.F.; et al. CPS1 maintains pyrimidine pools and DNA synthesis in KRAS/LKB1-mutant lung cancer cells. Nature 2017, 546, 168–172. [Google Scholar] [CrossRef] [PubMed]
- Kwon, A.Y.; Kim, G.I.; Jeong, J.Y.; Song, J.Y.; Kwack, K.B.; Lee, C.; Kang, H.Y.; Kim, T.H.; Heo, J.H.; An, H.J. VAV3 Overexpressed in Cancer Stem Cells Is a Poor Prognostic Indicator in Ovarian Cancer Patients. Stem Cells Dev. 2015, 24, 1521–1535. [Google Scholar] [CrossRef]
- Li, Y.; Nie, Y.; Cao, J.; Tu, S.; Lin, Y.; Du, Y.; Li, Y. G-A variant in miR-200c binding site of EFNA1 alters susceptibility to gastric cancer. Mol. Carcinog. 2014, 53, 219–229. [Google Scholar] [CrossRef] [PubMed]
- Lim, W.; Kim, H.S.; Jeong, W.; Ahn, S.E.; Kim, J.; Kim, Y.B.; Kim, M.A.; Kim, M.K.; Chung, H.H.; Song, Y.S.; et al. SERPINB3 in the chicken model of ovarian cancer: A prognostic factor for platinum resistance and survival in patients with epithelial ovarian cancer. PLoS ONE 2012, 7, e49869. [Google Scholar] [CrossRef]
- Toyama, A.; Suzuki, A.; Shimada, T.; Aoki, C.; Aoki, Y.; Umino, Y.; Nakamura, Y.; Aoki, D.; Sato, T.A. Proteomic characterization of ovarian cancers identifying annexin-A4, phosphoserine aminotransferase, cellular retinoic acid-binding protein 2, and serpin B5 as histology-specific biomarkers. Cancer Sci. 2012, 103, 747–755. [Google Scholar] [CrossRef] [PubMed]
- Sato, T.; Murakumo, Y.; Hagiwara, S.; Jijiwa, M.; Suzuki, C.; Yatabe, Y.; Takahashi, M. High-level expression of CD109 is frequently detected in lung squamous cell carcinomas. Pathol. Int. 2007, 57, 719–724. [Google Scholar] [CrossRef] [PubMed]
- Nelson, J.B.; Lee, W.H.; Nguyen, S.H.; Jarrard, D.F.; Brooks, J.D.; Magnuson, S.R.; Opgenorth, T.J.; Nelson, W.G.; Bova, G.S. Methylation of the 5’ CpG island of the endothelin B receptor gene is common in human prostate cancer. Cancer Res. 1997, 57, 35–37. [Google Scholar]
- Liang, S.; Yang, Z.; Li, D.; Miao, X.; Yang, L.; Zou, Q.; Yuan, Y. The Clinical and Pathological Significance of Nectin-2 and DDX3 Expression in Pancreatic Ductal Adenocarcinomas. Dis. Mark. 2015, 2015, 379568. [Google Scholar] [CrossRef] [PubMed]
- Karabulut, M.; Gunaldi, M.; Alis, H.; Afsar, C.U.; Karabulut, S.; Serilmez, M.; Akarsu, C.; Seyit, H.; Aykan, N.F. Serum nectin-2 levels are diagnostic and prognostic in patients with colorectal carcinoma. Clin. Transl. Oncol. 2016, 18, 160–171. [Google Scholar] [CrossRef] [PubMed]
- Oshima, T.; Sato, S.; Kato, J.; Ito, Y.; Watanabe, T.; Tsuji, I.; Hori, A.; Kurokawa, T.; Kokubo, T. Nectin-2 is a potential target for antibody therapy of breast and ovarian cancers. Mol. Cancer. 2013, 12, 60. [Google Scholar] [CrossRef]
- Ricciardelli, C.; Sakko, A.J.; Ween, M.P. The biological role and regulation of versican levels in cancer. Cancer Metastasis Rev. 2009, 28, 233–245. [Google Scholar] [CrossRef]
- Voutilainen, K.; Anttila, M.; Sillanpää, S.; Tammi, R.; Tammi, M.; Saarikoski, S.; Kosma, V.M. Versican in epithelial ovarian cancer: Relation to hyaluronan, clinicopathologic factors and prognosis. Int. J. Cancer 2003, 107, 359–364. [Google Scholar] [CrossRef]
- Menon, A.G.; Morreau, H.; Tollenaar, R.A.; Alphenaar, E.; Van Puijenbroek, M.; Putter, H.; Janssen-Van Rhijn, C.M.; Van De Velde, C.J.; Fleuren, G.J.; Kuppen, P.J. Down-regulation of HLA-A expression correlates with a better prognosis in colorectal cancer patients. Lab. Investig. 2002, 82, 1725–1733. [Google Scholar] [CrossRef] [PubMed]
- Kurozumi, A.; Goto, Y.; Matsushita, R.; Fukumoto, I.; Kato, M.; Nishikawa, R.; Sakamoto, S.; Enokida, H.; Nakagawa, M.; Ichikawa, T.; et al. Tumor-suppressive microRNA-223 inhibits cancer cell migration and invasion by targeting ITGA3/ITGB1 signaling in prostate cancer. Cancer Sci. 2016, 107, 84–94. [Google Scholar] [CrossRef] [PubMed]
- Lee, J.; Warnken, U.; Schnölzer, M. A new method for detection of tumor driver-dependent changes of protein sialylation in a colon cancer cell line reveals nectin-3 as TGFBR2 target. Protein Sci. 2015, 24, 1686–1694. [Google Scholar] [CrossRef]
- De Wever, O.; Nguyen, Q.D.; Van Hoorde, L.; Bracke, M.; Bruyneel, E.; Gespach, C.; Mareel, M. Tenascin-C and SF/HGF produced by myofibroblasts in vitro provide convergent pro-invasive signals to human colon cancer cells through RhoA and Rac. FASEB J. 2004, 18, 1016–1018. [Google Scholar] [CrossRef] [PubMed]
- Didem, T.; Faruk, T.; Senem, K.; Derya, D.; Murat, S.; Murat, G.; Oznur, K. Clinical significance of serum tenascin-c levels in epithelial ovarian cancer. Tumor Biol. 2014, 35, 6777–6782. [Google Scholar] [CrossRef] [PubMed]
- Waalkes, S.; Atschekzei, F.; Kramer, M.W.; Hennenlotter, J.; Vetter, G.; Becker, J.U.; Stenzl, A.; Merseburger, A.S.; Schrader, A.J.; Kuczyk, M.A.; et al. Fibronectin 1 mRNA expression correlates with advanced disease in renal cancer. BMC Cancer 2010, 10, 503. [Google Scholar] [CrossRef] [PubMed]
- Sherman-Baust, C.A.; Weeraratna, A.T.; Rangel, L.B.; Pizer, E.S.; Cho, K.R.; Schwartz, D.R.; Shock, T.; Morin, P.J. Remodeling of the extracellular matrix through overexpression of collagen VI contributes to cisplatin resistance in ovarian cancer cells. Cancer Cell. 2003, 3, 377–386. [Google Scholar] [CrossRef]
- Wang, Z.; Liu, Y.; Lu, L.; Yang, L.; Yin, S.; Wang, Y.; Qi, Z.; Meng, J.; Zang, R.; Yang, G. Fibrillin -1, induced by Aurora-A but inhibited by BRCA2, promotes ovarian cancer metastasis. Oncotarget 2015, 6, 6670–6683. [Google Scholar] [CrossRef]
- Sarhanis, P.; Redman, C.; Perrett, C.; Brannigan, K.; Clayton, R.N.; Hand, P.; Musgrove, C.; Suarez, V.; Jones, P.; Fryer, A.A.; et al. Epithelial ovarian cancer: Influence of polymorphism at the glutathione S-transferase GSTM1 and GSTT1 loci on p53 expression. Br. J. Cancer 1996, 74, 1757–1761. [Google Scholar] [CrossRef][Green Version]
- Bell, D.A.; Taylor, J.A.; Paulson, D.F.; Robertson, C.N.; Mohler, J.L.; Lucier, G.W. Genetic risk and carcinogen exposure: A common inherited defect of the carcinogen-metabolism gene glutathione S-transferase M1 (GSTM1) that increases susceptibility to bladder cancer. J. Natl. Cancer Inst. 1993, 85, 1159–1164. [Google Scholar] [CrossRef]
- Gates, M.A.; Tworoger, S.S.; Terry, K.L.; Titus-Ernstoff, L.; Rosner, B.; De Vivo, I.; Cramer, D.W.; Hankinson, S.E. Talc use, variants of the GSTM1, GSTT1, and NAT2 genes, and risk of epithelial ovarian cancer. Cancer Epidemiol. Prev. Biomark. 2008, 17, 2436–2444. [Google Scholar] [CrossRef] [PubMed]
- Lai, D.; Ho, K.C.; Hao, Y.; Yang, X. Taxol resistance in breast cancer cells is mediated by the hippo pathway component TAZ and its downstream transcriptional targets Cyr61 and CTGF. Cancer Res. 2011, 71, 2728–2738. [Google Scholar] [CrossRef] [PubMed]
- Kikuchi, R.; Tsuda, H.; Kanai, Y.; Kasamatsu, T.; Sengoku, K.; Hirohashi, S.; Inazawa, J.; Imoto, I. Promoter hypermethylation contributes to frequent inactivation of a putative conditional tumor suppressor gene connective tissue growth factor in ovarian cancer. Cancer Res. 2007, 67, 7095–7105. [Google Scholar] [CrossRef] [PubMed]
- Fridell, Y.W.; Villa, J.; Attar, E.C.; Attar, E.C.; Liu, E.T. GAS6 induces Axl-mediated chemotaxis of vascular smooth muscle cells. J. Biol. Chem. 1998, 273, 7123–7126. [Google Scholar] [CrossRef] [PubMed]
- Sun, W.; Fujimoto, J.; Tamaya, T. Coexpression of Gas6/Axl in human ovarian cancers. Oncology 2004, 66, 450–457. [Google Scholar] [CrossRef] [PubMed]
- Chen, D.; Yoo, B.K.; Santhekadur, P.K.; Gredler, R.; Bhutia, S.K.; Das, S.K.; Fuller, C.; Su, Z.Z.; Fisher, P.B.; Sarkar, D. Insulin-like growth factor-binding protein-7 functions as a potential tumor suppressor in hepatocellular carcinoma. Clin. Cancer Res. 2011, 17, 6693–6701. [Google Scholar] [CrossRef]
- Gambaro, K.; Quinn, M.C.; Cáceres-Gorriti, K.Y.; Shapiro, R.S.; Provencher, D.; Rahimi, K.; Mes-Masson, A.M.; Tonin, P.N. Low levels of IGFBP7 expression in high-grade serous ovarian carcinoma is associated with patient outcome. BMC Cancer 2015, 15, 135. [Google Scholar] [CrossRef]
- Soki, F.N.; Koh, A.J.; Jones, J.D. Polarization of prostate cancer-associated macrophages is induced by milk fat globule-EGF factor 8 (MFG-E8)-mediated efferocytosis. J. Biol. Chem. 2014, 289, 24560–24572. [Google Scholar] [CrossRef]
- Tibaldi, L.; Leyman, S.; Nicolas, A.; Notebaert, S.; Dewulf, M.; Ngo, T.H.; Zuany-Amorim, C.; Amzallag, N.; Bernard-Pierrot, I.; Sastre-Garau, X.; et al. New blocking antibodies impede adhesion, migration and survival of ovarian cancer cells, highlighting MFGE8 as a potential therapeutic target of human ovarian carcinoma. PLoS ONE 2013, 8, e72708. [Google Scholar] [CrossRef]
- Guan, H.; Wei, G.; Wu, J.; Fang, D.; Liao, Z.; Xiao, H.; Li, M.; Li, Y. Down-regulation of miR-218-2 and its host gene SLIT3 cooperate to promote invasion and progression of thyroid cancer. J. Clin. Endocrinol. Metab. 2013, 98, E1334–E1344. [Google Scholar] [CrossRef]
- Lal, G.; Hashimi, S.; Smith, B.J.; Lynch, C.F.; Zhang, L.; Robinson, R.A.; Weigel, R.J. Extracellular matrix 1 (ECM1) expression is a novel prognostic marker for poor long-term survival in breast cancer: A Hospital-based Cohort Study in Iowa. Ann. Surg. Oncol. 2009, 16, 2280–2287. [Google Scholar] [CrossRef]
- Hwang, S.L.; Lieu, A.S.; Chang, J.H.; Cheng, T.S.; Cheng, C.Y.; Lee, K.S.; Lin, C.L.; Howng, S.L.; Hong, Y.R. Rac2 expression and mutation in human brain tumors. Acta Neurochir. 2005, 147, 551–554. [Google Scholar] [CrossRef]
- Bey, E.A.; Bentle, M.S.; Reinicke, K.E.; Dong, Y.; Yang, C.R.; Girard, L.; Minna, J.D.; Bornmann, W.G.; Gao, J.; Boothman, D.A. An NQO1- and PARP-1-mediated cell death pathway induced in non-small-cell lung cancer cells by beta-lapachone. Proc. Natl. Acad. Sci. USA 2007, 104, 11832–11837. [Google Scholar] [CrossRef] [PubMed]
- Olson, S.H.; Carlson, M.D.; Ostrer, H.; Harlap, S.; Stone, A.; Winters, M.; Ambrosone, C.B. Genetic variants in SOD2, MPO, and NQO1, and risk of ovarian cancer. Gynecol. Oncol. 2004, 93, 615–620. [Google Scholar] [CrossRef] [PubMed]
- Cai, S.; Zhang, P.; Dong, S.; Li, L.; Cai, J.; Xu, M. Downregulation of SPINK13 Promotes Metastasis by Regulating uPA in Ovarian Cancer Cells. Cell. Physiol. Biochem. 2018, 45, 1061–1071. [Google Scholar] [CrossRef]
- Hwang, S.; Kim, H.E.; Min, M.; Raghunathan, R.; Panova, I.P.; Munshi, R.; Ryu, B. Epigenetic Silencing of SPINT2 Promotes Cancer Cell Motility via HGF-MET Pathway Activation in Melanoma. J. Investig. Dermatol. 2015, 135, 2283–2291. [Google Scholar] [CrossRef]
- Chiyomaru, T.; Enokida, H.; Tatarano, S.; Kawahara, K.; Uchida, Y.; Nishiyama, K.; Fujimura, L.; Kikkawa, N.; Seki, N.; Nakagawa, M. miR-145 and miR-133a function as tumour suppressors and directly regulate FSCN1 expression in bladder cancer. Br. J. Cancer 2010, 102, 883–891. [Google Scholar] [CrossRef]
- Hanker, L.C.; Karn, T.; Holtrich, U.; Graeser, M.; Becker, S.; Reinhard, J.; Ruckhäberle, E.; Gevensleben, H.; Rody, A. Prognostic impact of fascin-1 (FSCN1) in epithelial ovarian cancer. Anticancer Res. 2013, 33, 371–377. [Google Scholar]
- Karapetsas, A.; Giannakakis, A.; Dangaj, D.; Lanitis, E.; Kynigopoulos, S.; Lambropoulou, M.; Tanyi, J.L.; Galanis, A.; Kakolyris, S.; Trypsianis, G.; et al. Overexpression of GPC6 and TMEM132D in Early Stage Ovarian Cancer Correlates with CD8+ T-Lymphocyte Infiltration and Increased Patient Survival. Biomed. Res. Int. 2015, 2015, 712438. [Google Scholar] [CrossRef]
- Satelli, A.; Rao, U.S. Galectin-1 is silenced by promoter hypermethylation and its re-expression induces apoptosis in human colorectal cancer cells. Cancer Lett. 2011, 301, 38–46. [Google Scholar] [CrossRef] [PubMed]
- Khaleel, S.S.; Andrews, E.H.; Ung, M.; DiRenzo, J.; Cheng, C. E2F4 regulatory program predicts patient survival prognosis in breast cancer. Breast Cancer Res. 2014, 16, 486. [Google Scholar] [CrossRef]
- Richards, F.M.; McKee, S.A.; Rajpar, M.H.; Cole, T.R.; Evans, D.G.; Jankowski, J.A.; McKeown, C.; Sanders, D.S.; Maher, E.R. Germline E-cadherin gene (CDH1) mutations predispose to familial gastric cancer and colorectal cancer. Hum. Mol. Genet. 1999, 8, 607–610. [Google Scholar] [CrossRef] [PubMed]
- Kuusisto, K.M.; Bebel, A.; Vihinen, M.; Schleutker, J.; Sallinen, S.L. Screening for BRCA1, BRCA2, CHEK2, PALB2, BRIP1, RAD50, and CDH1 mutations in high-risk Finnish BRCA1/2-founder mutation-negative breast and/or ovarian cancer individuals. Breast Cancer Res. 2011, 13, R20. [Google Scholar] [CrossRef] [PubMed]
- Kikuchi, J.; Kinoshita, I.; Shimizu, Y.; Kikuchi, E.; Takeda, K.; Aburatani, H.; Oizumi, S.; Konishi, J.; Kaga, K.; Matsuno, Y.; et al. Minichromosome maintenance (MCM) protein 4 as a marker for proliferation and its clinical and clinicopathological significance in non-small cell lung cancer. Lung Cancer 2011, 72, 229–237. [Google Scholar] [CrossRef]
- Sagara, N.; Katoh, M.; Mitomycin, C. resistance induced by TCF-3 overexpression in gastric cancer cell line MKN28 is associated with DT-diaphorase down-regulation. Cancer Res. 2000, 60, 5959–5962. [Google Scholar] [PubMed]
- Aman, P.; Pejovic, T.; Wennborg, A.; Heim, S.; Mitelman, F. Mapping of the 19p13 breakpoint in an ovarian carcinoma between the INSR and TCF3 loci. Genes Chromosomes Cancer 1993, 8, 134–136. [Google Scholar] [CrossRef] [PubMed]
- Hou, A.; Zhao, L.; Zhao, F.; Wang, W.; Niu, J.; Li, B.; Zhou, Z.; Zhu, D. Expression of MECOM is associated with unfavorable prognosis in glioblastoma multiforme. Onco Targets Ther. 2016, 9, 315–320. [Google Scholar] [CrossRef]
- Nanjundan, M.; Nakayama, Y.; Cheng, K.W.; Lahad, J.; Liu, J.; Lu, K.; Kuo, W.L.; Smith-McCune, K.; Fishman, D.; Gray, J.W.; et al. Amplification of MDS1/EVI1 and EVI1, located in the 3q26.2 amplicon, is associated with favorable patient prognosis in ovarian cancer. Cancer Res. 2007, 67, 3074–3084. [Google Scholar] [CrossRef]
- Grasso, S.; Tristante, E.; Saceda, M.; Carbonell, P.; Mayor-López, L.; Carballo-Santana, M.; Carrasco-García, E.; Rocamora-Reverte, L.; García-Morales, P.; Carballo, F.; et al. Resistance to Selumetinib (AZD6244) in colorectal cancer cell lines is mediated by p70S6K and RPS6 activation. Neoplasia 2014, 16, 845–860. [Google Scholar] [CrossRef]
- Bock, A.J.; Nymoen, D.A.; Brenne, K.; Kærn, J.; Davidson, B. SCARA3 mRNA is over expressed in ovarian carcinoma compared with breast carcinoma effusions. Hum. Pathol. 2012, 43, 669–674. [Google Scholar] [CrossRef] [PubMed]
- Kulkarni, G.; Turbin, D.A.; Amiri, A.; Jeganathan, S.; Andrade-Navarro, M.A.; Wu, T.D.; Huntsman, D.G.; Lee, J.M. Expression of protein elongation factor eEF1A2 predicts favorable outcome in breast cancer. Breast Cancer Res. Treat. 2007, 102, 31–41. [Google Scholar] [CrossRef] [PubMed]
- Pinke, D.E.; Kalloger, S.E.; Francetic, T.; Huntsman, D.G.; Lee, J.M. The prognostic significance of elongation factor eEF1A2 in ovarian cancer. Gynecol. Oncol. 2008, 108, 561–568. [Google Scholar] [CrossRef] [PubMed]
- Narla, G.; Heath, K.E.; Reeves, H.L.; Li, D.; Giono, L.E.; Kimmelman, A.C.; Glucksman, M.J.; Narla, J.; Eng, F.J.; Chan, A.M.; et al. KLF6, a candidate tumor suppressor gene mutated in prostate cancer. Science 2001, 294, 2563–2566. [Google Scholar] [CrossRef]
- DiFeo, A.; Narla, G.; Hirshfeld, J.; Camacho-Vanegas, O.; Narla, J.; Rose, S.L.; Kalir, T.; Yao, S.; Levine, A.; Birrer, M.J.; et al. Roles of KLF6 and KLF6-SV1 in ovarian cancer progression and intraperitoneal dissemination. Clin. Cancer Res. 2006, 12, 3730–3739. [Google Scholar] [CrossRef] [PubMed]
- Quigley, D.A.; Fiorito, E.; Nord, S.; Van Loo, P.; Alnæs, G.G.; Fleischer, T.; Tost, J.; Moen Vollan, H.K.; Tramm, T.; Overgaard, J.; et al. The 5p12 breast cancer susceptibility locus affects MRPS30 expression in estrogen-receptor positive tumors. Mol. Oncol. 2014, 8, 273–284. [Google Scholar] [CrossRef] [PubMed]
© 2019 by the authors. Licensee MDPI, Basel, Switzerland. This article is an open access article distributed under the terms and conditions of the Creative Commons Attribution (CC BY) license (http://creativecommons.org/licenses/by/4.0/).

