Abstract
Acute cardiac rejection remains a significant challenge in the post-transplant period, necessitating meticulous monitoring and timely intervention to prevent graft failure. Thus, the goal of the present study was to identify novel biomarkers involved in acute cardiac rejection, paving the way for personalized diagnostic, preventive, and treatment strategies. A total of 809 differentially expressed genes were identified in the GSE150059 dataset. We intersected genes selected by analysis of variance, recursive feature elimination, least absolute shrinkage and selection operator, and random forest classifier to identify the most relevant genes involved in acute cardiac rejection. Thus, HCP5, KLRD1, GZMB, PLA1A, GNLY, and KLRB1 were used to train eight machine learning models: random forest, logistic regression, decision trees, support vector machines, gradient boosting machines, K-nearest neighbors, XGBoost, and neural networks. Models were trained, tested, and validated on the GSE150059 dataset (MMDx-based diagnosis of rejection). Eight algorithms achieved great performance in predicting acute cardiac rejection. However, all machine learning models demonstrated poor performance in two external validation sets that had rejection diagnosis based on histology: merged GSE2596 and GSE4470 dataset and GSE9377 dataset, thus highlighting differences between these two methods. According to SHAP and LIME, KLRD1 and HCP5 were the most impactful genes.
1. Introduction
Heart transplantation is a lifesaving intervention in the setting of end-stage heart disease, such as heart failure [1]. Despite gradual improvement in 1-year survival rates for cardiac transplantation, acute cardiac allograft rejection remains a significant challenge in the post-transplant period, necessitating meticulous monitoring and timely intervention to prevent graft failure [2,3]. Discovering biomarkers crucial in cardiac rejection may aid in the development of targeted therapies and improve heart transplantation outcomes. Allograft rejection involves both antibody and T cell responses [4]. Cytotoxic T lymphocytes and natural killer (NK) cells play a pivotal role in the immune response including in organ transplantation [5,6]. They contribute to allograft rejection by releasing perforin and granzymes as part of their cytotoxic mechanisms [7]. Numerous genes modulate antibody responses and T cell function, thereby impacting allograft rejection. For instance, genes encoding major histocompatibility complex (MHC) molecules, such as human leukocyte antigen (HLA) genes, play a central role in antigen presentation to T cells and are important determinants of graft survival [8,9]. Moreover, genes encoding co-stimulatory molecules (e.g., CD40) and adhesion molecules (e.g., ICAM-1) regulate T cell activation and migration [10,11]. Specific receptor genes, such as killer cell lectin-like receptors (KLRs) expressed on NK cells, can interact with MHC class I molecules on target cells to regulate NK cell activity and contribute to allograft rejection [12].
The advent of molecular diagnostics, namely the Molecular Microscope Diagnostic System® (MMDx), has revolutionized the assessment of allograft rejection through comprehensive analysis of gene expression profiles in transplanted organs [13]. MMDx provides novel insights into the understanding of rejection states [14]. In parallel, machine learning algorithms present an incredibly powerful method to identify patterns from large, complex, and assorted data, such as gene expression data. Machine learning is widely used for predictive modeling in numerous fields and has been shown to outperform conventional statistical analysis tools in various settings [15,16]. Machine learning algorithms have shown enormous potential to open new frontiers with great prospects for personalized medicine [17]. By analyzing high-dimensional datasets, machine learning algorithms can identify molecular signatures indicative of rejection, which, in turn, may improve transplant outcomes by facilitating timely diagnosis and prompt treatment [18]. By integrating MMDx data with state-of-the-art machine learning algorithms, our objective was to develop a predictive model capable of accurately identifying acute rejection in heart transplant recipients. Moreover, through comprehensive analysis of gene expression profiles, we aimed to identify novel biomarkers and molecular pathways involved in cardiac rejection, paving the way for personalized diagnostic, preventive, and treatment strategies.
2. Materials and Methods
2.1. Selection Criteria
The gene expression omnibus (GEO) database was searched for “cardiac rejection OR heart rejection” from inception until 14 January 2024. Inclusion criteria were as follows: GEO series, expression profiling by array, human endomyocardial biopsy, datasets containing acute cardiac rejection and non-rejection samples, and at least 20 samples in a dataset. Five datasets were identified: GSE2596, GSE4470, GSE9377, GSE124897, and GSE150059. GSE124897 was excluded as all samples from it can be found in GSE150059.
GSE150059 (GPL16043 platform) contains 1320 samples: 853 with and 467 without acute cardiac rejection. The diagnosis of each sample within the GSE150059 dataset was based on MMDx, whereas histologic diagnosis was provided in GSE2596, GSE4470, and GSE9377. GSE2596 and GSE4470 share the same platform—GPL1053. The former dataset contains 63 samples (including 11 replicates): 35 stable samples and 21 rejected samples. Seven samples did not have a clear histologic diagnosis and were therefore excluded. GSE4470 contains 15 rejection and 12 non-rejection samples with one and two replicates, respectively. Finally, GSE9377 (GPL887 platform) consists of 9 stable and 17 rejected grafts. Detailed information regarding each dataset is provided in Table 1.

Table 1.
Datasets used in this study.
2.2. Data Preprocessing
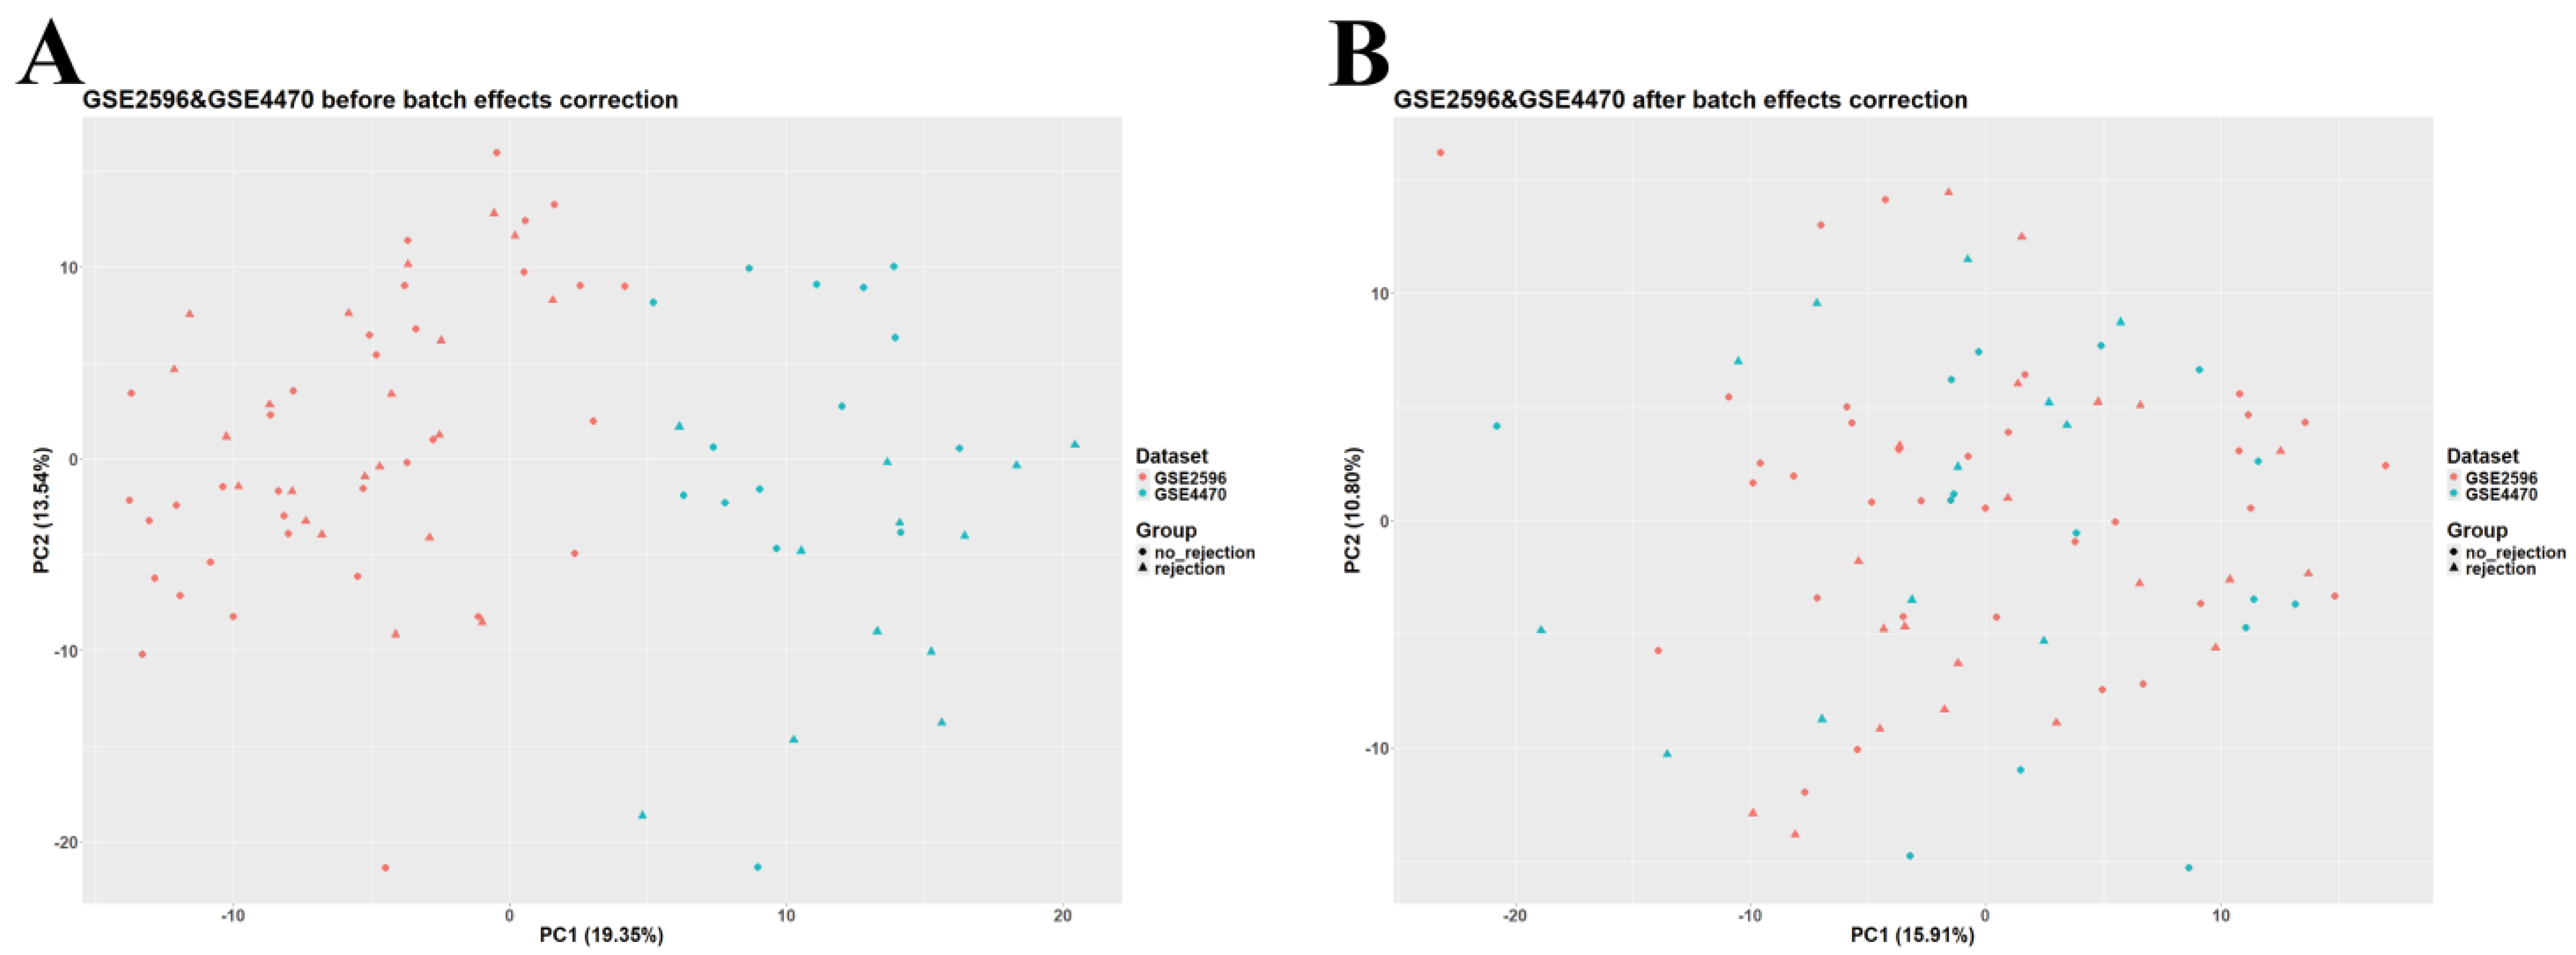
Data analysis and preprocessing were carried out in RStudio v2023.12.1 (R version 4.3.2, Bioconductor version 3.18). The GEOquery package (version 2.70.0) was utilized to download normalized GSE2596, GSE4470, GSE9377, and GSE150059 datasets. Given the large sample size of GSE150059 and the differences among datasets in terms of diagnostic methods, GSE150059 was selected as a discovery set and used for further analysis, whereas the other datasets were used as external validation sets. GSE2596 and GSE4470 were merged as they are biologically and technologically similar. ggplot2 (version 3.4.4) was employed to construct a principal component analysis (PCA) plot to assess the presence of batch effects. The ‘removeBatchEffect’ function (available in the limma package, version 3.58.1) was used to adjust for batch effects in the merged dataset (Figure 1). The merged GSE2596 and GSE4470 dataset was used as the first external validation set, and GSE9377 was used as the second external validation set. Gene annotation in all datasets was carried out using information obtained from their corresponding platforms. Rows containing unspecific probes or probes not corresponding to any gene symbols were deleted; rows with duplicated gene symbols were merged, and a median was calculated.
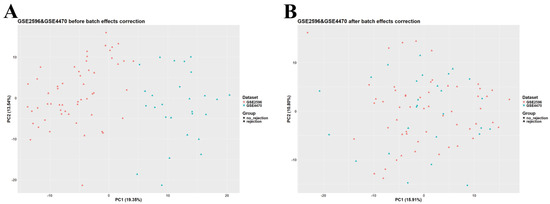
Figure 1.
Principal component analysis (PCA) scatter plot of the merged dataset (GSE2596 and GSE4470). (A) Before adjusting for batch effects. (B) After adjusting for batch effects.
2.3. Identification of Differentially Expressed Genes
limma was used to identify differentially expressed genes (DEGs). First, a linear model was built (‘lmFit’ function, default arguments), then the ‘eBayes’ function was employed to calculate empirical Bayes statistics (robust limma-trend method). Results were extracted using the ‘topTable’ function and were adjusted by the Benjamini–Hochberg procedure. The cutoff values were as follows: |logFC| > mean(logFC) + 2SD(logFC) and adjusted p-value < 0.05. Thus, DEGs with logFC > 0.4497 were considered upregulated, and DEGs with logFC < −0.4497 were considered downregulated. Volcano plots and heatmaps were created using the EnhancedVolcano (version 1.20.0) and pheatmap (version 1.0.12) packages.
2.4. Enrichment Aanalysis
org.Hs.eg.db (version 3.18.0) and clusterProfiler (version 4.10.0) were used to carry out Gene Ontology (GO) analysis to explore biological processes of upregulated and downregulated DEGs involved in acute cardiac allograft rejection. Kyoto Encyclopedia of Genes and Genomes (KEGG) enrichment analysis was also performed. p-value < 0.05 was considered statistically significant. ggplot2 was utilized to construct the necessary plots.
2.5. Data Preprocessing for Machine Learning Analysis
Machine learning analysis was conducted in Python. GSE150059 was randomly split into a training set (70%), test set (15%), and internal validation set (15%). To ensure consistency in model training and validation, the features present in both the training and external validation datasets were aligned. This alignment guarantees that the models are trained and evaluated on an identical set of features, which is essential for accurate model performance assessment. Missing data points in datasets were addressed by employing Scikit-Learn’s SimpleImputer with a ‘median’ strategy to impute missing values. This approach ensures that the dataset is complete, allowing for effective model training and validation. The final preprocessing step involved scaling the features to have a mean of zero and a standard deviation of one, which was performed using Scikit-Learn’s StandardScaler transformer.
2.6. Feature Selection
In the pursuit of identifying candidate genes for heart transplant outcomes, various feature selection techniques were applied, each with its unique approach to isolating the most relevant features from the gene expression data. The following feature selection techniques were utilized:
- Analysis of variance (ANOVA) was leveraged to pinpoint the top 100 genes with significant expression differences between conditions, using SelectKBest with the f_classif score function. This approach narrows down the feature space to those most impactful for the analysis;
- Recursive feature elimination (RFE), through RFECV, combined with logistic regression and cross-validation (StratifiedKFold), dynamically identifies an optimal subset of features. Unlike traditional RFE which requires a predefined feature count, RFECV automatically determines the best number of features by maximizing cross-validation accuracy, making the selection process more data-driven;
- The least absolute shrinkage and selection operator (LASSO), applied via LassoCV, optimizes feature selection alongside model training by identifying non-zero coefficient features through cross-validation. This method effectively reduces the feature set to those most predictive of outcomes without pre-specifying a feature count;
- Random forest classifier (RFC) assesses feature importance after being trained with 50 trees. The optimal number of trees is found by using GridSearchCV. SelectFromModel with a ‘mean’ importance threshold is then used to filter the most significant features, allowing the model to concentrate on variables with the greatest impact on transplant outcomes.
2.7. Machine Learning Algorithms
Overlapping genes selected by feature selection tools were used to train the machine learning models. The models tested include logistic regression (LR), support vector machines (SVM), random forest (RF), gradient boosting machines (GBM), K-nearest neighbors (KNN), XGBoost, decision trees (DT), and neural networks (using the MLPclassifier in Scikit-Learn). Each model was evaluated on its ability to utilize the gene expression profiles for outcome prediction, with a focus on identifying the most effective model or combination of models. For each model, Scikit-Learn’s GridSearchCV was applied to explore a wide range of hyperparameters, identifying the combination that yields the best performance. The following metrics were used to provide insights into various aspects of model performance: accuracy, precision, recall (sensitivity), F1 score, Matthew’s correlation coefficient (MCC), area under the receiver operating characteristic curve (AUC), and area under the precision–recall curve (AUPRC) [19,20].
To ensure the generalizability and robustness of the models, a rigorous validation approach was employed, comprising both cross-validation and internal validation. Specifically, k-fold cross-validation was utilized, dividing the dataset into five smaller sets, training the model on four folds, and validating it on the remaining one, repetitively cycling through all folds.
2.8. Model Interpretation
To understand the impact of selected gene features on model predictions and the biological relevance of these genes in heart transplant outcomes, interpretation frameworks such as SHapley Additive exPlanations (SHAP) and Local Interpretable Model-agnostic Explanations (LIME) were used. SHAP provides insights into how each feature contributes to the model’s prediction for an individual sample, and LIME offers explanations for model predictions on individual instances, facilitating understanding of model behavior in specific cases.
3. Results
3.1. Identification of DEGs and Enrichment Analysis
After preprocessing, there were 19,042 genes in the GSE150059 dataset, 11,849 genes in the merged GSE2596 and GSE4470 dataset, and 16,546 genes in the GSE9377 dataset. As MMDx was used to diagnose acute cardiac rejection in GSE150059 and the rejection status of samples in the other datasets was based on histologic examination, GSE150059 was used to conduct differential expression analysis as well as GO and KEGG enrichment analyses, whereas the other datasets were used as external validation sets.
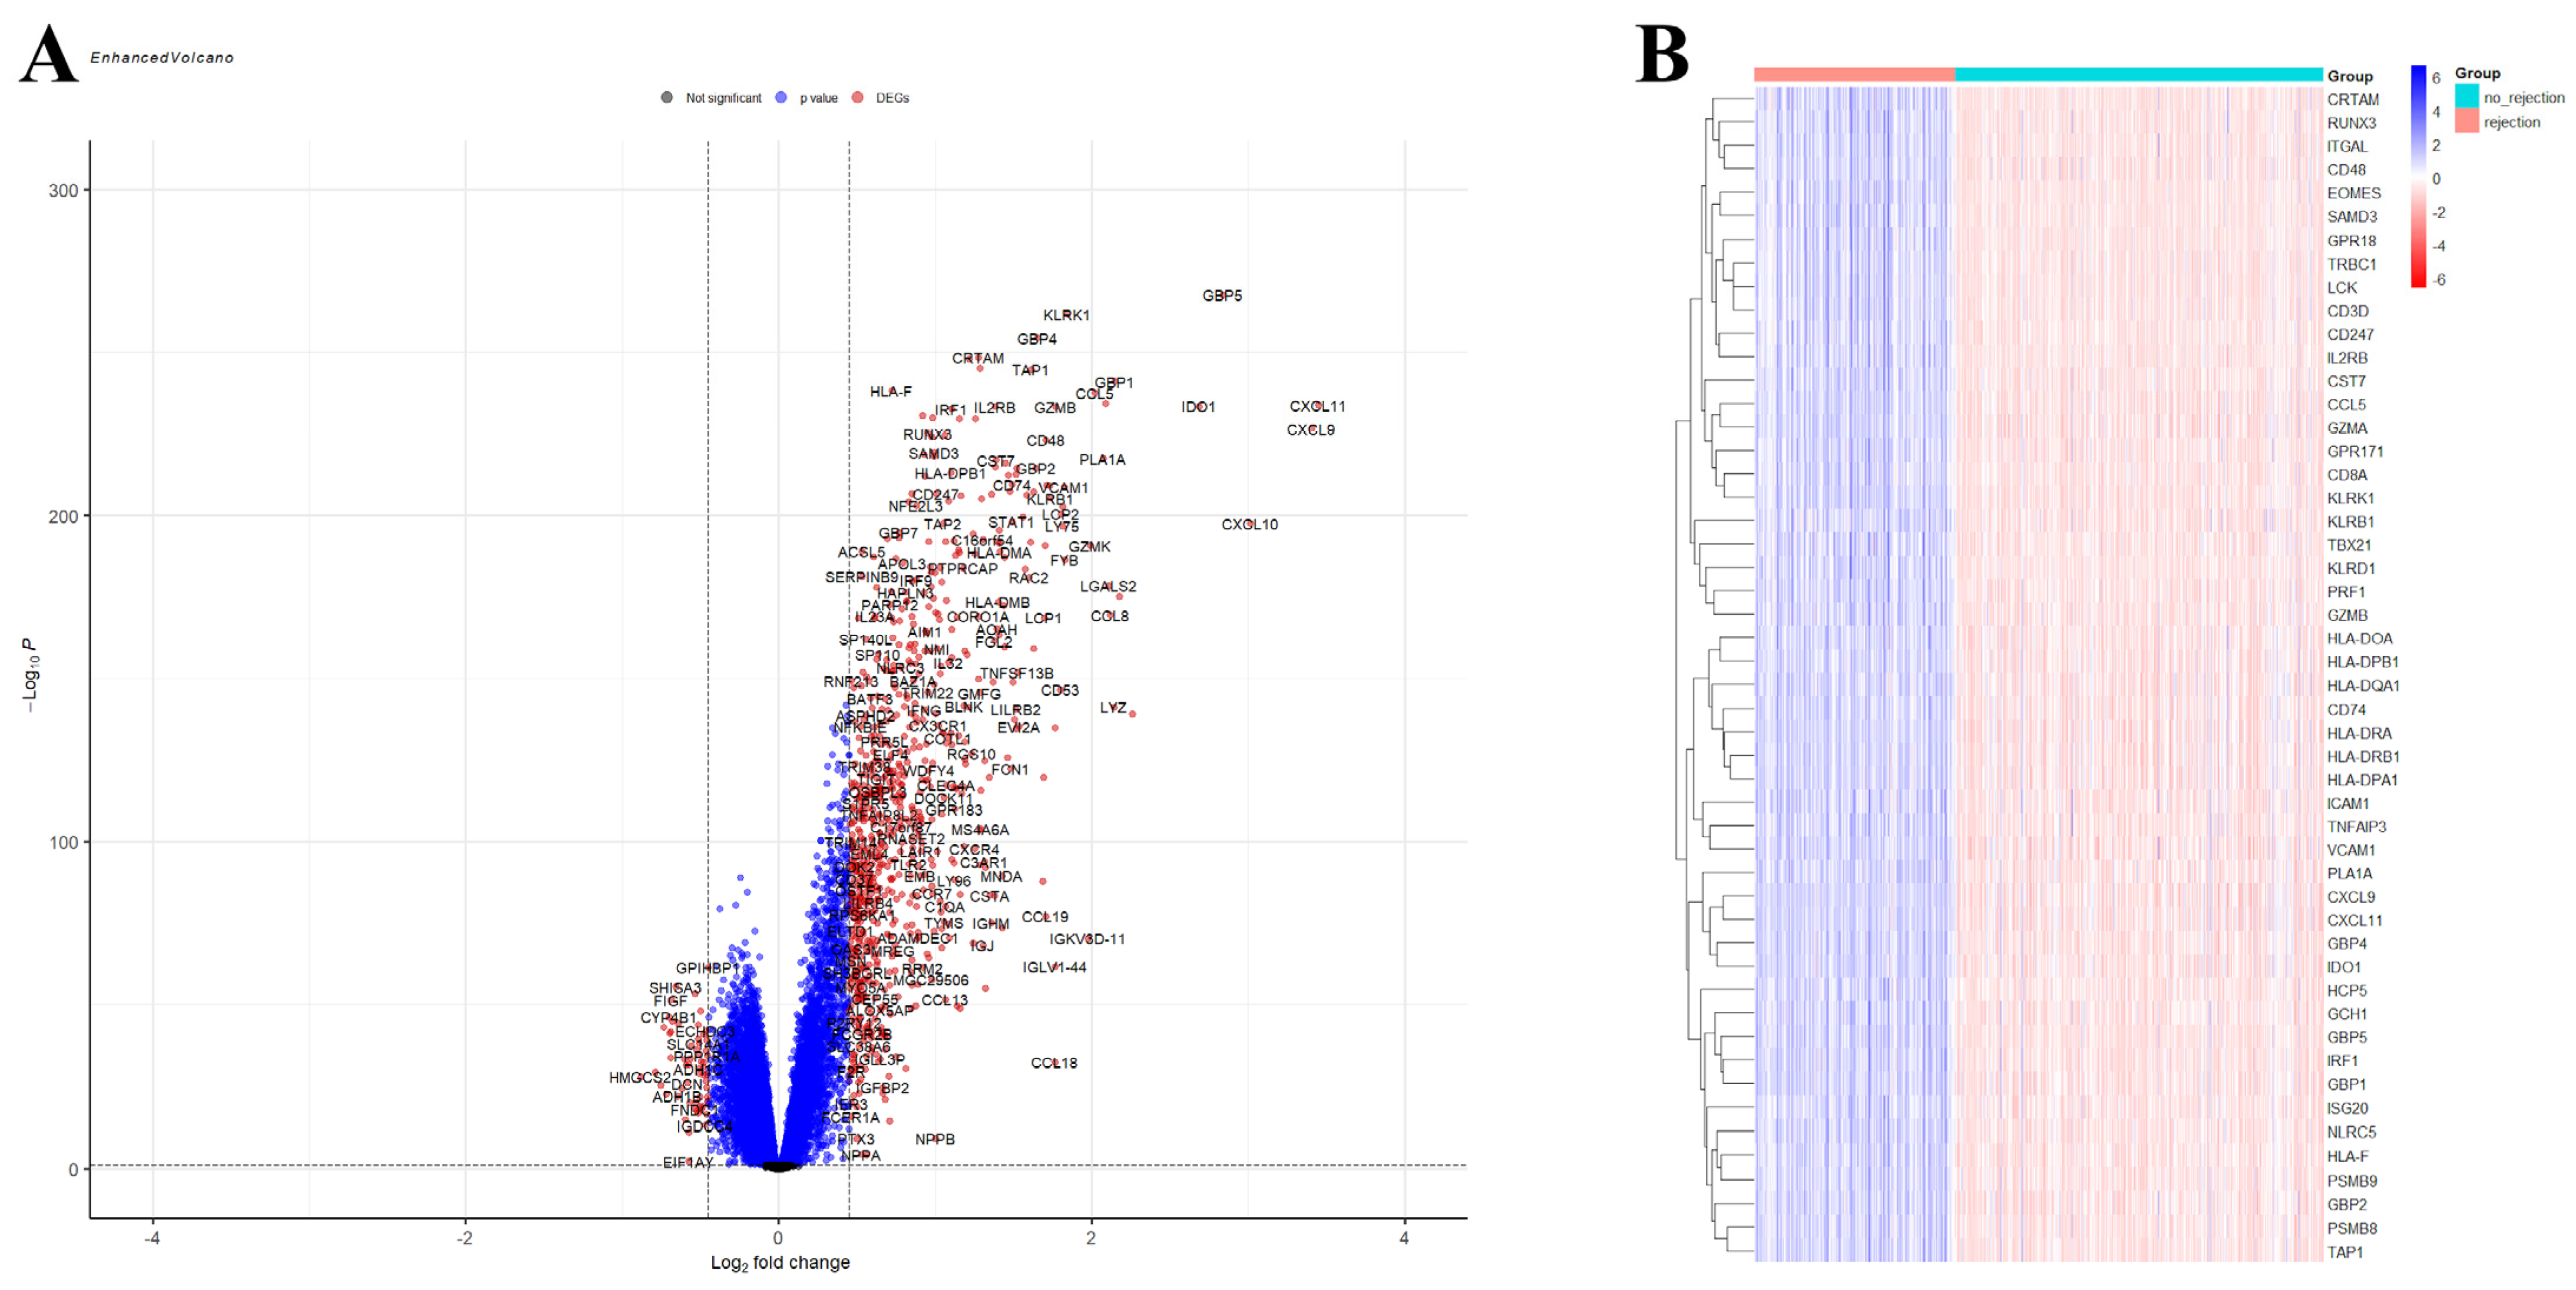
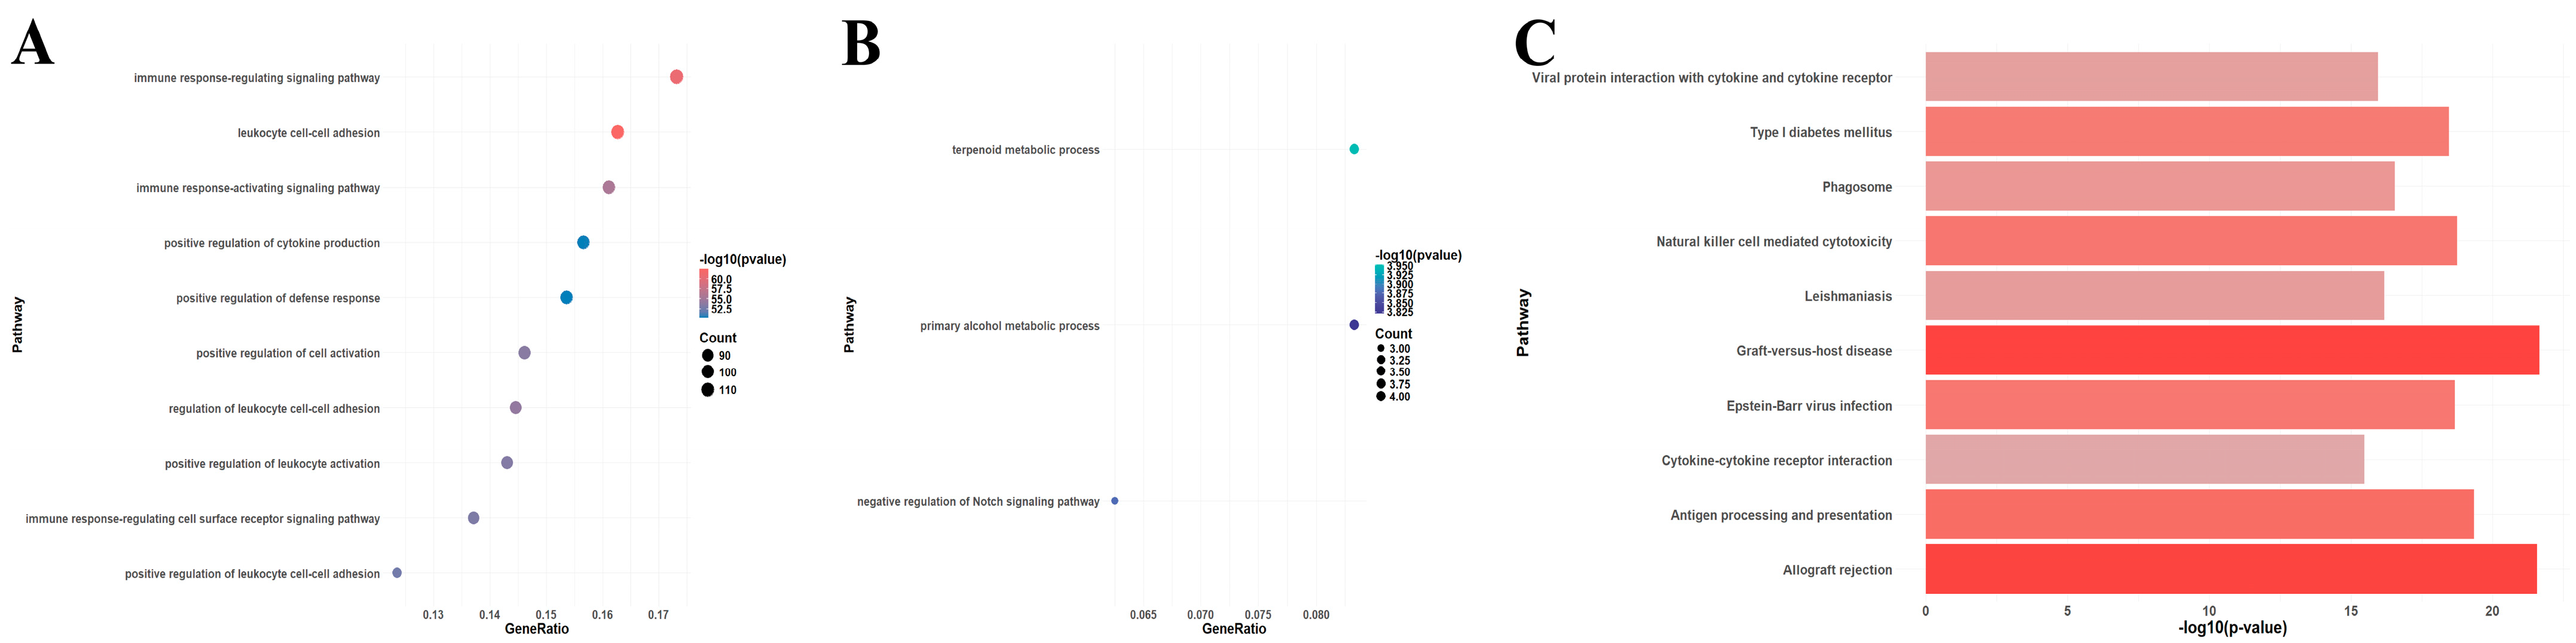
A total of 750 upregulated and 59 downregulated DEGs were identified in the GSE150059 dataset (Figure 2). Upregulated genes were mainly enriched in the immune-related biological processes, including immune response-regulating signaling pathway, leucocyte cell–cell adhesion, immune response-activating signaling pathway, etc. (Figure 3A). Downregulated genes were enriched in metabolic processes and cell signaling systems (Figure 3B). Notably, KEGG enrichment analysis revealed that DEGs were significantly enriched in graft-versus-host disease and allograft rejection (Figure 3C).
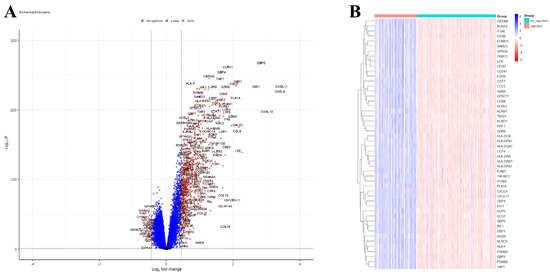
Figure 2.
Differential expression analysis of GSE150059. (A) Volcano plot. Black dots—not significant genes, blue dots—genes with p-value < 0.05 but |logFC| < 0.4497, red dots—differentially expressed genes (p-value < 0.05, |logFC| > 0.4497). (B) Heatmap of the top 50 differentially expressed genes.
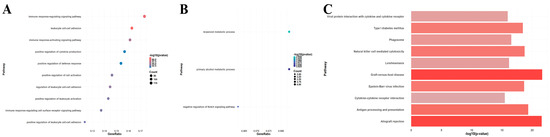
Figure 3.
Enrichment analysis of differentially expressed genes in GSE150059 (top 10 pathways). (A) Gene Ontology (GO) enrichment analysis of upregulated genes. (B) GO enrichment analysis of downregulated genes. (C) Kyoto Encyclopedia of Genes and Genomes (KEGG) pathway enrichment analysis of all genes.
3.2. Machine Learning Analysis
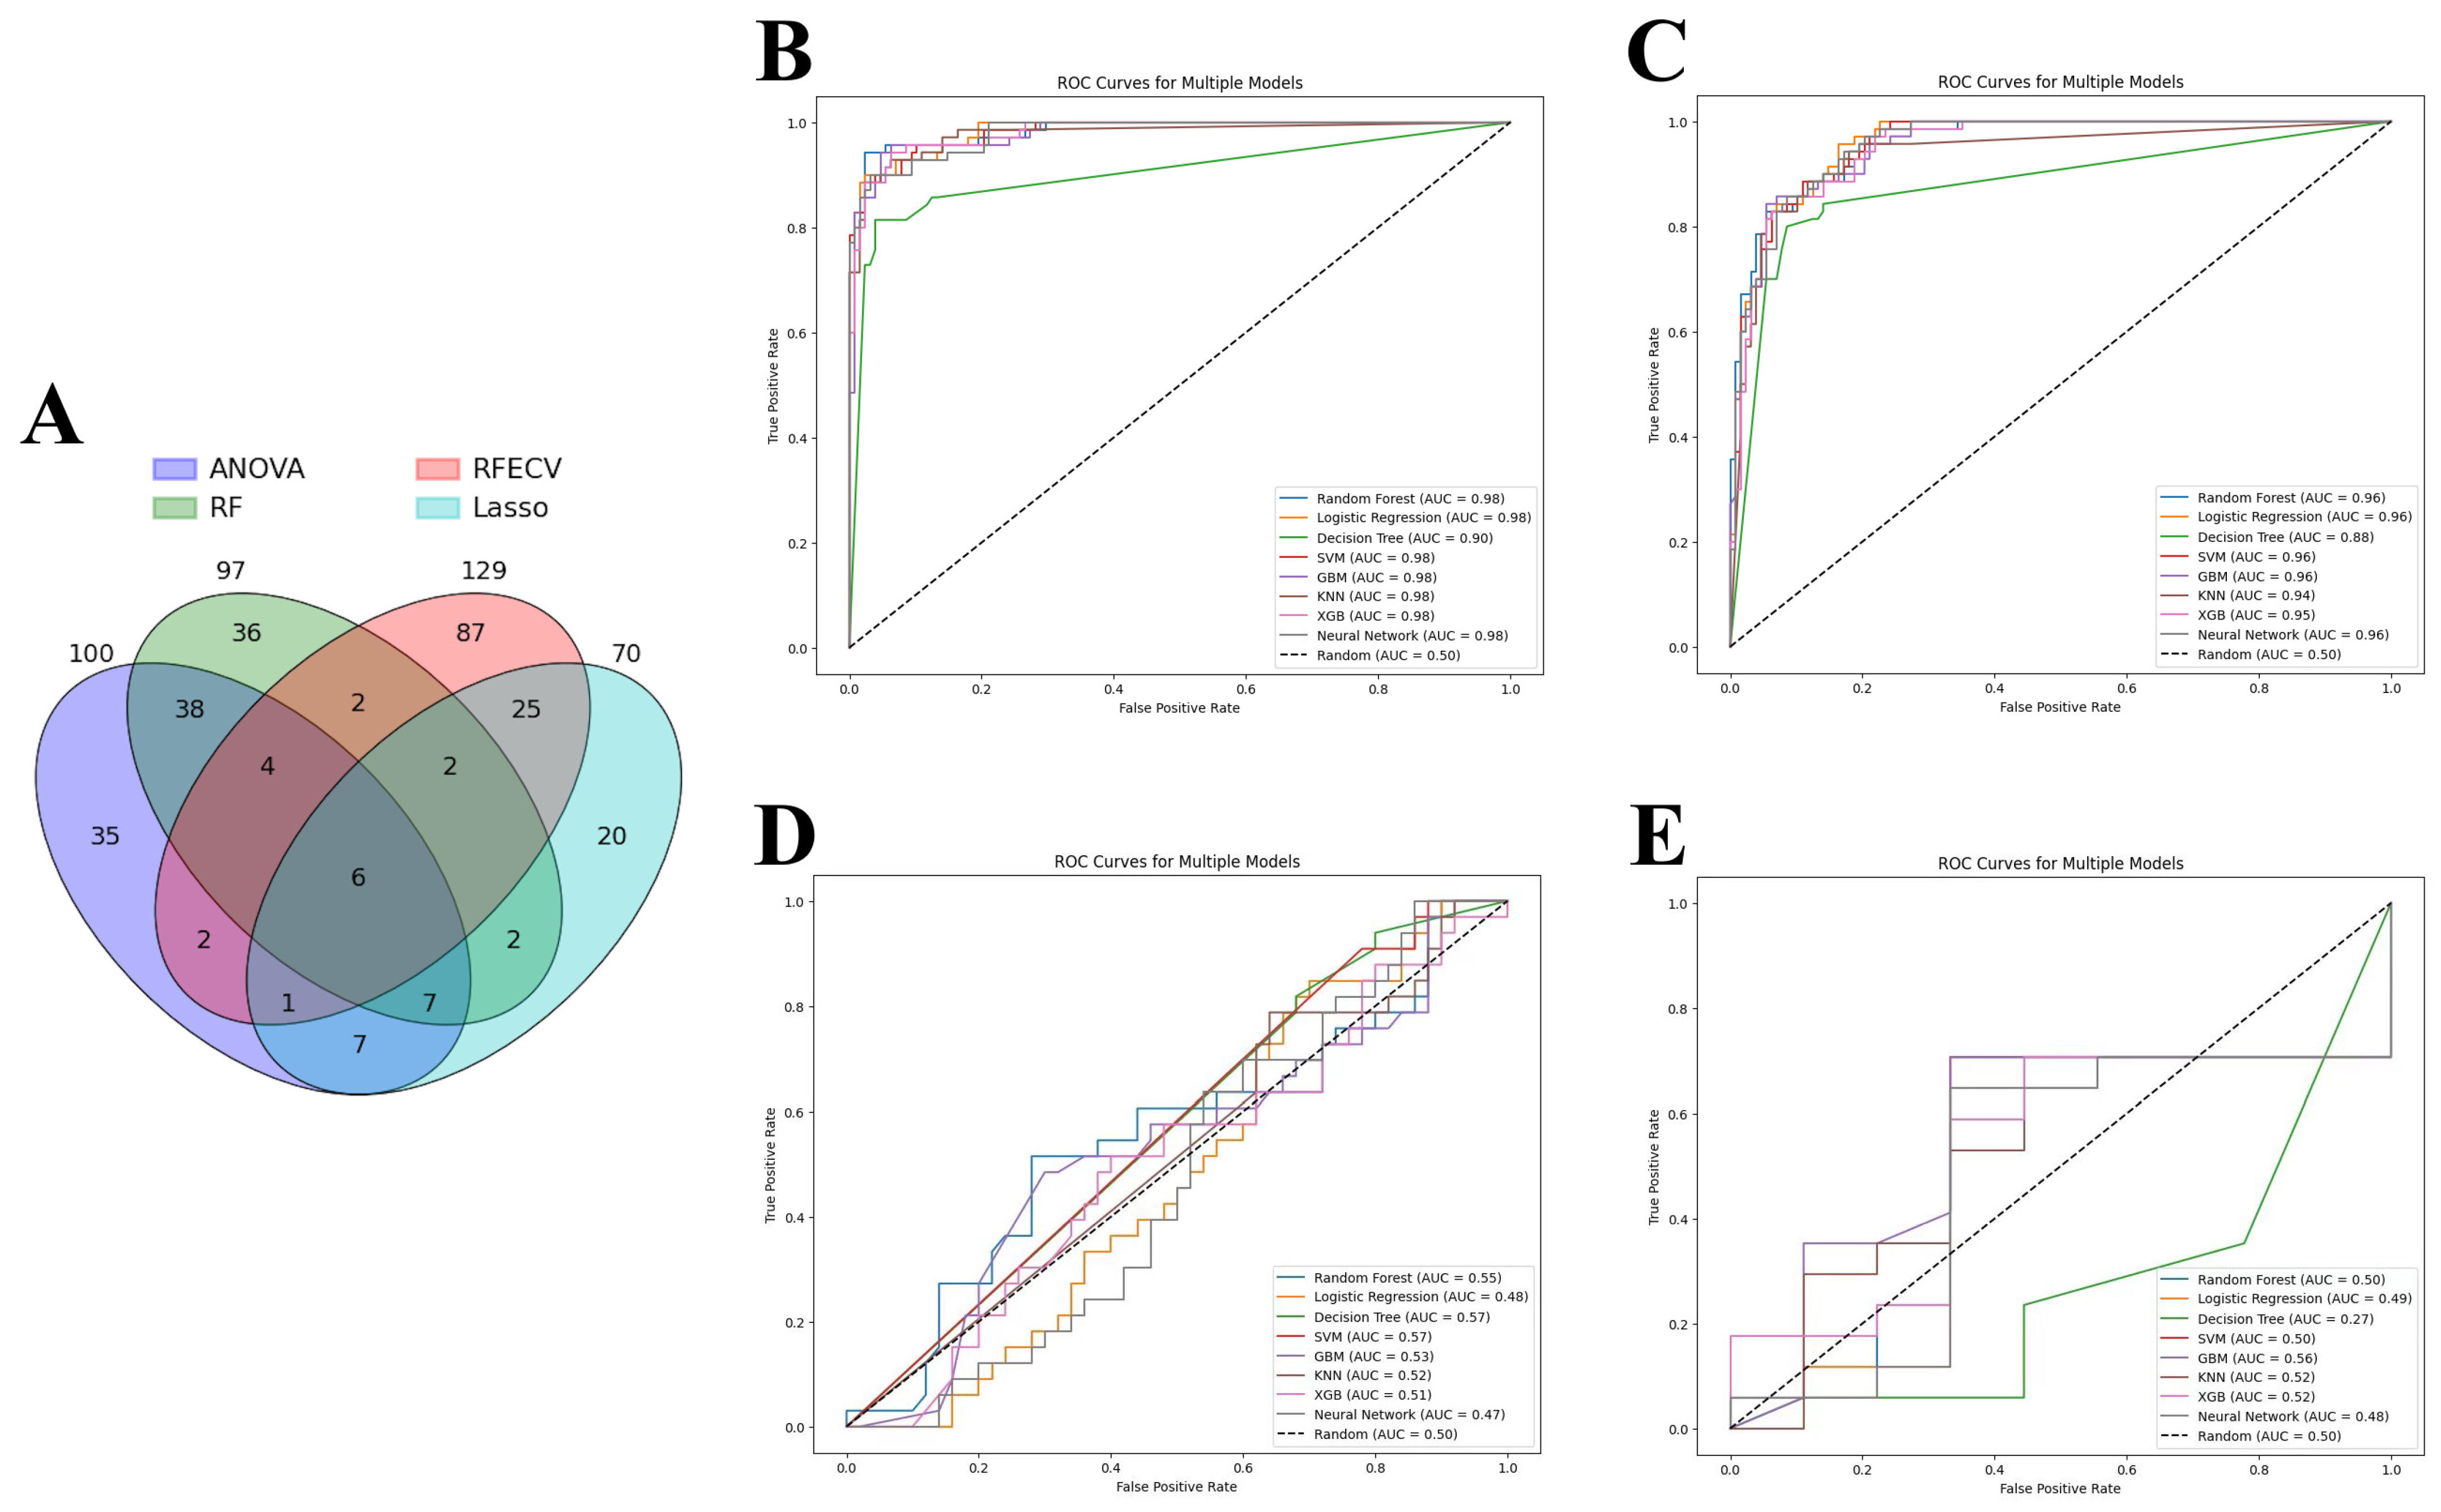
ANOVA, RFE, LASSO, and RFC were applied to identify the most relevant DEGs that contributed to the predictive power of machine learning models. As a result, 129 genes were selected by RFE, followed by 100 genes by ANOVA, 97 genes by RF, and 70 genes by LASSO. As each feature selection method has its own advantages and disadvantages, all selected genes were intersected to identify candidate genes involved in acute cardiac allograft rejection (Figure 4A). Thus, six genes were selected to train the machine learning models: HCP5, KLRD1, GZMB, PLA1A, GNLY, and KLRB1. Eight models showed similar performance when predicting acute cardiac rejection based on MMDx. According to aggregate metrics, RF and LR performed slightly better compared to the other models in the test and internal validation sets (Table 2 and Figure 4B,C). In contrast, DT underperformed compared to the other models and had an accuracy of 0.91 and AUC of 0.90 in the test set and an accuracy of 0.87 and AUC of 0.88 in the internal validation set.
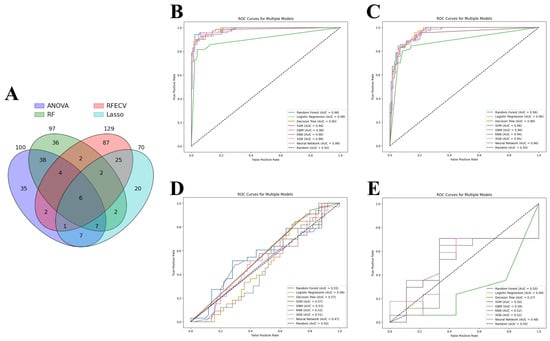
Figure 4.
Machine learning analysis. (A) Venn diagram of genes selected by four feature selection tools. (B–D) Receiver operating characteristic (ROC) curve of machine learning models: (B) Test set; (C) Internal validation set; (D) External validation set 1 (merged GSE2596 and GSE4470). (E) External validation set 2 (GSE9377). Note: ANOVA—analysis of variance, RFE—recursive feature elimination, LASSO—least absolute shrinkage and selection operator, RF—random forest classifier; SVM—support vector machines, GBM—gradient boosting machines, KNN—K-nearest neighbors, XGB—XGBoost.
Table 2.
Results of machine learning algorithms trained on six genes (HCP5, KLRD1, GZMB, PLA1A, GNLY, and KLRB1) in test and internal validation sets.
Finally, we wanted to assess whether models trained on the MMDx dataset can be used to predict the histologic diagnosis of acute cardiac allograft rejection. LR, SVM, RF, GBM, KNN, XGBoost, DT, and neutral networks were tested on two external validation sets: merged GSE2596 and GSE4470 dataset and GSE9377 dataset (Table 3 and Figure 4D,E). All the models had very poor performance (close to random curve) in two external validation sets, highlighting major differences between the two diagnostic methods.
Table 3.
Results of machine learning algorithms trained on six genes (HCP5, KLRD1, GZMB, PLA1A, GNLY, and KLRB1) in two external validation sets.
3.3. Model Interpretation
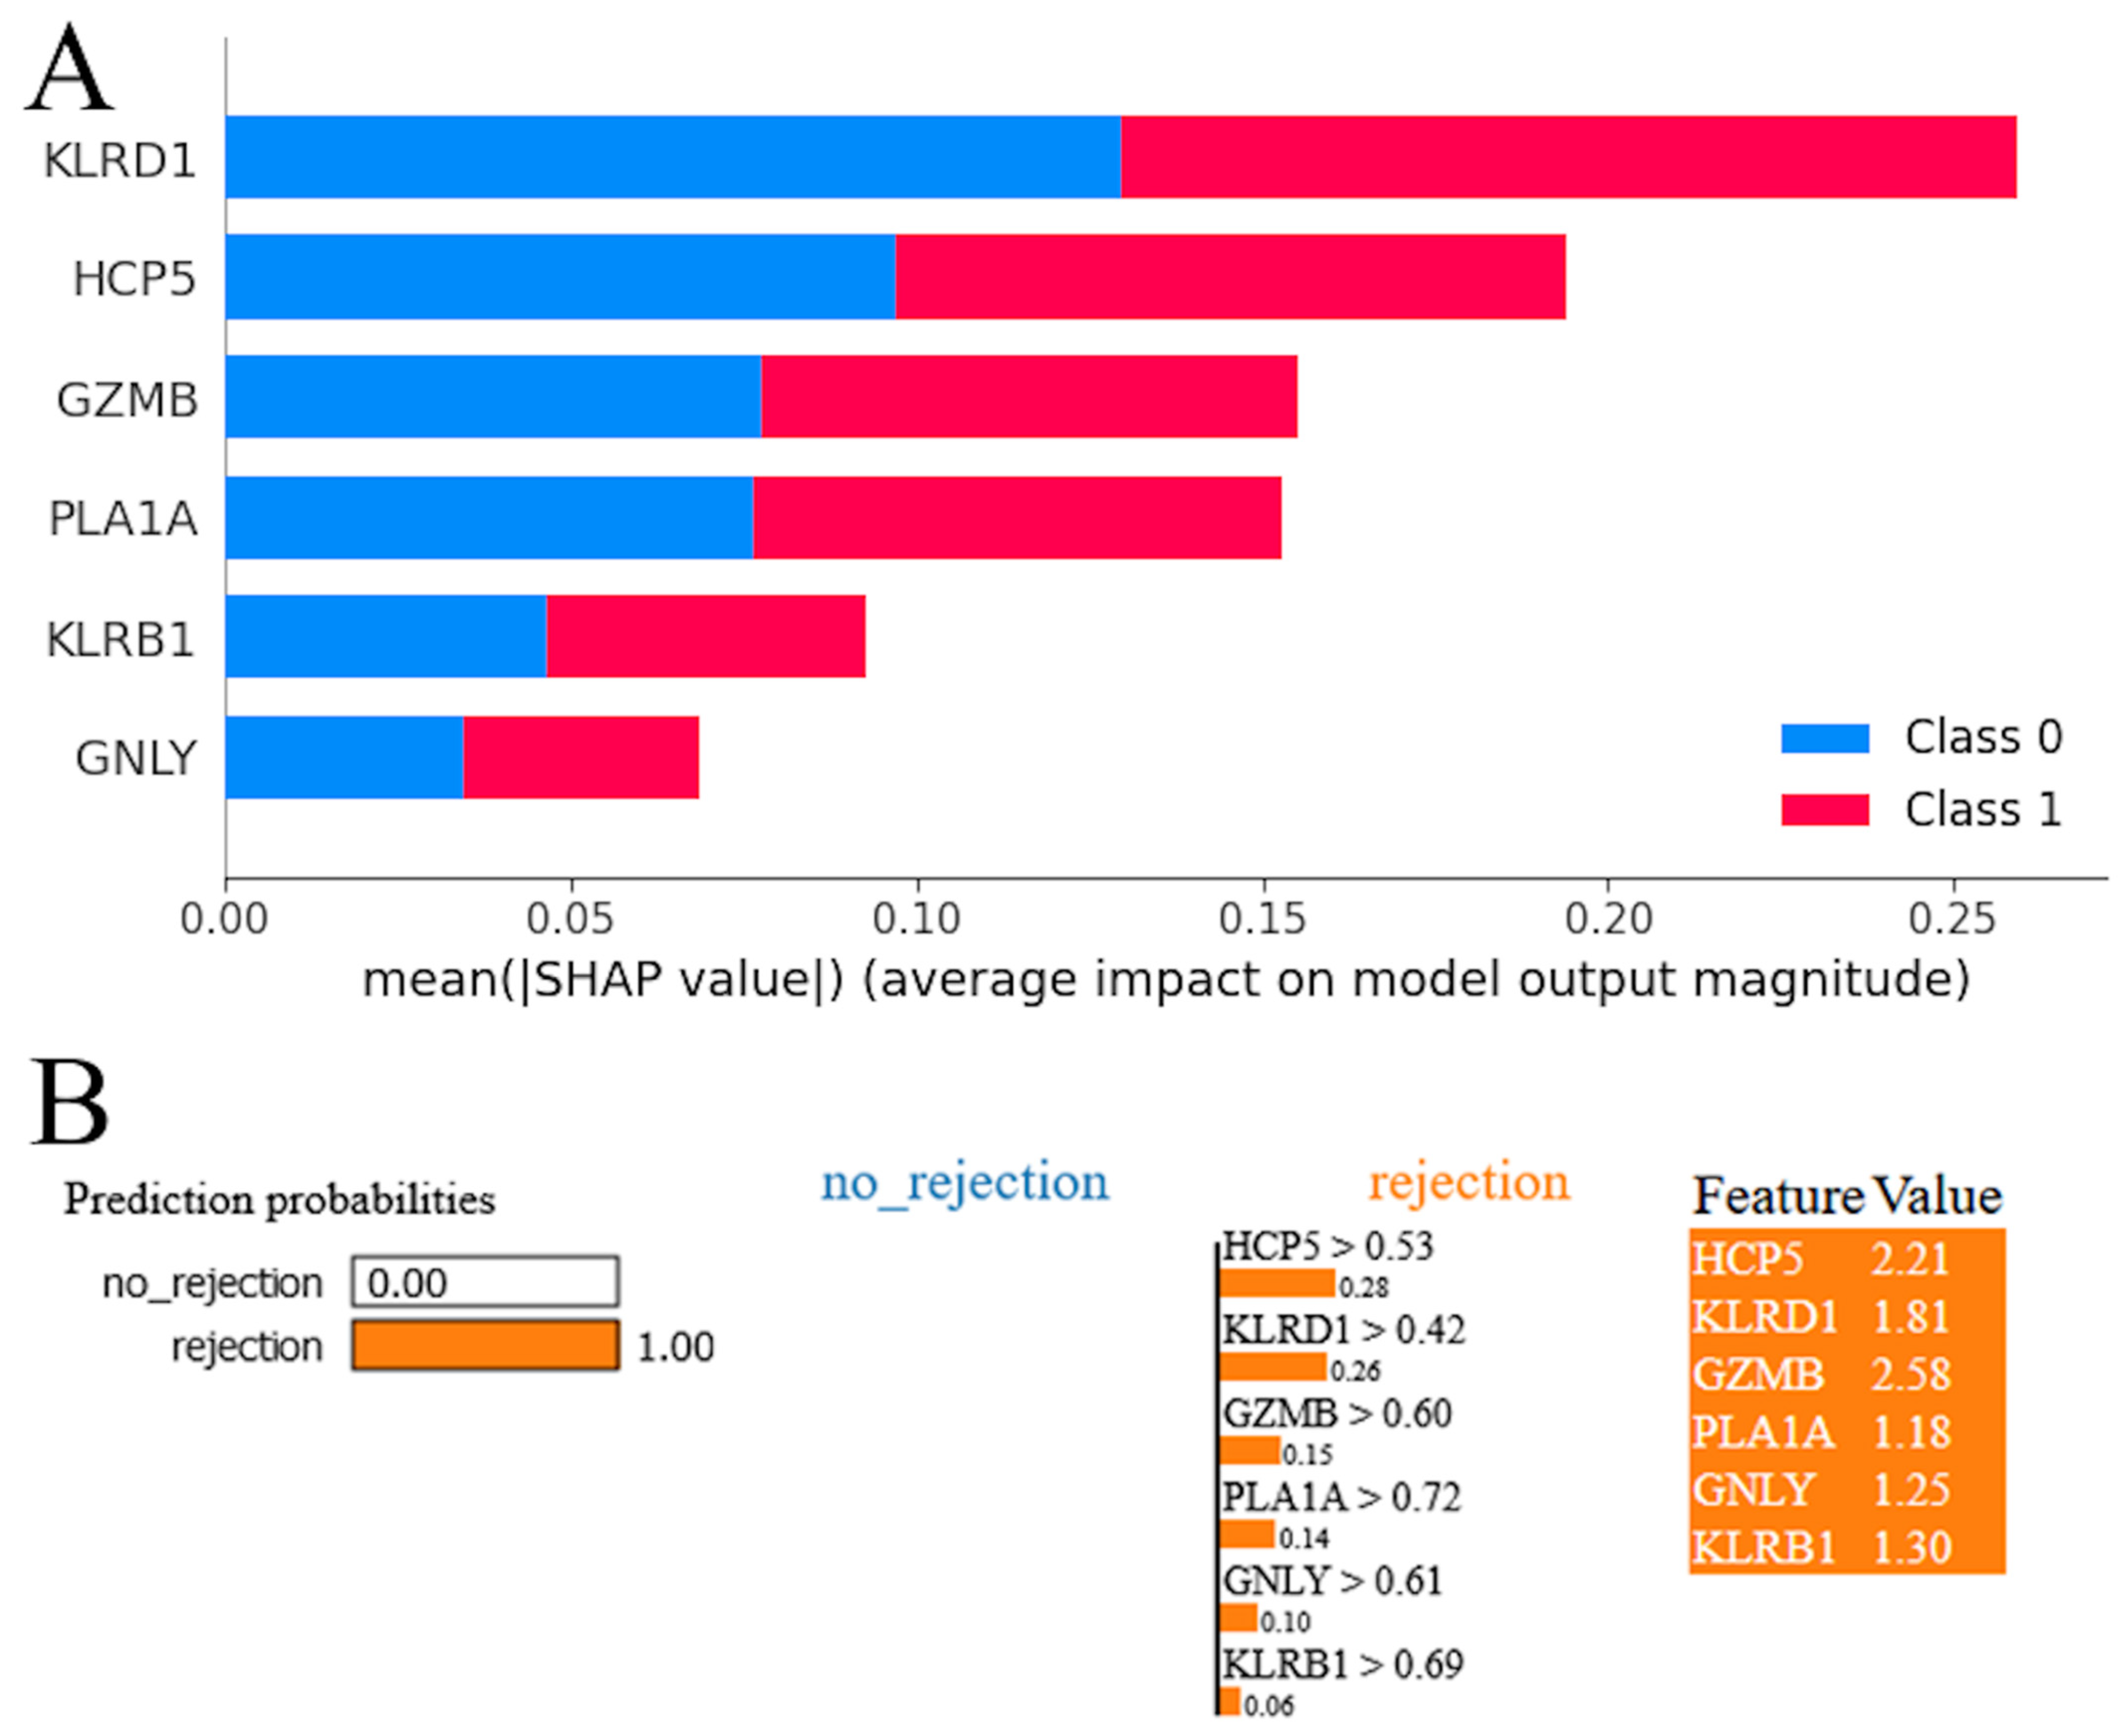
The SHAP summary plot for the RF model revealed a hierarchy of genes according to their influence on the model’s predictions (Figure 5A). Red and blue colors occupy half of the horizontal rectangles for each class. This means that each feature has an equal impact on the classification of both rejection and stable cases. The gene KLRD1 emerged as the most influential, exhibiting the highest mean impact on the model’s output. It was followed in significance by HCP5, suggesting that these two genes have a predominant role in the predictive framework. GZMB and PLA1A were also identified as impactful, albeit to a lesser extent than KLRD1 and HCP5, underscoring their contributory roles in the model’s decision-making process. KLRB1 and GNLY, while still influential, demonstrated a comparatively lower impact on the model’s predictions. The LIME plot indicates that the model predicts acute cardiac rejection with a probability of 1.00, suggesting strong confidence in this outcome (Figure 5B). All genes were shown with positive weights, indicating their influence on the acute cardiac rejection prediction. The values next to each feature represent their presence in the instance, and the weights (e.g., 0.28 for HCP5 > 0.53) show each gene’s contribution to pushing the prediction towards acute cardiac allograft rejection. High feature values alongside positive weights confirm their significant role in the model’s decision-making process for this prediction.

Figure 5.
Model interpretation. (A) SHapley Additive exPlanations (SHAP) analysis for random forest model. (B) Local Interpretable Model-agnostic Explanations (LIME) interpretation for random forest model.
4. Discussion
We intersected genes selected by four robust feature selection methods (ANOVA, RFE, LASSO, and RFC) to identify the most relevant DEGs. HCP5, KLRD1, GZMB, PLA1A, GNLY, and KLRB1 were selected and were used to train the machine learning models. All DEGs, including the identified six genes, were mainly enriched in immune-related processes and pathways, including graft-versus-host disease and allograft rejection. These six genes have long been known to be associated with immunity and acute rejection [21,22,23,24,25,26,27,28,29,30,31,32]. HCP5 (HLA complex P5) is a long non-coding RNA. Its single-nucleotide polymorphisms were found to be associated with an increased risk of relapse, decreased survival rate, and occurrence of graft-versus-host disease in hematopoietic stem cell transplantation [21,22,23]. However, the role of HCP5 in solid graft rejection is unclear and requires further investigation. KLRD1 (CD94) and KLRB1 (CD161) are NK cell receptors involved in cytotoxicity and both antibody- and T-cell-mediated rejection [24,25,26]. CD94 forms a heterodimeric receptor with NKG2 isoforms resulting in either activating (e.g., CD94/NKG2D) or inhibitory (e.g., CD94/NKG2A) receptors, both of which bind MHC class I molecules, namely HLA-E and possibly HLA-G [33,34]. Expression of transgenic HLA-E and HLA-G in endothelial cell lines was reported to significantly suppress macrophage-mediated cytotoxicity in a xenomodel [35,36]. Furthermore, expression of HLA-E and HLA-G was associated with a reduced rate of rejection in transplant recipients [37,38,39]. CD161 is primarily an inhibitory receptor, blockage of which promotes activation of T cells and cytotoxicity [40,41]. CD161 is a marker of pro-inflammatory NK cell function with high cytokine responsiveness [42]. CD161+ T cells present an important subset of early inflammatory cells in allograft rejection, but their relative contribution and significance compared to other immune cells remain to be explored [43,44]. Granzyme B, which is encoded by the GZMB gene, was shown to be significantly overexpressed in patients with acute solid organ rejection compared to stable patients. Interestingly, a significant decrease in expression levels of this enzyme was noted after initiation of anti-rejection therapy [27,28,29]. Granzyme B plays a key role in inducing apoptosis in target cells during immune responses and mediating early allograft injury [45,46]. Several recent studies investigated the possibilities of its application for noninvasive diagnosis of transplant rejection [30,31]. Finally, GNLY (cytolytic protein expressed in NK cells) and PLA1A (phospholipase A1 member A, an IFNG-inducible enzyme) are antibody-mediated selective transcripts [26,32]. Increased expression of these two genes was observed in rejecting human hearts [47,48]. GNLY (granulysin) contributes to tissue damage and allograft rejection by promoting cytotoxicity and inflammation [49]. In addition, granulysin can induce targeted allograft apoptosis through perforin-dependent and perforin-independent mechanisms [50,51]. Granulysin binds to phospholipids in cell membranes, which is important for its cytotoxic function as it allows the protein to disrupt the integrity of cell membranes and induce cell death [52,53]. The specific role of PLA1A (IFNG-inducible enzyme) in rejection mechanisms is less clear, but phospholipases can modulate inflammatory responses and immune cell functions by generating lipid mediators [54]. An increase in the activity of phospholipases triggers lipid degradation and subsequently energy metabolism imbalance [55,56]. In order to predict acute allograft rejection based on gene expression profiles, we trained eight machine learning algorithms to identify the best-performing one. Machine learning models are at high risk of overfitting when trained on datasets with a large number of features relative to the number of observations [57,58]. Overfitting occurs when a model learns the noise in the training data to the extent that it performs poorly on new, unseen data. It is a common issue in bioinformatics analyses of gene expression datasets obtained from publicly available repositories such as GEO [59]. In our study, the GSE150059 dataset that was used to train the models contains hundreds of samples and is therefore large enough for this task. In addition, we ensured that our models were not overfitting through rigorous feature selection to reduce dimensionality, cross-validation, and internal validation. Various metrics were used to assess the predictive performance of each model as it is impossible for any single metric to capture all the strengths and weaknesses of a classifier, especially in the setting of an unbalanced dataset or in the presence of confounders [19]. For instance, if we had used only F1 score (aggregate metric) or AUPRC, we would have mistakenly assumed that some models had good performance in predicting histologic diagnosis of acute cardiac rejection.
We achieved excellent predictive performance in all the machine learning algorithms trained on these six genes with RF and LR outperforming the other six models. In addition, we ran each model on two external validation sets. However, this was conducted to assess differences between MMDx and histologic diagnoses rather than evaluate model performance. Despite great predictive performance shown in test and validation sets, all the models failed to achieve optimal results in two external validation sets. Thus, our study highlights major differences between the two diagnostic methods in terms of machine learning algorithms. Discrepancies between histologic and MMDx diagnosis in solid organ rejection were reported in multiple studies [60,61,62]. Although MMDx cannot yet replace histopathology, both methods complement each other and help expand our understanding of heart transplant rejection states [63]. Apart from differences in diagnostic modalities, the performance of machine learning algorithms was likely affected by several factors, albeit to a smaller degree. Firstly, only normalized data of both external validation sets could be obtained from the GEO. Utilization of different normalization methods is known to affect model performance [64]. Secondly, the first external validation set had missing values, which were replaced with a median. Thirdly, only genes that were present in all the datasets were selected.
LIME and SHAP are two techniques used to explain the predictions made by machine learning models. LIME focuses on generating local, interpretable explanations for individual predictions. It does this by approximating the behavior of the model around a specific prediction using a simple, interpretable model. This involves sampling perturbations around the prediction and fitting a straightforward model to these perturbations. By doing so, LIME can identify which features have the most significant influence on the prediction [65]. In contrast, SHAP provides a more global explanation by utilizing Shapley values from cooperative game theory to measure the contribution of each feature to the prediction. It achieves this by estimating the marginal contribution of each feature through an iterative process of adding features to a reference value and observing the resulting change in the model output. The resulting feature attributions offer an additive explanation of how each feature contributes to the overall model output [66]. Both LIME and SHAP offer valuable insights into the contributions of different features towards model predictions. These insights can be particularly useful in understanding the mechanisms involved in complex phenomena such as cardiac rejection. By gaining a better understanding of feature importance, researchers can potentially develop preventive or therapeutic interventions. HCP5, KLRD1, GZMB, PLA1A, GNLY, and KLRB1 emerged as robust biomarkers for molecular diagnosis of acute cardiac rejection and had a prediction probability of 1.0. KLRD1 and HCP5 were identified as the most impactful by SHAP and LIME, highlighting their importance in cardiac rejection and potential as therapeutic targets. In the future, therapeutic interventions may be tailored to individual transplant recipients based on their unique gene expression profiles. For instance, high-risk patients identified by the predictive model may be closely monitored for signs of rejection and receive appropriate treatment, while those at low risk may require less aggressive immunosuppressive therapy, thus reducing the risk of adverse effects.
5. Conclusions
Taken together, machine learning algorithms hold immense promise for advancing therapeutic and preventive strategies in acute cardiac allograft rejection. LR, SVM, RF, GBM, KNN, XGBoost, DT, and neutral networks demonstrated great predictive performance in predicting acute cardiac rejection based on MMDx. LR and RF outperformed the other six machine learning models. However, all models showed poor performance when predicting histologic diagnosis of cardiac rejection, which is attributed to differences between these two methods. HCP5, KLRD1, GZMB, PLA1A, GNLY, and KLRB1 were identified as candidate genes. According to SHAP and LIME, KLRD1 and HCP5 were the most impactful genes.
Author Contributions
Conceptualization, B.A.; methodology, B.A. and E.K.; software, B.A. and E.K.; validation, B.A. and E.K.; formal analysis, B.A.; investigation, B.A.; resources, B.A.; data curation, B.A. and E.K.; writing—original draft preparation, B.A. and E.K.; writing—review and editing, B.A.; visualization, B.A. and E.K.; supervision, Z.W.; project administration, Z.W.; funding acquisition, Z.W. All authors have read and agreed to the published version of the manuscript.
Funding
This research was funded by the National Natural Science Foundation of China, grant numbers 82200522 and 82070481, and the Hubei Provincial Department of Science and Technology, Key Research and Development Program Project, grant number 2022BCA035.
Institutional Review Board Statement
Ethical review and approval were waived for this study because no human were involved in this study.
Informed Consent Statement
Not applicable.
Data Availability Statement
The data presented in this study are available in the Gene Expression Omnibus at https://www.ncbi.nlm.nih.gov/geo/query/acc.cgi?acc=GSE150059, https://www.ncbi.nlm.nih.gov/geo/query/acc.cgi?acc=GSE9377, https://www.ncbi.nlm.nih.gov/geo/query/acc.cgi?acc=GSE2596, and https://www.ncbi.nlm.nih.gov/geo/query/acc.cgi?acc=GSE4470 all accessed on accessed on 24 March 2024.
Conflicts of Interest
The authors declare no conflicts of interest.
References
- Tanveer, Y.; Arif, A.; Tsenteradze, T.; Anika, N.N.; Bakht, D.; Masood, Q.F.; Affaf, M.; Batool, W.; Yadav, I.; Gasim, R.W.; et al. Revolutionizing Heart Transplantation: A Multidisciplinary Approach to Xenotransplantation, Immunosuppression, Regenerative Medicine, Artificial Intelligence, and Economic Sustainability. Cureus 2023, 15, e46176. [Google Scholar] [CrossRef] [PubMed]
- Tonsho, M.; Michel, S.; Ahmed, Z.; Alessandrini, A.; Madsen, J.C. Heart transplantation: Challenges facing the field. Cold Spring Harb. Perspect. Med. 2014, 4, a015636. [Google Scholar] [CrossRef] [PubMed]
- Welch, T.S.; Mrsic, Z.; Mazimba, S. Monitoring for Rejection. In Contemporary Heart Transplantation; Bogar, L., Stempien-Otero, A., Eds.; Springer International Publishing: Cham, Switzerland, 2020; pp. 1–18. [Google Scholar]
- Hurskainen, M.; Ainasoja, O.; Lemström, K.B. Failing Heart Transplants and Rejection—A Cellular Perspective. J. Cardiovasc. Dev. Dis. 2021, 8, 180. [Google Scholar] [CrossRef] [PubMed]
- Choy, J.C. Granzymes and perforin in solid organ transplant rejection. Cell Death Differ. 2010, 17, 567–576. [Google Scholar] [CrossRef] [PubMed]
- Rascio, F.; Pontrelli, P.; Grandaliano, G. Cytotoxic T Lymphocytes (CTLs) and Kidney Transplantation: An Overview. In Cytotoxic T-Cells: Methods and Protocols; Gigante, M., Ranieri, E., Eds.; Springer: New York, NY, USA, 2021; pp. 203–213. [Google Scholar]
- Miyairi, S.; Baldwin, W.M.I.; Valujskikh, A.; Fairchild, R.L. Natural Killer Cells: Critical Effectors During Antibody-mediated Rejection of Solid Organ Allografts. Transplantation 2021, 105, 284–290. [Google Scholar] [CrossRef] [PubMed]
- Faraco, J.; Lin, L.; Kornum, B.R.; Kenny, E.E.; Trynka, G.; Einen, M.; Rico, T.J.; Lichtner, P.; Dauvilliers, Y.; Arnulf, I.; et al. ImmunoChip Study Implicates Antigen Presentation to T Cells in Narcolepsy. PLOS Genet. 2013, 9, e1003270. [Google Scholar] [CrossRef] [PubMed]
- Albers, E.L.; Friedland-Little, J.M.; Hong, B.J.; Kemna, M.S.; Warner, P.; Law, Y.M. Human leukocyte antigen eplet mismatching is associated with increased risk of graft loss and rejection after pediatric heart transplant. Pediatr. Transplant. 2022, 26, e14126. [Google Scholar] [CrossRef] [PubMed]
- Tran, D.T.; Tu, Z.; Alawieh, A.; Mulligan, J.; Esckilsen, S.; Quinn, K.; Sundararaj, K.; Wallace, C.; Finnegan, R.; Allen, P.; et al. Modulating donor mitochondrial fusion/fission delivers immunoprotective effects in cardiac transplantation. Am. J. Transplant. 2022, 22, 386–401. [Google Scholar] [CrossRef] [PubMed]
- Bosmans, L.A.; Bosch, L.; Kusters, P.J.H.; Lutgens, E.; Seijkens, T.T.P. The CD40-CD40L Dyad as Immunotherapeutic Target in Cardiovascular Disease. J. Cardiovasc. Transl. Res. 2021, 14, 13–22. [Google Scholar] [CrossRef] [PubMed]
- Siemaszko, J.; Marzec-Przyszlak, A.; Bogunia-Kubik, K. NKG2D Natural Killer Cell Receptor—A Short Description and Potential Clinical Applications. Cells 2021, 10, 1420. [Google Scholar] [CrossRef]
- Halloran, P.F.; Famulski, K.S.; Reeve, J. Molecular assessment of disease states in kidney transplant biopsy samples. Nat. Rev. Nephrol. 2016, 12, 534–548. [Google Scholar] [CrossRef]
- Halloran, P.F.; Einecke, G.; Sikosana, M.L.N.; Madill-Thomsen, K. The Biology and Molecular Basis of Organ Transplant Rejection. In Pharmacology of Immunosuppression; Eisen, H.J., Ed.; Springer International Publishing: Cham, Switzerland, 2022; pp. 1–26. [Google Scholar]
- Shin, S.; Austin, P.C.; Ross, H.J.; Abdel-Qadir, H.; Freitas, C.; Tomlinson, G.; Chicco, D.; Mahendiran, M.; Lawler, P.R.; Billia, F.; et al. Machine learning vs. conventional statistical models for predicting heart failure readmission and mortality. ESC Heart Fail. 2021, 8, 106–115. [Google Scholar] [CrossRef]
- Singal, A.G.; Mukherjee, A.; Elmunzer, J.B.; Higgins, P.D.R.; Lok, A.S.; Zhu, J.; Marrero, J.A.; Waljee, A.K. Machine Learning Algorithms Outperform Conventional Regression Models in Predicting Development of Hepatocellular Carcinoma. Am. J. Gastroenterol. 2013, 108, 1723–1730. [Google Scholar] [CrossRef] [PubMed]
- Sebastiani, M.; Vacchi, C.; Manfredi, A.; Cassone, G. Personalized Medicine and Machine Learning: A Roadmap for the Future. J. Clin. Med. 2022, 11, 4110. [Google Scholar] [CrossRef] [PubMed]
- Ozer, M.E.; Sarica, P.O.; Arga, K.Y. New Machine Learning Applications to Accelerate Personalized Medicine in Breast Cancer: Rise of the Support Vector Machines. OMICS 2020, 24, 241–246. [Google Scholar] [CrossRef] [PubMed]
- Lever, J.; Krzywinski, M.; Altman, N. Classification evaluation. Nat. Methods 2016, 13, 603–604. [Google Scholar] [CrossRef]
- Hossin, M.; Sulaiman, M.N. A Review On Evaluation Metrics For Data Classification Evaluations. Int. J. Min. Model. Manag. 2015, 5, 1–11. [Google Scholar]
- Chen, D.-P.; Chang, S.-W.; Jaing, T.-H.; Wang, W.-T.; Hsu, F.-P.; Tseng, C.-P. Single nucleotide polymorphisms within HLA region are associated with the outcomes of unrelated cord blood transplantation. Sci. Rep. 2021, 11, 21925. [Google Scholar] [CrossRef]
- Chen, D.-P.; Wen, Y.-H.; Wang, P.-N.; Hour, A.-L.; Lin, W.-T.; Hsu, F.-P.; Wang, W.-T. The adverse events of haematopoietic stem cell transplantation are associated with gene polymorphism within human leukocyte antigen region. Sci. Rep. 2021, 11, 1475. [Google Scholar] [CrossRef]
- Petersdorf, E.W.; Malkki, M.; Horowitz, M.M.; Spellman, S.R.; Haagenson, M.D.; Wang, T. Mapping MHC haplotype effects in unrelated donor hematopoietic cell transplantation. Blood 2013, 121, 1896–1905. [Google Scholar] [CrossRef]
- Duizendstra, A.A.; van der Grift, M.V.; Boor, P.P.; Noordam, L.; de Knegt, R.J.; Peppelenbosch, M.P.; Betjes, M.G.H.; Litjens, N.H.R.; Kwekkeboom, J. Current Tolerance-Associated Peripheral Blood Gene Expression Profiles After Liver Transplantation Are Influenced by Immunosuppressive Drugs and Prior Cytomegalovirus Infection. Front. Immunol. 2022, 12, 738837. [Google Scholar] [CrossRef] [PubMed]
- Kong, F.; Ye, S.; Zhong, Z.; Zhou, X.; Zhou, W.; Liu, Z.; Lan, J.; Xiong, Y.; Ye, Q. Single-Cell Transcriptome Analysis of Chronic Antibody-Mediated Rejection After Renal Transplantation. Front. Immunol. 2022, 12, 767618. [Google Scholar] [CrossRef]
- Venner, J.M.; Hidalgo, L.G.; Famulski, K.S.; Chang, J.; Halloran, P.F. The Molecular Landscape of Antibody-Mediated Kidney Transplant Rejection: Evidence for NK Involvement Through CD16a Fc Receptors. Am. J. Transplant. 2015, 15, 1336–1348. [Google Scholar] [CrossRef] [PubMed]
- Simon, T.; Opelz, G.; Wiesel, M.; Ott, R.C.; Süsal, C. Serial Peripheral Blood Perforin and Granzyme B Gene Expression Measurements for Prediction of Acute Rejection in Kidney Graft Recipients. Am. J. Transplant. 2003, 3, 1121–1127. [Google Scholar] [CrossRef] [PubMed]
- Xu, W.-L.; Wang, R.-l.; Liu, Z.; Wu, Q.; Li, X.-L.; He, Q.; Zhu, J.-Q. Granzyme B–Producing B Cells Function as a Feedback Loop for T Helper Cells in Liver Transplant Recipients with Acute Rejection. Inflammation 2021, 44, 2270–2278. [Google Scholar] [CrossRef] [PubMed]
- Legros-Maïda, S.; Soulié, A.; Benvenuti, C.; Wargnier, A.; Vallée, N.; Berthou, C.; Guillet, J.; Sasportes, M.; Sigaux, N. Granzyme B and perforin can be used as predictive markers of acute rejection in heart transplantation. Eur. J. Immunol. 1994, 24, 229–233. [Google Scholar] [CrossRef] [PubMed]
- Jin, Y.; Gao, P.; Liang, L.; Wang, Y.; Li, J.; Wang, J.; Hou, J.; Yang, C.; Wang, X. Noninvasive quantification of granzyme B in cardiac allograft rejection using targeted ultrasound imaging. Front. Immunol. 2023, 14, 1164183. [Google Scholar] [CrossRef] [PubMed]
- Gao, T.; Yi, L.; Wang, Y.; Wang, W.; Zhao, Q.; Song, Y.; Ding, M.; Deng, C.; Chen, Y.; Xie, Y.; et al. Granzyme B-responsive fluorescent probe for non-invasive early diagnosis of transplant rejection. Biosens. Bioelectron. 2023, 232, 115303. [Google Scholar] [CrossRef] [PubMed]
- Halloran, P.F.; Venner, J.M.; Madill-Thomsen, K.S.; Einecke, G.; Parkes, M.D.; Hidalgo, L.G.; Famulski, K.S. Review: The transcripts associated with organ allograft rejection. Am. J. Transplant. 2018, 18, 785–795. [Google Scholar] [CrossRef]
- Hò, G.T.; Celik, A.A.; Huyton, T.; Hiemisch, W.; Blasczyk, R.; Simper, G.S.; Bade-Doeding, C. NKG2A/CD94 Is a New Immune Receptor for HLA-G and Distinguishes Amino Acid Differences in the HLA-G Heavy Chain. Int. J. Mol. Sci. 2020, 21, 4362. [Google Scholar] [CrossRef]
- Lin, Z.; Bashirova, A.A.; Viard, M.; Garner, L.; Quastel, M.; Beiersdorfer, M.; Kasprzak, W.K.; Akdag, M.; Yuki, Y.; Ojeda, P.; et al. HLA class I signal peptide polymorphism determines the level of CD94/NKG2-HLA-E-mediated regulation of effector cell responses. Nat. Immunol. 2023, 24, 1087–1097. [Google Scholar] [CrossRef] [PubMed]
- Eguchi, H.; Maeda, A.; Lo, P.C.; Matsuura, R.; Esquivel, E.L.; Asada, M.; Sakai, R.; Nakahata, K.; Yamamichi, T.; Umeda, S.; et al. HLA-G1, but Not HLA-G3, Suppresses Human Monocyte/Macrophage-mediated Swine Endothelial Cell Lysis. Transplant. Proc. 2016, 48, 1285–1287. [Google Scholar] [CrossRef] [PubMed]
- Maeda, A.; Kawamura, T.; Ueno, T.; Usui, N.; Eguchi, H.; Miyagawa, S. The suppression of inflammatory macrophage-mediated cytotoxicity and proinflammatory cytokine production by transgenic expression of HLA-E. Transpl. Immunol. 2013, 29, 76–81. [Google Scholar] [CrossRef] [PubMed]
- Twito, T.; Joseph, J.; Mociornita, A.; Rao, V.; Ross, H.; Delgado, D.H. The 14-bp deletion in the HLA-G gene indicates a low risk for acute cellular rejection in heart transplant recipients. J. Heart Lung Transplant. 2011, 30, 778–782. [Google Scholar] [CrossRef] [PubMed]
- Pabón, M.A.; Navarro, C.E.; Osorio, J.C.; Gómez, N.; Moreno, J.P.; Donado, A.F.; Pérez, H.C.; Lozano, E. Impact of human leukocyte antigen molecules E, F, and G on the outcome of transplantation. Transplant. Proc. 2014, 46, 2957–2965. [Google Scholar] [CrossRef] [PubMed]
- Lila, N.; Amrein, C.; Guillemain, R.; Chevalier, P.; Latremouille, C.; Fabiani, J.N.; Dausset, J.; Carosella, E.D.; Carpentier, A. Human leukocyte antigen-G expression after heart transplantation is associated with a reduced incidence of rejection. Circulation 2002, 105, 1949–1954. [Google Scholar] [CrossRef] [PubMed]
- Alvarez Calderon, F.; Kang, B.H.; Kyrysyuk, O.; Zheng, S.; Wang, H.; Mathewson, N.D.; Luoma, A.M.; Ning, X.; Pyrdol, J.; Cao, X.; et al. Targeting of the CD161 inhibitory receptor enhances T-cell-mediated immunity against hematological malignancies. Blood 2024, 143, 1124–1138. [Google Scholar] [CrossRef] [PubMed]
- Wyrożemski, Ł.; Qiao, S.W. Immunobiology and conflicting roles of the human CD161 receptor in T cells. Scand. J. Immunol. 2021, 94, e13090. [Google Scholar] [CrossRef] [PubMed]
- Kurioka, A.; Cosgrove, C.; Simoni, Y.; van Wilgenburg, B.; Geremia, A.; Björkander, S.; Sverremark-Ekström, E.; Thurnheer, C.; Günthard, H.F.; Khanna, N.; et al. CD161 Defines a Functionally Distinct Subset of Pro-Inflammatory Natural Killer Cells. Front. Immunol. 2018, 9, 486. [Google Scholar] [CrossRef]
- Schmid, F.; Mayer, C.; Büttner-Herold, M.; von Hörsten, S.; Amann, K.; Daniel, C. CD161a-positive natural killer (NK) cells and α-smooth muscle actin-positive myofibroblasts were upregulated by extrarenal DPP4 in a rat model of acute renal rejection. Diabetes Res. Clin. Pract. 2021, 173, 108691. [Google Scholar] [CrossRef]
- Thieme, C.J.; Weist, B.J.D.; Mueskes, A.; Roch, T.; Stervbo, U.; Rosiewicz, K.; Wehler, P.; Stein, M.; Nickel, P.; Kurtz, A.; et al. The TreaT-Assay: A Novel Urine-Derived Donor Kidney Cell-Based Assay for Prediction of Kidney Transplantation Outcome. Sci. Rep. 2019, 9, 19037. [Google Scholar] [CrossRef] [PubMed]
- Eskandari, S.K.; Allos, H.; Al Dulaijan, B.S.; Melhem, G.; Sulkaj, I.; Alhaddad, J.B.; Saad, A.J.; Deban, C.; Chu, P.; Choi, J.Y.; et al. mTORC1 Inhibition Protects Human Regulatory T Cells From Granzyme-B-Induced Apoptosis. Front. Immunol. 2022, 13, 899975. [Google Scholar] [CrossRef]
- Yadav, B.; Prasad, N.; Agrawal, V.; Agarwal, V.; Jain, M. Lower Circulating Cytotoxic T-Cell Frequency and Higher Intragraft Granzyme-B Expression Are Associated with Inflammatory Interstitial Fibrosis and Tubular Atrophy in Renal Allograft Recipients. Medicina 2023, 59, 1175. [Google Scholar] [CrossRef] [PubMed]
- Loupy, A.; Duong Van Huyen, J.P.; Hidalgo, L.; Reeve, J.; Racapé, M.; Aubert, O.; Venner, J.M.; Falmuski, K.; Bories, M.C.; Beuscart, T.; et al. Gene Expression Profiling for the Identification and Classification of Antibody-Mediated Heart Rejection. Circulation 2017, 135, 917–935. [Google Scholar] [CrossRef] [PubMed]
- Zhao, Y.; Hasse, S.; Bourgoin, S.G. Phosphatidylserine-specific phospholipase A1: A friend or the devil in disguise. Prog. Lipid Res. 2021, 83, 101112. [Google Scholar] [CrossRef] [PubMed]
- Heldal, T.F.; Åsberg, A.; Ueland, T.; Reisaeter, A.V.; Pischke, S.E.; Mollnes, T.E.; Aukrust, P.; Hartmann, A.; Heldal, K.; Jenssen, T. Inflammation in the early phase after kidney transplantation is associated with increased long-term all-cause mortality. Am. J. Transplant. 2022, 22, 2016–2027. [Google Scholar] [CrossRef] [PubMed]
- Kildey, K.; Francis, R.S.; Hultin, S.; Harfield, M.; Giuliani, K.; Law, B.M.P.; Wang, X.; See, E.J.; John, G.; Ungerer, J.; et al. Specialized Roles of Human Natural Killer Cell Subsets in Kidney Transplant Rejection. Front. Immunol. 2019, 10, 1877. [Google Scholar] [CrossRef] [PubMed]
- Tuomela, K.; Ambrose, A.R.; Davis, D.M. Escaping Death: How Cancer Cells and Infected Cells Resist Cell-Mediated Cytotoxicity. Front. Immunol. 2022, 13, 867098. [Google Scholar] [CrossRef] [PubMed]
- Liu, X.; Lieberman, J. Knocking ‘em Dead: Pore-Forming Proteins in Immune Defense. Annu. Rev. Immunol. 2020, 38, 455–485. [Google Scholar] [CrossRef]
- Dotiwala, F.; Lieberman, J. Granulysin: Killer lymphocyte safeguard against microbes. Curr. Opin. Immunol. 2019, 60, 19–29. [Google Scholar] [CrossRef]
- Schilke, R.M.; Blackburn, C.M.R.; Bamgbose, T.T.; Woolard, M.D. Interface of Phospholipase Activity, Immune Cell Function, and Atherosclerosis. Biomolecules 2020, 10, 1449. [Google Scholar] [CrossRef] [PubMed]
- van Smaalen, T.C.; Ellis, S.R.; Mascini, N.E.; Siegel, T.P.; Cillero-Pastor, B.; Hillen, L.M.; van Heurn, L.W.E.; Peutz-Kootstra, C.J.; Heeren, R.M.A. Rapid Identification of Ischemic Injury in Renal Tissue by Mass-Spectrometry Imaging. Anal. Chem. 2019, 91, 3575–3581. [Google Scholar] [CrossRef] [PubMed]
- Zhang, A.S.; Xu, Y.P.; Sui, X.L.; Zhang, Y.Z.; Gu, F.J.; Chen, J.H. Correlation between histone H3K4 trimethylation and DNA methylation and evaluation of the metabolomic features in acute rejection after kidney transplantation. Am. J. Transl. Res. 2020, 12, 7565–7580. [Google Scholar] [PubMed]
- Clarke, R.; Ressom, H.W.; Wang, A.; Xuan, J.; Liu, M.C.; Gehan, E.A.; Wang, Y. The properties of high-dimensional data spaces: Implications for exploring gene and protein expression data. Nat. Rev. Cancer 2008, 8, 37–49. [Google Scholar] [CrossRef]
- Smialowski, P.; Frishman, D.; Kramer, S. Pitfalls of supervised feature selection. Bioinformatics 2010, 26, 440–443. [Google Scholar] [CrossRef]
- AbdElNabi, M.L.R.; Wajeeh Jasim, M.; EL-Bakry, H.M.; Hamed, N.; Taha, M.; M. Khalifa, N.E. Breast and Colon Cancer Classification from Gene Expression Profiles Using Data Mining Techniques. Symmetry 2020, 12, 408. [Google Scholar] [CrossRef]
- Halloran, P.F.; Madill-Thomsen, K.; Aliabadi-Zuckermann, A.Z.; Cadeiras, M.; Crespo-Leiro, M.G.; Depasquale, E.C.; Deng, M.; Gökler, J.; Kim, D.H.; Kobashigawa, J.; et al. Many heart transplant biopsies currently diagnosed as no rejection have mild molecular antibody-mediated rejection-related changes. J. Heart Lung Transplant. 2022, 41, 334–344. [Google Scholar] [CrossRef]
- Halloran, P.F.; Potena, L.; Van Huyen, J.-P.D.; Bruneval, P.; Leone, O.; Kim, D.H.; Jouven, X.; Reeve, J.; Loupy, A. Building a tissue-based molecular diagnostic system in heart transplant rejection: The heart Molecular Microscope Diagnostic (MMDx) System. J. Heart Lung Transplant. 2017, 36, 1192–1200. [Google Scholar] [CrossRef]
- Suo, L.; Murillo, M.C.; Gallay, B.; Hod-Dvorai, R. Discrepancy Analysis between Histology and Molecular Diagnoses in Kidney Allograft Biopsies: A Single-Center Experience. Int. J. Mol. Sci. 2023, 24, 13817. [Google Scholar] [CrossRef]
- Randhawa, P. The MMDx® diagnostic system: A critical re-appraisal of its knowledge gaps and a call for rigorous validation studies. Clin. Transplant. 2022, 36, e14747. [Google Scholar] [CrossRef]
- Singh, D.; Singh, B. Investigating the impact of data normalization on classification performance. Appl. Soft Comput. 2020, 97, 105524. [Google Scholar] [CrossRef]
- Ribeiro, M.T.; Singh, S.; Guestrin, C. “Why Should I Trust You?”: Explaining the Predictions of Any Classifier. In Proceedings of the 22nd ACM SIGKDD International Conference on Knowledge Discovery and Data Mining, San Francisco, CA, USA, 13–17 August 2016; pp. 1135–1144. [Google Scholar]
- Lundberg, S.M.; Lee, S.-I. A unified approach to interpreting model predictions. Adv. Neural Inf. Process Syst. 2017, 30, 4768–4777. [Google Scholar]
Disclaimer/Publisher’s Note: The statements, opinions and data contained in all publications are solely those of the individual author(s) and contributor(s) and not of MDPI and/or the editor(s). MDPI and/or the editor(s) disclaim responsibility for any injury to people or property resulting from any ideas, methods, instructions or products referred to in the content. |
© 2024 by the authors. Licensee MDPI, Basel, Switzerland. This article is an open access article distributed under the terms and conditions of the Creative Commons Attribution (CC BY) license (https://creativecommons.org/licenses/by/4.0/).