Abstract
Oil detection technology improves the reliability of machinery or equipment. The physical and chemical indicators of the fluid can reflect the cause of the failure in various aspects, which can prevent major accidents to the greatest extent by setting up a fault tree. Owing to the lack of data, it is difficult to accurately obtain the basic event probabilities, which makes it difficult to diagnose faults. The expert evaluation method and aggregated fuzzy numbers are used to exact the failure probability, where the event probability is evaluated as the subjective will of the expert. To improve the probabilistic accuracy, weights are improved by the combined assignment method as well as the reasonableness analysis. A fault tree diagnostic model is constructed for qualitative and quantitative analysis, taking the ship engine oil viscosity high fault as an example. According to the results, the model can provide a comprehensive analysis of physical and chemical indicators. Experts’ own weights have a large impact on the failure probability, with their weight changes leading to a change in the failure ranking. From the discrimination, following a Bland–Altman analysis of the results, the selected combined empowerment method improved the discrimination of the results by 4.8% compared to the traditional method, with 100% data consistency, which proved that the improvement was reliable and effective. The structure of this fault diagnosis model is clear, which can quickly give the fault cause and probability reference value.
1. Introduction
In the daily management and safe operation of machinery and equipment, oil detection provides technical support for fault prevention and determination. For enterprises or individuals who often operate large machinery and equipment, while ensuring safety, they can avoid huge economic losses. Oil detection and analysis mainly includes spectroscopy, iron spectrum analysis, as well as conventional physical and chemical items. In the early days, oil detection focused on basic research, such as oil abrasive particle shape and size [1], motion trajectory, conventional physical and chemical indicators, etc. The analysis is biased towards microscopic aspects, such as elemental content and abrasive wear, which are only monitored from certain unilateral aspects, without a systematic fault analysis structure that would allow for a full analysis of the mechanical faults presented by the state of the oil. As technology developed, it began to be applied to fault detection [2] by combining spectroscopy with iron spectroscopy to determine mechanical faults. In terms of physical and chemical indicators [3,4], only a brief analysis of failure causes has been performed. For the systematic fault analysis of physical and chemical indicators in oil fluids and troubleshooting, there is a gap in the scientific research.
Fault tree analysis [5], as a commonly used fault diagnosis method nowadays, can systematize its faults by building trees. When building a fault tree in oil detection, it is difficult to obtain the probability of failure due to little or missing bottom event data. Even with partial data, most of the obtained failure probabilities are interval values. To adapt to reality, the precise treatment of event probabilities also becomes an issue.
The concept of “fuzzy sets”, introduced by Zadeh [6] in 1965, provided a pioneering idea for its analysis. Wu et al. [7] combined it with the fault tree analysis method, and Li et al. [8] improved its triangular fuzzy number and obtained good results. The lapse rates found above are all fuzzy intervals and are not aggregated. With the maturity of fuzzy set theory, Dong [9] used expert scoring index scores to calculate the experts’ own weights, for which the fuzzy solution yielded the exact value of the failure probability. The experts’ own weights are the arithmetic means of the scores of the indicators. AHP [10] was later applied to determine the experts’ own weights. M. Omidvari [11] improved AHP to analyze the failure probability in industrial installations. References [12,13] studied different domain experts to determine the weights, which were applicable to different domains with a large base of experts. With this development, the Z-number [14] concept was invoked, which can be used as a method to calculate the weights. The indicator measurement method [15] was proposed based on the expert elicitation method, which assigns weights to the evaluation indicators of experts. Among them, the AHP method and Z-number method, which are subject to individual subjectivity, belong to the subjective empowerment method due to the lack of an inherent discussion of the known data. There is less literature on experts’ own weights correction, and the indicator measurement method is based on statistical survey data. From the perspective of the objective correction of subjective combination empowerment [16], the indicator measurement is used for weight improvement and the precise treatment of fuzzy probabilities, and the rationality analysis is discussed. In order to perform fault analysis and prevent physical and chemical oil indicators, a fault tree analysis model based on the improved expert’s own weight and the aggregated fuzzy number is established. The model framework contains the qualitative analysis of fault trees, exact processing of fault probabilities, and quantitative analysis of fault trees under exact probability values. This model fills the gap in the study of the systematic failure analysis of physical and chemical indicators of oil fluids. The rational analysis of the weights refines its traditional steps. It is significant in the failure analysis of physical and chemical indicators of oil fluids.
2. Improving the Construction of Expert’s Own Weight–Aggregate Fuzzy Number Fault Tree Diagnosis Model
2.1. Fault Tree Creation and Qualitative Analysis
Fault tree is a model for the systematic analysis of faults. It consists of top event, middle event, bottom event, and logic gates; commonly used logic gates are “or gate,” “with gate”, and so on. Fault trees are built layer by layer, with downward derivation from the top event for approximate fault classification, also called intermediate events, and then recursive derivation from the intermediate events to each bottom event. When performing fault tree building, there should be a clear logic and no logical contradictions, considering every cause of failure in order to prioritize events regardless of the probability of failure. Events must be accounted for when conditions require it.
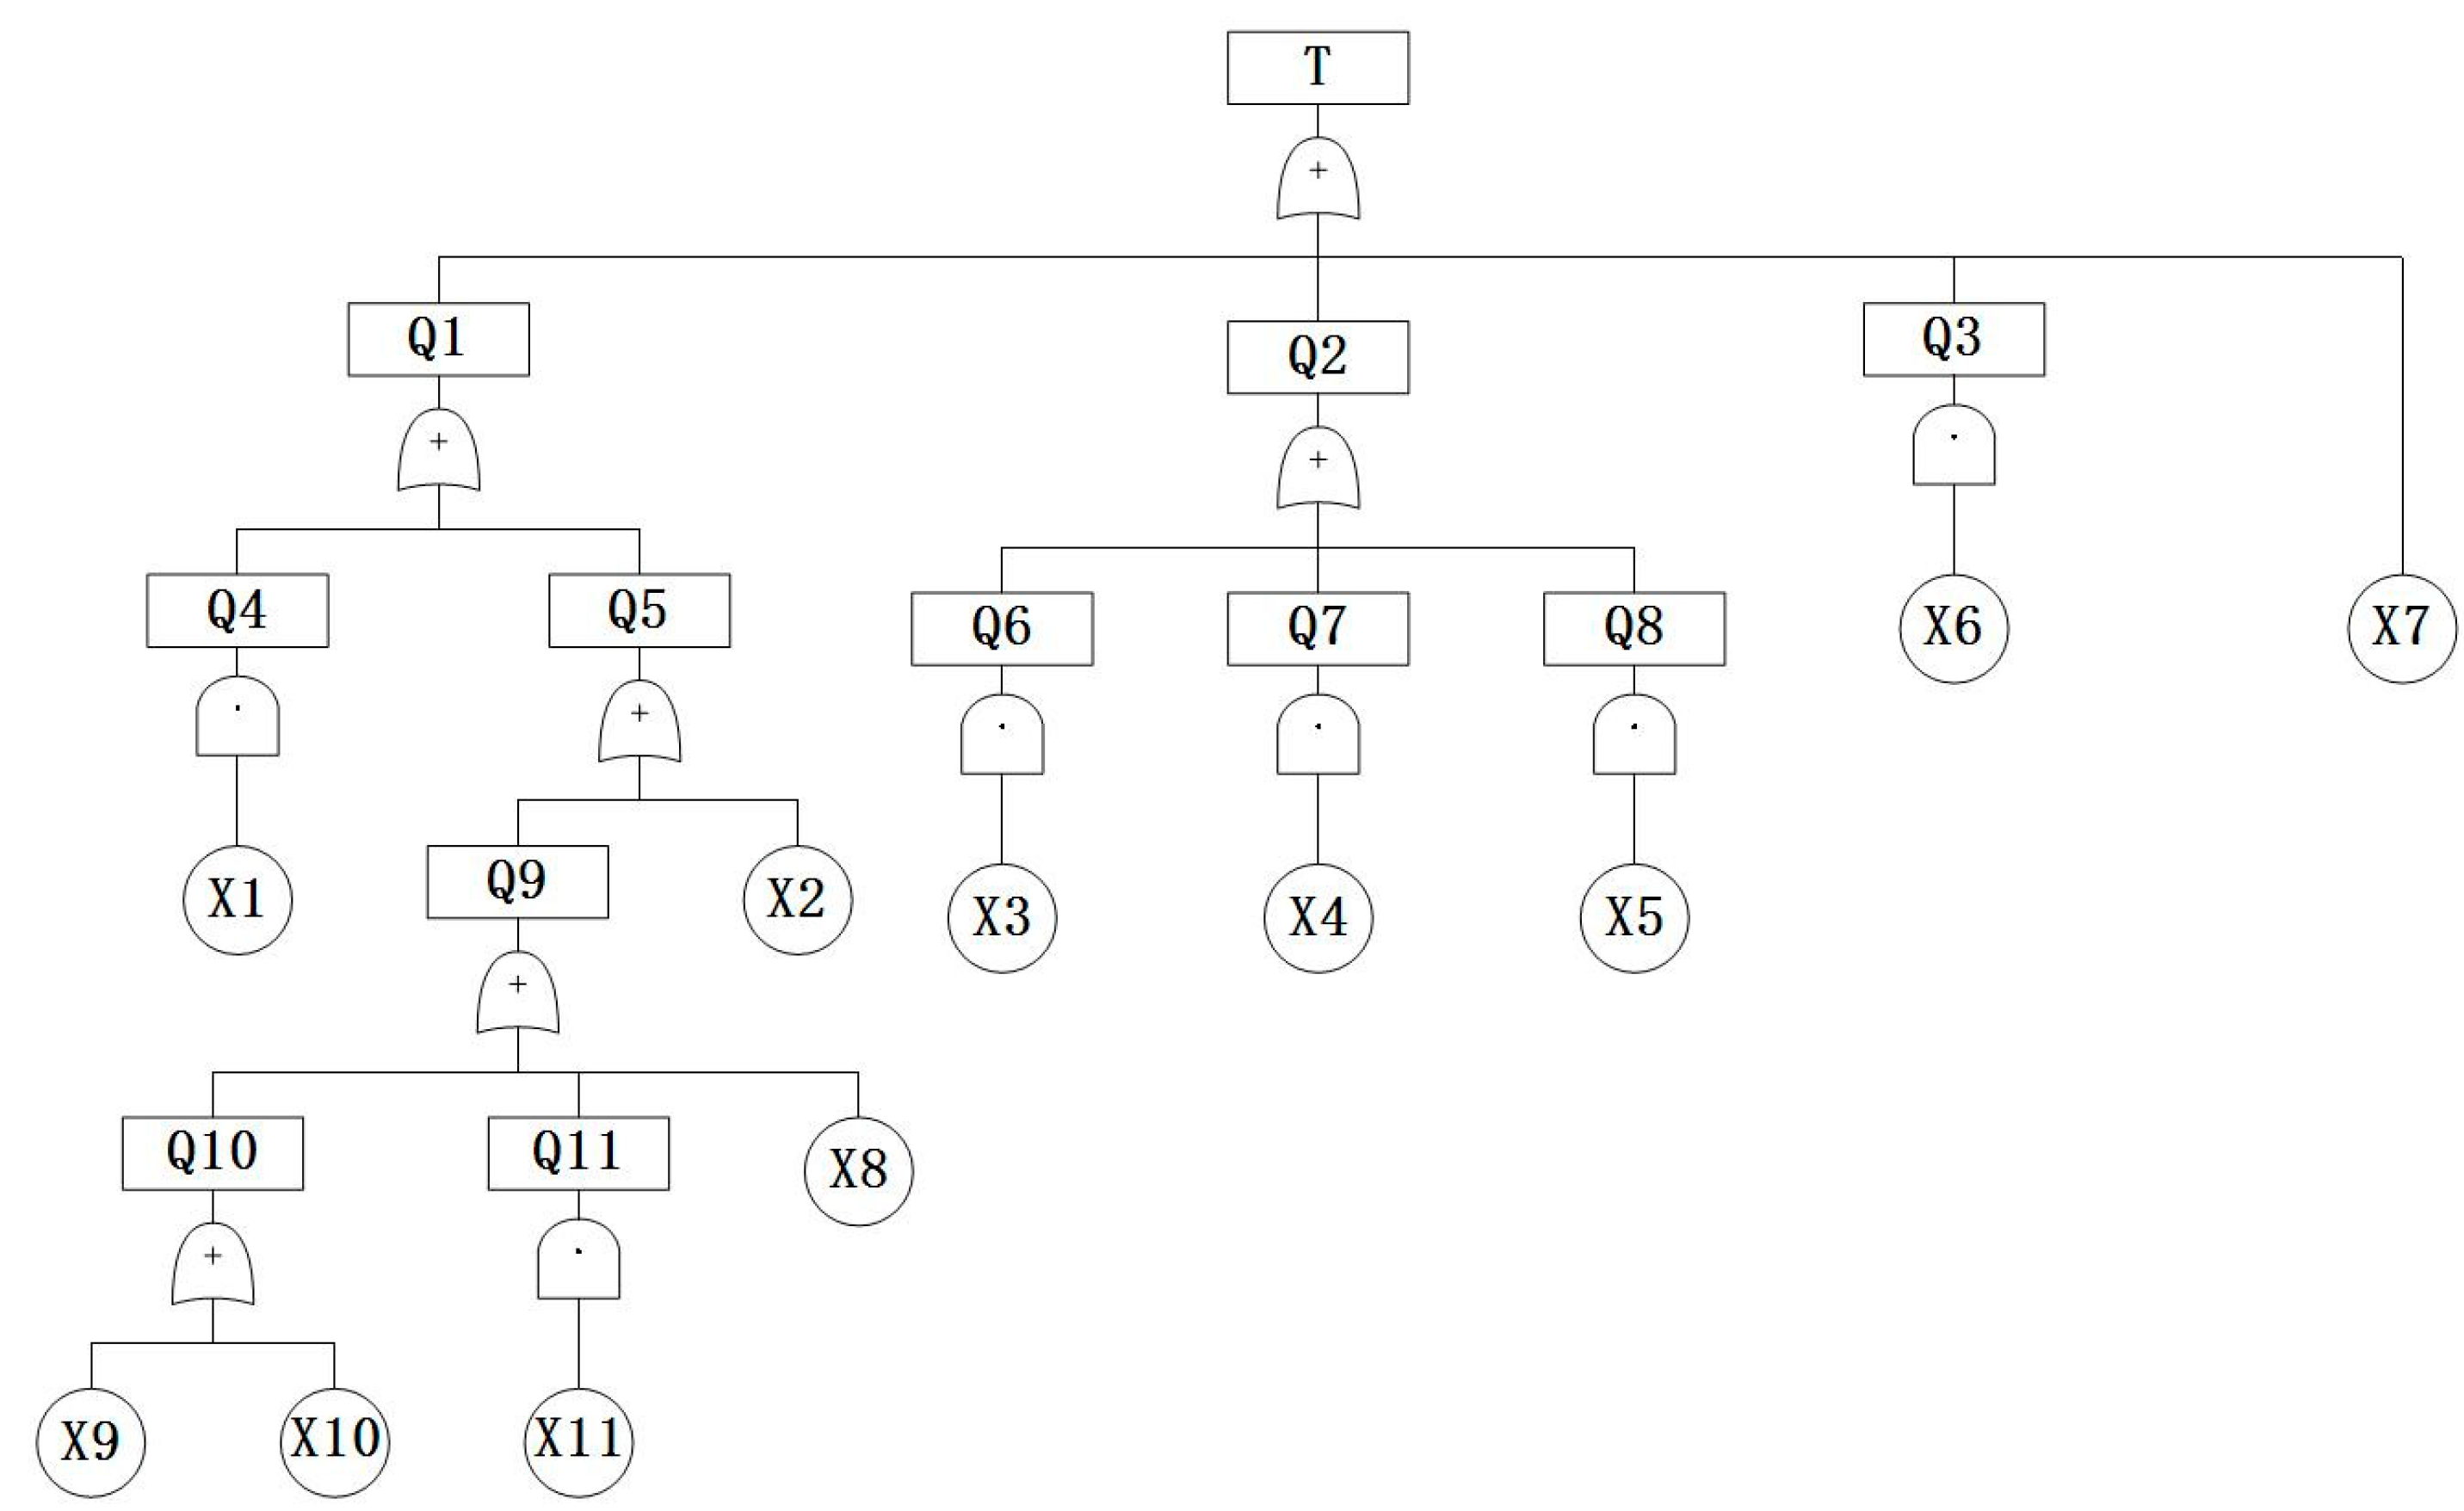
The fault tree constructed in this way has a better fault-sorting vein, which can visually present the causes and parts of the fault, and also provide a comprehensive and visual description of the causes of the fault and various logical relationships. After completing the fault tree, it needs to be analyzed qualitatively, which is the first step of fault diagnosis. The purpose of the qualitative analysis is to determine the minimum cut [17] set, which finds the minimum set of events that could cause the top event failure. It is usually derived by the downstream method [18]. Among the routine physical and chemical items of ship oil inspection, the high viscosity of the engine oil was selected as the object, and the fault tree was established by combining information and expert guidance. Table 1 shows the event table of the fault tree of the high viscosity of ship engine oil, and Figure 1 shows the fault tree of the high viscosity of ship engine oil.

Table 1.
High-viscosity marine engine oil fault tree event table.
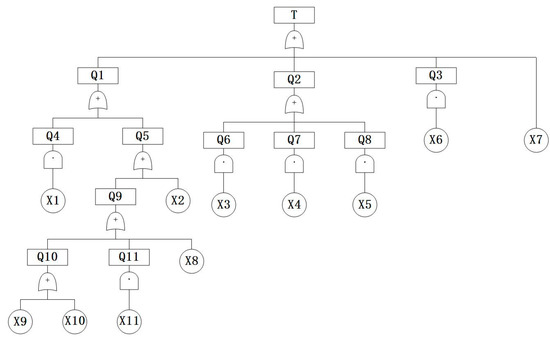
Figure 1.
Fault tree of the high viscosity of marine engine oil.
The minimum cut set of the high-viscosity marine engine oil fault tree established from Figure 1 is {X1}, {X2}, {X3}, {X4}, {X5}, {X6}, {X7}, {X8}, {X9}, {X10}, {X11}.
2.2. Experts’ Own Weights
Experts’ own weights have a large impact on the bottom event failure rate, which needs to be rationalized. There are three types of methods to determine the weights: the subjective assignment method, objective assignment method, and combined assignment. The main methods of the former are AHP (hierarchical analysis), Delphi method [19,20], binomial coefficient method [21], indicator assignment method, etc., which are subjective cognitive judgments of decision makers without considering the relationship between data. For the subjective assignment method of establishing weights, experts often play the role of decision maker to make subjective judgments and to give weights to the data, but the experts themselves cannot be accurately assigned when evaluating their weights, and the indicator assignment method is one of the methods that can assign weights to them. Objective assignment methods include the entropy value method [22], CRITIC assignment method [23,24], and standard deviation method [25]. In contrast to the subjective assignment method, which focuses more on the intrinsic data linkage between indicators to determine the weights, the disadvantage is that it cannot be used when there is little or missing data. Combinatorial assignment uses different mathematical methods to combine subjective and objective assignments, or to objectively modify the subjective assignments.
The indicator measurement method is a weighted judgment that sets measurement indicators, which is divided into two layers: the indicator layer and the judgment layer. The indicator layer is established for the weighting of the set indicators using a questionnaire scoring survey. The judgment layer uses the known information to formulate the scoring criteria and methods of indicators, and finally uses the comprehensive information to determine the weight. The index measurement method is used to set expert-level indexes for experts’ academic attainments, titles and professional ethics, and to rate a number of experts. These indicators were chosen because of the openness and scientific nature of the indicators. The experts’ personal academic information is freely available, and the professional ethics evaluation is also published annually via the school’s official website and other channels. The academic attainments are mainly experts’ research results and awards, and the titles include school titles and their own qualifications. Secondly, the professional ethics can be seen from perspective of the degree of importance that experts attach to them, which directly affects their judgment of the subsequent bottom event failure rate, Because the importance of indicators is not affected by time and space, there is a certain difference, so the total score of the three indicators is set to 10 for scoring questionnaires; the set score range is usually [0, 100]. The ratio of the survey score to the total score is the weight of the expert-level indicator, and the sum of the weights of all indicators is 1. The criteria and grades are set for the indicators. Table 2 shows the weight ratio of expert-level indicators calculated by the questionnaire, and Table 3 shows the expert indicator judging criteria.
Table 2.
Weighting ratio of expert-level indicators.
Table 3.
Expert indicator judging criteria.
According to Table 3, each expert situation is first scored and combined with the expert-level index weights to obtain the comprehensive level score.
where F is the comprehensive level score, f is the evaluation score corresponding to the expert-level index, and Es is the weight value of the s-th expert-level index.
The expression for the calculation of the expert’s own weight is:
where Zj is the index measurement method of the expert’s own weight and m is the number of experts.
In Equations (1) and (2), it can be seen that the comprehensive expert-level scores are obtained by linear weighting, the expert-level index weights and evaluation scores directly affect the experts’ own weights, and the reasonableness of the data needs to be improved.
2.3. Improving and Justifying the Combination Assignment to the Experts’ Own Weights
The evaluation of experts has a large impact on the probability results of bottom events, and the assignment of traditional experts’ own weights only considers subjectivity but ignores objectivity, so the best assignment scheme should be a combination of subjective and objective weighting in order to obtain results that are in line with the actual situation. Using the indicator level questionnaire data and the subjective data of expert ratings in the judgment level of the indicator assessment method as the basis, the CRITIC assignment method is used to correct the experts’ own weights. The CRITIC assignment method assigns weights from two aspects: one is the standardized difference comparison between evaluation objects under the same evaluation index, and the other is the conflicting comparison between evaluation indexes. It is important to note that the evaluation indicators and evaluation objects selected in the indicator layer differ from those in the judgment layer. The indicator layer takes the expert-level indicators as the evaluation indicators and each questionnaire item as the evaluation object, while the judgment layer takes the experts themselves as the evaluation indicators, and the evaluation objects are the evaluation scores of the expert-level indicators, with the weights obtained being the evaluation indicator weights.
The CRITIC assignment method is used to calculate the weights, and the data are first dimensionless, with u evaluation indicators and v evaluation objects; Lij is the initial value of the i-th evaluation object in the j-th evaluation index, and the data are subjected to positive indexing.
where Mmax is the maximum value of Lij, Mmin is the minimum value of Lij, and is the value after dimensionless processing.
Afterwards, the expression for the amount of information is obtained.
where Cj is the amount of information, is the standardized difference of the evaluation index, and rkj is the correlation coefficient between the k-th and j-th evaluation indexes.
Finally, the expression of indicator weight Hj of the CRITIC empowerment method is derived.
The selection of combination assignment should satisfy three principles: first, it has subjective and objective merits; second, the merits are explanatory (its own weights should be biased towards subjective weights, and the data sought should be biased towards objective weights); finally, it should not be blindly overcomposed. Based on these three principles, two methods of the objective correction of the subjective combination of the assignment method to seek the expert’s own weight, in order to carry out the data comparison method, are as follows:
- (1)
- Combined assignment method I: Firstly, the evaluation index questionnaire data is used to derive the expert-level index weight by the CRITIC assignment method. This weight is used to weight the expert rating data, and then the final weight is obtained by the CRITIC assignment method. Because there are two layers of data, the subjective data is objectively corrected twice, and the overall approach is close to the objective assignment method.
- (2)
- Combined assignment method II: Combinatorial weighting method II: Combinatorial weighting method I and the expert-level indicator weights of the index measurement method are combined and weighted using the principle of minimum discriminative information [26] to obtain their weights, and then the weights are used to weight the expert rating data. The experts’ own weights are calculated using the CRITIC weighting method, and finally the weights are combined and weighted again with the experts’ own weights of the index measurement method. The weights obtained by this method were also corrected for two levels of data.
Let and be the subjective and objective weights of different methods, Wj is the combined weights, and the formula of the combined weighting method based on the principle of minimum discriminative information is:
The rationality of the combined weights is studied by defining the weight deviation ε, the maximum value of the weight deviation λ, and the weight distortion rate η. ε is the difference between subjective weights and other weights. Because the subjective weights represent the public’s opinion, it would be set as the benchmark; the ratio of the sum of the weights to the number of evaluation indicators u is the maximum value of the deviation of the weights, as well as the average value of the evaluation indicator weights, where the sum of the weights is usually set to 1. When using other assignment methods and subjective assignment methods to obtain the same evaluation indicator weights, if ε > λ, then there may be a situation where the evaluation indicator weights are equal to 0, which is contrary to reality; this is the basis for the setting of λ. Using the weight distortion rate η for the reasonableness analysis of the combination weights, the smaller the combination weights, the higher the credibility.
where usz is the number of distortions of evaluation index weights.
The experts in this research field are fewer, and five are selected as experts in the same field with serial numbers A1, A2, A3, A4 and A5. The data survey is processed through Table 2 and Table 3, and Table 4 and Table 5 are different assignment methods to calculate the weight of five expert-level indexes and the experts’ own weights of the three methods, respectively.
Table 4.
Expert-level indicator weights for the three methods.
Table 5.
Experts’ own weights for the three methods.
In Table 4, for the three methods of expert-level indicator weights, in the same order, academic attainment > job title > professional ethics; λ is 1/3, ε is in range, and there is no distortion. In Table 5, λ = 0.2; for the combined assignment method I and the indicator measurement method obtained by the experts themselves, the weight comparisons ε are 0.153, 0.125, 0.201, 0.117, 0.056, indicating the weight distortion of expert A3, and η is 20%. There is no distortion in the expert’s own weight obtained by the combined assignment method II, and it is more reasonable than the combined assignment method I. Despite the data analysis of the combined assignment method relative to the subjective assignment method, it cannot be determined from this point that the combined assignment method is superior to the subjective assignment method, and a final judgment of the derived data under the weights of the different method experts themselves is needed, such as a better differentiation of the bottom event failure rate.
2.4. Improving Quantitative Analysis of Expert’s Own Weight–Aggregate Fuzzy Number Fault Trees
In order to perform an accurate processing and quantitative analysis of fault tree event probabilities, the following steps are listed:
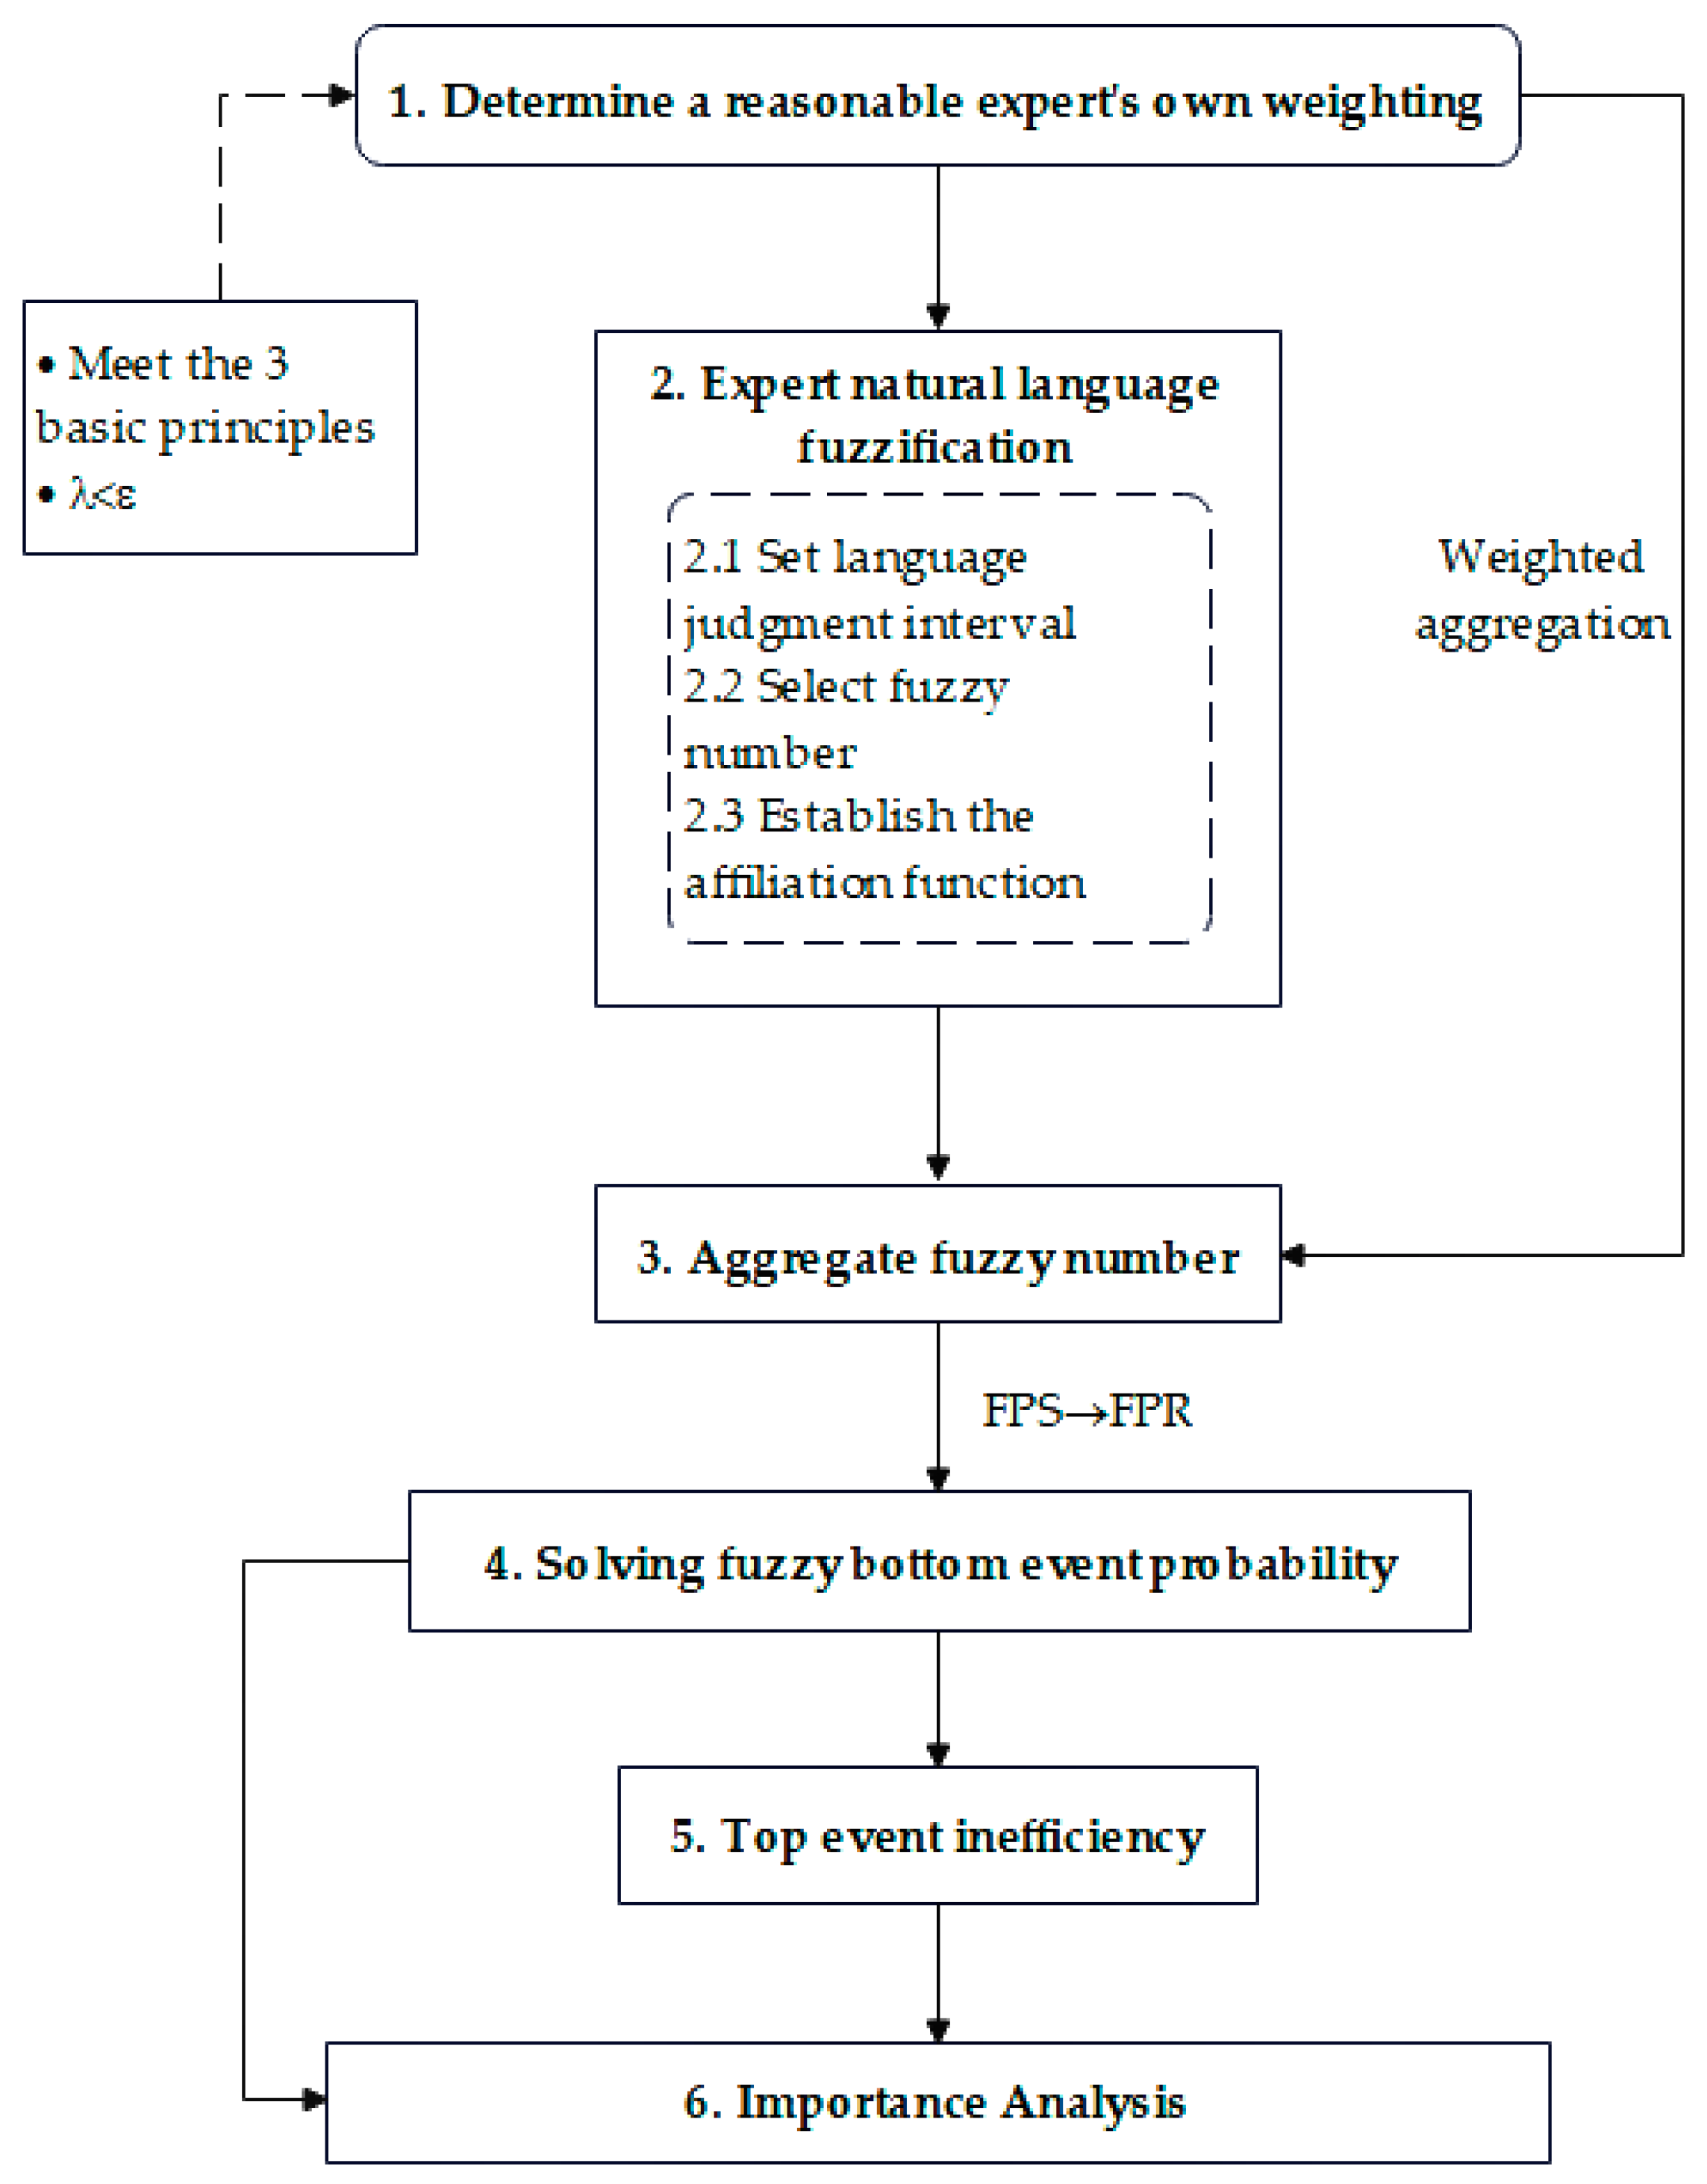
Step 1: Confirm whether the experts’ own weight settings are reasonable and if they can satisfy the three principles.
Step 2: Fuzzification of expert natural language, where the bottom event failure rate is evaluated by a fuzzy representation of the expert’s natural language judgment of the event, by establishing seven judgment intervals for natural language event probabilities: very small (VS), small (S), small (NS), medium (M), large (FL), large (L), and very large (VL). For the selection of fuzzy numbers [27], a combination of triangular fuzzy numbers and trapezoidal fuzzy numbers is used. The fuzzy number is expressed by the affiliation function. In this case, the triangular fuzzy number is a special case of trapezoidal fuzzy number, and the combination can be used for better fault description. The fuzzy interval setting is subject to subjective influence, making it difficult and meaningless to be precise.
Step 3: Aggregation of fuzzy numbers. Weighted aggregation of mostly natural language by experts for a given bottom event failure rate. Obtain the average number of blurs for a given bottom event.
Step 4: Solve the fuzzy bottoming event failure rate. Chen [28] proposed a fuzzy left–right ranking method that could make the fuzzy numbers exact.
Step 5: Calculate the top event [29] failure rate.
Step 6: Compute the critical importance [30] of the bottom event. Derived from the bottom event and top event failure rates, it is decisive for fault determination and sequencing.
Overall, this is a process of transformation from fuzzy to non-fuzzy. However, the definition of vagueness is again influenced by human subjectivity, indicating the importance of the confirmation of the experts’ own weights.
Through the above steps, the flow chart of the quantitative fault tree analysis of the model can be drawn, as shown in Figure 2.
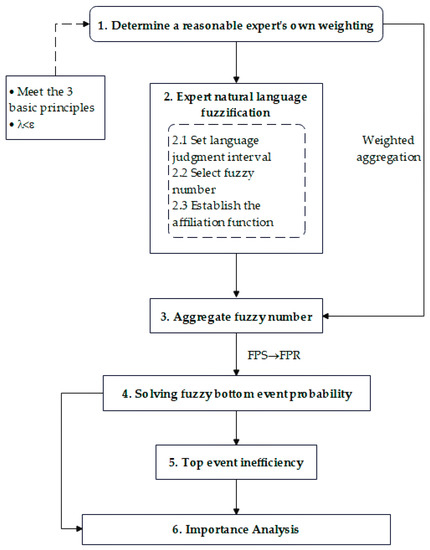
Figure 2.
Quantitative analysis of improved fault tree model.
Once our model is built, the failure analysis can be performed. The linguistic descriptions of the experts for each bottom event are collected and, following the model steps, Table 6 is obtained, including the quantitative analysis data for the three methods.
Table 6.
Quantitative fault tree analysis data for three methods.
Table 6 lists three techniques for obtaining data for high-viscosity ship oil testing fault analysis. Failure analysis should be given top priority for the failures X11 (excessive cylinder liner/piston ring wear), X9 (too many machines), and X8 (poor combustion), which have higher failure rates and importance. The most significant bottom event is the cylinder liner/piston ring wear being too large, which is caused by a constant reciprocating friction state as well as working conditions, temperature, and a variety of other factors. The lubricant and its direct contact influence the removal of the wear particles; prolonged use will cause a rise in viscosity; the outcomes are accurate. X3 (fuel system failure), X4 (severe emulsification of lubricating oil), X5 (cylinder Oil Leakage), X6 (high-viscosity slip oil is used) and other failure rates are lower and less than 1% importance. X4 is the least important (0.000024) because the engine is the core component, the water will lead to serious accidents, and the possibility of serious emulsification of the slip oil is the lowest, being almost negligible. Combined with the fault tree, for intermediate events, the highest importance is assigned to the aging, deterioration, or unnatural oxidation, since engine oil viscosity should be the first analysis.
In particular, for the same bottom event, the bottom event probability varies more with the experts’ own weights using different methods. For bottom events with small probability, such as X4 and X6, the bottom event failure rate fluctuates more than 50 percent, indicating a large impact. In practical fault determination, we often use importance to rank. The improved approach raises the importance of certain major fault events, which allows for more rapid fault determination.
3. Analysis and Discussion
3.1. Consistency Analysis
Since the data were obtained by improving the traditional subjective weights, in order to verify their validity, the requested experts’ own weights and bottom event failure rates were analyzed by the Bland–Altman consistency evaluation measurement in MedCalc software for the combined weighting method and the traditional indicator evaluation method.
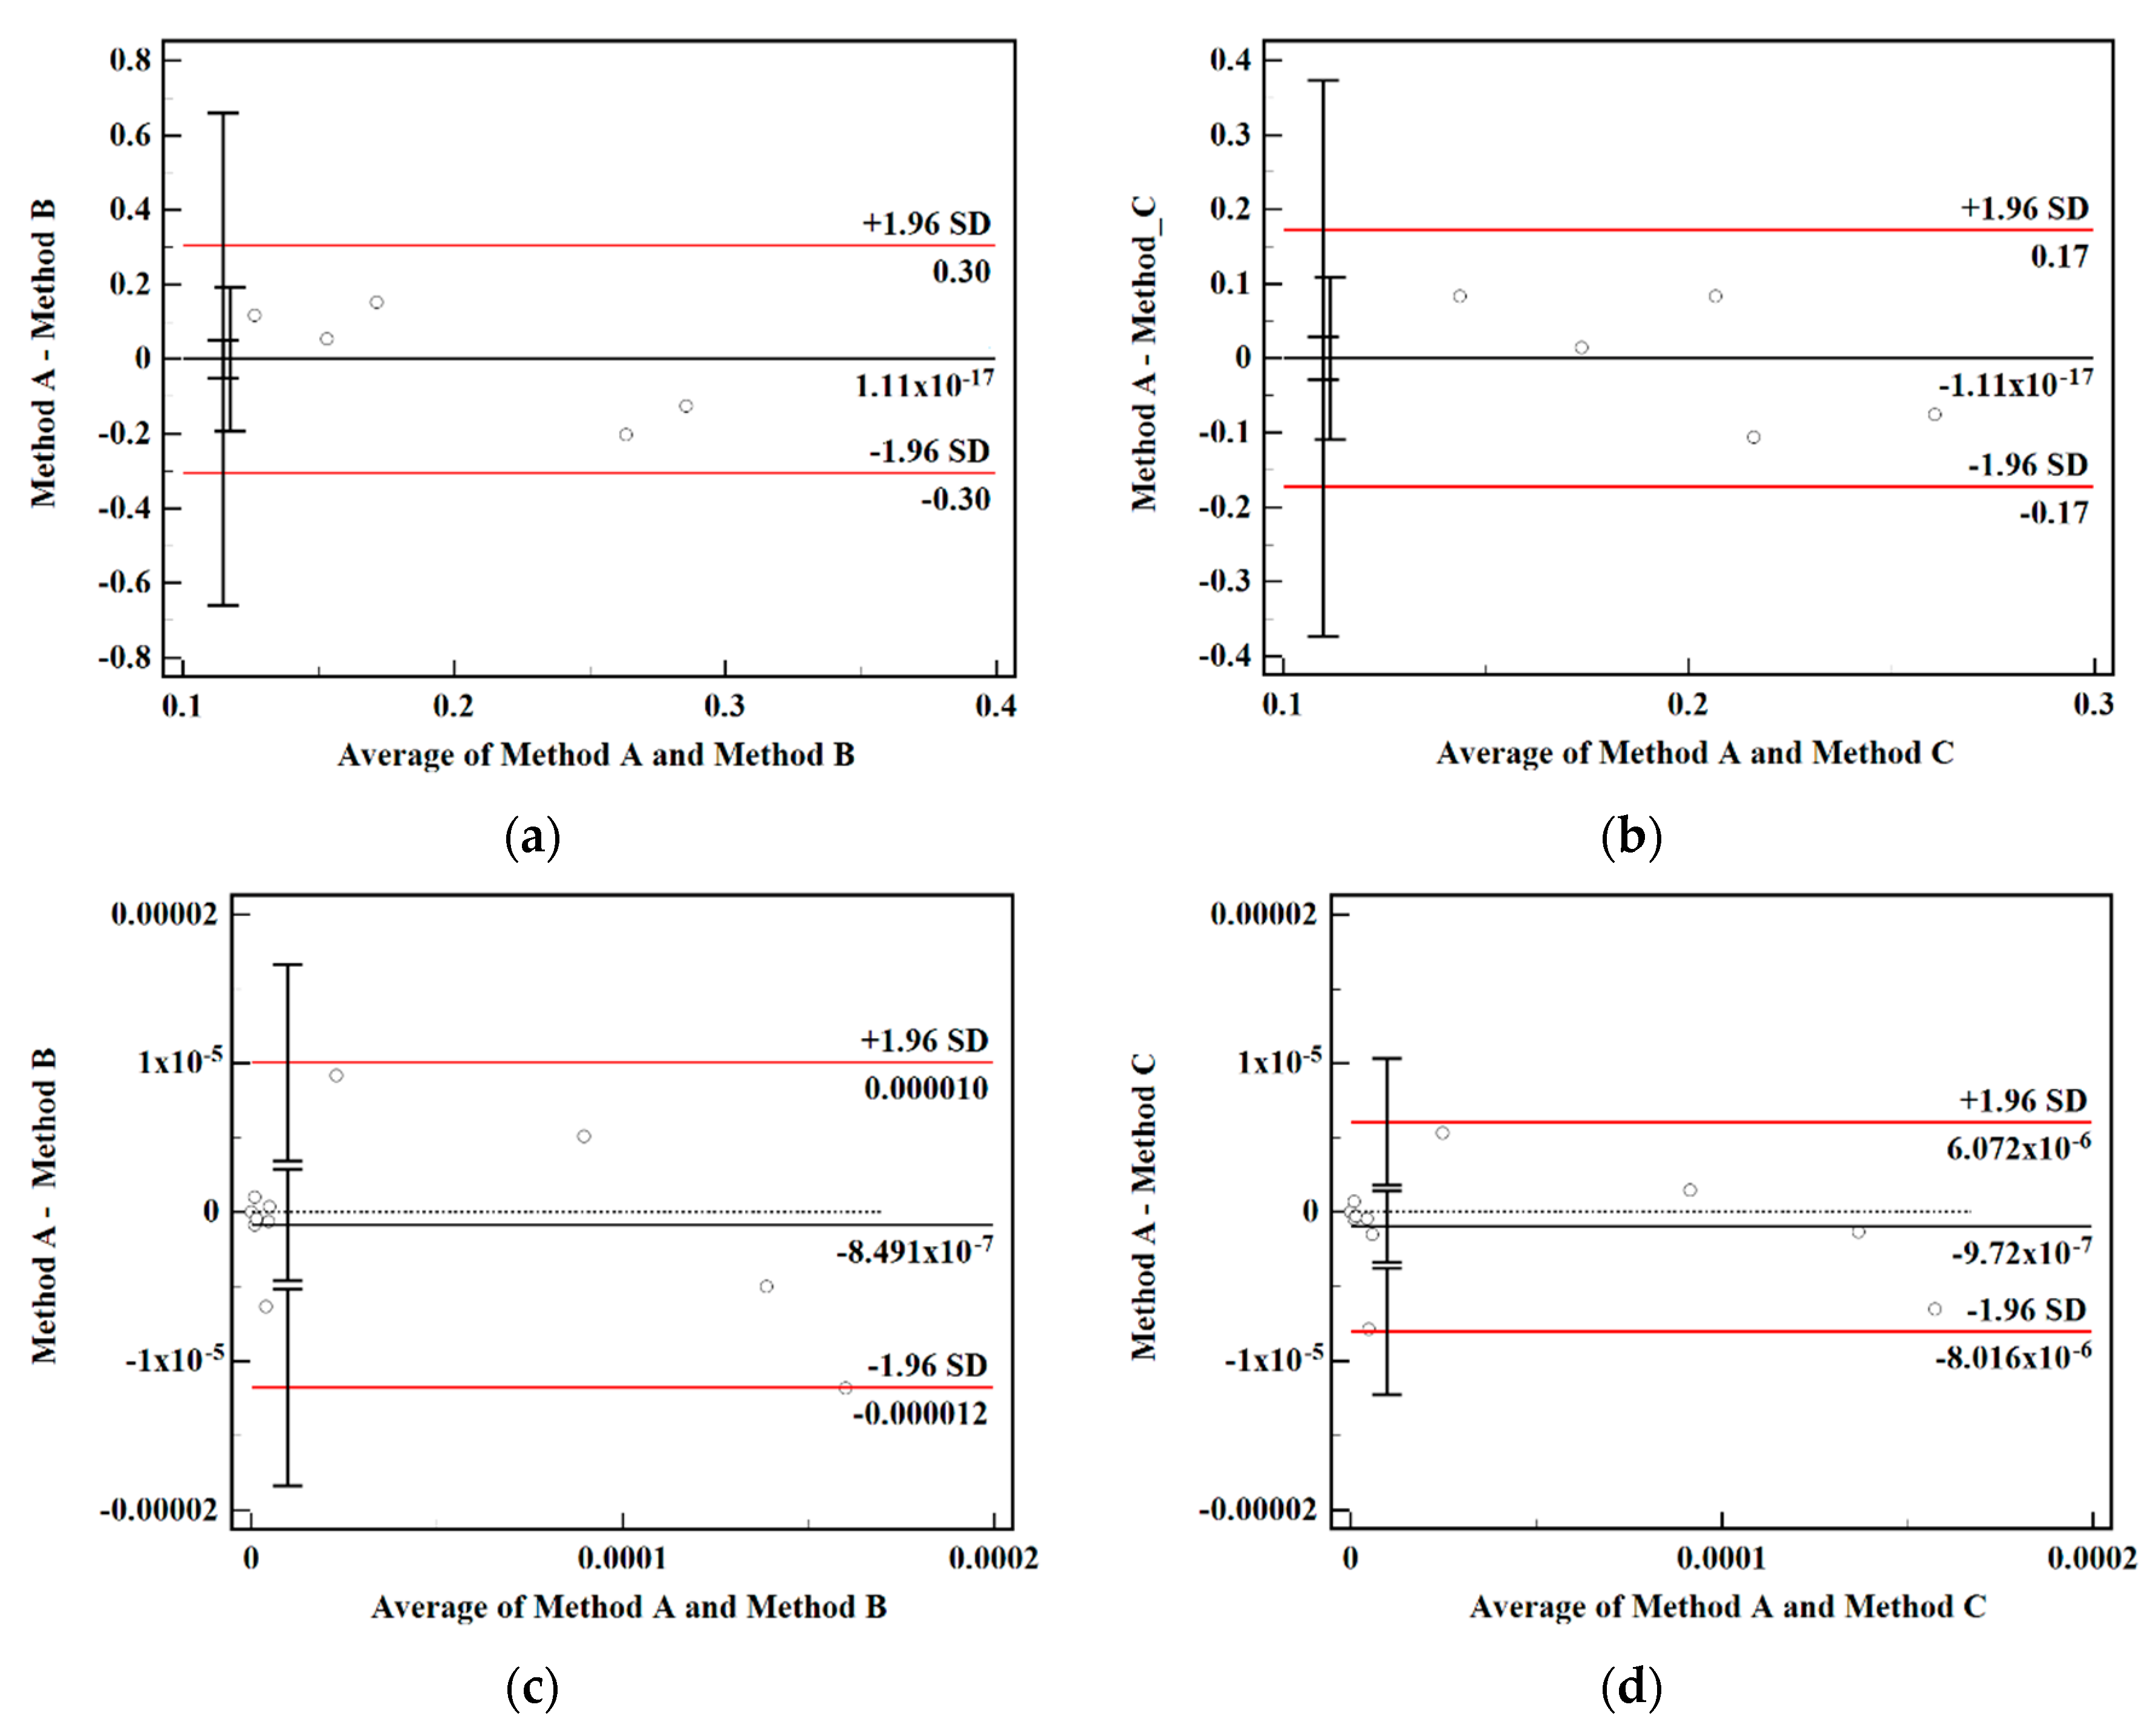
The Bland–Altman plot can most intuitively reflect the consistency of different methods for the results. The horizontal and vertical axes are the mean and the difference between the two groups of data, 95% of the difference is set as the consistency interval, and the range is 1.96 times the standard deviation of the difference; if the point falls within its range, then there is consistency. Method A, Method B, and Method C were set to correspond to the indicator measurement method, the combined assignment method I and the combined assignment method II, and Figure 3 shows the consistency analysis of the combined assignment method relative to the subjective assignment method.
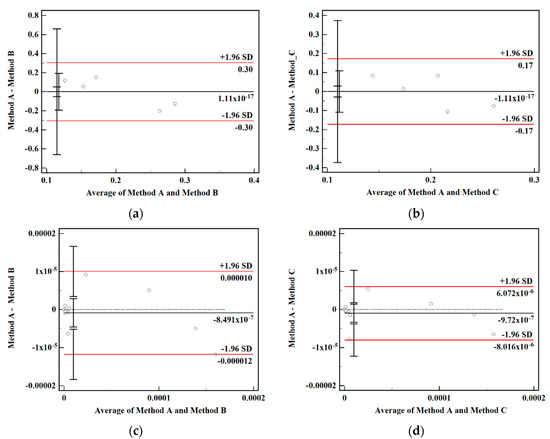
Figure 3.
Consistency analysis among methods. (a) Consistency analysis of experts’ own weights for Method A and Method B. (b) Consistency analysis of experts’ own weights for Method A and Method C. (c) Bottom event failure rate consistency analysis of Method A and Method B. (d) Bottom event failure rate consistency analysis of Method A and Method C.
In the consistency analysis, 85% is usually used as the threshold, above which indicates better consistency of the data. In Figure 3a, although there are distortions in the individual experts’ own weights in the combined assignment method I, the overall consistency is good, and the consistency of the data is Figure 3b is 100%. In Figure 3c, for the consistency analysis of the bottom event failure rate of the combined assignment method I and the traditional indicator assessment method, (10/11) points fall within the 95% confidence interval, and the consistency of the bottom event failure rate data is 90.9%. All the points of the indicator assessment method and the combined assignment method II in Figure 3d are within the interval, and the data consistency is 100%. Using the arithmetic average method to combine the experts’ own weights with the lapse rate consistency data, the combined assignment method I and the combined assignment method II were 95.45% and 100%, respectively, indicating that the experts’ own weights of the combined assignment method II combined the advantages of subjective and objective weights, respectively, the consistency of the weights and lapse rate data was higher, and the data were valid.
3.2. Differentiation Analysis
When the data are large and heterogeneous, the differentiation analysis is a reliable and comprehensive way to evaluate and compare the results obtained by the improved method, and the greater the differentiation, the better. Due to the uncertainty of the experts’ own weights, the differentiation analysis is meaningless, and the derived data under different method assignments can be used to indirectly compare the advantages and disadvantages between methods. The adjacent logarithmic deviation method [31] is used to calculate the differentiation D for the results of the three methods, and the failure rate of each bottom event is first ranked from smallest to largest before calculation.
where gN and g1 are the maximum and minimum failure rates.
Table 7 shows the differentiation of the bottom event failure rate obtained by the three methods.
Table 7.
Three methods of bottom event failure rate differentiation.
From the perspective of differentiation, the highest differentiation is found in the combined assignment method I, which tends to be objective and better than the indicator measurement method in terms of data processing, followed by the combined assignment method II, whose differentiation is 7.5% and 4.8% higher than that of the indicator measurement method, but there is a certain degree of distortion in the weights of the combined assignment method I. The difference in the weights of experts in the same field is too large, and the comprehensive consistency analysis data is lower than that of the combined assignment method II. The combined assignment method II is the best method, and the requested distortion rate is reliable and valid. Through example analysis, this fault diagnosis and analysis model is suitable for systems with more complex, dispersed and less regular causes of faults, and has good results.
The improvement of the experts’ own weights enables the better differentiation of faults to be judged, and the results prove that the establishment of the experts’ own weights is quite important in this fault diagnosis system, which is often overlooked, but can have a great effect on fault determination and analysis, with great research significance. Since there is less research on experts’ own weights, their methods can still be studied in depth, and the establishment of weights, which is more extensive, is not possible in all aspects. In this paper, only the most important factors are mentioned, and there are some potential factors affecting the accuracy of this analytical model that have not yet been discovered, after which certain factors and steps can be further explored, such as weighted aggregation and combined weighting.
4. Conclusions
- (1)
- By establishing a fault tree model for oil detection with improved experts’ own weight–aggregate fuzzy number, the causes of high oil viscosity in marine engines are systematically described. The top event failure rate is 4.34 × 10⁻⁴ and the main reason is excessive cylinder liner/piston ring wear. Using the expert’s own weight as the key entry point, we explore its influence between the fault probability accuracy and the fault ranking. When an expert’s own weight changes, the failure rate and importance ranking of its faults change accordingly. Improving the expert’s own weight not only enables one to make fast fault identification judgments, but also makes it easier to distinguish faults. In order to increase the accuracy of fault probability judgment, not only are the weights assigned by subjective–objective combination, but also the weight reasonableness analysis is invoked to set the weight reasonableness interval. This systematic study of the physical and chemical indicators of oil fluids fills its research gap, as well as the assignment of subjective and objective combinations, which are also defined and explained.
- (2)
- It is easy to see from the similar literature that the values obtained in most of the methods to find the experts’ own weights appear to be arbitrary and not rigorous. In some articles, a rigorous and detailed discussion is not carried out, leading to a loss of credibility in the subsequently sought failure probabilities. A simplified fault tree is used in this model, which allows future additions to be made to the cause of failure without affecting the system.
- (3)
- In the fault diagnosis analysis, the model method is less computationally intensive, highly practical and has a wide range of applications, providing part of the reference data for future online fluid fault detection.
Author Contributions
Conceptualization, J.S. and H.W.; methodology, J.S.; software, J.S.; validation, J.S.; formal analysis, J.S.; investigation, J.S. and H.W.; resources, J.S.; data curation, J.S.; writing—original draft preparation, J.S.; writing—review and editing, J.S.; visualization, J.S.; supervision, H.W.; project administration, H.W.; funding acquisition, H.W. All authors have read and agreed to the published version of the manuscript.
Funding
Shanghai Ship Intelligent Operation and Maintenance and Energy Efficiency Monitoring Engineering Technology Research Center” (20DZ2252300) funded by Shanghai Science and Technology Program.
Data Availability Statement
For certain privacy reasons, the data is kept private.
Conflicts of Interest
The authors declare no conflict of interest.
References
- Bill, W. Wear debris analysis group (1982–84). Ind. Lubr. Tribol. 1994, 46, 3–4. [Google Scholar]
- Jiang, F.X.; Qiu, Z.H.; Zong, Y. Air Compressor Wear Condition Monitoring Based on Oil Analysis Technology. Appl. Mech. Mater. 2011, 1326, 66–68. [Google Scholar] [CrossRef]
- Bengiamin, N.N.; Bowen, B.A.; Schenk, K.F. Fault tree analysis—An efficient reduction algorithm. Microelectron. Reliab. 1976, 15, 47–53. [Google Scholar] [CrossRef]
- Fabian, C.H.; Hock, S.T. Modified fault tree analysis for structural safety. Civ. Eng. Environ. Syst. 1989, 6, 190–199. [Google Scholar]
- Su, X.P.; Yang, C.Y.; Wu, X.S.; Yang, G.; Xiao, H. Fault Tree Analysis and Program Implementation Based on Grey Relational Theory. Chin. J. Eng. Mach. 2010, 8, 461–465. [Google Scholar]
- Zadeh, L.A. Fuzzy sets. Inf. Control. 1965, 8, 338–353. [Google Scholar] [CrossRef]
- Wu, Z.; Shi, Z.; He, X.G. Fault tree analysis method based on fuzzy set theory and its application. Syst. Eng. Electron. Technol. 2000, 9, 72–75. [Google Scholar]
- Li, Q.; Lu, T.J.; Li, N.P.; Zhang, Y.Z. Fuzzy fault tree analysis of triangular fuzzy number and its application. J. China Univ. Min. Technol. 2000, 1, 56–59. [Google Scholar]
- Dong, Y.H.; Yu, D.T. Estimation of failure probability of oil and gas transmission pipelines by fuzzy fault tree analysis. J. Loss Prev. Process Ind. 2005, 18, 83–88. [Google Scholar]
- Zhang, P.; Qin, G.J.; Wang, Y.H. Risk Assessment System for Oil and Gas PipelinesLaid in One Ditch Based on Quantitative RiskAnalysis. Energies 2019, 12, 981. [Google Scholar] [CrossRef]
- Omidvari, M.; Lavasani, S.M.; Mirza, S. Presenting of failure probability assessment pattern by FTA in Fuzzy logic (case study: Distillation tower unit of oil refinery process). J. Chem. Health Saf. 2014, 21, 14–22. [Google Scholar] [CrossRef]
- Rajakarunakaran, S.; Kumar, A.M.; Prabhu, V.A. Applications of fuzzy faulty tree analysis and expert elicitation for evaluation of risks in LPG refuelling station. J. Loss Prev. Process Ind. 2015, 33, 109–123. [Google Scholar] [CrossRef]
- Yazdi, M.; Nikfar, F.; Nasrabadi, M. Failure probability analysis by employing fuzzy fault tree analysis. Int. J. Syst. Assur. Eng. Manag. 2017, 8, 1177–1193. [Google Scholar] [CrossRef]
- Yazdi, M.; Hafezi, P.; Abbassi, R. A methodology for enhancing the reliability of expert system applications in probabilistic risk assessment. J. Loss Prev. Process Ind. 2019, 58, 51–59. [Google Scholar] [CrossRef]
- Feng, Z.C.; Li, Q. Methods and Models for Determining Expert Weights in Scientific Research Project Evaluation. Sci. Technol. Manag. Res. 2000, 4, 47–50. [Google Scholar]
- Gang, L.; Li, J.P. Study on the combination of subjective and objective weights and its rationality. Manag. Rev. 2017, 29, 17–26+61. [Google Scholar]
- Udie, S.A.; Abdulameer, K.A.; Maithem, H.R. Construction of a fault tree for Physical mixed Systems using logical gates associated with algebraic expression of top event via Boolean algebra rules to determine minimal cut sets for the system. Math. Theory Model. 2014, 4, 66–73. [Google Scholar]
- Wei, X.P.; Bian, S.T. Fault tree analysis method and its application. Reliab. Environ. Test Electron. Prod. 2004, 3, 43–45. [Google Scholar]
- Varela, C.; Domingues, L. Risks of Data Science Projects—A Delphi Study. Procedia Comput. Sci. 2022, 196, 982–989. [Google Scholar] [CrossRef]
- Lei, B.; Janssen, P.; Stoter, J.; Biljecki, F. Challenges of urban digital twins: A systematic review and a Delphi expert survey. Autom. Constr. 2023, 147, 104716. [Google Scholar] [CrossRef]
- Liu, Q.Y.; Wu, X.N. Review on the Methods of Determining Index Weights in Multi factor Evaluation. Knowl. Manag. Forum 2017, 2, 500–510. [Google Scholar]
- Zhang, C.; Han, F.; Wu, Y.; Huang, J.; Zeng, R.; Lin, D.; Yin, L.; Li, D.; Li, Z.; Liu, M. Research on Effectiveness Evaluation Method of Expressway Toll Station Based on Entropy Method and TOPSIS Method. J. Phys. Conf. Ser. 2023, 2424, 012006. [Google Scholar] [CrossRef]
- Wang, Z.Y.; Wei, G.W.; Guo, Y.F. TODIM method based on the CRITIC method for multi-attribute group decision making with dual probabilistic linguistic information. J. Intell. Fuzzy Syst. 2022, 43, 7261–7276. [Google Scholar] [CrossRef]
- Sharkasi, N.; Rezakhah, S. A modified CRITIC with a reference point based on fuzzy logic and hamming distance. Knowl.-Based Syst. 2022, 255, 109768. [Google Scholar] [CrossRef]
- Balakrishnan, N.; Rychtář, J.; Taylor, D.; Walter, S.D. Unified approach to optimal estimation of mean and standard deviation from sample summaries. Stat. Methods Med. Res. 2022, 31, 2087–2103. [Google Scholar] [CrossRef] [PubMed]
- Gao, S.; Wang, Q.R.; Zhao, X.R.; Li, M.; Qian, H.X. Risk Study on TOD + PPP Project Based on Portfolio Empowerment and Game Theory. Railw. Constr. Technol. 2022, 9, 37–41+178. [Google Scholar]
- Tian, D.H.; Chen, J.H.; Wu, X.B. A two stage risk assessment model based on interval-valued fuzzy numbers and risk attitudes. Eng. Appl. Artif. Intell. 2022, 114, 105086. [Google Scholar] [CrossRef]
- Chen, S.J.J.; Hwang, C.L. Fuzzy Multiple Attribute Decision Making: Methods and Applications; Springer: New York, NY, USA, 1992; pp. 220–252. [Google Scholar]
- Sang, H.H.; Ho-Gon, L. Top event probability evaluation of a fault tree having circular logics by using Monte Carlo method. Nucl. Eng. Des. 2011, 243, 336–340. [Google Scholar]
- Sun, H.M.; Gao, Q.S.; Pu, Y.G. Research on Several Typical Importances in Fault Tree Analysis. Reliab. Environ. Test Electron. Prod. 2007, 2, 39–42. [Google Scholar]
- Li, X.Q.; Gao, X.H. A new method for discrimination measurement of comprehensive evaluation results. Stat. Decis. Mak. 2022, 21, 31–35. [Google Scholar]
Disclaimer/Publisher’s Note: The statements, opinions and data contained in all publications are solely those of the individual author(s) and contributor(s) and not of MDPI and/or the editor(s). MDPI and/or the editor(s) disclaim responsibility for any injury to people or property resulting from any ideas, methods, instructions or products referred to in the content. |
© 2023 by the authors. Licensee MDPI, Basel, Switzerland. This article is an open access article distributed under the terms and conditions of the Creative Commons Attribution (CC BY) license (https://creativecommons.org/licenses/by/4.0/).