Abstract
The present work deals with the tribological characterization of the bush-pin contact in timing chains, with a particular focus on the pin wear processes and the development of a model testing technique suitable for this purpose. With the presented test methodology, both the friction and other parameters, such as contact temperatures and the electrical contact resistance between the CrN-coated pin and a steel bush equivalent could be precisely measured during the test procedure, and the input parameters, such as test load, temperature, and test frequency, could be specifically adjusted. In addition, motor components were analyzed in the present study, in order to study the damage processes of application and compare them with those of the model tests. The measured friction and wear processes on the test rig were verified using well-acknowledged design parameters, such as apparent friction energy and linear wear intensity according to Fleischer. The results demonstrated the wear process between the CrN coated spherical steel surface and the plane steel counterpart (mild smoothing wear at moderate loads, and for an advanced wear state with an exposed steel substrate, there was exposed break-outs and deformation, as well as abrasive grooving) and showed that the methodology replicated the wear processes of application and is therefore suitable for characterizing the pin wear of bush drive timing chains.
1. Introduction
In various areas of drive technology, such as in internal combustion engines, it has always been a major aim to minimize friction and wear, in order to optimize the efficiency and durability of the components used [1,2]. Chain drives are frequently used components in traction drive solutions and power transmission. Among the various types of chains, a distinction is made between bush chains and other representatives such as roller chains or toothed chains [3]. In particular, bush chains are successfully used in the timing systems of internal combustion engines, to drive the camshaft with defined opening and closing times for the valves, as well as various auxiliary devices, such as water or oil pumps, etc. [3,4].
A bush chain consists of several individual chain link joints, whose core elements are the bush and the chain pin. The bush is pressed into the inner link plates, and the pin is pressed into the outer link plates. In Figure 1, a picture of several bush chain links, as well as a schematic depiction of the subcomponents in assembled condition, are shown. In the chain joint itself, the contact between the pin and bush is tribologically loaded through load transmission and the change of direction using the normal load and the relative motion between the pin and bush. This contact is generally considered one of the major friction losses in a bush timing chain [5].
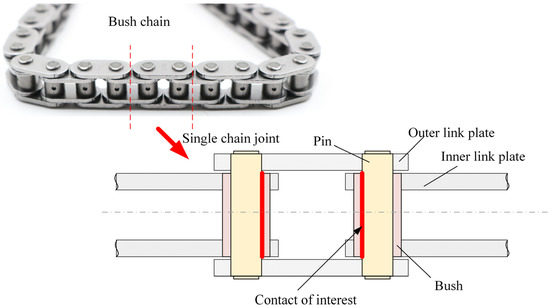
Figure 1.
Depiction of a bush chain with detailed view on the pin/bush contacts within a single joint.
Wear in this contact is also a critical factor, since, on the one hand, the sum of excessive wear across all chain joints of a chain drive can lead to unacceptable chain elongation, affecting the valve timing. In this regard, chain elongations of up to 0.3% to 0.5%, depending on the application, are defined as limits [6]. On the other hand, wear in individual joints can, in the worst case, also lead to the breakage of the joint and thus to the breaking of the chain.
A literature review revealed that several investigations have already been carried out in this area and are mentioned below in an overview of the already existing findings. Fink et al. [5] conducted extensive research on the subject of friction losses in timing chains, which included the influence of various pin coatings on friction losses, as well as the influence of design aspects in the chain drive on the resulting friction losses. In particular, they also showed that an optimized chromium-plated pin coating provides friction advantages in the chain drive of up to 10–20% compared to the standard chrome coating over a wide speed range. In this regard, a further fundamental tribological characterization of chrome-based coatings is given in [7], showing lower friction and wear with a physical vapor deposition (PVD) CrN coating over an electrolytic hard chrome coating. Tandler et al. [8] also dealt with the friction losses of bush chains and investigated the influence of the lubricant on the friction losses in a special test rig, without the use of guide rails. The results of this work showed higher friction losses with used oils than with fresh oil. Meffert et al. [9] investigated the friction effects in bush chains, whereby the investigations were carried out on a single joint-test rig. The results showed the influence of the pin/bush surface topographies of different chains and the choice of lubricant on the friction losses in the chain joint. Sappok et al. [10] focused more on the wear testing of chain joints and the creation of an accurate method for measuring the wear of chain joint components. In another study by Sappok et al. [11], they studied the friction and wear phenomena of the pin/bush contact (both contact partners were case hardened components) on a model tribometer, owing to the benefits of the more isolated investigation condition with this contact. In this regard, the results showed an improvement of friction and wear with a zinc dialkyldithiophosphate (ZDDP) additive compared to a base oil reference. A further demonstration of the positive hardening effects of chain components concerning wear resistance was presented by Thongjitr et al. [12]. A numerical approach for wear prediction and estimation was presented in further work by Tandler et al. [13].
The present work aimed to develop a model testing methodology that enables specific investigations of tribological phenomena (e.g., wear processes, friction assessment of various pins and plates, lubrication effects such as the influence of soot, fuel dilution, etc.) and materials occurring in the pin/bush contact area, with a high degree of visualization and exclusion of environmental effects. A special focus was put on the equivalent damage wear characterization of the pin components compared to engine applications.
2. Analysis of Engine Parts
In order to develop a reliable laboratory testing methodology for tribological engine contacts, it is absolutely necessary to investigate and understand the friction processes and tribological damage phenomena of the application to be tested. This represents a decisive factor in the validity of the methodology, especially when using a system reduction of the test technology to laboratory model scale. For this reason, commercially available components from the corresponding application, viz. a diesel test engine from an original equipment manufacturer OEM, were analyzed to understand the damage process in the present study. In addition, new parts were also investigated as a reference condition.
Figure 2 shows an Olympus BX51M (Olympus Austria GmbH, Wien, Austria) light microscope (LIMI) image of a pin surface in its initial condition. The curved surface (pin diameter is 4.4 mm) shows a fine but not completely smooth surface. Some pores or holes can be seen on the surface, as well as some surface scratches. In this context, scratches in the axial direction and scratches in the circumferential direction can be observed, where the scratches in the axial direction probably originate from disassembly.
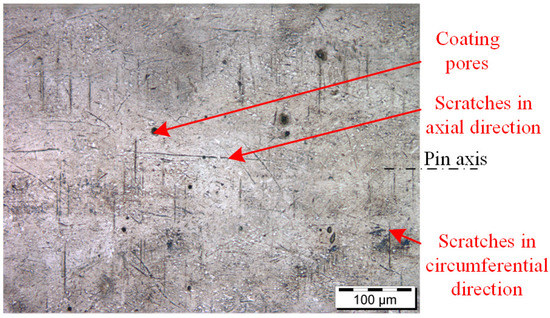
Figure 2.
Initial surface condition of a chain pin.
In the microsection of a pin, see the scanning electron microscope (SEM) picture in Figure 3—taken with a ZEISS EVO 15 from Carl Zeiss GmbH(Wien, Austria)—it can be seen that the pin consists of a substrate material, on which a thin coating of 2.5 µm thickness has been applied. An elemental measurement in the microsection using energy dispersive X-ray spectroscopy (EDS or EDX) from Oxford Instruments GmbH(Wiesbaden, Germany)—see line measurement A-B in the microsection—identified the substrate material as an iron-based material (Fe amount) and the coating as a CrN monolayer, which in the literature is generally attributed with good tribological properties [14,15,16,17]. It can be clearly seen that the elemental composition of the iron-based spectrum changed to a 1:1 ratio of Cr and N.
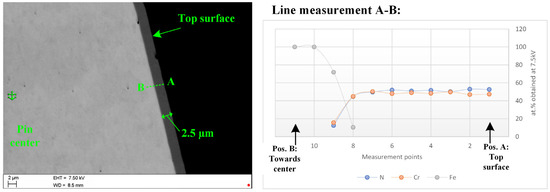
Figure 3.
Microsection analysis of a chain pin in the initial condition.
In contrast to the pin, the bush is made of an uncoated steel, as the analyses in Figure 4 show. EDX measurements confirmed the presence of several alloying elements in addition to iron, such as Cr, Ni, Si, and Mn (see both element spectra in Figure 4). The surfaces of the bushes were quite smooth, which was deduced from the optical appearance, but even more so from the roughness measurements with an Alicona InfiniteFocus IFM G4 optical roughness meter from Alicona Imaging GmbH (Raaba, Austria). The roughness measurements on this device were carried out in the form of line measurements according to the ISO 4287 standard and resulted in Ra values around 0.056 µm and Rq values around 0.072 µm.
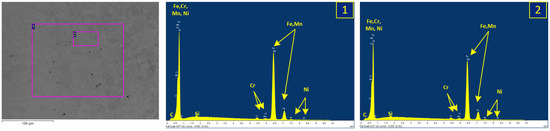
Figure 4.
SEM and EDX point analysis showing two element spectra, 1 and 2, of a bush surface in the initial condition (EDX spectra measured with 20 kV and values given in at.%).
In order to better to understand the tribological contact and the prevailing conditions, nanoindentation measurements using a Keysight Nanoindenter G200 from Keysight Technologies Inc. (Santa Rosa, CA, USA) of the bushes and pins were also carried out. The results are summarized in Table 1, where the hardness and the determined modulus are listed. The bush values were measured with an indentation depth of 1000 nm, with an effective evaluation range between 800 and 900 nm. Due to the low layer thickness, the CrN was measured at 10 times lower indentation depths and evaluation ranges, in order to exclude environmental influences on their measured values. For the verification of the measured values, the substrate material on the pin was measured with both measurement parameters. The results showed that the CrN layer had significantly higher modulus and hardness values, whereby the hardness value was higher by a factor of 3 and the modulus value was about 20% higher. In this regard, the nanoindentation measurement results of CrN were confirmed by the literature [18,19].

Table 1.
Summary of the nanoindentation results of the new chain link parts (average values and standard deviation are given).
Based on the studies of the initial condition, a damage analysis of engine components that had been in operation provided further information, in which the tribological mechanisms had to be mimicked by a proper model testing technique. In this context, parts with higher wear were examined from the representative engine application, namely a timing chain of a diesel three-cylinder engine. The verification of the wear situation was performed via the measured values from the chain elongation measurements of individual joints before and after engine operation. In this regard, higher wear was defined as individual joint wear above 30 µm. The chains were dissembled carefully, in order to not damage the running surfaces of interest.
Figure 5 shows a photograph of a cut pin, with the pin aligned so that the tribologically loaded area can be seen. On the right side a link plate was still press-fitted, which, in contrast, had been removed on the left side. It is already clear from this overview image that the pin surface had smoothen out during operation. This can be seen from the shiny surface, in comparison to the tribologically unstressed area on the left side, where the permanently press-fitted link plate was mounted. In the axial direction, different areas can be seen on the pin surface. Distinctive phenomena include pronounced scratches on the right side of the running surface. In this context, the pin surface in Figure 5 is more or less a representative surface condition of all the links in the investigated chain, with natural variations in individual joint wear.
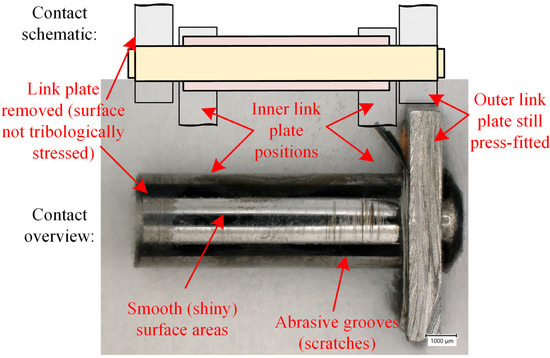
Figure 5.
Overview picture of a disassembled pin for detailed surface and damage analysis.
Detailed pictures of the pin surface phenomena are shown in Figure 6. These are light microscopic and scanning electron microscopic images of certain areas from the overview picture of Figure 5, which it should be emphasized again, can be considered a representative pin condition after an engine test run, where significant chain link wear was generated. In the central areas (Figure 6a), extremely mirror-smooth areas without noticeable sliding grooves can be seen. The holes, which also existed in the initial condition, appeared dark due to the extreme contrast difference with the smooth surface, which had a high backscattering of incident light. In these regions, hardly any traces of deposited products or tribofilm layers were found. Figure 6b shows an off-center area with many grooves and a large area of wear. The exposure of the Fe substrate can be clearly seen in the material contrast of the scanning electron microscope image. This is evident due to the different shades of grey, with lighter areas representing more heavy elements. By means of EDX element measurements, it could be confirmed that in these areas the Fe substrate had been exposed and the CrN layer was obviously worn (Figure 6b, Table 2, Spectrum 2, 3), which showed an advanced state of wear. In some other areas on the pin (see Figure 6c), very deep sliding grooves were seen and, in some cases, break-outs from the coating. Particularly deep grooves or break-outs were also repeatedly filled with lubricant residues. Other pin surfaces of parts with increased single chain link wear showed similar surface conditions; thus, the previously discussed phenomena can be classified as representative.
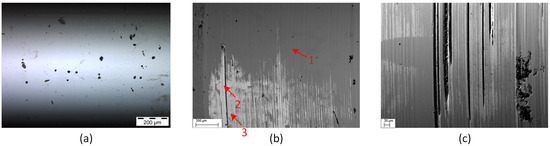
Table 2.
EDX point analysis of regions marked in Figure 6b (measured with 7.5 kV and values given in at.%).
In the case of the counter-bodies, namely the bushes, a different damage pattern could be seen. Figure 7a shows an overview of a tribologically stressed area of a bush. It can be seen that the bush surfaces appeared almost mirror-smooth and only some discolorations can be seen locally in the center. Very sporadically, fine areas of grooves can be seen. With higher magnification of the light microscope, the smooth surfaces were better visible (Figure 7b). Furthermore, the discolorations are also clearly visible, which show brown and blue areas. In the scanning electron microscope and corresponding element analyses (Figure 7c and Table 3), it became clear that the discolorations (Spectrum 1) should be assigned to wear protection layers, namely P- and S-based layers. Outside the discolorations (Spectrum 2 and 3), essentially only the basic element (Fe) of the bush could be measured (alloying elements with low concentrations are difficult to quantify due to the low acceleration voltage, but it is not necessary to resolve this at this point). In addition, oxygen was measurable in lower concentrations, which indicated oxidation of the surface layer. In the non-tribologically stressed area, the bush surface was littered and covered with deposits (lubrication components, soot, and particles), see Spectrum 4. On chain links with less individual link wear, the bush surfaces were somewhat more roughened and not completely smooth. Tribo-chemically, however, similar phenomena were documented (slightly oxidized bush and local zones with wear protection layers). The consideration of these different stages of wear suggests a multi-stage sequence of damage in the case of the timing chains considered for diesel passenger car engines. First of all, local break-outs form on the pin, due to the tribological contact with insufficient lubrication, which leads to stronger groove formation and further wear on both surfaces. The wear particles are increasingly removed from the contact and become deposited at the non-tribologically loaded side of the bush. Further wear on the pin is generated in an adhesive progression, rather than the previous abrasive mechanism, and due to the contact of the exposed Fe-based substrate with the bush material. On the bush, the surfaces are subsequently polished, starting from the roughening that occurs at the beginning, due to layer break-outs of the pin and thus to the further fine adhesive wear. In this context, the result is an inadmissible elongation of the chain, which represents a risk for the reliability of engine operation. Overall, soot is likely to be a major factor in the process, as possible tribological wear protection layers are largely prevented from forming. This could also result in increased friction in the interface and thus facilitate layer defects and chipping. In the subsequent course of the wear process, possible further prevention of layer formation by additive adsorption or corrosive-abrasive mechanisms, as suggested in the literature [20,21,22,23,24], is possible but could not be substantiated for the investigated component parts.
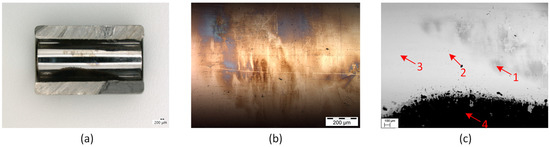
Figure 7.
Bush surface and damage analysis after an engine test run: (a) Overview picture of the high loaded side; (b) LIMI picture of the center area, showing discolorations and smoothed surfaces; (c) SEM material contrast picture of the center area.
Table 3.
EDX point analysis of regions marked in Figure 7c (measured with 7.5 kV and values given in at.%).
3. Experimental Method
3.1. Approach
Based on the damage mechanisms found in the analysis of engine parts, there was a necessity to develop a simple model test at laboratory scale, which would facilitate investigations of tribological fundamentals relating to pin wear in isolation from their application (e.g., dynamic forces, etc.). In addition, damage equivalence between the application and model testing was a decisive criterion. Hence, the test configuration aimed to characterize wear phenomena and tribological processes for the tribological contact of a timing chain contact between pin and bush, assuming some test simplifications but retaining the damage equivalency as far as possible. A reciprocating pin-on-plate approach was chosen as the testing technique, as the special focus was on the evaluation of pin wear. In this test configuration, which is depicted schematically in Figure 8, the pin slides reciprocatively on a plate mating body, which represents the unwound bush under a defined normal load Fn. Oil supply is realized drop-wise through a small needle. In this context, the pins were used in their original condition, whereas for the unwound bush surfaces, model steel plates with similar surface topography and hardness values to the application were manufactured.
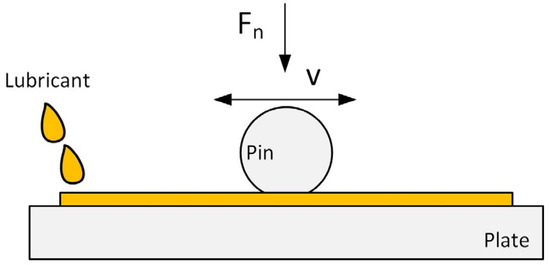
Figure 8.
Test setup schematic.
The biggest test difference between the model test approach and the contact situation in application is the increase in pressure towards a line contact, due to the unwinding compared to the conformal contact condition of the application. Magyar et al. [25] simulated the local solid contact pressure in the pin/bush contact for a certain condition. In relation to the nominal contact area, based for their simulation, an increase factor of 10 was calculated for the maximum solid contact pressure. Based on this, in the current study, the same factor was considered, to roughly estimate the maximum solid contact pressure condition (pmax) for the boundary condition of this study. This pressure was then further transferred to the required normal force for a line contact condition against a plane surface according to Hertzian theory and formulas from [26] to equation (1), in which pmax stands for the maximum solid contact pressure, r for the radius of the pin, l for the width of the contact, and Er is a parameter derived from the combined elastic modulus and Poisson’s ratio of both material partners involved. For the current investigation, a normal load of 350 N was calculated as representative, considering the chain force of the application, chain pin geometry, material, and an increase factor of 10 for these types of chain contacts.
3.2. Test Rig and Setup Developed
The test setup was implemented on a linear tribometer TE77 from Phoenix Tribology Ltd. (Kingsclere, UK), which has been used for many linear reciprocating tribological investigations, such as piston ring/cylinder liner studies, pin-on-plate basic studies for polymer based systems, etc. [27,28,29]. The TE 77 linear tribometer and a computer-aided design (CAD) representation of the test cell with the adapters designed to mount the chain pins and the mating plates are shown in Figure 9. The rotating movement of the shaft of the direct current motor was converted into a translatory movement through a double eccentric. The manufactured specimen holder for the chain pin was screwed onto a rod connected to the double eccentric, into which the chain rivet was clamped in a horizontal position. The force was introduced into the tribological system via a crosshead and the horizontal rivet was pressed onto the counter body, namely the mating plate, which represents the unwound bush. A roller enclosed in the pin specimen holder allowed the translatory movement of the adapter, with simultaneous introduction of the normal load Fn. The plate was fixed in an oil bath, which was heated by heating elements. The control of the heating power was performed through the plate temperature T1 signal. On the side opposite the double eccentric, oil was supplied to the tribological contact from a reservoir by means of a pump. The oil bath was supported by solid-state joints and thus enabled the measurement of the friction force FR with a piezoelectric sensor. The measured variables were the friction force or the friction coefficient μ (COF), the contact near temperature T2, and an electrical resistance measurement of the contact, namely contact potential (CP). In this regard, for the latter, a millivolt potential was applied to the contact and the resulting voltage signal across the contact indicated the contact condition, where 50 mV means isolating conditions through non-conductive layers, such as coatings, oxides, or boundary layers, and lower levels of CP signal indicate break-down thereof, which is commonly related to wear processes.
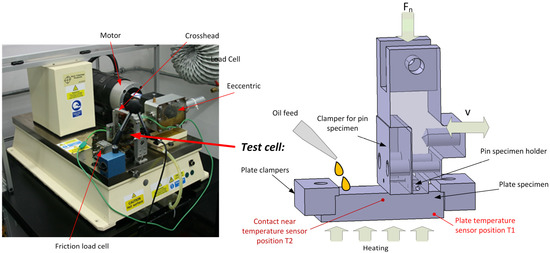
Figure 9.
Three-dimensional model of the test cell.
Used engine oil from automotive application was used as an intermediate lubricant. The oil was supplied from a reservoir can through a peristaltic pump with a rate of 1.58 mL/min to the tribological contact. A magnetic stirrer was used within the oil reservoir to keep the oil in motion and therefore to prevent deposition of particles, thus providing consistent lubrication conditions between individual tests.
3.3. Wear Evaluation
In addition to the tribometric data, the wear was recorded, to evaluate the performance of the different rivet variants. For this purpose, both the pin and the plate were weighed before and after the test. In addition, an optical evaluation and measurement of the wear cap (the decisive evaluation parameter was the average width of the wear cap), see Figure 10, was carried out using light microscopy and scanning electron microscopy. With the help of these optical microscopy tools, the sample surfaces were also examined with regard to wear mechanisms and tribological friction and damage processes.
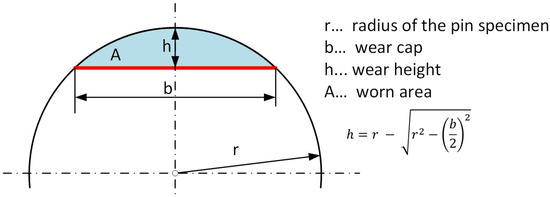
Figure 10.
Visualization of wear cap.
3.4. Test Strategy
The tests were carried out according to the test procedure shown in Figure 11, with the marked phases A to E. At the beginning, phase A, the system was loaded with only 100 N and then accelerated to a test frequency of 10 Hz (with a 25 mm stroke). The system was not heated, and the oil flow was set to the constant of 1.58 mL/min. This phase lasted 600 s and enabled a moderate run-in. In phase B, the system was heated from room temperature to the desired test temperature within 450 s, namely a 100 °C plate temperature. In the following phase C, the control parameters were kept constant again for 450 s, which allowed thermal inertia effects to be compensated for. Phase D represents the load increase, in which the desired test load was applied within 900 s from the run-in load of 100 N.
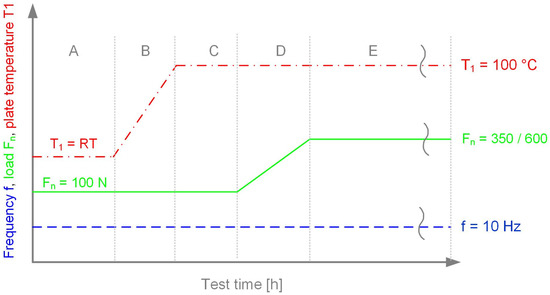
Figure 11.
Test strategy schematic.
This was followed by phase E. In the course of this study, three variants of this test strategy (test category 1–3) with different loads and duration of phase E were carried out, viz. test category 1: 350 N, 25 h total test time; test category 2: 600 N, 25 h total test time; test category 3: 350 N, 73 h total test time. The varied parameters are listed in Table 4.
Table 4.
Matrix of varied test parameters.
4. Experimental Test Results
4.1. Tribometric Data
In the course of the research activities, several tribometric tests were carried out for each system with variation of the normal load and test duration. In addition, an accompanying damage analysis was carried out. The tests showed a high degree of reproducibility and comparability of the prevailing tribological surface phenomena. For method evaluation and performance screening, in total, 17 tests were performed. In the following, representative test results for each system variant are presented and discussed, whereby for the high-load test condition, only one screening test was performed.
Figure 12 shows a test with a 350 N standard test load, which was determined by deriving representative motor characteristics from the automotive sector and applying them to the contraform contact situation of the test method used. The test time was 25 h. This test sequence is referred to as test category 1–TC 1. During the heating and loading phase, to test the temperature and test load, a run-in period was established. This was expressed in a decreasing coefficient of friction, which was associated with initial surface adjustments, boundary layer formation, and the viscosity change of the lubricant (see marking M2 in Figure 12). Under these conditions, the contact potential signal showed slight spikes (M1), but remained at a low level below 10 mV, suggesting slight run-in wear. When reaching the constant test conditions, the reduction of the coefficient of friction stops, but slight fluctuations in the coefficient of friction and peaks in the coefficient of friction were observed. The contact potential remained at a constant low level. After the friction peaks appeared, the contact temperature increased slightly. With a certain delay, a slight reduction in the coefficient of friction could also be seen (after M3). Afterwards, a stable state of equilibrium was reached. As the test progressed, the contact potential began to build up significantly, which also indicated insulating boundary layers (M4). Around 19 h of testing, small peaks in the friction value were again seen, which were heralded by the temporary collapse of the contact potential, before re-stabilization occurred towards the end of the test, accompanied by a slight drop in the contact temperature.
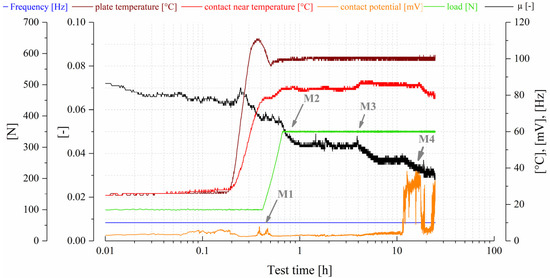
Figure 12.
Representative test result for a test load of 350 N and 25 h test duration, test category 1 (TC 1).
Figure 13 shows a test result with an increased test load (600 N) but otherwise the same test conditions, which is referred to as test category 2 (TC 2) in the remainder of this paper. In comparison with the TC 1 tests, several changes in the performance were observed. Similarly, at the beginning of the test, a run-in phase occurred, due to the increase in heating and loading (M5 and M6). This means that the friction coefficient dropped significantly before reaching a stable level (M7), whereby an increase in friction could also be seen in the intermediary during the heating phase (between M5 and M6). The contact potential also dropped to a minimum and remained at this level. After approximately 13 h of testing under stable conditions, but with a slightly unstable friction coefficient with recurring but minimal friction coefficient peaks and a low contact potential signal, a system change occurred that lasted until the end of the test. The friction value gradually increased and became increasingly unstable (M8). This increase in the friction value was also reflected in the contact temperature, which increased slightly. At the same time, a slight change was also seen in the CP curve.
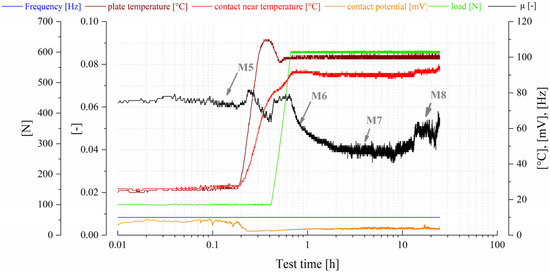
Figure 13.
Representative test result for a test load of 600 N and 25 h test duration, test category 2 (TC 2).
A test with moderate test load but longer testing duration of 73 h, which is referred to as test category (TC 3), is shown in Figure 14. At the beginning of the test, a phenomenologically comparable trend to the test in Figure 12 was seen, namely a decreasing coefficient of friction with slight fluctuations, a second longer-lasting but less pronounced decrease of the COF (M10), and a similar contact temperature measurement and low contact potential after heating the test (M9). Only the temporary build-up of the contact potential was not observed in this case. After about 20 h, there were again friction value peaks, which occurred regularly and then stabilized somewhat (M11). After 30 h of testing, there were stronger friction value peaks, which were subsequently replaced by a sustained increase in the friction value trend (M12). Due to the obvious wear processes going on, the contact potential could not build up over the entire test period.
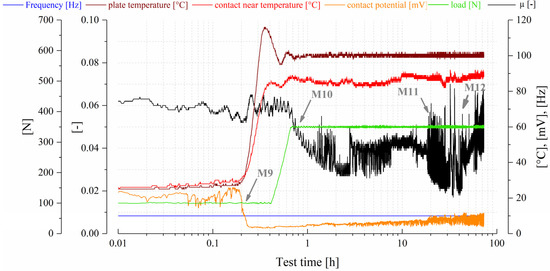
Figure 14.
Representative test result for a test load of 350 N and 73 h test duration, test category 3 (TC 3).
4.2. Damage Analysis of Test Parts
A detailed characterization of the tribological performance could be obtained through a complementary damage analysis of the tested parts. The samples were examined with the aid of light microscopy and scanning electron microscopy, as well as supporting elemental analysis.
Figure 15 shows several light and scanning electron microscope images of the contact surfaces of chain pins from the tribological tests that were carried out. In case of moderate loading and a short test duration (Figure 15a–c), a distinct running track, which had a width of approximately 200 µm, was found on the pin. Within the track, it can be seen that the surface became smoother when compared with the initial state, similarly to what was seen on the engine components. This is evident in the light microscopy picture (Figure 15a), as well as in the scanning electron image shown in Figure 15b. An element point analysis at certain positions on the running track, marked in Figure 15c, proved that the CrN coating was still completely present and generally had not been rubbed through to the Fe substrate within the wear track (Figure 15c, Table 5, Spectrum 2). Locally, some slight abrasive grooves or local break-outs (Figure 15a or Figure 15c, Table 5, Spectrum 1) were seen on the running track, but there was no massive coating loss, deformations, or severe damage processes. Traces of lubricant additive elements or deposit products were only found in very localized areas on the running surface.
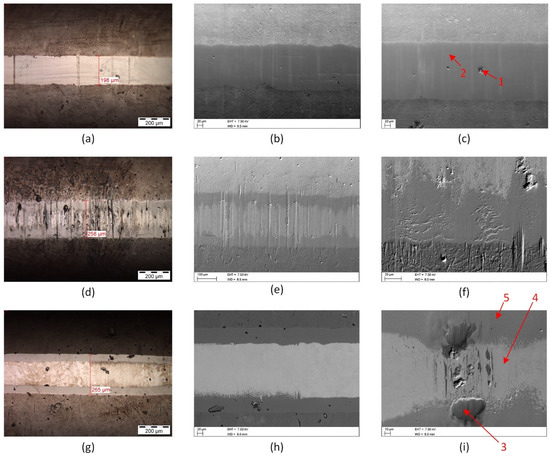
Figure 15.
Surface analysis of chain pins: (a) LIMI picture after testing with TC 1; (b,c) SEM pictures after testing with TC 1; (d) LIMI picture after testing with TC 2; (e,f) SEM pictures after testing with TC 2; (g) LIMI picture after testing with TC 3; (h,i) SEM picture after testing with TC 3.
Table 5.
EDX point analysis of regions marked in Figure 15c,i (measured with 7.5 kV and values given in at.%).
For tests with an increased test load, more intensively damaged pin specimens were documented (Figure 15d–f). In the light microscope image in Figure 15d, it can be seen through the different coloring and topographical appearance that the surface was clearly more damaged than with moderate loading (comparison Figure 15a). Abrasive grooves characterized the running surface, as well as several break-outs. The width of the running surface was also increased according to the advanced state of wear, with measured values in the range of 260 µm. Figure 15e shows a backscattered electron image of the running surface. The image setting resulted in a material contrast image which indicated that the CrN coating was worn in the center areas of the running track and that the Fe-based substrate (higher molecular weight = lighter areas) was exposed. Figure 15f shows that the contact surface was characterized by abrasive grooves, deformations, and material break-outs. The elemental analysis confirmed the wear of the CrN coating and exposure of the Fe substrate. The visible surface damage conformed well with the recorded measurement data. Exposure of the Fe substrate led to greater adhesive wear between the pin surface and the counterpart plate body, as here the same material slid against itself and the wear mechanisms were thus intensified. Break-outs of either the CrN layer or the Fe substrate were converted into wear particles, which resulted in the abrasive grooves seen.
In case of tests with a longer duration, a similar wear state was observed in the light and scanning electron analyses with a supplementary element analysis (Figure 15g–i) as in the tests with an increased test load. The CrN layer was also worn over a large area on the running track and the Fe substrate was exposed in the middle (Figure 15i, Table 5 and element Spectra 4). In contrast to the tests with an increased test load, the abrasive grooves were less pronounced (Figure 15h), although some CrN layer break-outs at the end of the running track were visible (Figure 15g). In certain areas, tribofilm or carbon-based deposit products were also seen on the running track. Similarly to the other tests, wear protective tribofilms were lacking on the wear track, as well as on the exposed iron-based substrate.
The counter surfaces of the plates are shown in Figure 16 for all test categories performed. Figure 16a shows a light microscopic overview and a detailed image of a test with moderate load and short test duration. The smaller overview image shows that the running surface is rather clean and that only minor local discolorations occurred, but there is no evidence of severe wear traces on the surface. These phenomena conformed very well with the tribometric test data of these tests, which also suggested stable friction and wear processes. It was also clearly visible that contact occurred over the entire nominal running surface. The discolored areas are more visible in the detailed picture. It can be seen that these layers appeared bluish and brownish and were locally pronounced. In the case of TC 1, blue pad-like layers were dominant. In the case of higher load (TC 2), which is shown in Figure 16b, it can be seen that the contact areas on the steel counter surface appeared rather smeared and more of the brown layers covered the surface over a large area. The higher coverage of the surface with layers can also be seen in the overview image. Test condition 3 (TC 3), Figure 16c, shows a slightly less pronounced coverage of the surface with tribological layers, but here, too, there are more brownish layer areas. Figure 16d and Table 6 show a scanning electron image with EDX element analysis of the blue and brown tribolayer areas formed on the example of a surface of TC 3. The bluish layer regions are darker in the grey scale image of the SEM. The brown layer areas are somewhat lighter, but still have a clear contrast with the uncovered steel surface (lightest areas in the greyscale image). The elemental analysis showed the presence of ZDDP layer elements such as P, S, Zn, and Ca. In the case of the blue areas, the measurements showed increased P, Zn, and Ca contents, indicating phosphate layers. In the case of brown layered deposits, the previously mentioned elements were also measurable, but in lower proportions compared to the other elements. The higher relative proportion of Fe and S indicate diverse base layers such as Fe-S, Zn-S, and Fe-O in the ZDDP multi-layer system. The elemental composition of the layers formed and their appearance in the scanning electron image were comparable to those of the engine components.
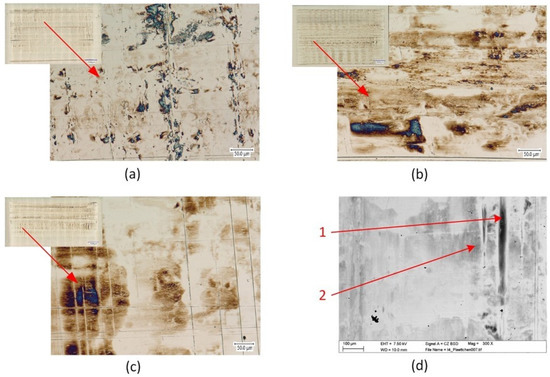
Figure 16.
Surface analysis of steel counterparts: (a) LIMI picture after testing with TC 1; (b) LIMI picture after testing with TC 2; (c) LIMI picture after testing with TC 3; (d) SEM picture after testing with TC 3.
Table 6.
EDX point analysis of regions marked in Figure 16d (measured with 7.5 kV and values given in at.%).
5. Discussion
The experimental tests carried out on the model testing system could also be described and discussed with the aid of proven quantitative friction and pin wear parameters, and their surface phenomena could be compared with those from the application, in order to refine the presented testing technique, as well as to assess the new findings according to known classifications.
As defined in the methodology chapter, a quantitative assessment of the wear could be made via the measurable width of the wear cap on the pin. From this parameter, the wear volume and the linear wear height could then be derived via the geometric relationship through the cylinder shape. Based on other recorded measurement parameters such as frictional values, the results were further evaluated and discussed in accordance with well-known and accepted friction and wear evaluation concepts, such as those of Archard [30] and Fleischer [31]. Thus, proven characteristic values for classifying the preceding tribological phenomena were derived and can made available to the reader.
One the one hand, quantitative assessments regarding friction were carried out by calculating the dissipated friction energy. Figure 17a shows the mean dissipated friction energy per test hour for the respective test conditions in a bar chart. In this regard, a linear relationship with the duration of the test could be determined, with all other conditions being equal. This can be read from the bar chart, as the related values for TC 1 and TC 3 are approximately at the same level, and thus a linearity of the friction energy on the total test time is seen. With an increased load, a significant increase (~ doubled) was also seen here in comparison with the reference level, which indicates that the frictional force increased relative to the applied normal load (i.e., similar coefficient of friction), thus showing that the system was sensitive to an extraordinary increase in normal force.
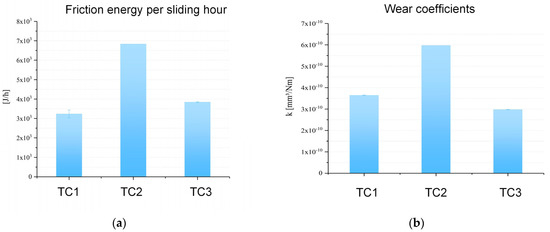
Figure 17.
Friction and wear parameters of tests: (a) Friction energy per sliding hour of all test categories; (b) Pin wear coefficients of all test categories.
Figure 17b shows the pin wear coefficients of the various test conditions according to Archard’s calculation principle. It can be seen that the coefficient decreased slightly with a longer test duration, although the substrate material was already exposed for longer test periods and more unstable friction processes were observed. This could have been due to the reduction of the pressure load with the increasing contact area and thus the reduced critical wear formation energy. This would mean that the wear and damage processes were higher at the beginning, which was also observed in a similar way in the analyses of the engine components. For higher normal forces, the wear coefficient according to Archard was also significantly increased, which indicated more intensive wear processes, as the other test system conditions were considered constant compared to the reference test condition. The effect of the increased load was also seen in the wear rate of the counter body. While in the case of a moderate load, no significant wear was measured for the plate, namely only 0.6 and 0.4 mg via the gravimetric evaluation method before and after the test, at high loads significant wear, 15 mg was measured. This clearly shows the more severe wear processes due to the increased load.
Jointly considering the friction–energetic processes, as well as the wear processes, the tests could also be evaluated according to Fleischer’s classification. For this purpose, the apparent friction energy density and the linear wear intensity were calculated according to calculation methods and plotted against each other in Figure 18. It can be seen that all the tests were in similar ranges, which can be considered reasonable based on the measured parameters, the phenomena found, and the evaluation approaches. The trends described and discussed above could also be seen with this evaluation approach. Higher loads led to lower friction energy densities and higher linear wear intensities (i.e., more intensive solids contacts). Longer test times showed the opposite to the reference test condition. According to the wear classification, all tests were in the range of category 1 level 2 according to Fleischer, which means a moderate wear without thermal energy accumulation effects. This agreed with the observed surface phenomena and in situ measurement parameters, showing no signs of severe damage processes such as scuffing but rather moderate wear of deformation, slight adhesion, and sparse abrasive marks.
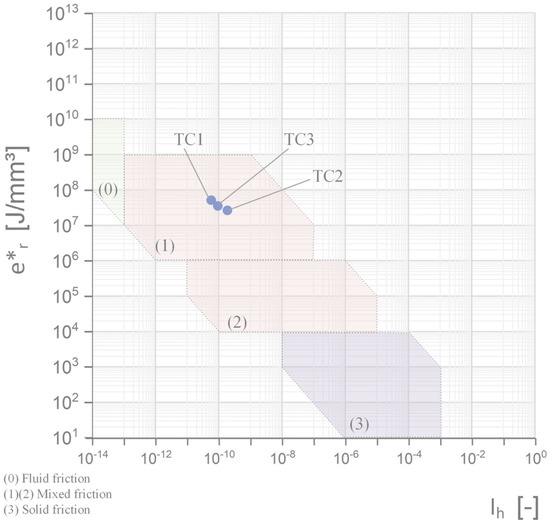
Figure 18.
Apparent friction energy density (e*r) plotted over the linear wear intensity (Ih) of the test categories.
With regards to the informative value of the model testing technique, the comparison of the prevailing tribological mechanisms on the surfaces involved in the friction process was particularly decisive. This shows that damage equivalent conditions could be documented between the engine application and laboratory testing, which validated the applicability of the model testing technique with regard to the tribological characterization of pin wear. For pin surfaces with respect to moderate wear conditions, in both the engine and the model test technique, a significant smoothening of the CrN layer, without strong groove marks, break-outs, or deformation, could be observed (see Figure 6a compared to Figure 15a). Interactions with the lubricant were largely absent in such conditions or were not detectable with the applied analysis techniques. The pores present in the initial state could be detected in the engine, as well as in the test for these wear conditions. In the case of an increased wear state (in the test due to an increase in the test time or load; in the engine presumably due to lubrication conditions, geometric scattering of components and associated higher loads) the CrN layer was worn away and the Fe substrate was exposed (for comparison see Figure 6b,c and Figure 15d–i). Furthermore, in this case, break-outs of the CrN layer could also be seen, which most likely preceded the increased wear rate. When the steel substrate was exposed, an increased number of grooves was seen on the contact surface. This phenomenon was prevalent in both engine parts and test specimens. In addition, an increased proportion of deformations was seen in these areas. These equivalent conditions validated the developed model testing technique with regards to being an efficient laboratory screener for pin wear. A condition equivalence between the application and model test was also be observed on the mating body surfaces. In both cases, the steel surfaces were smoothly polished and slightly oxidized. Grooves were only observed locally. In addition, local wear protection layers on the P and S bases were equally measurable.
6. Conclusions
Within the current paper a new model test method is presented for the evaluation of tribological processes and damage phenomena of contacts using drive chain pin components. The benefit of this method is being able to resolve specific friction and wear processes with high resolution, with exclusion of other disturbance parameters, and thus to be able to characterize the effect of various changes to the tribosystem in detail. The model test system was implemented on a TE77 linear tribometer from Phoenix Tribology Ltd. and uses real pin parts from drive chains. The following conclusions and findings can be noted.
- Although the contact conditions were different to the real engine conditions, similar tribological processes and damage phenomena were observed when comparing engine parts and the model test specimen, thus proving the legitimacy of the developed tester.
- Considering the conversion calculations for the normal loading between application and model setup, a large area chain pin wear can be produced at model scale. In this context, the wear processes for the pin/bush contact between a CrN steel shell surface and a flat steel mating surface can be resolved under mixed friction conditions. First, mirror polished CrN contact areas were observed for pin surfaces with an intact CrN coating sliding against the hardened steel, similarly to that seen for moderate wear conditions of the engine parts. In an advanced wear state, which was also similar between the engine condition and model tester, CrN coating break-outs, an exposed Fe substrate, and abrasive grooves prevailed on the pin surface. At model scale, these conditions led to an extraordinary wear of the steel plate counterpart. This agreed with observations of the engine components, where high chain link elongations were documented for such conditions. On the Fe-based steel plates, anti-wear additive layers including P, S, and Zn species were measured after test ended; whereby, in contrast, on the mating CrN surfaces, as well as on the exposed Fe substrate material of the pin, they were not found.
- A friction coefficient in the range between 0.05 and 0.03 was measured for the sliding system using a CrN coated steel pin against a hardened steel plate and an automotive fully formulated engine oil. In this regard, the COF trends were strongly connected with running processes and the state of wear, meaning that for the CrN coating after the test had ended, the corresponding COF values were 0.03, and for tests with exposed Fe substrates, the COF re-increased at test completion towards 0.06 and become more unstable. For higher loads, the coefficient of friction was in a similar range to the moderate load level, thus increased loading resulted in a significantly higher dissipated friction energy.
- Higher loadings not only increased the dissipated friction energy but also the wear (e.g., moderate load plate wear: 0.4/0.6 mg vs. high load plate wear: 15 mg) of the various wear evolution parameters, such as the linear wear intensity or wear coefficients according to Archard’s approach (pin wear comparison, see Figure 17b). For longer test durations, the wear coefficient was slightly lower, presumably due to the different pressure situation with an increased wear cap.
- Classification of the friction and wear processes according to Fleischer’s method was also performed and showed the good agreement of the present tribological system using a model test system for chain pins according to this approach. Thus, the tested systems provided an apparent friction energy density in the range of 2.5 × 10⁷ and linear wear intensities between 1.9 × 10⁻¹⁰ and 9.4 × 10⁻¹¹, which fall within mixed friction sliding conditions and moderate wear processes of mild wear, with deformation effect but no thermal energy accumulation.
The application of this model test setup for comparative evaluation of tribological systems using bush drive chain components (e.g., to evaluate the tribological performance of various pin coatings or to be able to characterize lubricant interactions in the system) will be presented in the second part of this study.
Author Contributions
Conceptualization, F.S.; methodology, F.S. and P.B.; validation, F.S. and P.B., formal analysis, F.S.; investigation, F.S. and P.B.; data curation, F.S.; writing—original draft preparation, F.S.; writing—review and editing, F.S., P.B. and F.G.; visualization, F.S.; supervision, F.G.; project administration, F.S. and F.G. All authors have read and agreed to the published version of the manuscript.
Funding
This research received no external funding.
Data Availability Statement
Not applicable.
Conflicts of Interest
The authors declare no conflict of interest.
References
- Taylor, C. Automobile engine tribology—Design considerations for efficiency and durability. Wear 1998, 221, 1–8. [Google Scholar] [CrossRef]
- Tung, S.; McMillan, M. Automotive tribology overview of current advances and challenges for the future. Tribol. Int. 2004, 37, 517–536. [Google Scholar] [CrossRef]
- van Basshuysen, R.; Schäfer, F. (Eds.) Handbuch Verbrennungsmotor: Grundlagen, Komponenten, Systeme, Perspektiven, 8th ed.; Springer: Berlin/Heidelberg, Germany, 2017. [Google Scholar]
- Fink, T.; Hirschmann, V. Kettentriebe für den Einsatz in modernen Verbrennungsmotoren. MTZ Motortech Z 2001, 62, 796–806. [Google Scholar] [CrossRef]
- Fink, T.; Bodenstein, H. Möglichkeiten der Reibungsreduktion in Kettentrieben. MTZ Motortech Z 2011, 72, 582–587. [Google Scholar] [CrossRef]
- Belmer, S.; Fink, T.; Lorenz, I. Neukirchner, Steuertriebefür Verbrennungsmotoren. MTZ Motortech Z 2005, 66, 466–475. [Google Scholar] [CrossRef]
- Bozyazı, E.; Ürgen, M.; Çakır, A. Comparison of reciprocating wear behaviour of electrolytic hard chrome and arc-PVD CrN coatings. Wear 2004, 256, 832–839. [Google Scholar] [CrossRef]
- Tandler, R.; Bohn, N.; Gabbert, U.; Woschke, E. Experimental investigations of the internal friction in automotive bush chain drive systems. Tribol. Int. 2019, 140, 105871. [Google Scholar] [CrossRef]
- Meffert, D.; Oehler, M.; Sauer, B. Precise Friction Measurement in Drive Chains Using a Chain Joint Tribometer. Tribol. Online 2021, 16, 151–158. [Google Scholar] [CrossRef]
- Sappok, D.; Sauer, B. Wear Measurement on Chain Joint Components Using a Roundness Instrument. Period. Polytech. Mech. Eng. 2015, 59, 51–59. [Google Scholar] [CrossRef]
- Sappok, D.; Merz, R.; Sauer, B.; Kopnarski, M.; Dienwiebel, M. Surface Analysis of Chain Joint Components after Tribological Load and Usage of Antiwear Additives. Conf. Pap. Sci. 2015, 2015, 407048. [Google Scholar] [CrossRef]
- Thongjitr, P.; Ninpetch, P.; Kowitwarangkul, P. Wear resistance improvement of the roller chain parts at Thai Metro Industry (1973) Co., Ltd. Mater. Today Proc. 2018, 5, 9431–9439. [Google Scholar] [CrossRef]
- Tandler, R.; Bohn, N.; Gabbert, U.; Woschke, E. Analytical wear model and its application for the wear simulation in automotive bush chain drive systems. Wear 2020, 446–447, 203193. [Google Scholar] [CrossRef]
- Ferreira, R.; Carvalho, Ó.; Sobral, L.; Carvalho, S.; Silva, F. Influence of morphology and microstructure on the tribological behavior of arc deposited CrN coatings for the automotive industry. Surf. Coat. Technol. 2020, 397, 126047. [Google Scholar] [CrossRef]
- Tung, S.; Gao, H. Tribological characteristics and surface interaction between piston ring coatings and a blend of energy-conserving oils and ethanol fuels. Wear 2003, 255, 1276–1285. [Google Scholar] [CrossRef]
- Laxane, R.; Bhide, R.; Patil, A.; Sane, S. Characterisation of chromium nitride physical vapour deposition coating on diesel engine pistons. Surf. Eng. 2006, 22, 78–80. [Google Scholar] [CrossRef]
- Wan, S.; Li, D.; Zhang, G.; Tieu, A.; Zhang, B. Comparison of the scuffing behaviour and wear resistance of candidate engineered coatings for automotive piston rings. Tribol. Int. 2017, 106, 10–22. [Google Scholar] [CrossRef]
- Li, D.; Kong, N.; Zhang, B.; Zhang, B.; Li, R.; Zhang, Q. Comparative study on the effects of oil viscosity on typical coatings for automotive engine components under simulated lubrication conditions. Diam. Relat. Mater. 2021, 112, 108226. [Google Scholar] [CrossRef]
- Lin, J.; Sproul, W.; Moore, J.; Lee, S.; Myers, S. High rate deposition of thick CrN and Cr2N coatings using modulated pulse power (MPP) magnetron sputtering. Surf. Coat. Technol. 2011, 205, 3226–3234. [Google Scholar] [CrossRef]
- Olomolehin, Y.; Kapadia, R.; Spikes, H. Antagonistic Interaction of Antiwear Additives and Carbon Black. Tribol. Lett. 2009, 37, 49. [Google Scholar] [CrossRef]
- Kontou, A.; Southby, M.; Morgan, N.; Spikes, H. Influence of Dispersant and ZDDP on Soot Wear. Tribol. Lett. 2018, 66, 157. [Google Scholar] [CrossRef]
- Kontou, A.; Southby, M.; Spikes, H. Effect of steel hardness on soot wear. Wear 2017, 390–391, 236–245. [Google Scholar] [CrossRef]
- Salehi, F.M.; Morina, A.; Neville, A. Zinc Dialkyldithiophosphate Additive Adsorption on Carbon Black Particles. Tribol. Lett. 2018, 66, 5488. [Google Scholar] [CrossRef]
- Salehi, F.M.; Morina, A.; Neville, A. The effect of soot and diesel contamination on wear and friction of engine oil pump. Tribol. Int. 2017, 115, 285–296. [Google Scholar] [CrossRef]
- Magyar, B.; Thielen, S.; Foko, F.F.; Becker, A.; Sauer, B. EHL Simulation of the Timing Chain Drive. In Proceedings of the 6th World Tribology Congress (WTC), Beijing, China, 17–22 September 2017. [Google Scholar]
- Kunz, J. Kontaktprobleme und ihre praktische Lösung. Konstruktion 2009, 11, 54–58. [Google Scholar]
- Moder, J.; Grün, F.; Summer, F.; Kohlhauser, M.; Wohlfahrt, M. Application of high performance composite polymers with steel counterparts in dry rolling/sliding contacts. Polym. Test. 2018, 66, 371–382. [Google Scholar] [CrossRef]
- Schiffer, J.; Gódor, I.; Grün, F.; Eichlseder, W. A Model Scale Test Method for the Piston Ring—Cylinder Liner Tribosystem of Internal Combustion Engines. Arch. Mech. Eng. 2010, 57, 211. [Google Scholar] [CrossRef]
- Pusterhofer, M.; Summer, F.; Wuketich, D.; Grün, F. Development of a Model Test System for a Piston Ring/Cylinder Liner-Contact with Focus on Near-to-Application Seizure Behaviour. Lubricants 2019, 7, 104. [Google Scholar] [CrossRef]
- Archard, J.; Hirst, W. The wear of metals under unlubricated conditions, Proceedings of the Royal Society of London. Series A. Math. Phys. Sci. 1956, 236, 397–410. [Google Scholar] [CrossRef]
- Fleischer, G. Energetische Methode der Bestimmung des Verschleißes. Schmierungstechnik 1993, 269–274. [Google Scholar]


Disclaimer/Publisher’s Note: The statements, opinions and data contained in all publications are solely those of the individual author(s) and contributor(s) and not of MDPI and/or the editor(s). MDPI and/or the editor(s) disclaim responsibility for any injury to people or property resulting from any ideas, methods, instructions or products referred to in the content. |
© 2023 by the authors. Licensee MDPI, Basel, Switzerland. This article is an open access article distributed under the terms and conditions of the Creative Commons Attribution (CC BY) license (https://creativecommons.org/licenses/by/4.0/).