Article

Simulation Analysis and Experimental Study on the Fluid–Solid–Thermal Coupling of Traction Motor Bearings

1
School of Mechatronics Engineering, Henan University of Science and Technology, Luoyang 471003, China
2
BH Technology Group Co., Ltd., Taizhou 318050, China
3
Shandong Chaoyang Bearing Co., Ltd., Dezhou 253200, China
*
Authors to whom correspondence should be addressed.
Lubricants 2024, 12(5), 144; https://doi.org/10.3390/lubricants12050144
Submission received: 27 March 2024 / Revised: 22 April 2024 / Accepted: 22 April 2024 / Published: 25 April 2024
(This article belongs to the Special Issue Tribological Characteristics of Bearing System, 2nd Edition)

Abstract

:
The traction motor is a crucial component of high-speed electric multiple units, and its operational reliability is directly impacted by the temperature increase in the bearings. To accurately predict and simulate the temperature change process of traction motor bearings during operation, a fluid–solid–thermal simulation analysis model of grease-lubricated deep groove ball bearings was constructed. This model aimed to simulate the temperature rise of the bearing and the grease flow process, which was validated through experiments. The results from the simulation analysis and tests indicate that the temperature in the contact zone between the bearing rolling element and the raceway, as well as the ring temperature, initially increases to a peak and then gradually decreases, eventually stabilizing once the bearing’s heat generation power and heat transfer power reach equilibrium. Furthermore, the established fluid–solid–thermal coupling simulation analysis model can accurately predict the amount of grease required for effective lubrication in the bearing cavity, which stabilizes along with the bearing temperature. The findings of this research can serve as a theoretical foundation and technical support for monitoring the health status of high-speed EMU traction motor bearings.

1. Introduction

In rail transit vehicles such as high-speed electric multiple units, traction motors play a crucial role in converting electrical energy to kinetic energy. The performance of these motors directly impacts the driving performance, range, and energy efficiency of the train. Bearings, as integral components of traction motors, significantly influence the motor’s performance and lifespan. Selecting appropriate lubricants is essential for optimal bearing performance [1,2]. Grease lubrication is the primary mode for high-speed EMU bearings [3], with the lubricant having the shortest service life in bearing parts. Analyzing the grease condition of the bearing is thus highly significant [4]. The operating conditions of traction motors are intricate [5], with varying speed, load, and external factors leading to intense friction and heat generation within the bearing. This can result in lubrication failure, posing a risk to the safe operation of rolling bearings and potentially causing mechanical failures [6,7,8]. Therefore, understanding the temperature rise mechanism of the bearing and the flow behavior of the grease is crucial to assess bearing performance under complex conditions like high speed and heavy load. This analysis is essential for predicting and preventing bearing failure, ultimately enhancing the reliability and stability of traction motor and high-speed train operations.
Lugt, Velickov, and Tripp [9] conducted a study on the erratic behavior of grease in bearings, often characterized by a highly variable temperature signal. The temperature typically increases at the onset of bearing operation, a phenomenon commonly associated with grease agitation. The study revealed that the initial filling condition of the bearing plays a crucial role in determining the lifespan of the grease within the bearing. Xu, Zhang, Huang, and Wang [10] developed a heat transfer model specific to high-speed railway bearings, taking into account the unique working conditions and structural characteristics of double-row tapered roller bearing assemblies. The researchers calculated the heat source and external heat dissipation of the bearing, established reasonable lubrication boundary conditions, and created a finite element model using ANSYS 15.0. Chai, Ding, and Wang [11] utilized the computational fluid dynamics software FLUENT 15.0 to simulate the flow field in a herringbone grooved bearing, accounting for factors such as viscosity, temperature, and heat transfer.
Ma, Li, Qiu, Wu, and An [12] proposed a precise calculation model for the heating rate of grease-lubricated spherical roller bearings using the local heat source analysis method. They utilized the thermal network method to develop a transient thermal model of the bearing seat–shaft system. Xiu, Xiu, and Gao [13] focused on the mathematical model of the oil film temperature field of ultra-high-speed dynamic and static pressure sliding bearings. They conducted numerical simulations of the oil film temperature field of the bearing using FLUENT 11.0 software. These simulations not only allow for the prediction of the flow state and thermal performance of the bearing oil but also facilitate the identification of design flaws in the bearing, providing valuable insights for improving bearing design. Wang, Sun, Chang, and Liu [14] utilized the computational fluid dynamics method to establish a flow analysis model of grease lubrication in the bearing cavity, considering the flow characteristics of grease during bearing operation. They conducted a detailed analysis of the flow characteristics of grease lubrication in the bearing cavity. Furthermore, Zhang, Lin, Fan, Su, and Lu [15] employed ANSYS FLUENT 19.2 software to investigate and analyze the temperature fields of two oil chambers with the same speed, thickness, and bearing area of the oil cavity. They summarized the temperature distribution patterns of the two cavity oil films.
Since the mid-20th century, Palmgren [16] utilized the bearing friction torque test method to derive an empirical formula for calculating the frictional moment of bearings. Deng, Xie, Liao, Zhou, and Deng [17,18,19] further developed a formula for calculating the friction moment of high-speed angular contact ball bearings through bearing dynamic analysis. They also investigated the correlation between axial preload, cage structural parameters, and bearing friction moment. Harris and Kotzalas [20] introduced a method for calculating local heat generation in ball bearings and analyzing bearing temperature using a thermal grid method. Ai, Wang, Wang, and Zhao [21] established a thermal mesh model for a double-row tapered roller bearing based on the generalized Ohm’s law. They explored the impact of rotational speed, filling grease ratio, and roller diameter on bearing temperature. Additionally, Takabi and Khonsari [22,23] developed a bearing thermal analysis model to examine the relationship between lubricating oil viscosity, convection coefficient, temperature gradient, and thermally induced preload in bearings. De-xing, Weifang, and Miaomiao [24,25,26] considered the influence of lubricating oil and thermal expansion to establish a thermal grid analysis model of bearings and analyzed the factors that cause the temperature rise of bearings. Local temperature rises in bearings can affect fluid density and viscosity as a result of a variety of phenomena, including elastic flow lubrication and rolling/sliding friction [27,28]. While these are important phenomena to consider when modeling lubricated elliptical contacts, they are beyond the scope of current work and CFD capabilities, and the fluid is considered isothermal throughout the simulation [29]. Nevertheless, this approach is not applicable for analyzing grease lubricated bearings, as grease viscosity varies significantly with temperature and heat generation is dynamic, precluding isothermal considerations. Some researchers have conducted simulations and analyses of the temperature distribution in grease-lubricated bearings to determine the optimal grease filling amount under operational conditions. However, there is limited research on the changes in grease flow behavior within the bearing cavity.
During the test, the temperature of the grease-lubricated deep groove ball bearing in the traction motor increases significantly after the initial grease filling, leading to an alarm from the temperature detector. To better understand the mechanism behind this temperature rise, it is crucial to accurately simulate the entire process. Existing research primarily focuses on heat generation and transfer calculations to determine the final stable temperature of the bearing. However, these studies often overlook the impact of lubricant viscosity changes on heat generation and do not consider heat transfer to the bearing seat or air convection. This dynamic process, from the start of operation to the bearing temperature reaching equilibrium, is critical as the maximum temperature of the outer ring influences the temperature monitoring element’s threshold setting. This paper introduces a novel approach that considers the effects of grease viscosity and temperature on bearing friction power consumption. By treating temperature as a variable and grease viscosity as an intermediary, the frictional power consumption at different contact zone temperatures is calculated. An iterative method is employed to analyze the variable friction power consumption conditions, providing insights into the overall temperature rise process of the bearing. A fluid–solid thermal analysis model is utilized to investigate the temperature rise behavior mechanism and grease fluidity in grease-lubricated deep groove ball bearings of traction motors, with experimental validation confirming the simulation’s accuracy.

2. Establishment of a Fluid–Solid–Thermal Coupling Model

To comprehensively study the temperature rise behavior mechanism and grease flow behavior of grease-lubricated bearings, it is essential to consider the heat generation and heat transfer characteristics of the bearings, as well as the dynamic characteristics of the fluid–structure interaction model. The process involves establishing a bearing dynamics model to determine the friction source and calculate the frictional heat, followed by the establishment of thermal conductivity, convection, and thermal radiation models for the bearings. The calculated results serve as thermal boundary conditions for the fluid–solid–thermal coupling simulation model, which is used to analyze the temperature rise characteristics of the bearing and the fluidity of the grease.

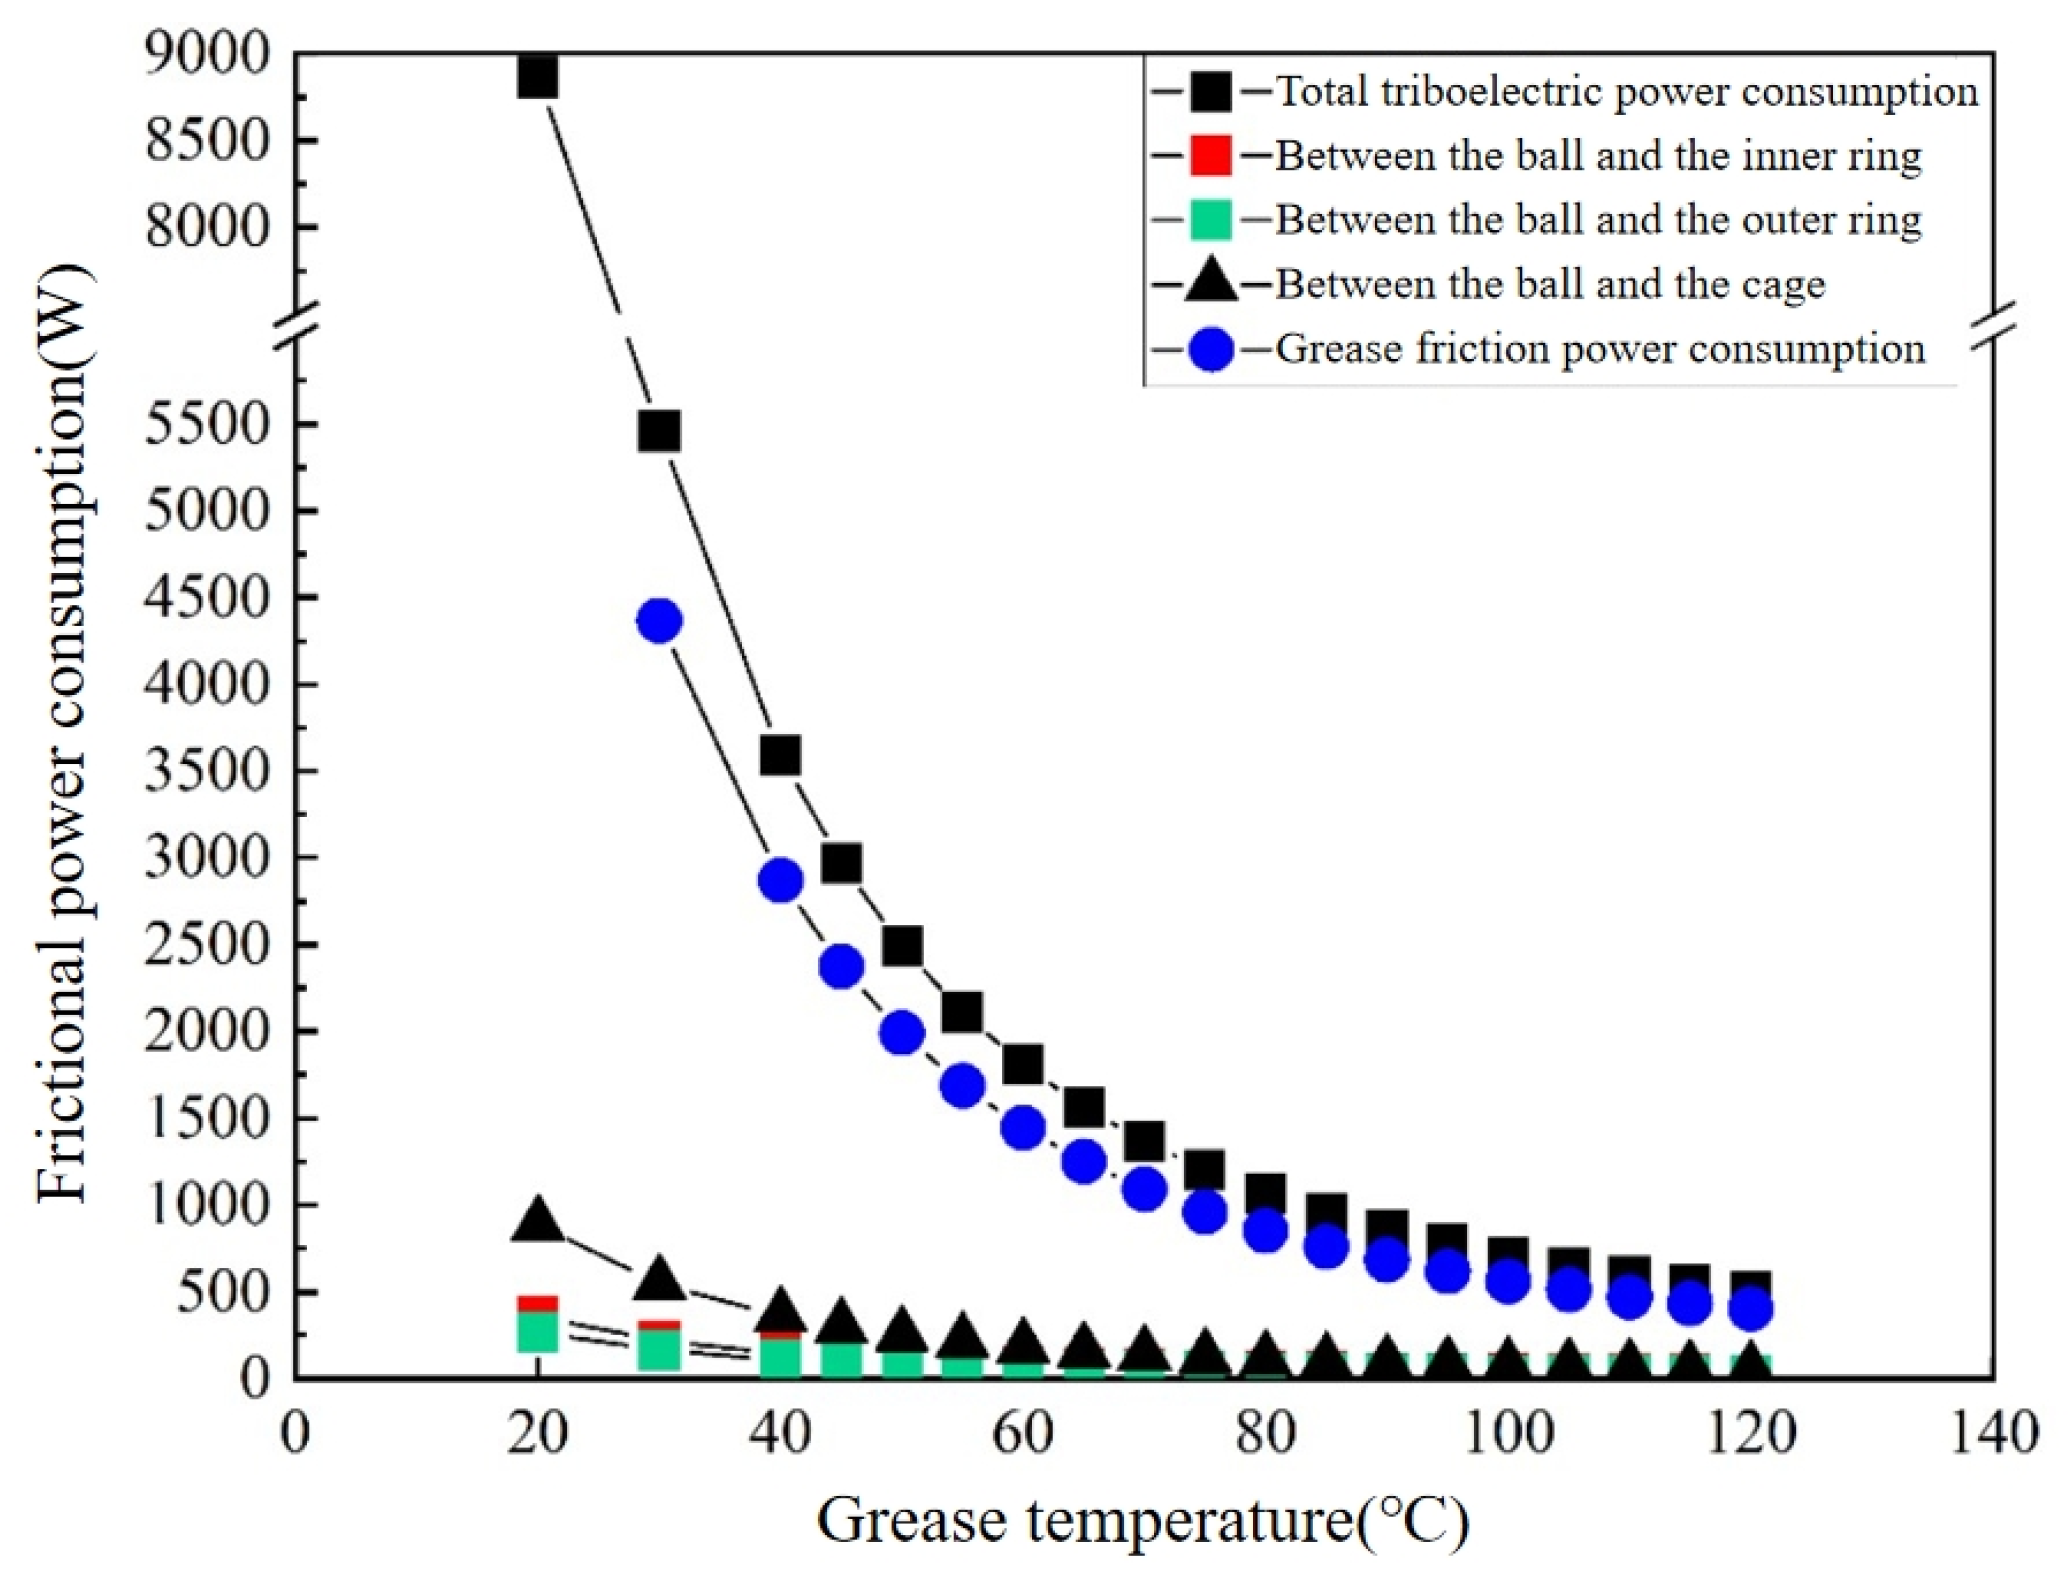
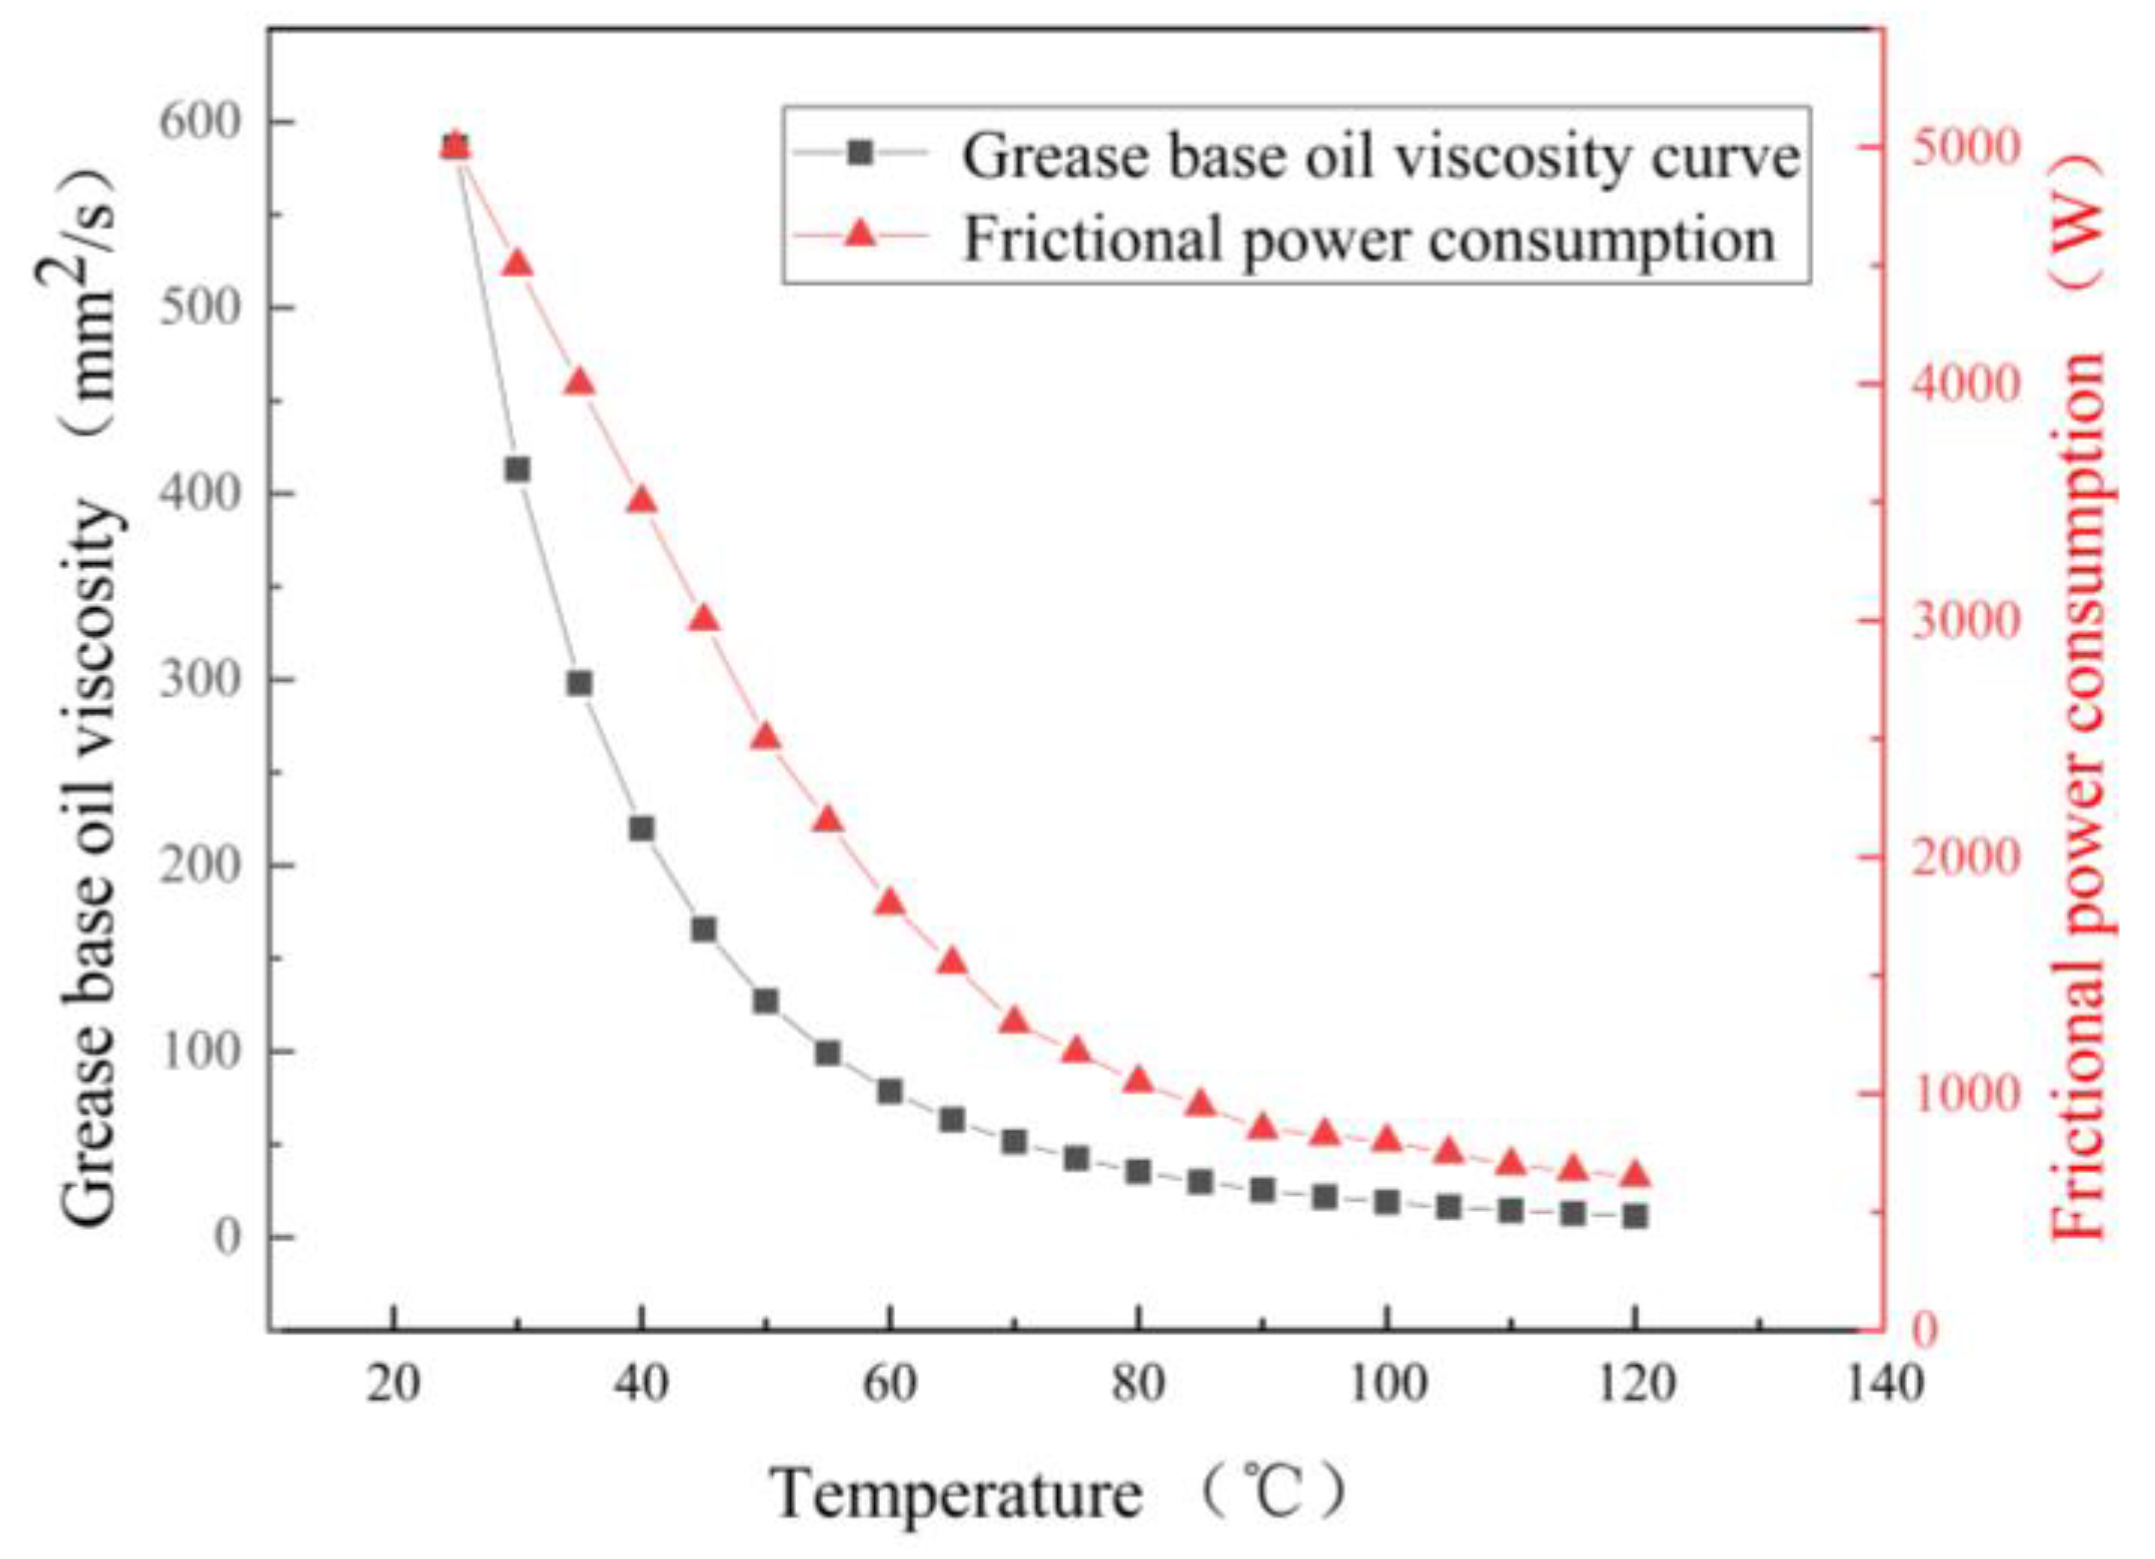
2.1. Heat Generation Model

The power consumption of the traction motor bearing in the service state results from various factors. This includes friction power consumption between the steel ball and the raceway due to material elastic hysteresis and frictional power dissipation between the steel ball and the raceway due to differential sliding. Spin sliding friction power dissipation due to the steel ball moves relative to the raceway. The rotation of the steel ball is influenced by fluid flow resistance and stirring resistance, leading to viscous loss in the steel ball oil film. Additionally, frictional power dissipation arises from hydrodynamic lubrication and relative sliding between the bearing ring guide surface and the cage [30].
H total = H E + H D + H S + H cb + H L
where H total is the total frictional power consumption of the bearing, H E is the elastic hysteresis friction power consumption between the ball and the raceway, H D is the friction power consumption caused by the differential sliding between the ball and the raceway, H S is the frictional power consumption caused by the spin of the ball, H L is the frictional power consumption of viscous stirring loss, and H cb is the friction power consumption between the cage and the ball.
This friction power consumption is further divided into four parts for thermal boundary setting in fluid–structure interaction simulation models: friction between the ball and the inner ring, friction between the ball and the outer ring, friction caused by sliding between the ball and the cage, and friction from viscous stirring loss in the cage. According to the calculation of the bearing dynamics model, with the change in lubricant temperature, the change trend of the friction power consumption value of each part is shown in Figure 1.
With the increase in grease temperature in the contact zone, the total friction power consumption of the bearing shows a gradual decreasing trend, and the decreasing rate becomes smaller and smaller. The total frictional power consumption follows the same trend as the viscosity of the grease as a function of temperature, with viscous stirring loss contributing the most, followed by friction between the ball and the cage, and the least coming from friction between the ball and the inner and outer rings.

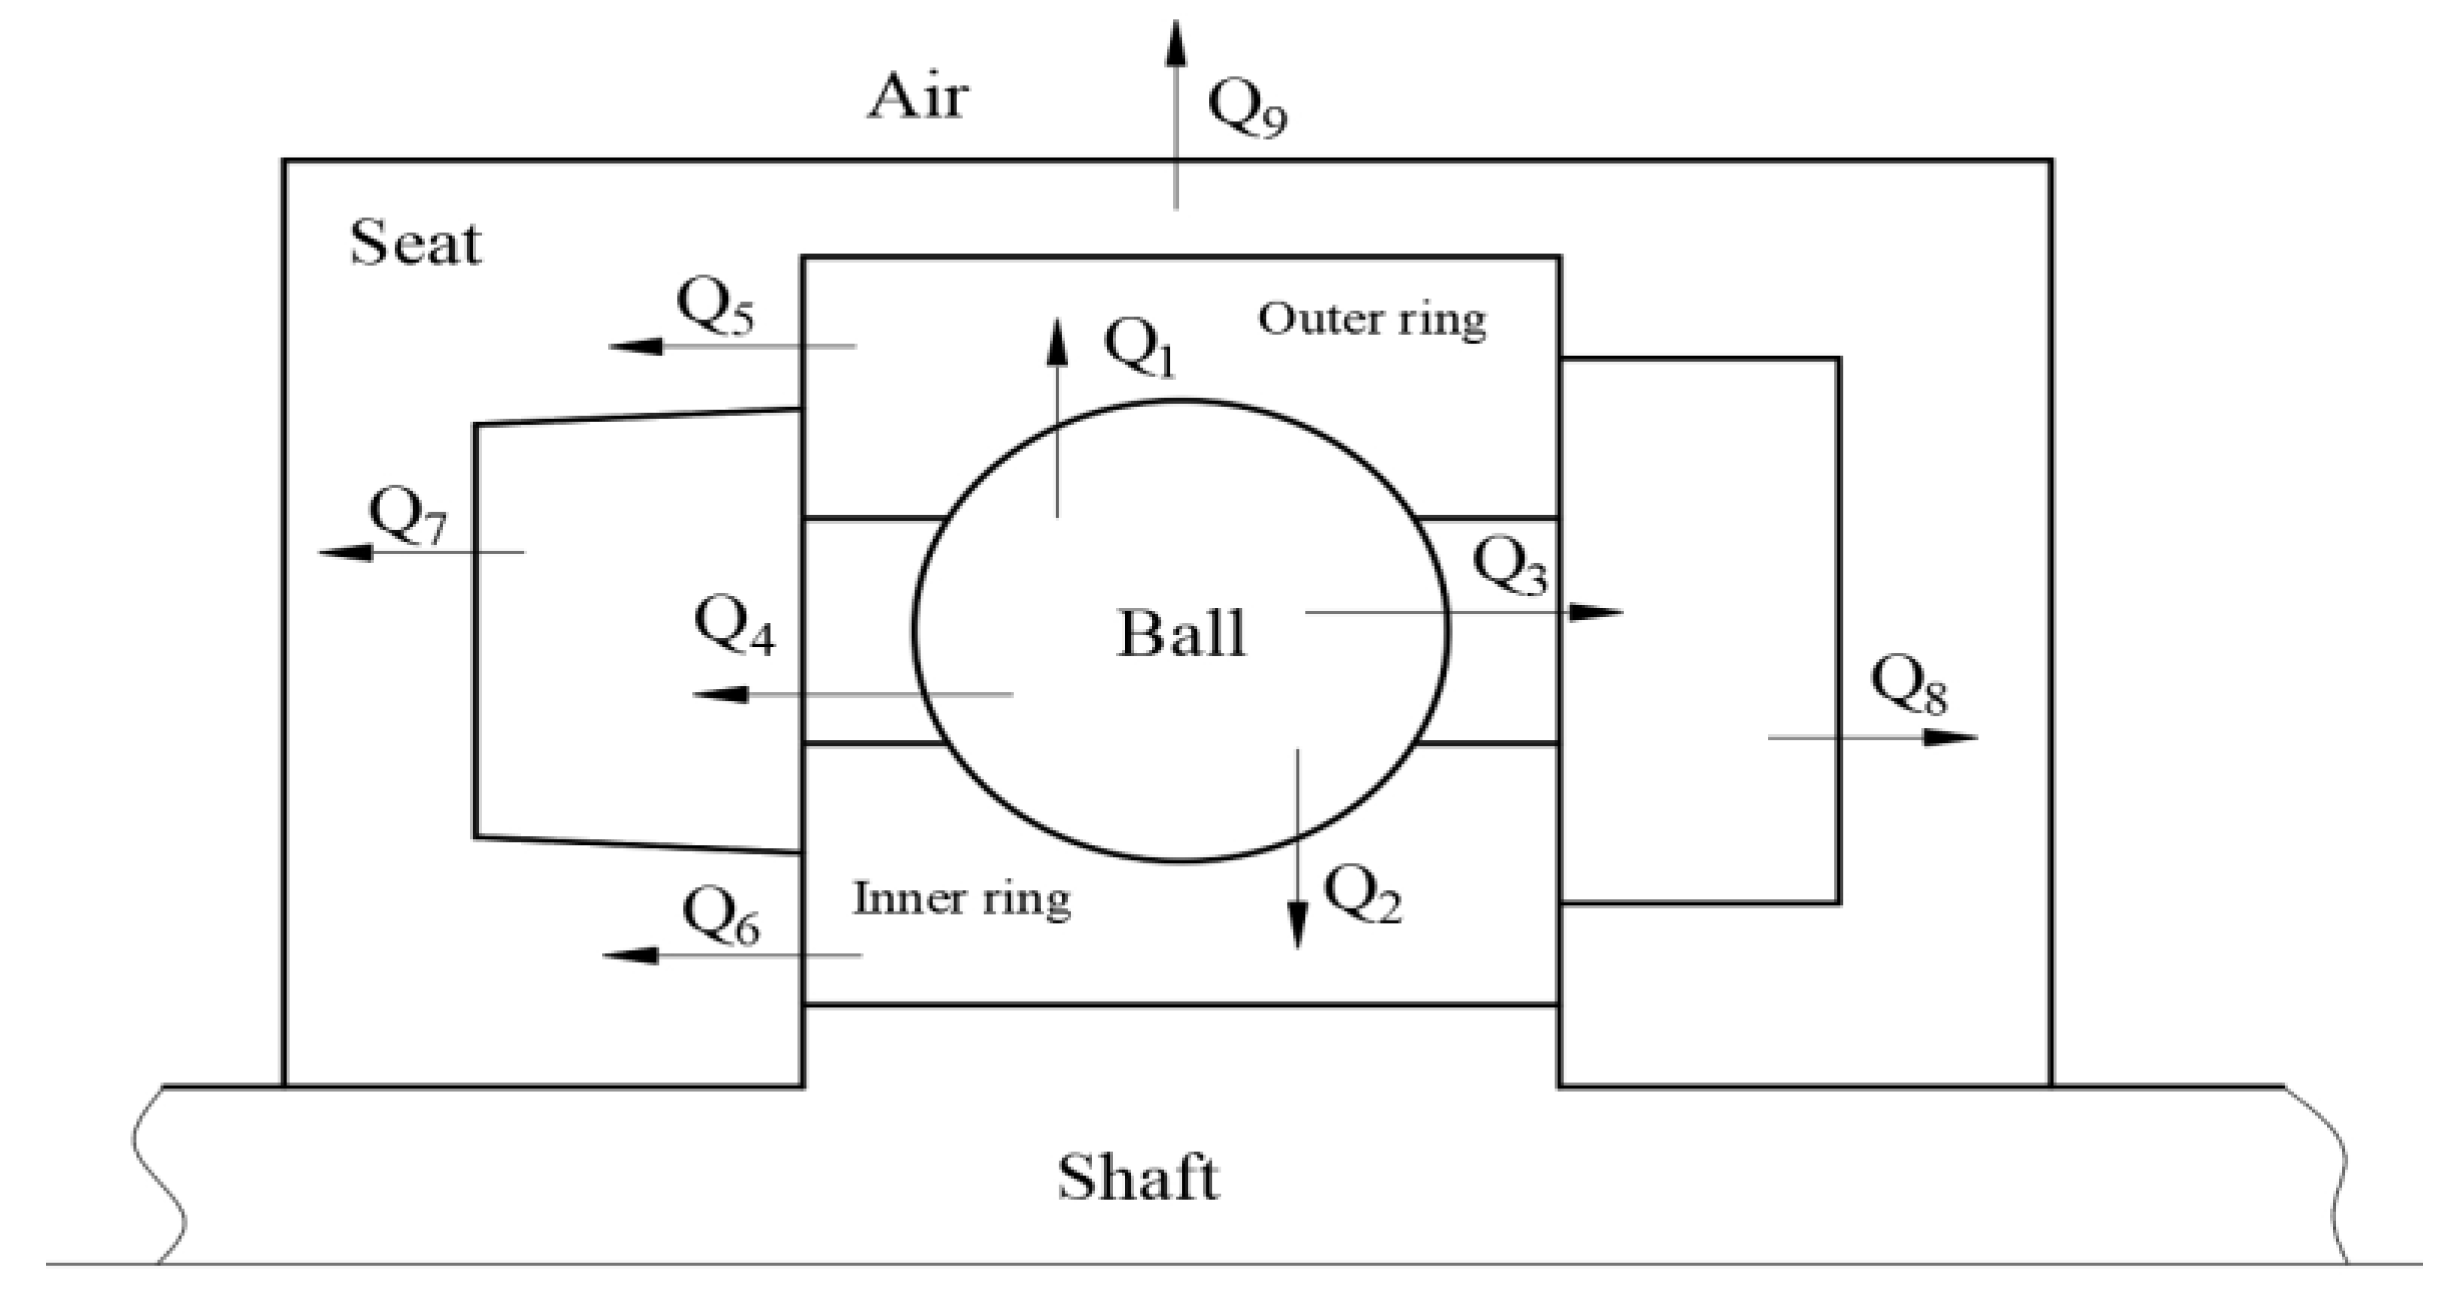
2.2. Heat Transfer Model

There are three forms of heat transfer, heat conduction between solids, heat convection between solids and fluids, and two thermal radiations separated from each other by space. According to the real working conditions of the traction motor bearing during the test operation, the heat transfer diagram of the bearing is shown in Figure 2, where Q1 and Q2 are the parts of the ball and the inner and outer raceways in contact with the heat conduction, Q3 and Q4 are the parts of the heat convection between the ball and the grease, Q5 and Q6 are the parts of the heat conduction between the outer ring of the bearing and the inner ring of the bearing and the bearing seat, respectively, Q7 and Q8 are the parts of heat convection between the grease and the bearing seat of the grease storage chamber on the left and right sides, and Q9 is the part of the heat convection between the bearing seat and the air.
Heat conduction refers to the heat transfer from an object with a high temperature to an object with a low temperature due to the movement between molecules when two objects are in contact. It occurs in the form of heat flux density, and the energy transfer formula is as follows, which can be used to calculate Q1, Q2, Q5, and Q6:
Q 0 = q n S = λ T n S
where q n —heat flux, W / m 2 ; S—thermal conduction contact area, m2; λ —thermal conductivity, W / ( m K ) ; T n —rate of change in temperature.
Convective heat transfer refers to the heat exchange that occurs when a fluid flows through a solid wall. Convective heat transfer can be divided into natural convection and forced convection, and the convective heat transfer formula is as follows, which can be used to calculate Q3, Q4, Q7, Q8, and Q9:
Q n = h v S ( T w T f )
where T w —wall temperature, °C; T f —fluid temperature, °C; S —convection area, m2; h v —convective heat transfer coefficient.
In the oil–air lubrication system, the heat dissipation in the bearing cavity is mainly completed by the forced convection of compressed air. Therefore, in this paper, the convection coefficient calculation model of the ball bearing model proposed by Crecelius et al. [31] is selected to calculate the convective heat transfer coefficient of each surface of the ball bearing.
h v = 0.0986 n v ( 1 ± D w cos α d m ) 1 / 2 λ f P r 1 / 3
where n —bearing working speed, r / min ; v —the kinematic viscosity of the lubricant, m 2 / s ; d m —bearing pitch diameter, mm; λ f —thermal conductivity of fluids; P r —Plante number.

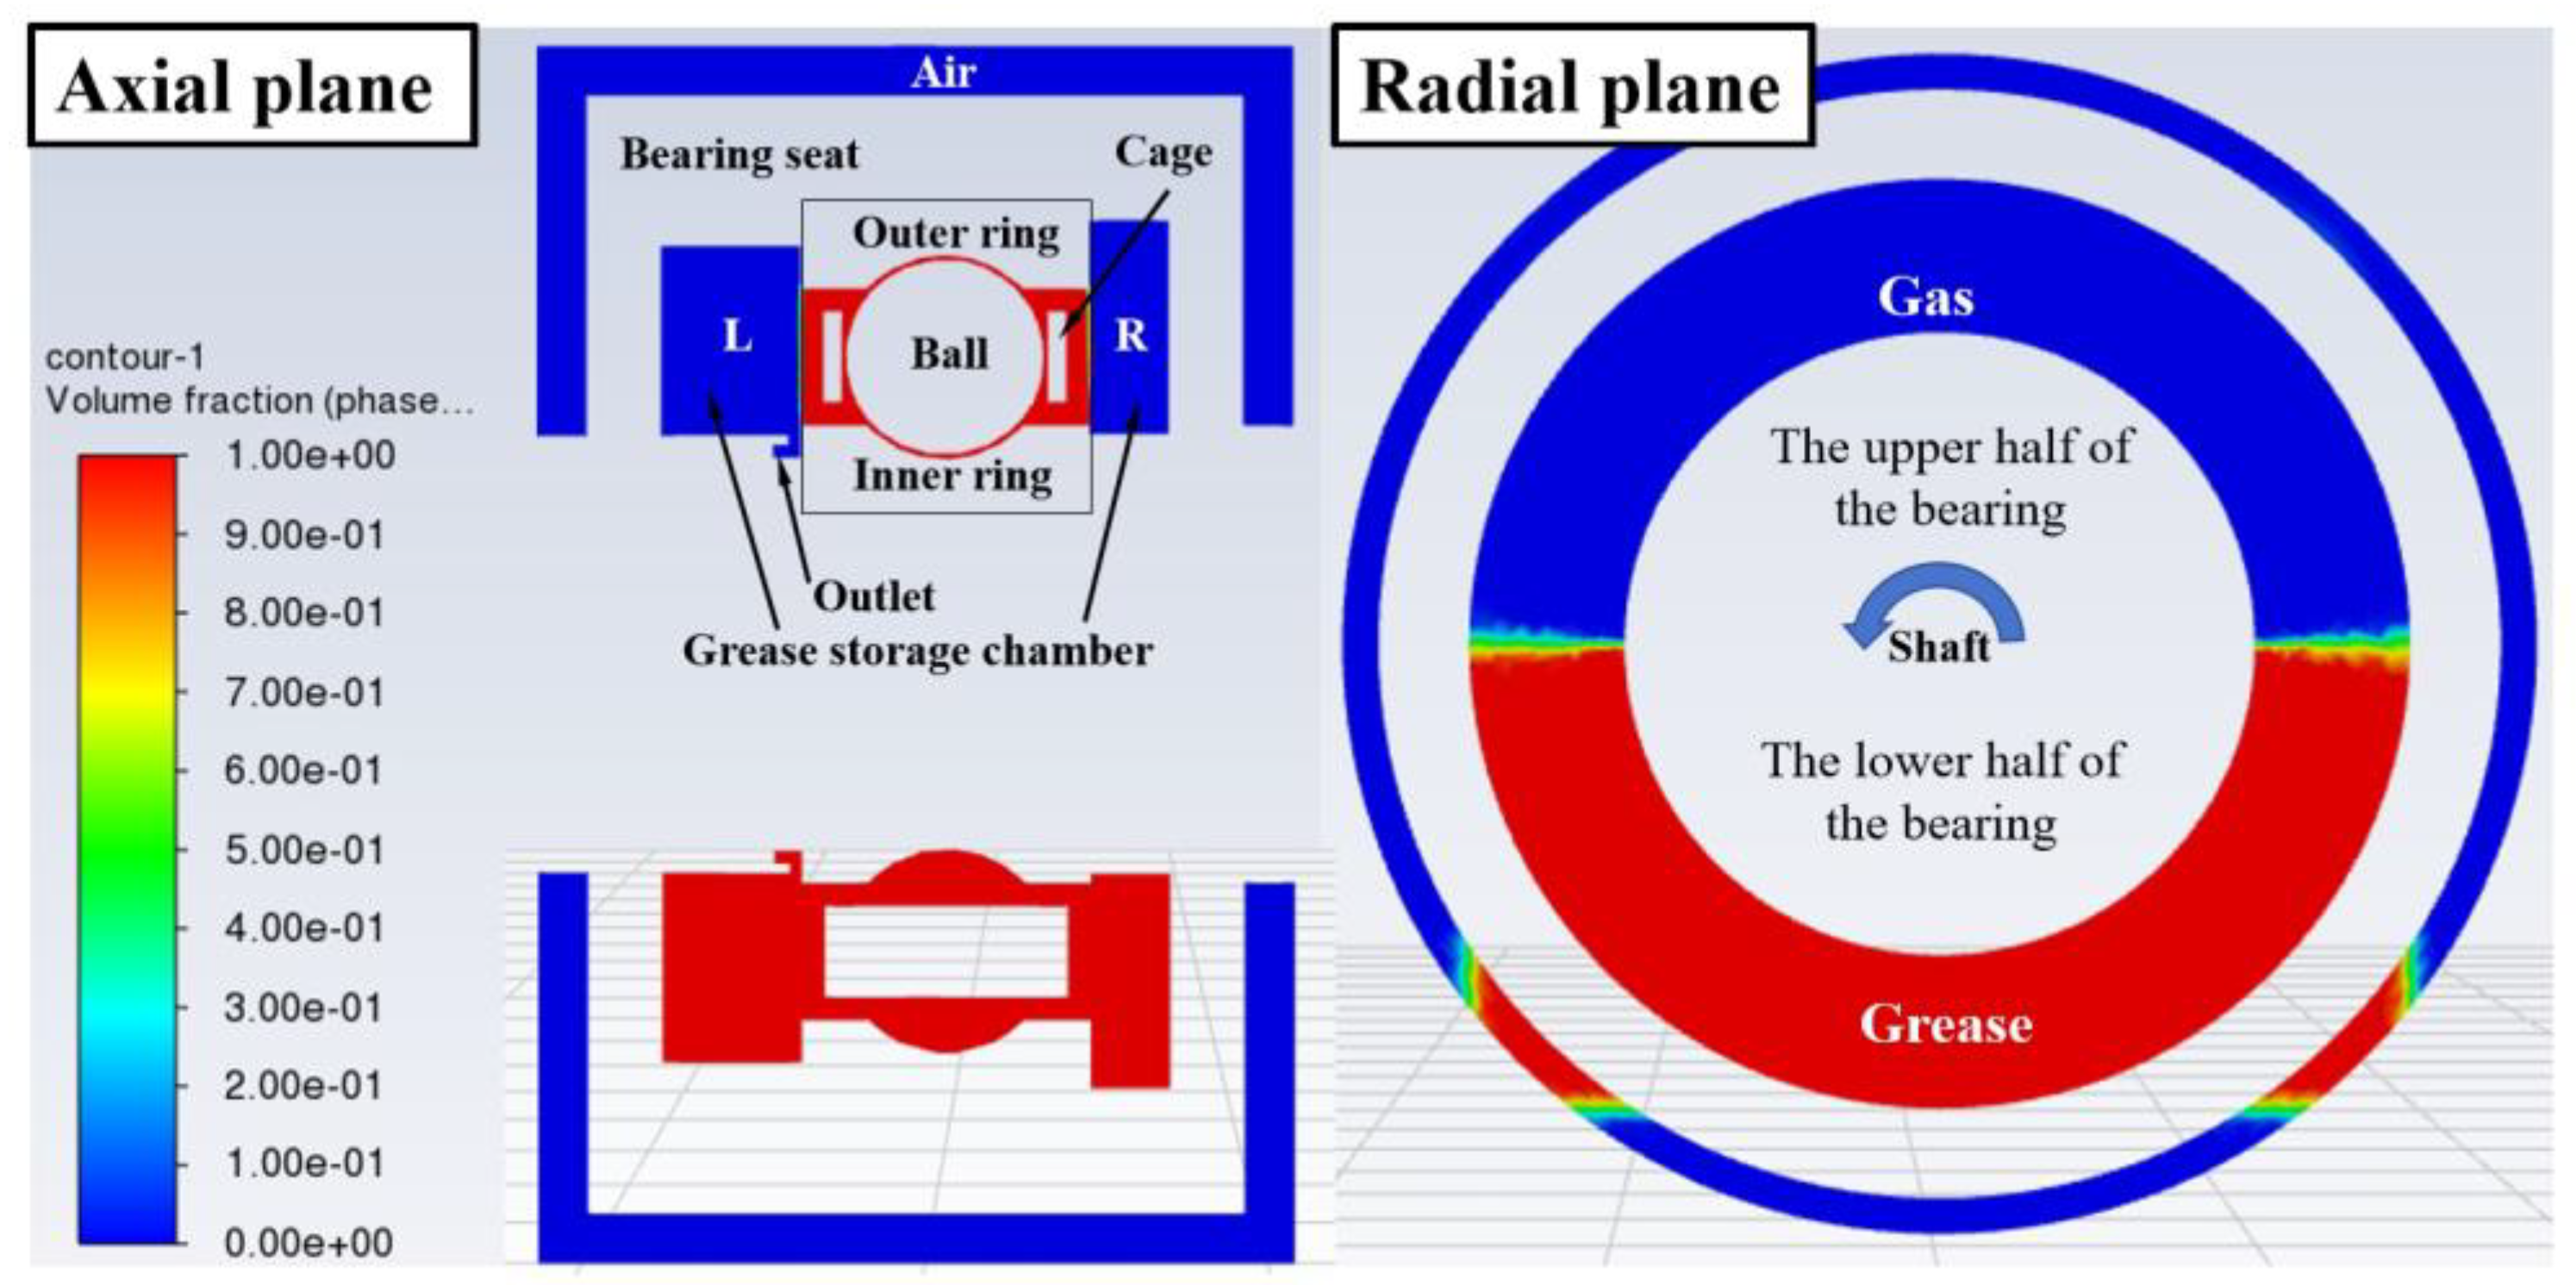
2.3. The Bearing Simulation Model Was Established

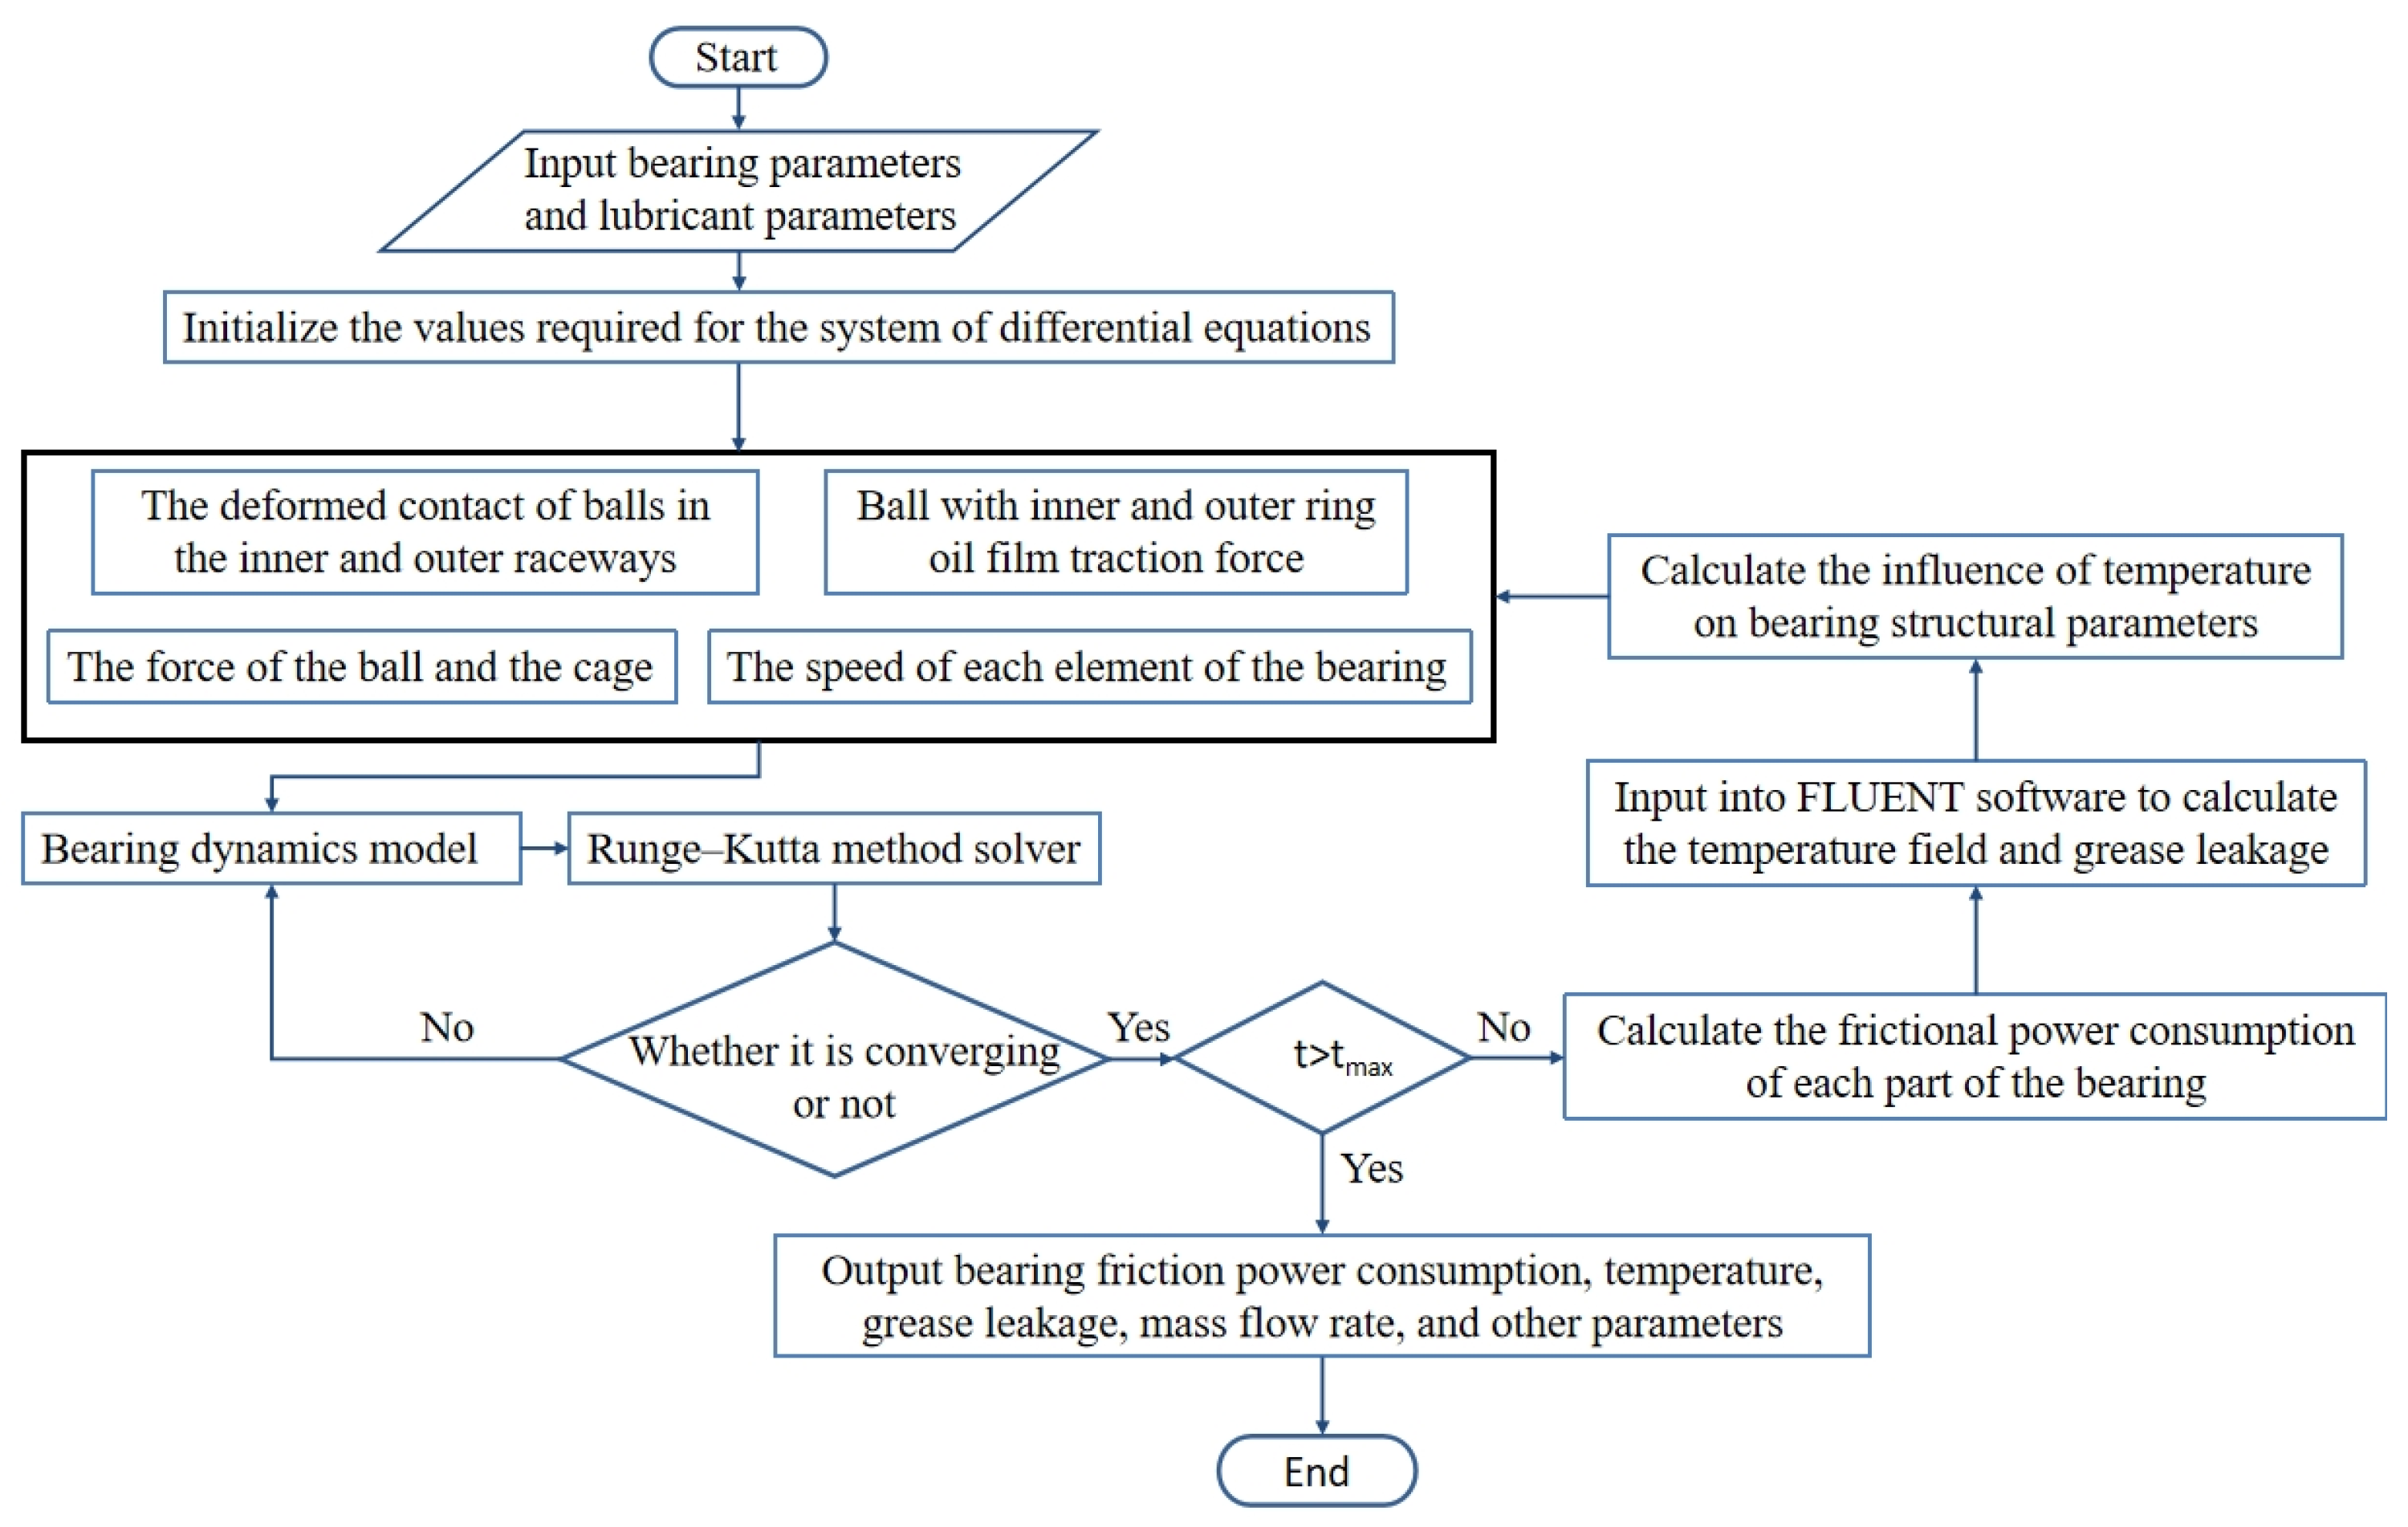
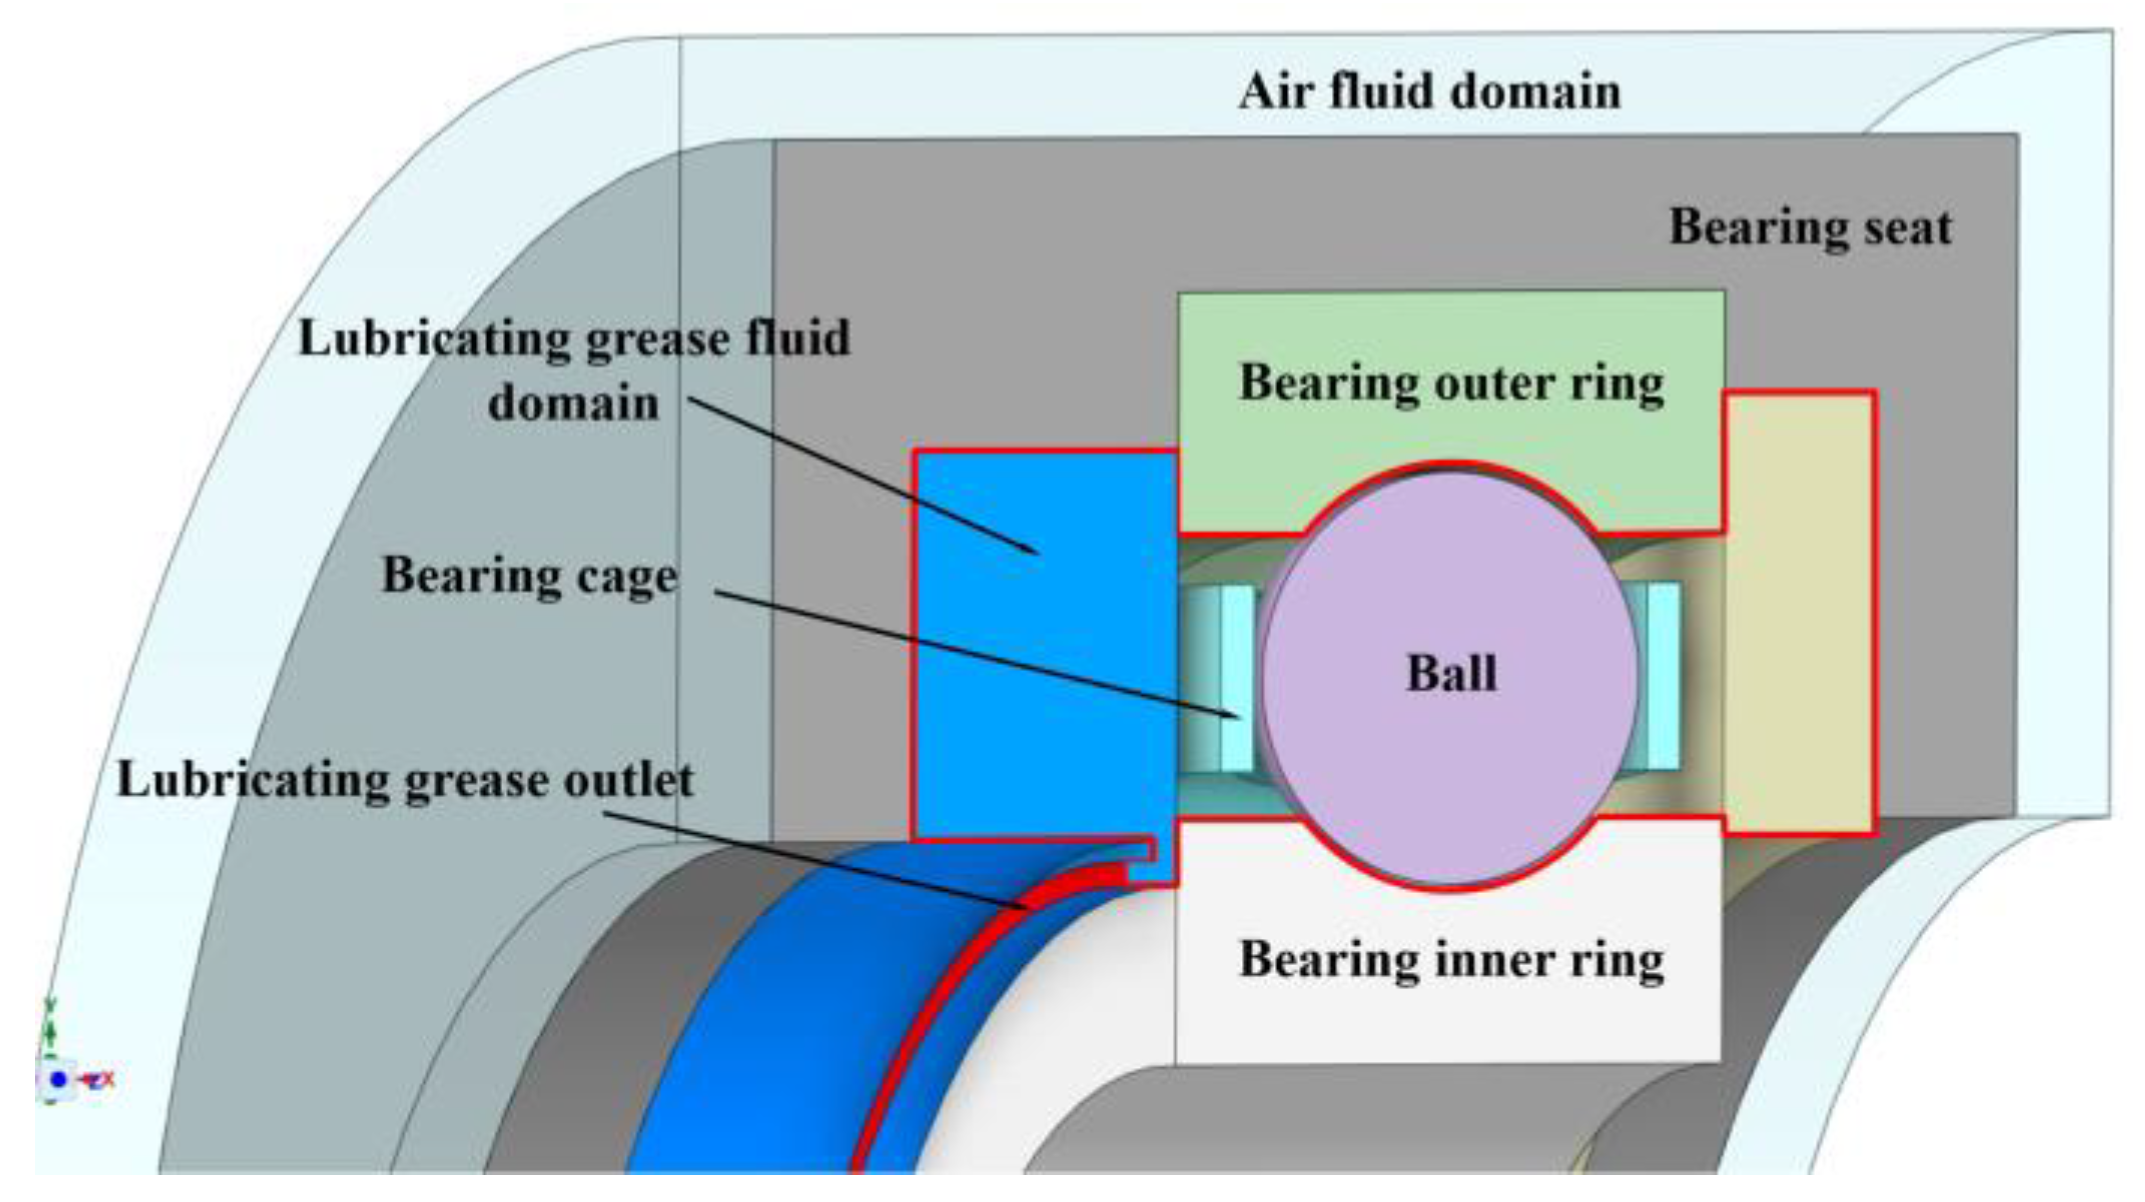
2.3.1. Establishment of Coupling Analysis Model

The fluid–solid thermal coupling analysis model is established to show the solution idea more intuitively. The algorithm flow chart is shown in Figure 3.
Firstly, the working condition parameters and structure parameters of the bearing are input, and the differential equations of bearing dynamics are established [30]. The Runge–Kutta method is used to solve. When the results converge, six kinds of friction power consumption in the bearing are calculated. Then, the friction power consumption is input into Fluent for simulation analysis, and the temperature, grease leakage, and grease flow rate are solved. Then, the influence of the temperature on bearing parameters and friction power consumption is calculated to achieve the coupling analysis.
The fourth-order Runge–Kutta method is an iterative method commonly used to solve systems of nonlinear differential equations. The solution principle is as follows:
y = f ( t , y ) y ( t 0 ) = y 0 y n + 1 = y n + h 6 ( k 1 + 2 k 2 + 2 k 3 + k 4 )
k 1 = f ( t n , y n ) k 2 = f ( t n + h 2 , y n + h 2 k 1 ) k 3 = f ( t n + h 2 , y n + h 2 k 2 ) k 4 = f ( t n + h , y n + k 3 )
Thus, the next value ( y n + 1 ) is determined by the initial value ( y n ), the product of iteration step h, and the slope(k) of an estimate. The slope is the weighted average of the following slopes:
slope h 6 ( k 1 + 2 k 2 + 2 k 3 + k 4 )

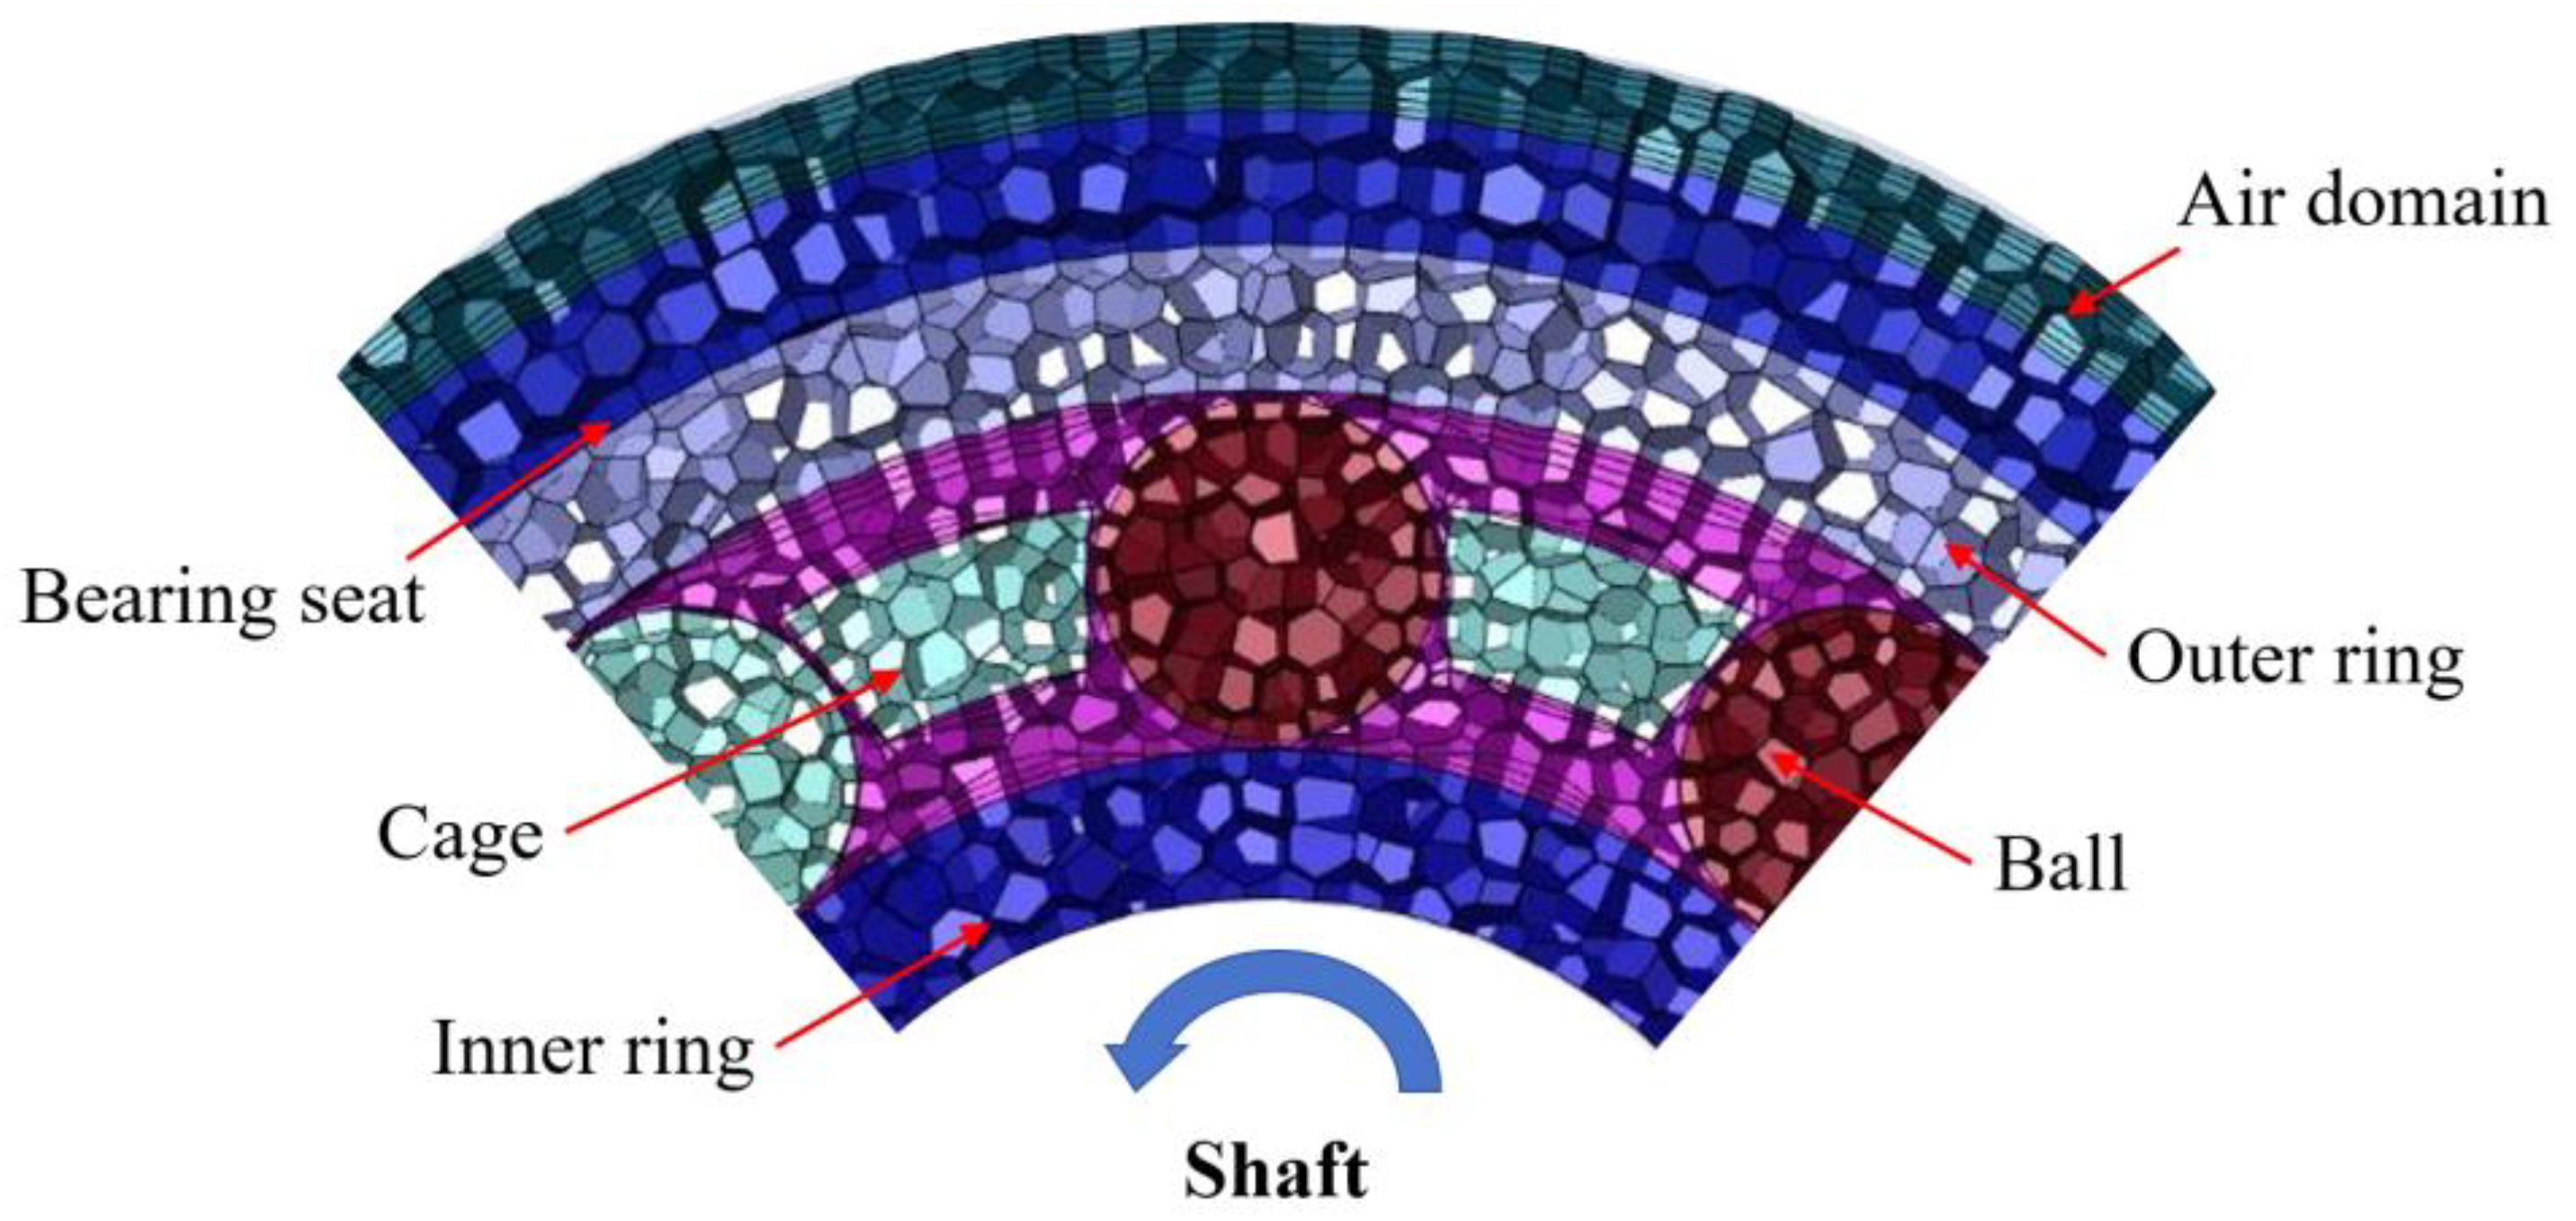
2.3.2. Establishment of Geometric Model

In this paper, a deep groove ball bearing for the nontransmission end of a high-speed rail traction motor is used as the object to construct a temperature field simulation and analysis model. The bearing model is 6215, the specific structural parameters are shown in Table 1, and the physical-property-related parameters are shown in Table 2.
Mesh was drawn and calculated by using FLUENT 2021 R1 software. In order to improve the efficiency of data processing and ensure the accuracy of simulation data, the following simplifications are made in the establishment of geometric models without affecting the accuracy of simulation analysis results:
(1)
The cage rivet has little influence on the temperature field analysis of the whole bearing, so the cage structure is simplified and drawn as an ordinary cage in the pre-treatment modeling.
(2)
Ignore the chamfer design of the bearing in the actual test operation, reduce the number of meshes and the difficulty of drawing, and improve the accuracy of meshes.
(3)
The diameter of the rolling element is taken as the minimum size within the tolerance range so as to increase the gap with the inner and outer ring raceways and reduce the calculation difficulty of the overall model.
(4)
During the operation of the bearing, the ball is not in direct contact with the inner and outer rings, and a lubricating film will be formed in the contact area. The empirical formula of oil film thickness (8) is fully considered in flow field modeling, and mesh refinement is carried out in this area.
h 0 = 2.69 α 0.53 ( η 0 u ) 0.67 R x 0.466 E 0 0.073 Q max 0.067 ( 1 0.61 e 0.72 K )
where R x is the equivalent radius of curvature of the ball along the rolling direction; Q max is the maximum load on the ball; K is the ellipticity of the contact ellipse; E 0 is the equivalent elastic modulus; α is the pressure index of viscosity; η 0 is the dynamic viscosity at atmospheric pressure; u is the average surface velocity.
The result of the volume mesh division of the simulation model is shown in Figure 4. The radial section of the bearing is taken to show the mesh division.

2.3.3. Boundary Condition Settings

Figure 5 shows a simplified simulation model of fluid–structure interaction, which consists of the air–fluid domain, the simplified model of the bearing seat, the inner and outer rings of the bearing, and the grease fluid domain (red wireframe selection area). Among them, the outermost layer is the air layer, the outermost air wall is set to be room temperature, the air and the bearing seat are convection heat exchange, the bearing seat wraps the bearing and the grease storage chamber, the inner ring is in contact with the shaft, the heat dissipation performance of the bearing seat is better than that of the shaft, and the heat dissipation of the shaft is not considered. The grease outlet is the red ring shown in the diagram, and the outlet is convection air by default.
According to the bearing heat generation analysis mentioned above, the value of friction power consumption corresponding to different operating temperatures of the grease is calculated. The frictional power consumption varies with the viscosity of the lubricant and the viscosity of the grease varies with the temperature of the contact zone, as shown in Figure 6. Therefore, it is difficult to set the thermal boundary of the bearing temperature field simulation, and this paper proposes an iterative method of bearing grease temperature and bearing friction power consumption to realize the setting of variable friction power consumption boundary conditions. A simplified, iterative schematic is shown in Figure 7.
The working condition of Figure 6 is 6.9 KN radial load, no axial load, and the rotational speed is 4800 r/min. A line plot of the total frictional power consumption of the bearing as a function of contact zone temperature and grease viscosity is calculated. The viscosity temperature curve of the grease exhibited a similar trend to the friction power consumption curve of the bearing. It was observed that higher grease viscosity led to increased heat generation from grease stirring, resulting in greater friction power consumption of the bearing in this specific working condition, and vice versa.
The iterative principle of variable frictional power consumption as the thermal boundary condition is that the monitoring point of the grease temperature change in the bearing cavity is set firstly, and the initial frictional power consumption at room temperature of 25 °C is taken as the initial thermal boundary. After starting the simulation, when the grease temperature in the contact zone rises to 40 °C, the frictional power consumption in the grease operating environment of 40 °C is set. Then, the simulation continues, and the above operations are repeated to complete the approximate iteration and realize the input of thermal boundary conditions under variable operating conditions. Smaller temperature spans led to higher iterative accuracy and a more realistic depiction of the bearing’s temperature rise process.

3. Transient Simulation and Analysis of Grease-Lubricated Bearings

The speed of the inner ring is 4800 r/min, the outer ring is fixed, and the rotational speeds of the cage and the balls are calculated according to the bearing dynamics. The rolling parameter is taken as the boundary condition of the motion wall. With the bearing cavity filled with grease, and the grease occupying 50% of both the left and right grease storage chambers, transient simulation analysis was conducted to analyze the two-phase distribution of oil and gas and the temperature rise of the bearing. The study observed the temperature rise and distribution in a bearing as the grease temperature detection point reached different temperatures over time. Three grease monitoring points near the raceway were selected to reflect the grease temperature by averaging their values.

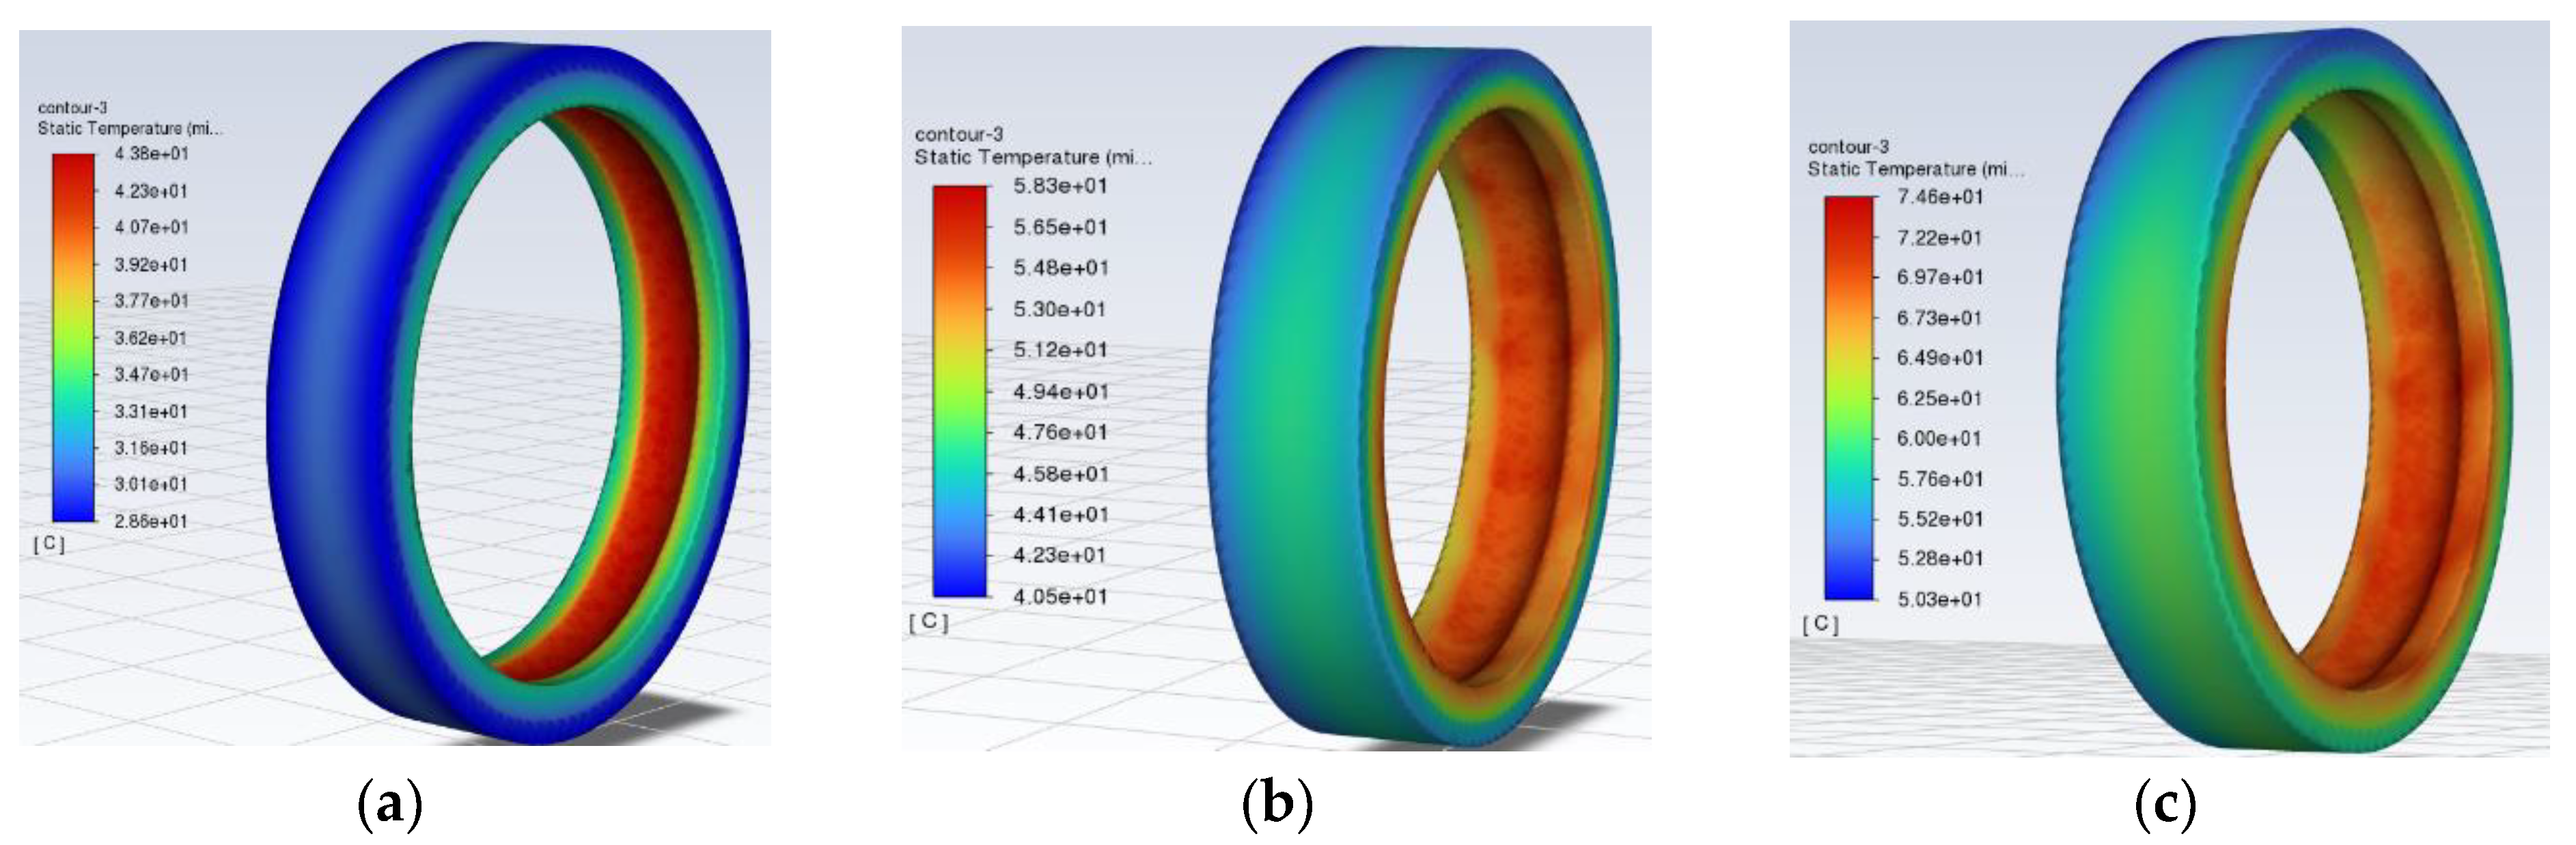
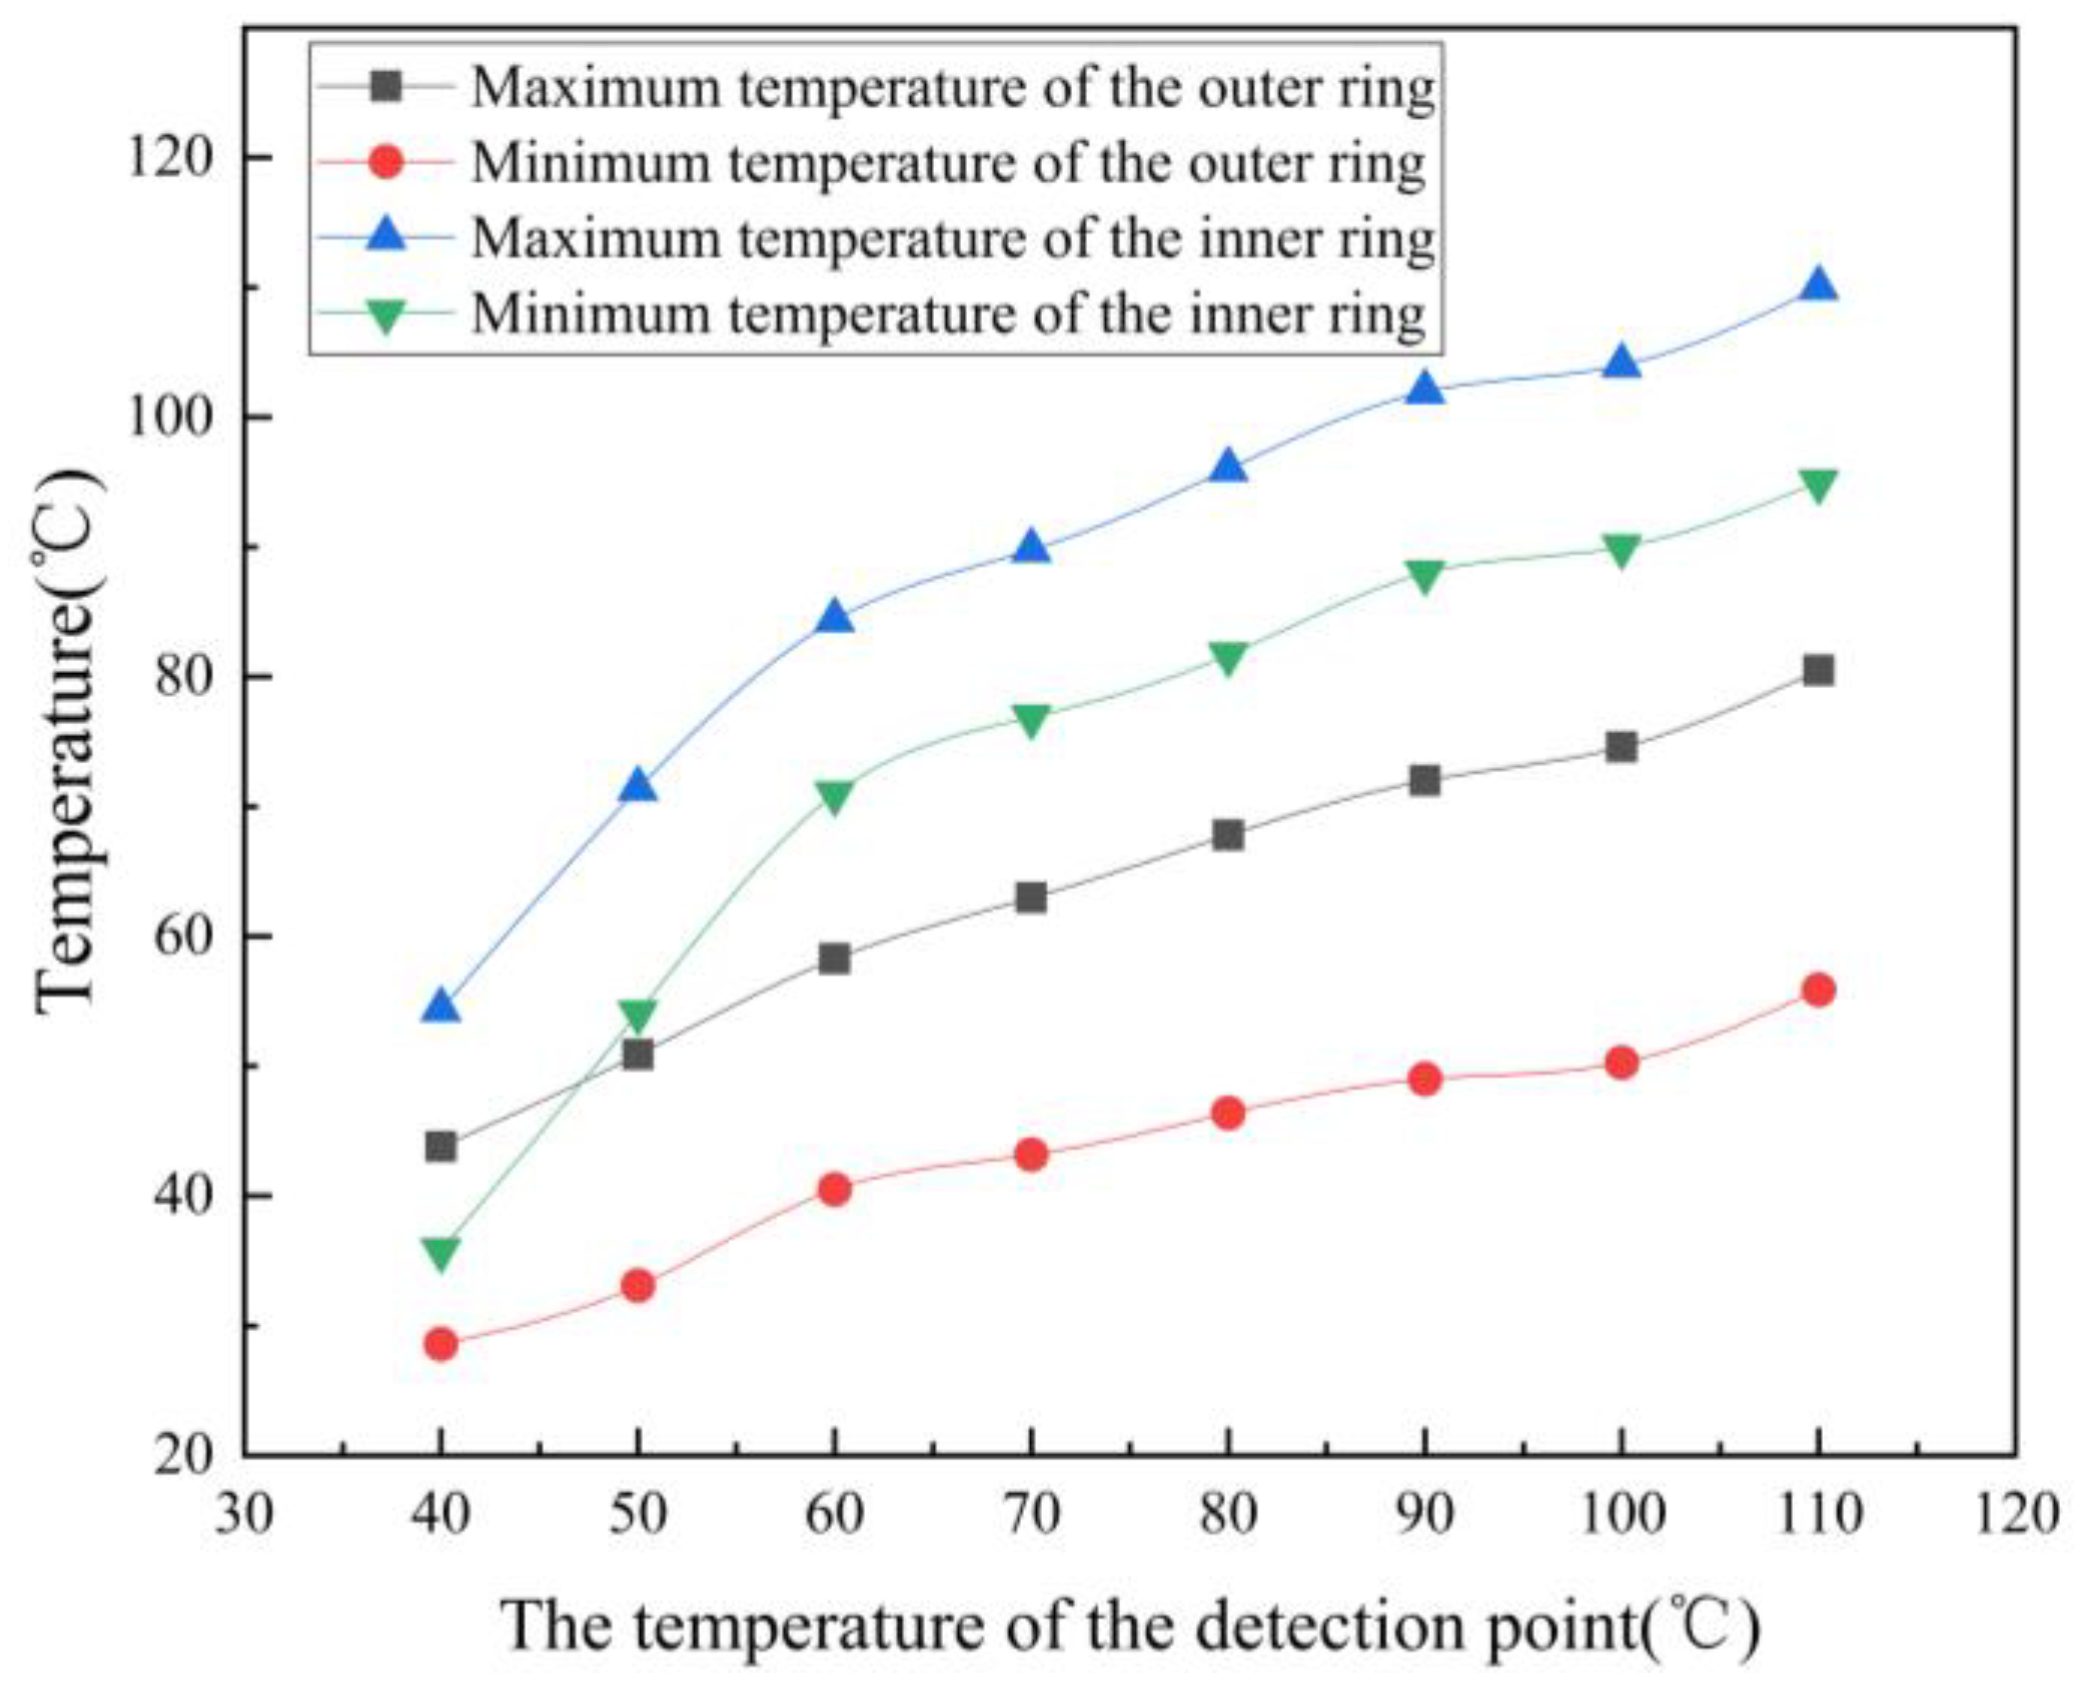
3.1. Temperature Field Analysis of Grease-Lubricated Bearings

Before the simulation began, three grease monitoring points near the raceway were selected to reflect the grease temperature in the bearing cavity by averaging the average value. As the temperature of the monitoring point rises, the variable frictional power consumption is used as the boundary condition. The temperature distribution of the outer and inner ring temperatures of the bearing as the grease monitoring points reach different temperatures over the simulation time is analyzed, as shown in Figure 8 and Figure 9. In order to facilitate the observation of the temperature rise of the bearing, the maximum temperature and minimum temperature of the inner and outer rings of the bearing are drawn as curves, as shown in Figure 10. The monitoring points record the change in the average temperature of the inner and outer rings of the bearing with the number of iteration steps. The temperature rise curve of the inner and outer rings of the bearing is shown in Figure 11.
Observe the temperature distribution of the outer and inner rings of the bearings in Figure 8 and Figure 9. As the simulation time increases, the overall temperature of the bearing shows an upward trend. The temperature distribution in the outer ring in Figure 8c is obviously not as uniform as in Figure 8a. The reason is that the inner ring of the bearing is mated to the spindle, and the outer ring is fixed to the bearing housing. The grease is deposited in the lower part of the bearing due to gravity, and the heat generated by the grease stirring is high. There is heat conduction between the bearing and the bearing seat in the upper part, and the convection heat dissipation of the air occurs. As a result, the temperature distribution of the outer ring of the bearing shows that the temperature of the upper half of the ring is less than that of the lower half of the ring. Since the inner ring rotates with the shaft, the overall temperature distribution uniformity of the inner ring is better than that of the outer ring.
As can be seen from Figure 10, the temperature of the inner ring of the bearing is higher than that of the outer ring of the bearing. With the increase in running time, the temperature of the inner and outer rings shows an upward trend, but the temperature growth rate gradually decreases. From the graph of the interaction between viscosity, temperature, and frictional power consumption of the grease in Figure 6, it can be seen that the lower the viscosity, the smaller the frictional power consumption, so the temperature growth rate is reduced. The trend of the temperature rise pattern of the inner and outer rings of the bearing is consistent with that of Figure 6.
The red line in Figure 11 represents the temperature rise curve of the average temperature in the contact zone of the inner ring. The blue line represents the temperature rise curve of the average temperature of the bearing outer ring. During the temperature rise process, the heat generation of the bearing is more than the heat dissipation. When the bearing is operated for a period of time, the temperature of the outer ring of the bearing gradually reaches a maximum of 108 °C. The cavity temperature is high and the grease is sheared and thinned. This process discharges excess grease out of the bearing cavity. The heat generated by the grease stirring in the cavity is reduced, and the bearing temperature is reduced. When there is only a moderate amount of grease left in the bearing cavity and it is effectively lubricated, the heat generation and heat dissipation reach an equilibrium state. At the end of the run-in phase, the temperature of the outer ring of the bearing reaches an equilibrium of 57 °C.

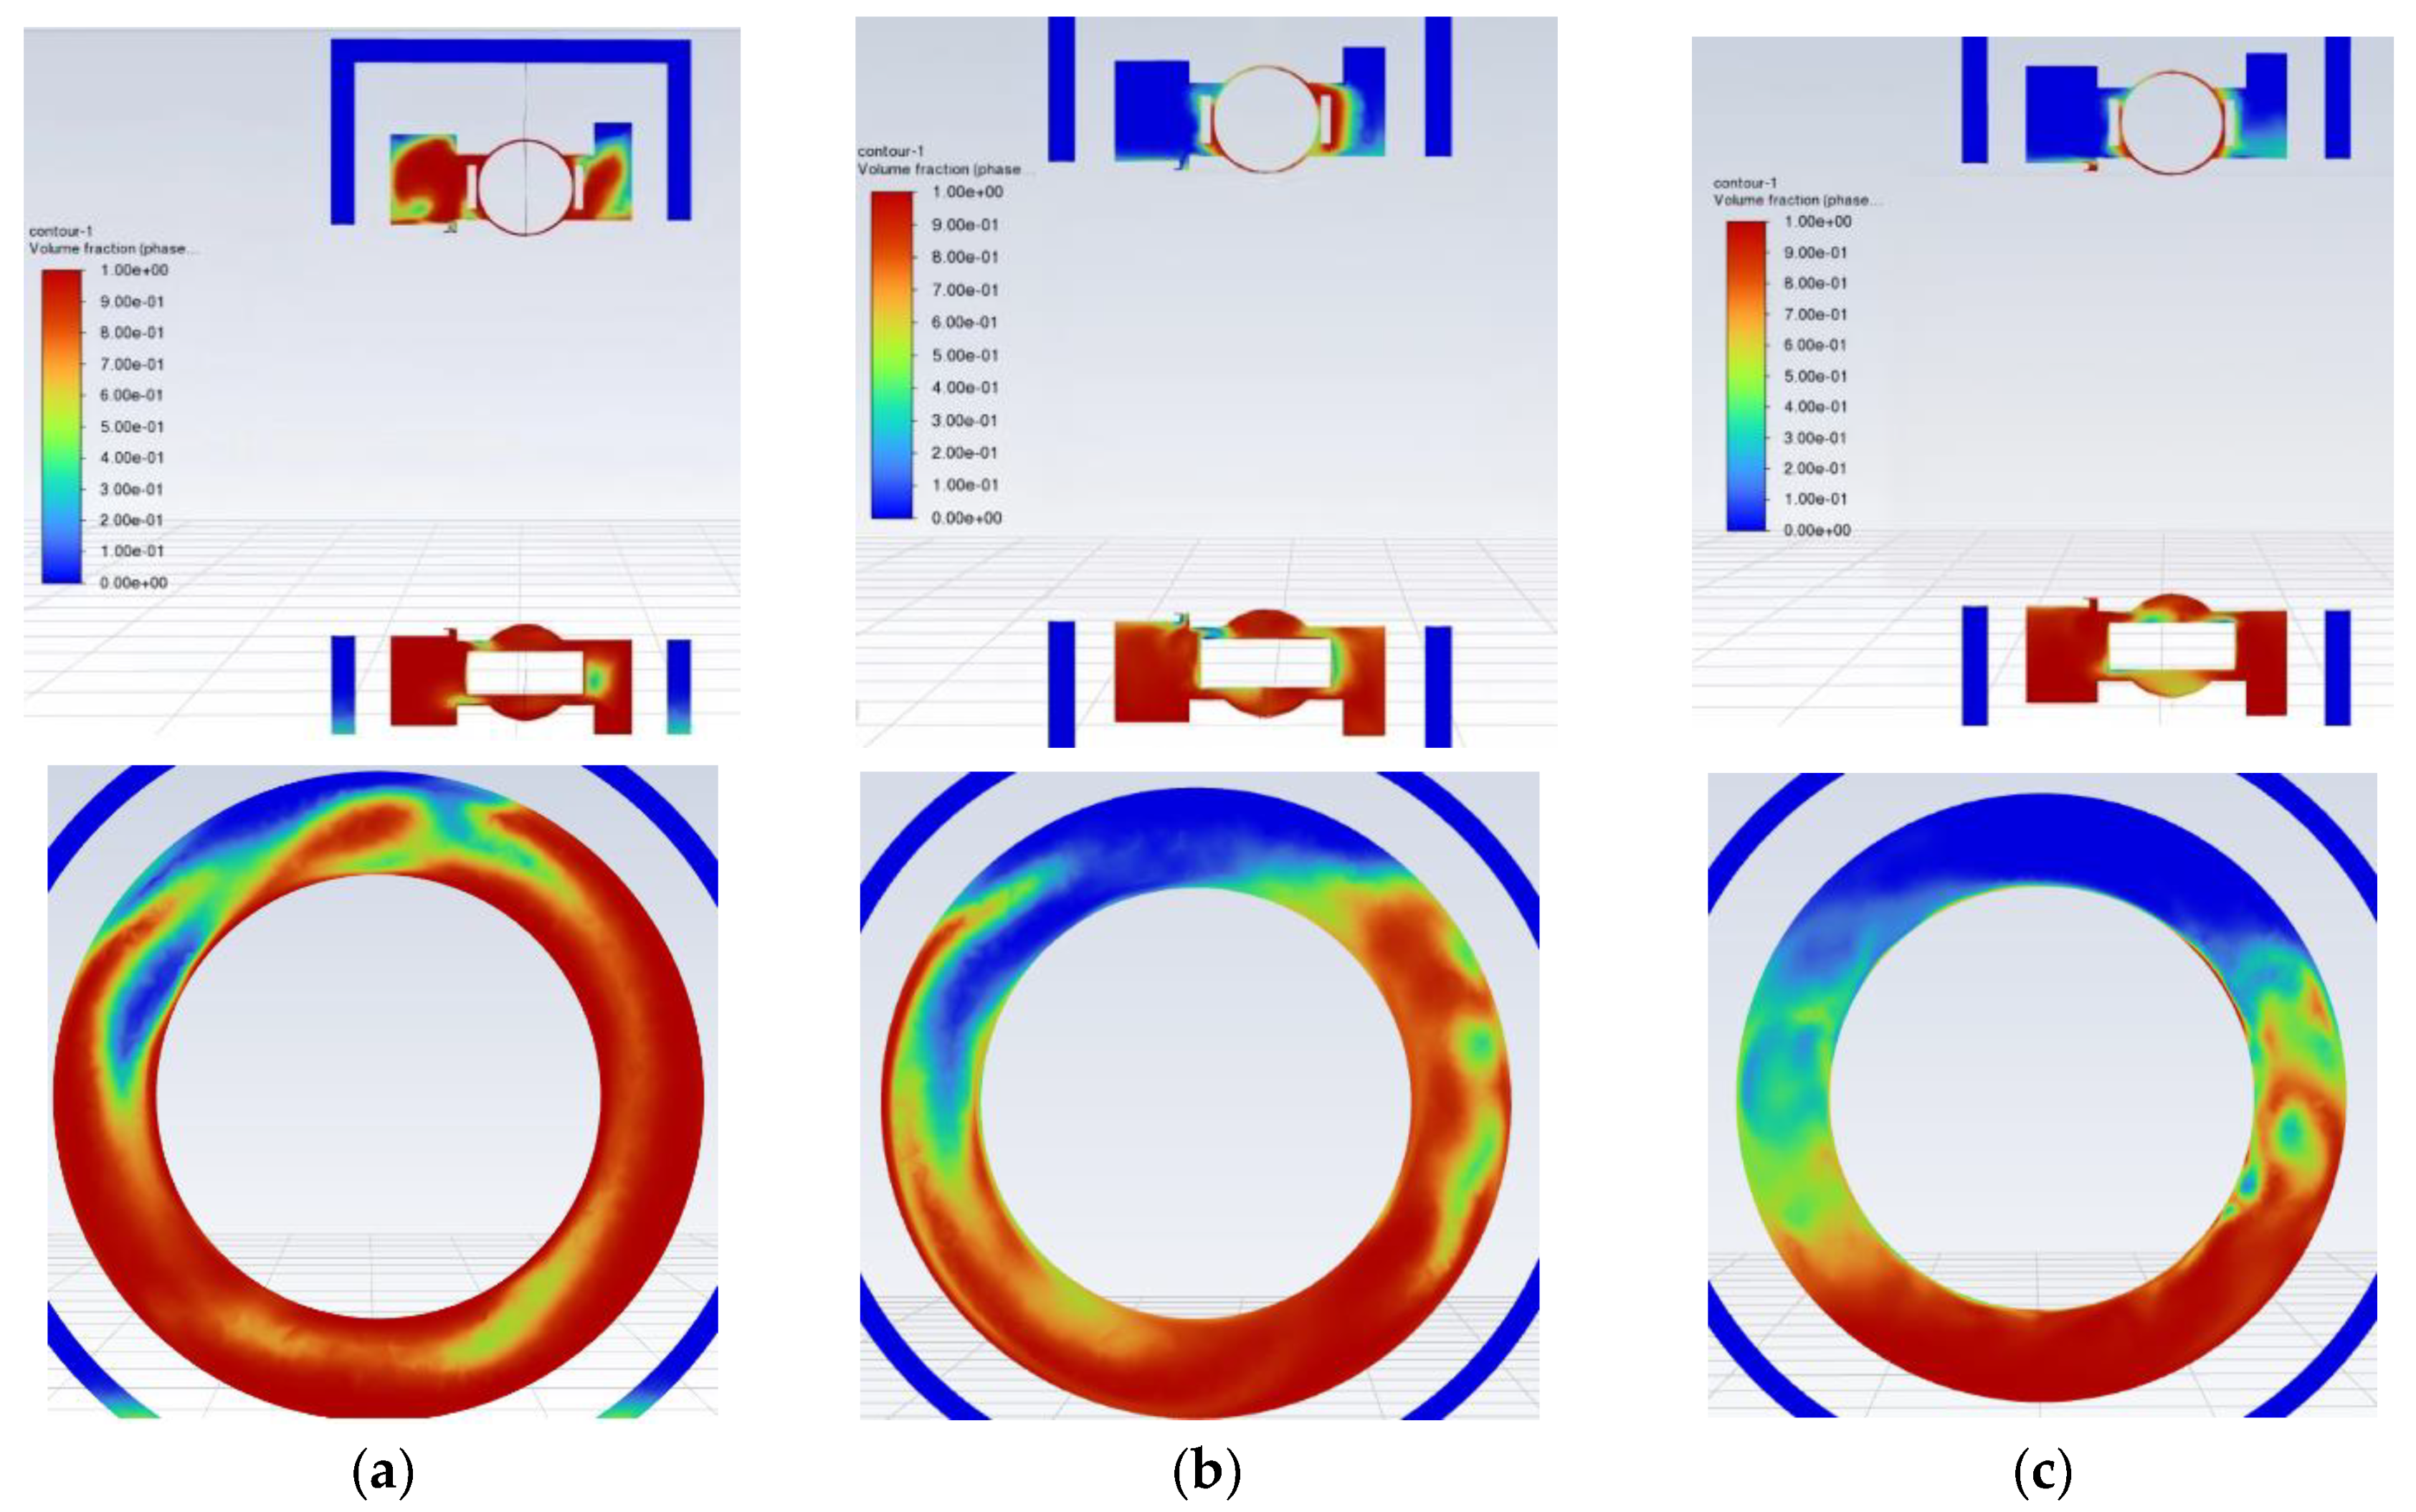
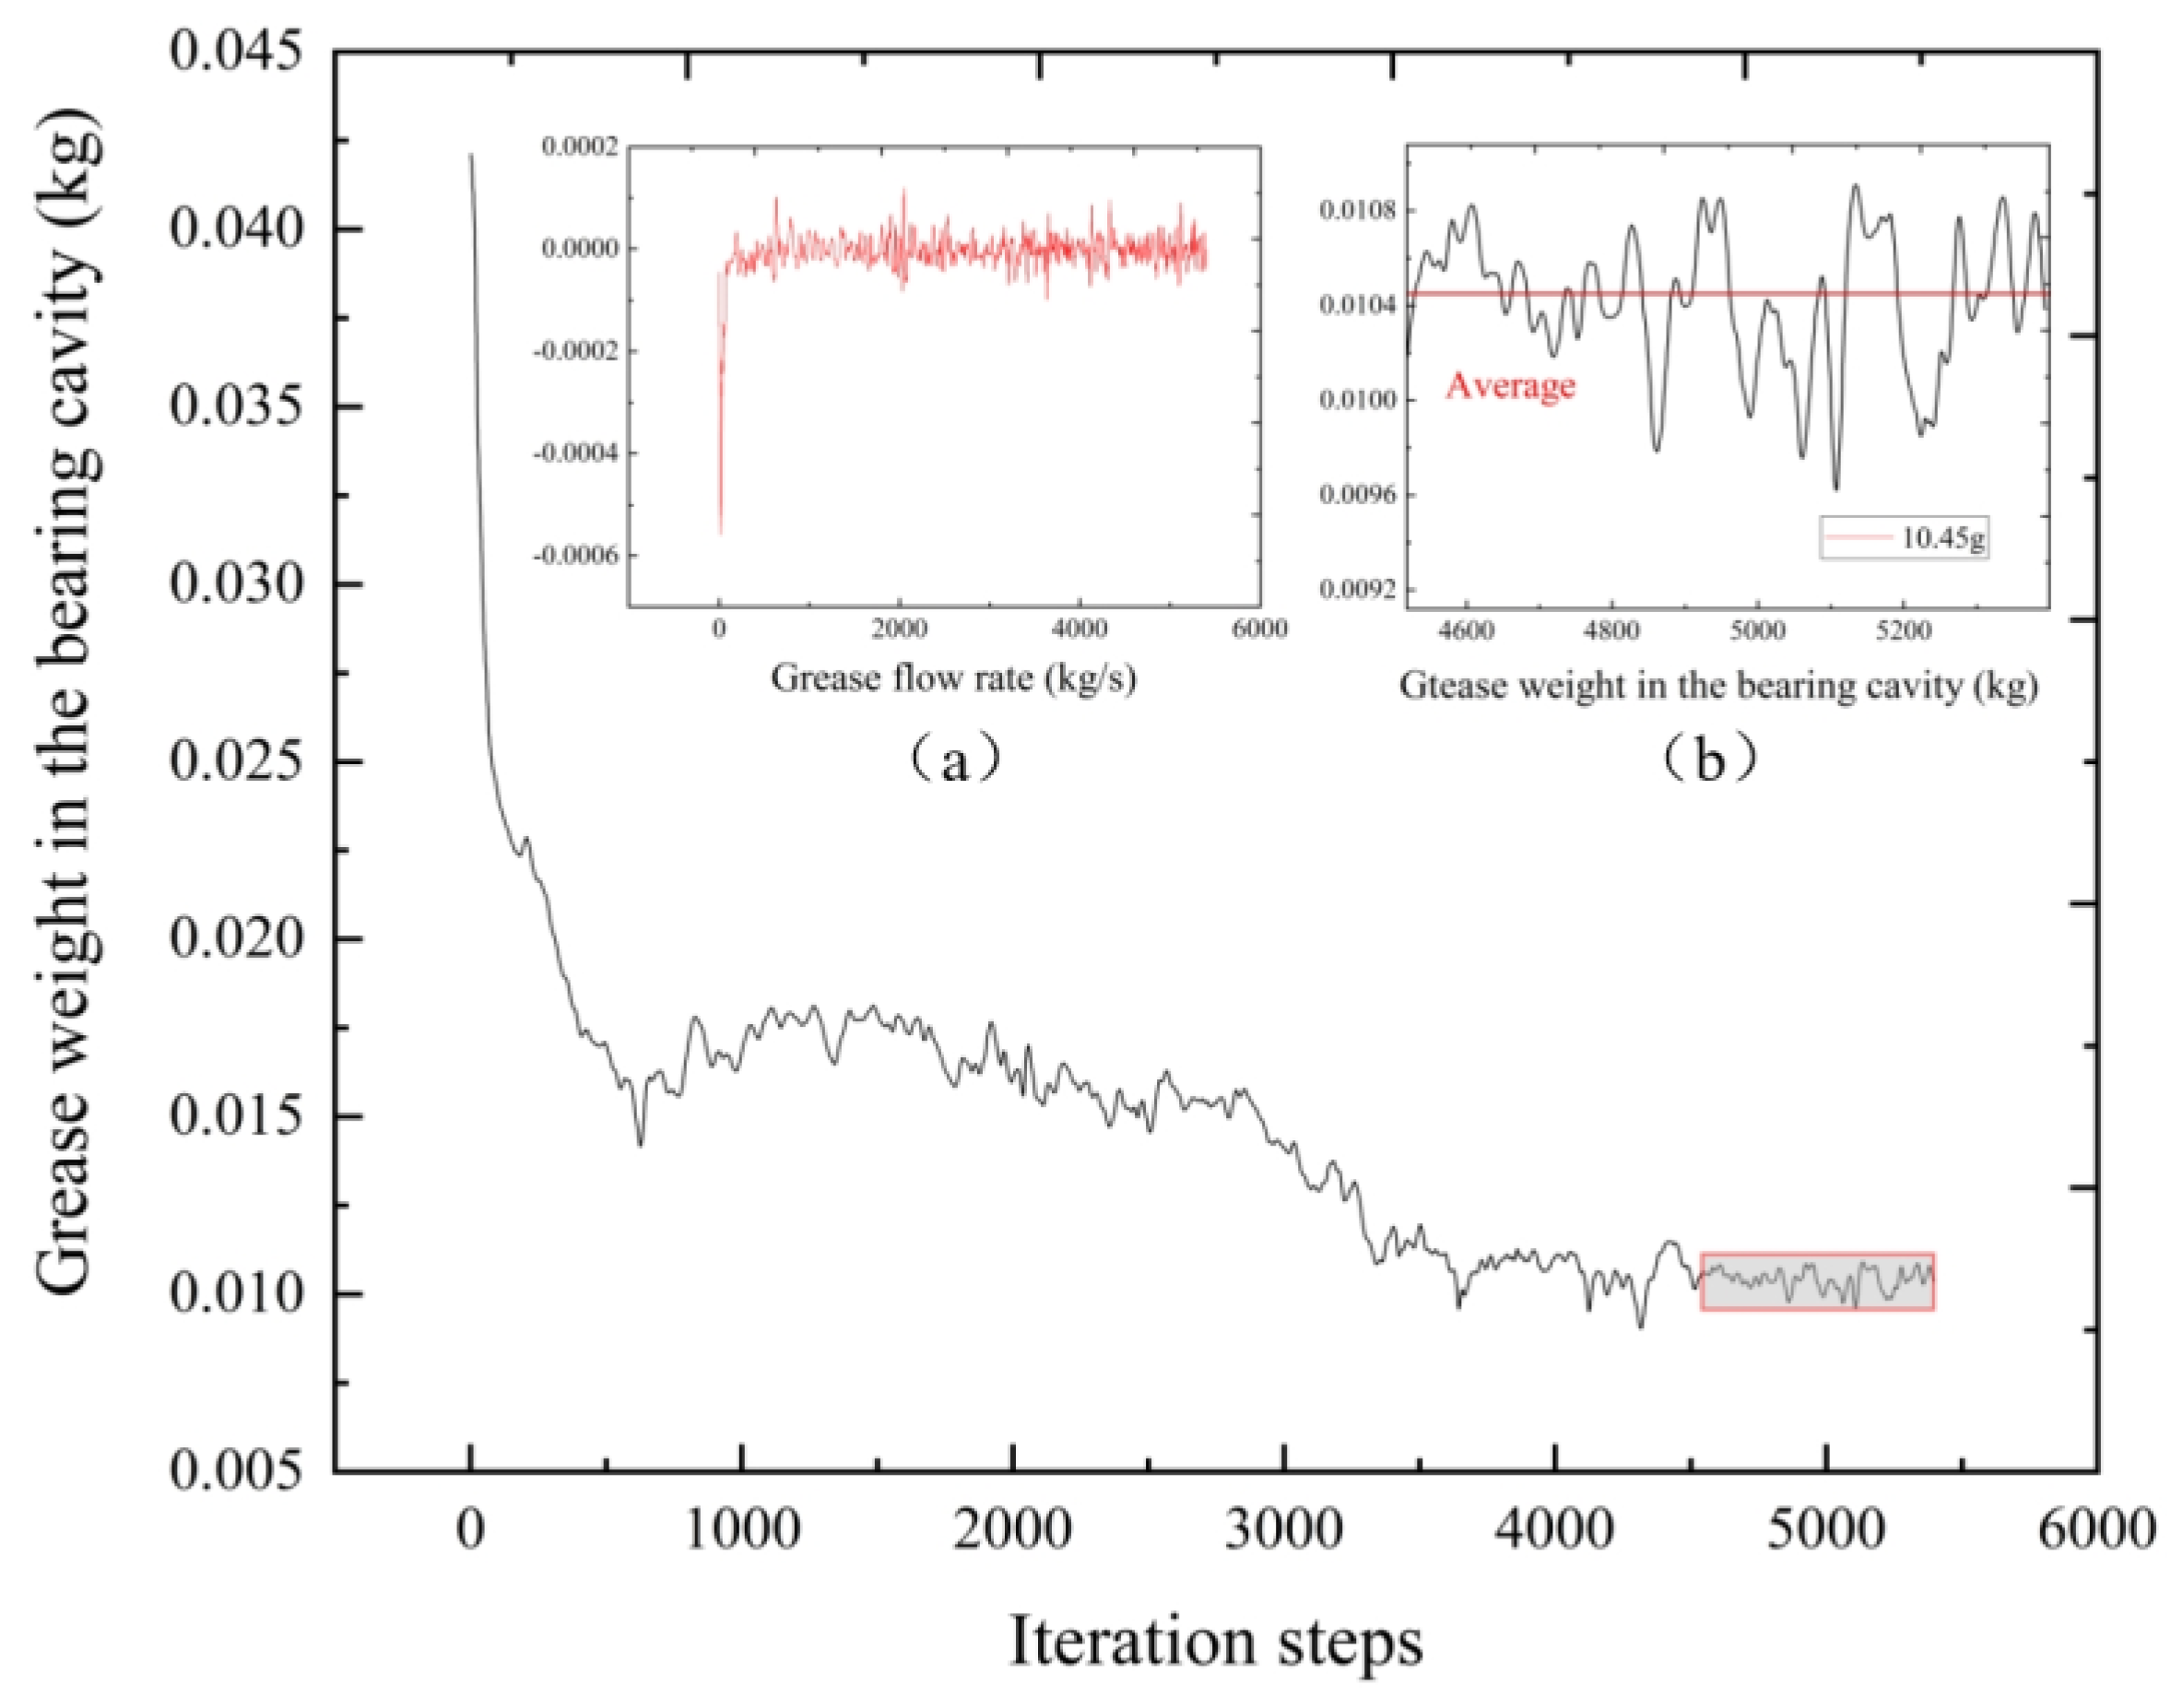
3.2. Simulation Analysis of Grease Flow Behavior

The flow behavior of the grease in the bearing cavity was analyzed under the condition that the bearing cavity was full of grease and the grease of the left and right grease chambers accounted for 50%, and the initial grease filling amount is shown in Figure 12. The red area represents the grease area, the blue area represents the gas cavity area, and the blank area is the inner and outer rings of the bearing, the bearing seat, and the shaft. Figure 13 shows the radial and axial cross-sections of the bearing cavity and the flux of grease at the outlet at different temperatures at the monitoring point.
The grease chamber is initially filled with 50% grease, and under the effect of gravity, the grease collects in the lower half ring of the grease chamber. As the bearing rotates, the grease in the bearing cavity is squeezed to both sides of the grease chamber. Due to the presence of inertial centrifugal force, the grease is thrown to the upper half ring of the grease chamber as shown in Figure 13a. The temperature of the grease at the monitoring point increases as the running time increases. The grease flows out of the outlet and the amount of grease in the bearing cavity and grease chamber decreases. The reason for this is that the temperature increases the viscosity of the grease and the phenomenon of shear thinning of the grease occurs.
In order to study the temperature rise mechanism and grease flow behavior during bearing operation, it is important to investigate the amount of grease involved in effective lubrication in the contact zone. Therefore, it is necessary to analyze the amount of residual grease in the bearing cavity. The simulation results are shown in Figure 14, and the formula for calculating the amount of residual grease in the bearing cavity is as follows.
M = M 0 + t 0 t w i w o dt
where M 0 is the initial grease filling mass, kg ; w i is the amount of grease flowing into the bearing per unit time, kg / s ; w o is the amount of grease flowing out of the bearing per unit time, kg / s .
With the rotation of the inner ring, cage, and ball bearing, a large amount of grease in the bearing cavity rushes into the grease chambers on both sides. This leads to a sudden drop in the amount of grease in the bearing cavity and an increase in the amount of grease in the grease chambers on both sides, at which time the rate of flow out of the bearing cavity reaches a maximum. The flow state of the grease is gradually stabilized with the increase in the running time. The amount of grease in the bearing cavity and the grease chambers fluctuates and tends to be in dynamic equilibrium. The rate of grease inflow and outflow in the bearing cavity fluctuates above and below the 0 scale. As shown in the partially enlarged Figure 14b, the amount of grease in the bearing cavity after reaching the dynamic equilibrium fluctuates above and below 10.45 g.
The mass flow rate at the bearing outlet is shown in Figure 15. The amount of grease in the bearing cavity and in the grease chamber is much greater than the amount required for bearing lubrication. At the beginning of the bearing operation, the grease outflow rate at the outlet is high. Because of the large amount of grease in the initial period, the heat generated by stirring is large. When the temperature inside the bearing cavity rises, the viscosity of the grease decreases, aggravating the grease outflow. When the bearing completes the break-in stage, the grease content in the bearing cavity reaches the optimum, the temperature reaches the equilibrium state, and the grease discharge behavior at the outlet stops.

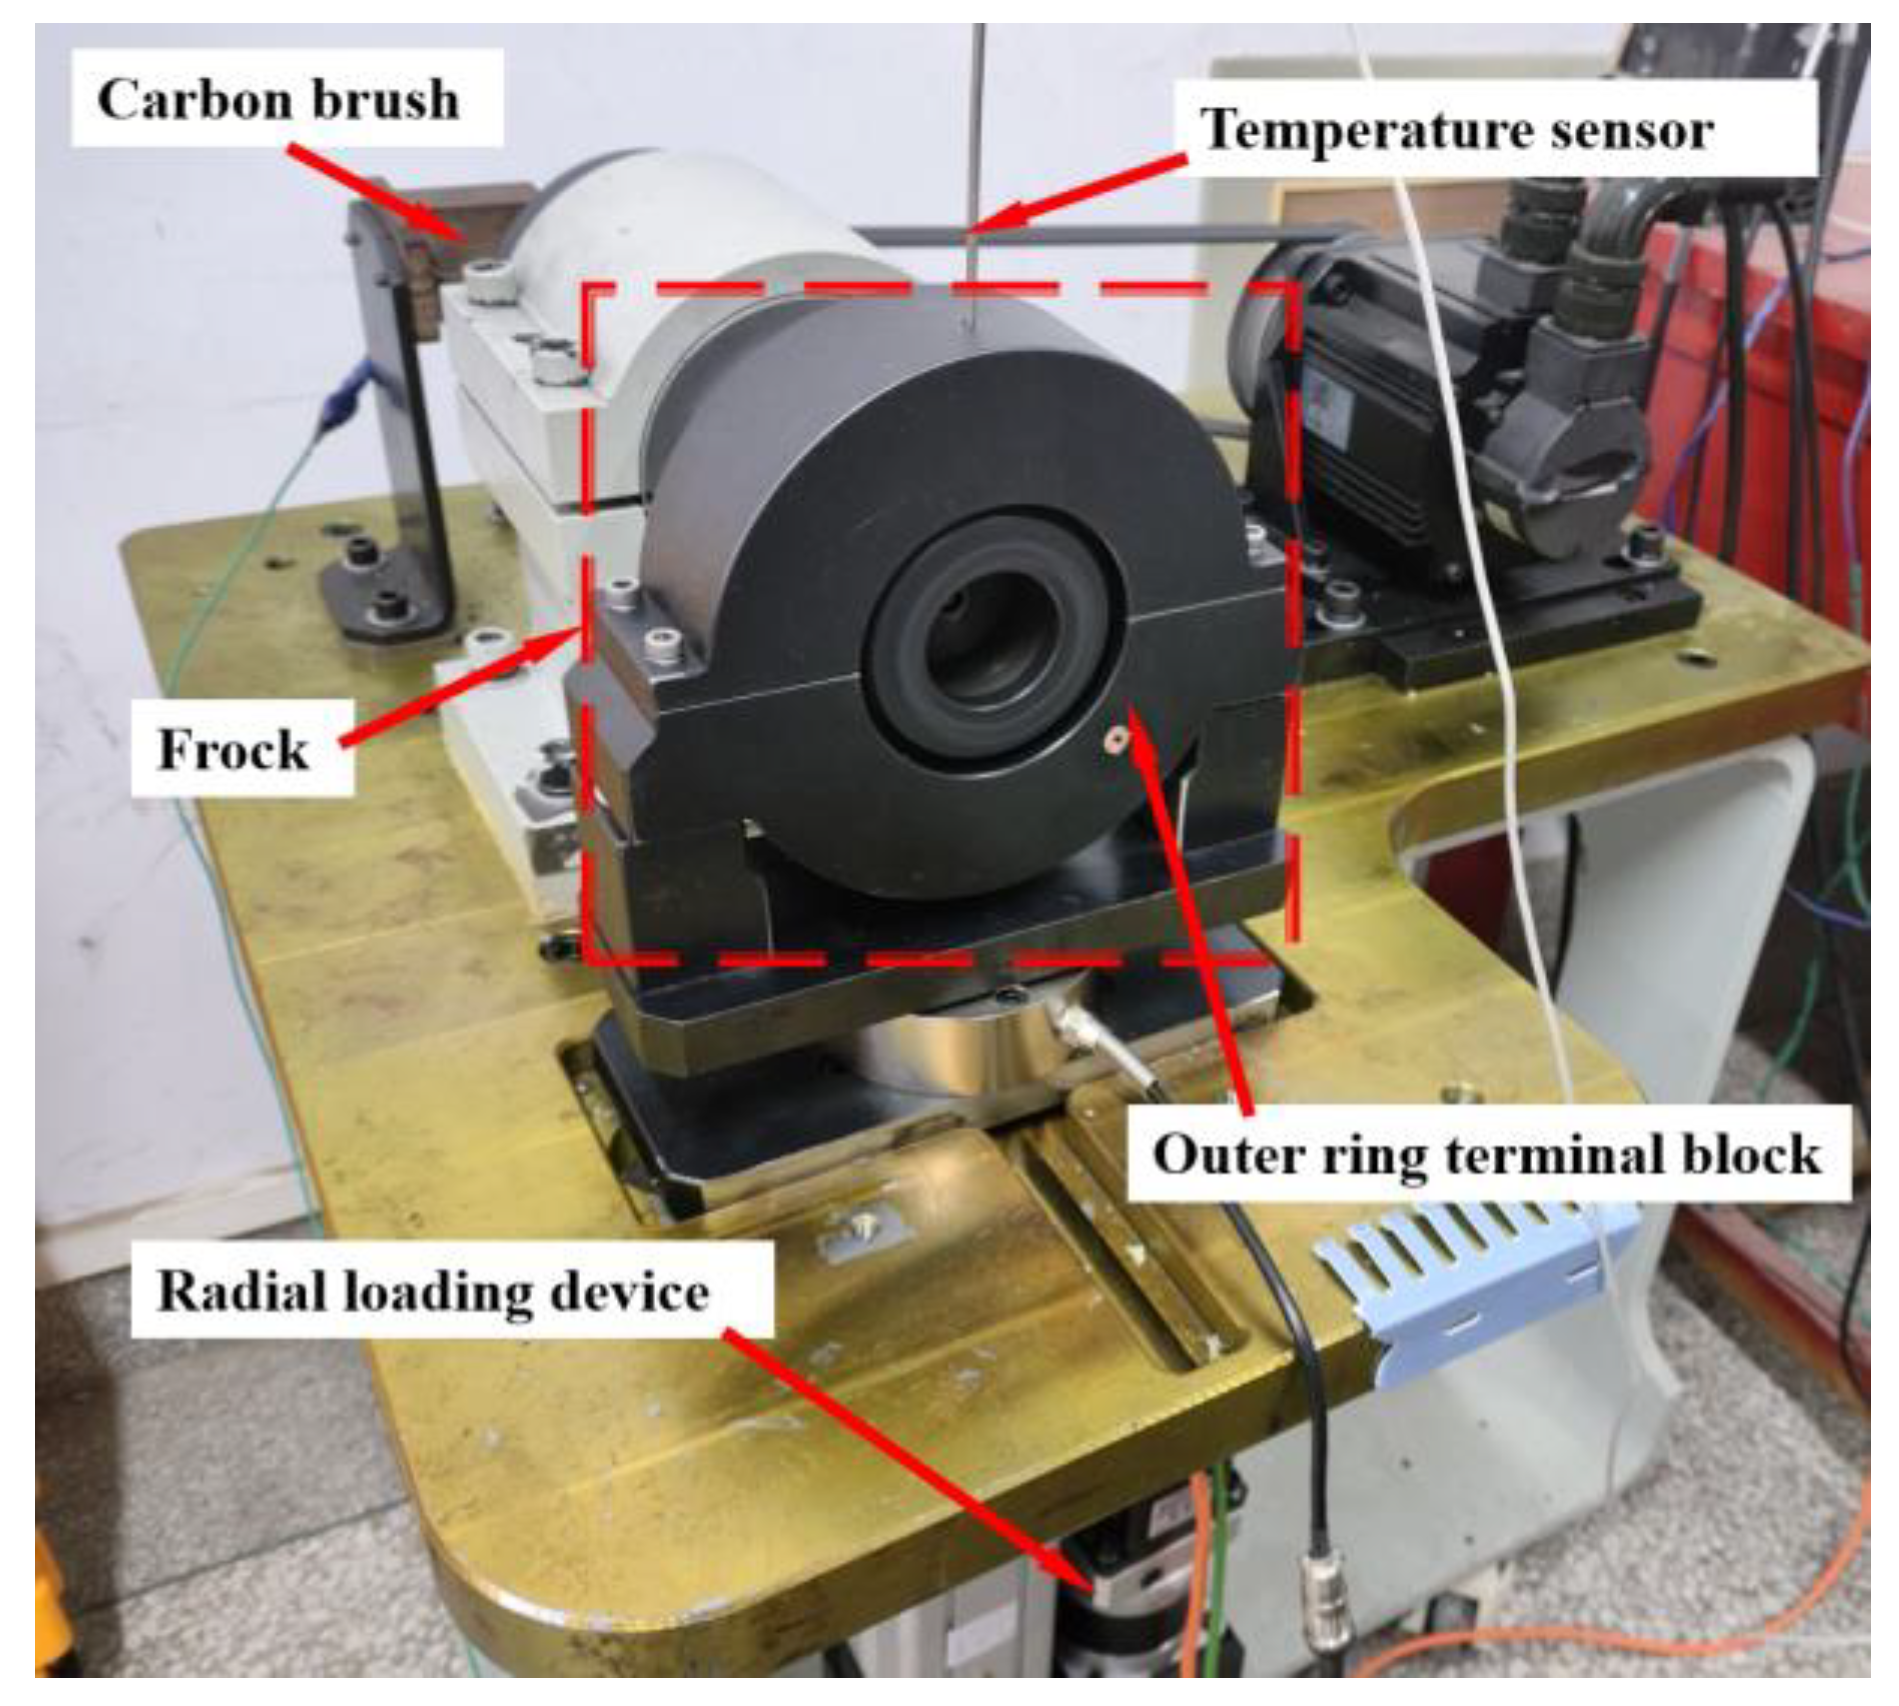
4. Test Verification of the Temperature Field of Grease-Lubricated Bearings

To verify the accuracy of the above simulation model and simulation results, a current bearing testing machine is used to verify the temperature rise change of the outer ring of the bearing as well as verify the residual amount of grease in the bearing cavity once the bearing is running stably. The testing machine mainly includes the main body of the testing machine, power system, axial and radial loading system, temperature sensor and data acquisition system and other components; the testing machine is shown in Figure 16.
The test condition is radial load of 6.9 KN and no axial load, the rotational speed is 4800 r/min, and the length of the test is 600 min. The temperature of the outer ring of the bearing measured by the temperature sensor of the testing machine is shown in Figure 17.
As can be seen in the figure, during the time period of 0–140 min of the test, the temperature rises sharply due to the large friction power consumption in the bearing cavity, where heat generation is much higher than heat dissipation. The maximum temperature of 107 °C was reached in 140 min. In the time period of 140–400 min, the temperature in the bearing cavity is high, and the viscosity of the grease decreases. At this time, the grease discharge rate at the outlet reaches the maximum, the stirring heat is greatly reduced, and the bearing outer ring temperature is reduced. When the test time reaches 400 min, the heat generation and dissipation reach equilibrium. At this time, the amount of grease in the bearing cavity reaches the optimum, and the temperature is finally stabilized at 57.4 °C. Compared with the previous simulation results in Figure 11, the error of the peak temperature of the outer ring of the bearing is 0.93%, and the error of the final stabilized temperature is 0.69%, so the simulation results are consistent with the test results.
Before the test begins, the net weight of the bearing element in the unfilled state is weighed. After the testing machine runs for 600 min, the bearings are unloaded and weighed again. The weight of the bearing is shown in Figure 18.
The total weight of the bearing and the grease is 1367.3 g, of which the net weight of the bearing is 1351 g, and the weight of the grease in the bearing cavity is 11.3 g. Compared with the remaining grease in the bearing cavity simulated above, the simulation error is 7.52%. The amount of residual grease in the bearing cavity accounts for 25.57% of the initial filling amount. The simulation results are highly accurate, and the margin of grease in the bearing cavity can be simulated and predicted more accurately.
There are several reasons for the error between the simulation value and the experimental value. Simulation cannot completely fit the actual modeling, there is a certain simplification. Some parts of the grid drawing of the model are not fine enough. And the test is affected by indoor humidity, air flow, and other environmental factors, some of which cannot be fully considered in the simulation analysis. The above factors cause some deviation between simulation and test values.

5. Conclusions

This study focuses on accurately predicting temperature rise in high-speed EMU traction motor bearings. A fluid–solid–thermal simulation analysis model was constructed for grease-lubricated deep groove ball bearings. The simulation of temperature rise and grease flow behavior was validated through experiments. The findings offer a theoretical foundation and technical assistance for monitoring the health of traction motor bearings in high-speed EMUs. The main conclusions are as follows:
(1)
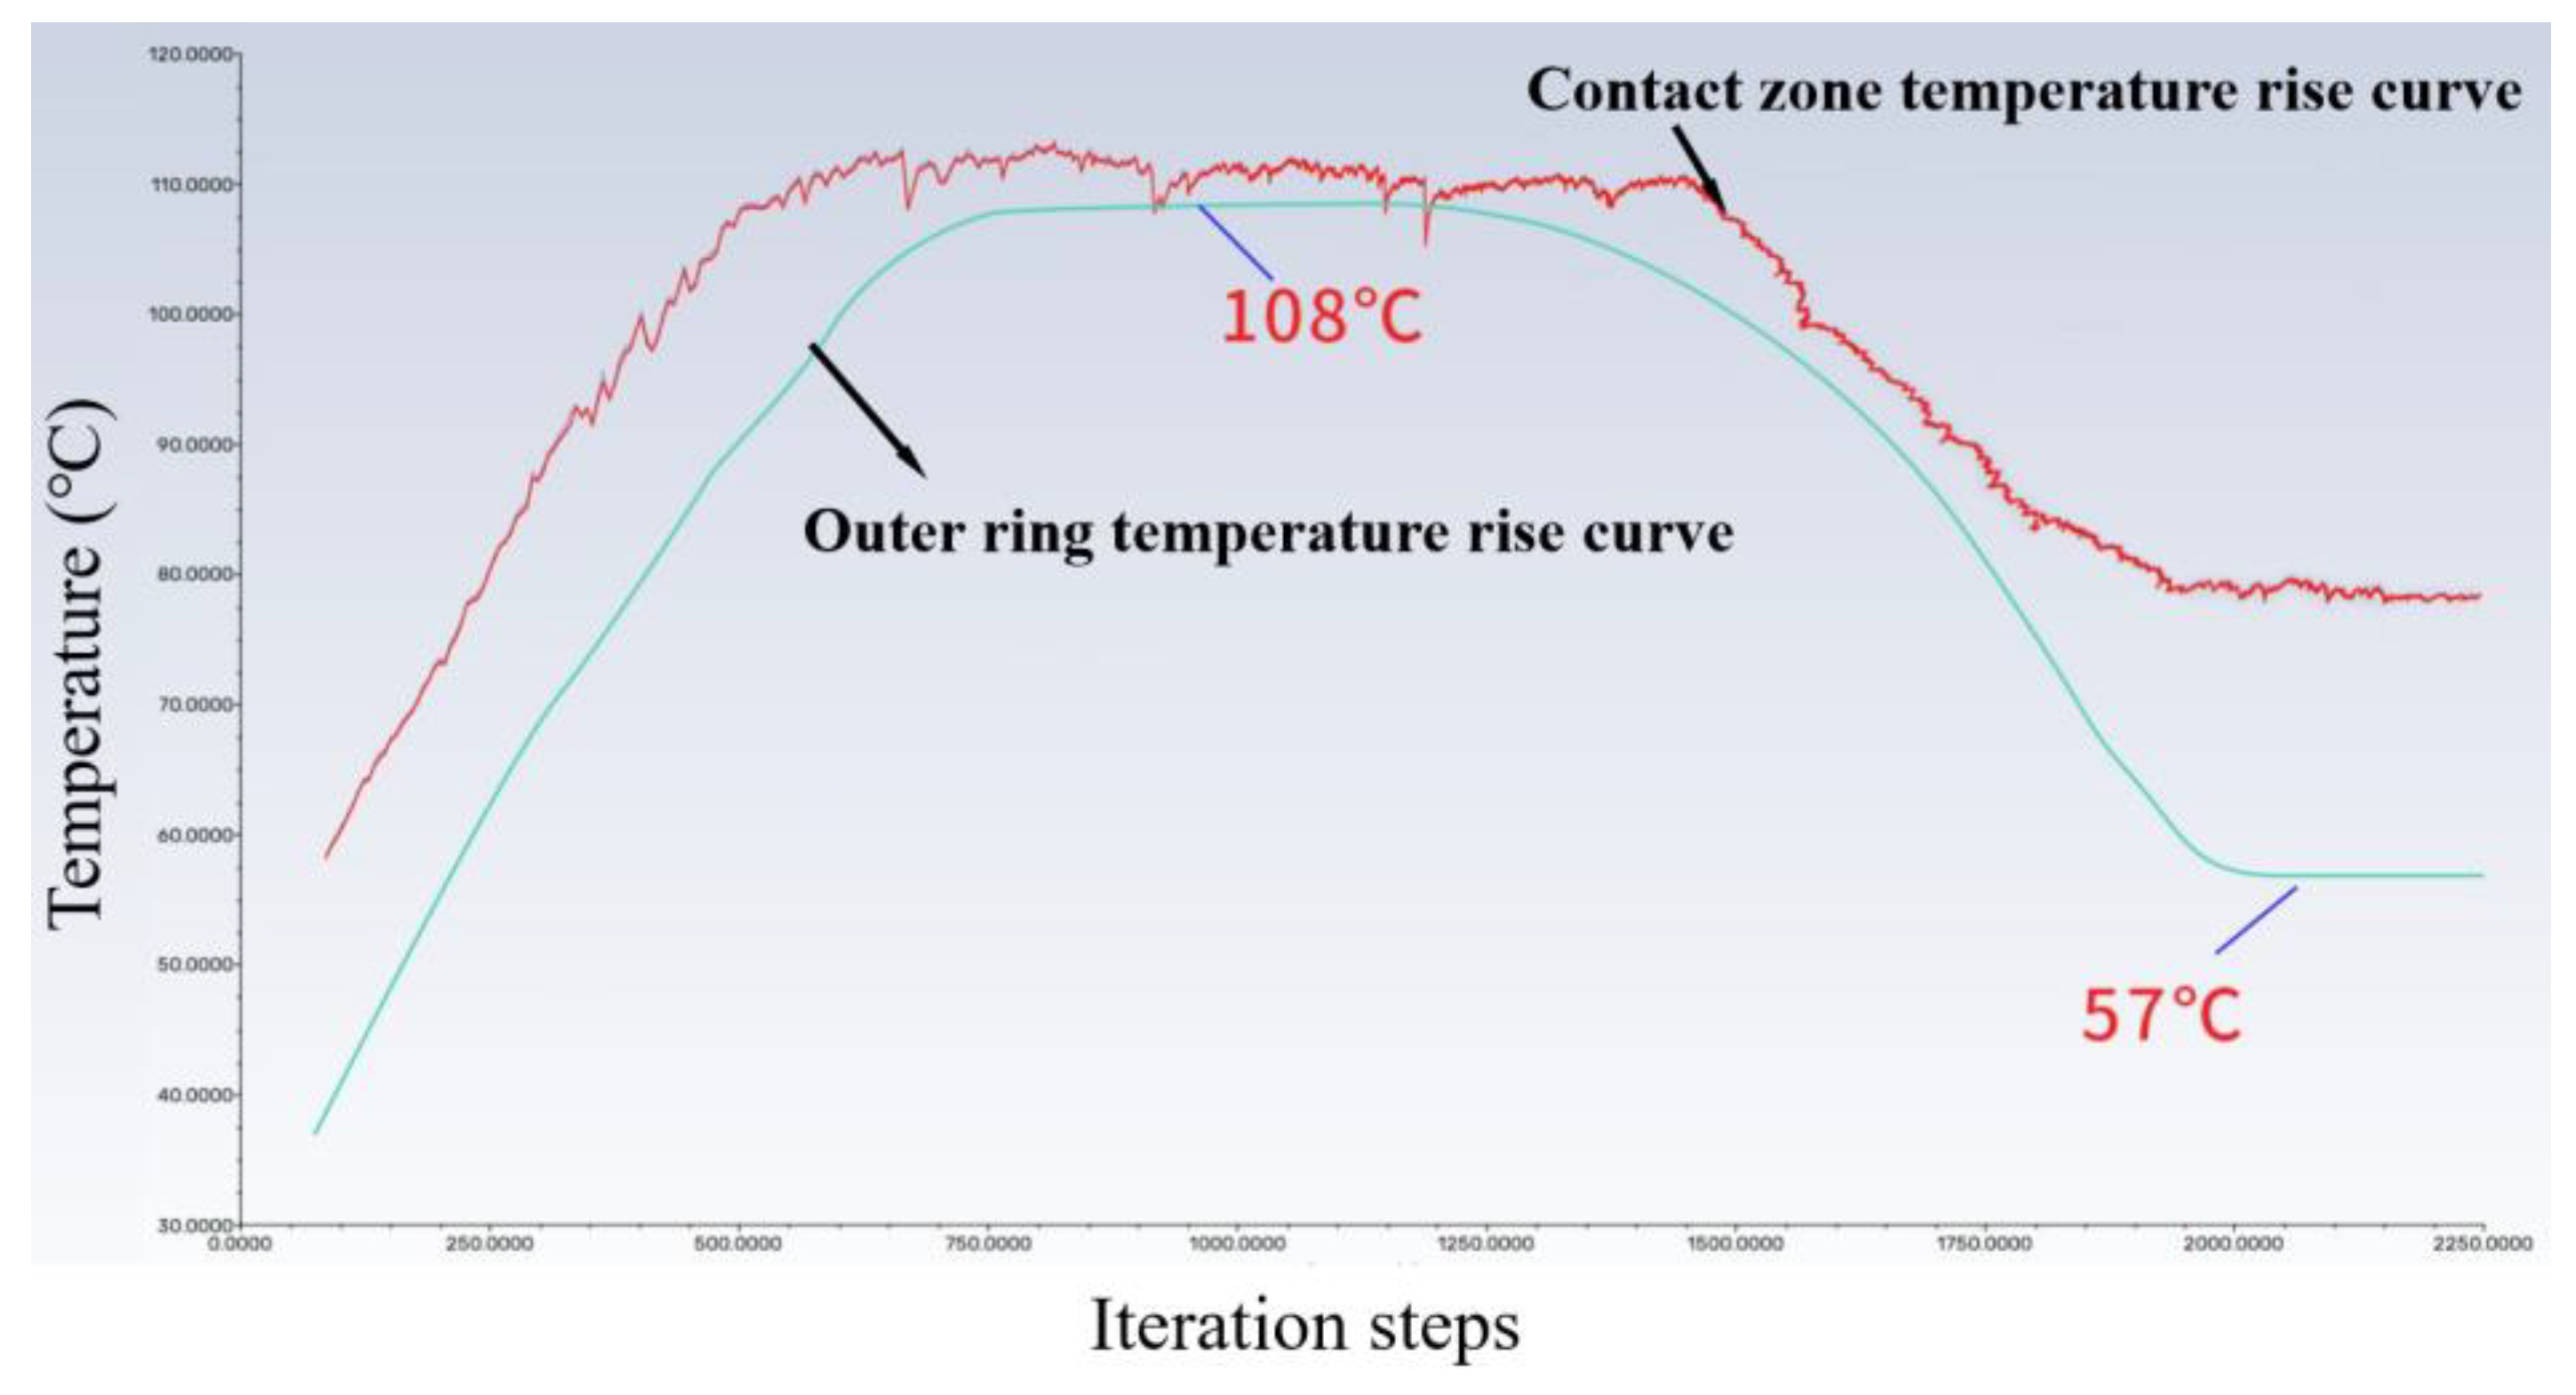
A transient temperature field simulation method considering multi-factor heat dissipation and variable friction power consumption is proposed, which accurately predicts the change process of temperature between ball and raceway, as well as outer ring temperature during grease homogenization. The temperature in the bearing contact zone and ring initially increases to the maximum and then gradually decreases. Finally, it tends to stabilize once heat generation and dissipation reach equilibrium.
(2)
The fluid–solid–thermal coupling simulation analysis model can accurately predict the content of grease involved in effective lubrication in the bearing cavity, which tends to stabilize with the stability of the bearing temperature. The simulation analysis results and test results show that the grease content in the 6215 bearing cavity stabilizes at 25.57% of the initial filling amount.
(3)
In a comparison of simulation and experimental results, the error of the peak temperature of the outer ring is 0.93%, the error of the final stable temperature is 0.69%, and the error of the residual amount of grease in the bearing cavity is 7.52%, which prove the accuracy and effectiveness of the proposed simulation model.

Author Contributions

Conceptualization, H.W., H.L. and Z.J.; Data curation, H.L., J.L. and Z.J.; Formal analysis, H.L., Y.C. and Z.W.; Funding acquisition, Y.C.; Investigation, H.W., Z.J. and C.L.; Methodology, H.W. and H.L.; Project administration, H.W., Z.J. and Y.C.; Resources, Y.C.; Software, H.L., J.L. and C.L.; Supervision, Y.C. and H.W.; Validation, Z.J., J.L. and H.T.; Writing—original draft, H.L. and Z.W.; Writing—review and editing, H.W., H.T. and J.L. All authors have read and agreed to the published version of the manuscript.

Funding

This research was funded by the National Natural Science Foundation of China (52105182, 52005158), Zhejiang Province Key R&D Plan (2021C01095) and Key R&D Plan of Ningbo City (2023Z006).

Data Availability Statement

The data used to support the findings of this study are available from the corresponding author upon request.

Conflicts of Interest

Authors Zheming Jin, Jiang Lin and Zhiwei Wang were employed by the company BH Technology Group Co., Ltd. Author Chang Li was employed by the company Shandong Chaoyang Bearing Co., Ltd. The remaining authors declare that the research was conducted in the absence of any commercial or financial relationships that could be construed as a potential conflict of interest.

References

  1. Ye, J.; Yang, L. Developing of Bearings for Rail Transit Vehicles. Bearing 2013, 12, 61–65. [Google Scholar]
  2. Peng, F.; Zhang, Y. General Review of Rail Transit Bearing Fault Diagnosis and Life Prediction Technology. Urban Mass Transit 2020, 23, 162–168. [Google Scholar]
  3. Yao, L.; Yang, H. The Trend of Greases for Railway Overseas. Pet. Prod. Appl. Res. 2006, 3, 50–53. [Google Scholar]
  4. Li, Q.; Chen, L.; Xu, J.; Chen, G.; Yang, G. Failure Modes of Rolling Bearings for High-speed EMUs and Prospects for Countermeasures. Bearing 2024, 3, 1–8. [Google Scholar]
  5. Wang, Y.; Cao, J.; Tong, Q.; An, G.; Liu, R.; Zhang, Y.; Yan, H. Study on the Thermal Performance and Temperature Distribution of Ball Bearings in the Traction Motor of a High-Speed EMU. Appl. Sci. 2020, 10, 4373. [Google Scholar] [CrossRef]
  6. Kavathekar, S.; Upadhyay, N.; Kankar, P.K. Fault Classification of Ball Bearing by Rotation Forest Technique. Procedia Technol. 2016, 23, 187–192. [Google Scholar] [CrossRef]
  7. Yu, G. Fault feature extraction using independent component analysis with reference and its application on fault diagnosis of rotating machinery. Neural Comput. Appl. 2015, 26, 187–198. [Google Scholar] [CrossRef]
  8. Huang, W.; Sun, H.; Luo, J.; Wang, W. Periodic feature oriented adapted dictionary free OMP for rolling element bearing incipient fault diagnosis. Mech. Syst. Signal Process. 2019, 126, 137–160. [Google Scholar] [CrossRef]
  9. Lugt, P.M.; Velickov, S.; Tripp, J.H. On the Chaotic Behavior of Grease Lubrication in Rolling Bearings. Tribol. Trans. 2009, 52, 581–590. [Google Scholar] [CrossRef]
  10. Xu, J.; Zhang, J.; Huang, Z.; Wang, L. Calculation and finite element analysis of the temperature field for high-speed rail bearing based on vibrational characteristics. J. Vibroeng. 2015, 17, 720–732. [Google Scholar]
  11. Chai, D.; Ding, Q.; Wang, B. Temperature field simulation of herringbone grooved bearing based on FLUENT software. In Proceedings of the 2016 IEEE Advanced Information Management, Communicates, Electronic and Automation Control Conference (IMCEC), Xi’an, China, 3–5 October 2016. [Google Scholar]
  12. Ma, F.; Li, Z.; Qiu, S.; Wu, B.; An, Q. Transient thermal analysis of grease-lubricated spherical roller bearings. Tribol. Int. 2016, 93, 115–123. [Google Scholar] [CrossRef]
  13. Xiu, S.; Xiu, P.; Gao, S. Simulation of Temperature Field of Oil Film in SuperHigh Speed Hybrid Journal Bearing Based on FLUENT. Adv. Mater. Res. 2009, 69–70, 296–300. [Google Scholar] [CrossRef]
  14. Wang, B.M.; Sun, C.; Xiao, C.; Liu, H. Numerical Analysis of Flow Characteristics of Grease in High-speed Angular Contact Ball Bearing. Lubr. Eng. 2018, 43, 109–115+131. [Google Scholar]
  15. Zhang, S.; Lin, X.; Fan, C.; Su, G.; Lu, Y. Study on Structural Optimization and Temperature Characteristics of Hydrostatic Bearing Based on Fluent. Hydraul. Pneum. Seals 2019, 39, 21–24. [Google Scholar]
  16. Palmgren, A. Ball and Roller Bearing Engineering; SKF Industries: Philadelphia, PA, USA, 1945. [Google Scholar]
  17. Deng, K.; Xie, P.; Liao, H.; Zhou, G.; Deng, S. Mechanism of Abnormal Fluctuation of Friction Torque of Control Moment Gyro Bearing Assembly. J. Aerosp. Power 2023, 38, 752–768. [Google Scholar]
  18. Deng, S.; Li, X.; Wang, J.; Wang, Y.; Teng, H. Analysis on Friction Torque Fluctuation of Angular Contact Ball Bearings. J. Mech. Eng. 2011, 47, 104–112. [Google Scholar] [CrossRef]
  19. Deng, S.; Hua, X.; Zhang, W. Analysis on Friction Torque Fluctuation of Angular Contact Ball Bearing in Gyro Motor. J. Aerosp. Power 2018, 33, 1713–1724. [Google Scholar]
  20. Harris, T.A.; Kotzalas, M.N. Advanced Concepts of Bearing Technology; CRC Press: Boca Raton, FL, USA, 2007. [Google Scholar]
  21. Ai, S.; Wang, W.; Wang, Y.; Zhao, Z. Temperature rise of double-row tapered roller bearings analyzed with the thermal network method. Tribol. Int. 2015, 87, 11–22. [Google Scholar] [CrossRef]
  22. Takabi, J.; Khonsari, M.M. Experimental testing and thermal analysis of ball bearings. Tribol. Int. 2013, 60, 93–103. [Google Scholar] [CrossRef]
  23. Takabi, J.; Khonsari, M.M. On the thermally-induced failure of rolling element bearings. Tribol. Int. 2016, 94, 661–674. [Google Scholar] [CrossRef]
  24. Zheng, D.; Chen, W.; Li, M. An optimized thermal network model to estimate thermal performances on a pair of angular contact ball bearings under oil-air lubrication. Appl. Therm. Eng. 2018, 131, 328–339. [Google Scholar]
  25. Neurouth, A.; Changenet, C.; Ville, F.; Arnaudon, A. Thermal modeling of a grease lubricated thrust ball bearing. Proc. Inst. Mech. Eng. Part J J. Eng. Tribol. 2014, 228, 1266–1275. [Google Scholar] [CrossRef]
  26. Zheng, D.; Chen, W. Thermal performances on angular contact ball bearing of high-speed spindle considering structural constraints under oil-air lubrication. Tribol. Int. 2017, 109, 593–601. [Google Scholar] [CrossRef]
  27. Pouly, F.; Changenet, C.; Ville, F.; Velex, P.; Damiens, B. Investigations on the power losses and thermal behaviour of rolling element bearings. Proc. Inst. Mech. Eng. Part J J. Eng. Tribol. 2009, 224, 925–933. [Google Scholar] [CrossRef]
  28. Sadeghi, F.; Sui, P.C. Thermal Elastohydrodynamic Lubrication of Rolling/Sliding Contacts. J. Tribol. 1990, 112, 189–195. [Google Scholar] [CrossRef]
  29. Peterson, W.; Russell, T.; Sadeghi, F.; Berhan, M.T.; Stacke, L.E.; Ståhl, J. A CFD investigation of lubricant flow in deep groove ball bearings. Tribol. Int. 2020, 154, 106735. [Google Scholar] [CrossRef]
  30. Lei, J.; Su, B.; Zhang, S.; Yang, H.; Cui, Y. Dynamics-Based Thermal Analysis of High-Speed Angular Contact Ball Bearings with Under-Race Lubrication. Machines 2023, 11, 691. [Google Scholar] [CrossRef]
  31. Crecelius, W.J.; Pirvics, J. Computer Program Operation Manual on SHABERTH. A Computer Program for the Analysis of the Steady State and Transient Thermal Performance of Shaft-Bearing Systems; US Air Force Technical Report AFAPL-TR-76-90; Defense Technical Information Center: Fort Belvoir, VA, USA, 1976. [Google Scholar]
Figure 1. Effect of grease temperature on frictional power consumption.
Lubricants 12 00144 g001
Figure 2. Schematic diagram of bearing heat transfer.
Lubricants 12 00144 g002
Figure 3. Algorithm flow chart.
Lubricants 12 00144 g003
Figure 4. Draw the model volume mesh. The air domain and bearing seat are selected with a mesh size of 0.5 mm. The inner and outer rings and cages are selected with a mesh size of 0.3 mm. The balls and bearing cavity areas are divided into tetrahedral meshes of 0.2 mm. At least three layers of boundary mesh are added to the fluid–structure coupling boundary, and the mesh accuracy meets the calculation requirements.
Lubricants 12 00144 g004
Figure 5. Simplified model diagram.
Lubricants 12 00144 g005
Figure 6. Frictional power consumption and grease viscosity vary with temperature.
Lubricants 12 00144 g006
Figure 7. Diagram of the iteration.
Lubricants 12 00144 g007
Figure 8. Diagram of the temperature distribution of the outer ring of the bearing. (a) The monitoring point reaches 40 °C. (b) The monitoring point reaches 60 °C. (c) The monitoring point reaches 100 °C.
Lubricants 12 00144 g008
Figure 9. Diagram of the temperature distribution of the inner ring of the bearing. (a) The monitoring point reaches 40 °C. (b) The monitoring point reaches 60 °C. (c) The monitoring point reaches 100 °C.
Lubricants 12 00144 g009
Figure 10. Temperature rise diagram of the inner and outer rings of the bearing.
Lubricants 12 00144 g010
Figure 11. Temperature rise curve of the inner and outer rings of the bearing.
Lubricants 12 00144 g011
Figure 12. Initial filling grease status diagram.
Lubricants 12 00144 g012
Figure 13. Two-phase distribution diagram of oil and gas in the bearing. (a) The monitored temperature reaches 40 °C. (b) The monitored temperature reaches 60 °C. (c) The monitored temperature reaches 100 °C.
Lubricants 12 00144 g013
Figure 14. Flow characteristics of grease in the bearing cavity.
Lubricants 12 00144 g014
Figure 15. Grease flow rate at outlet.
Lubricants 12 00144 g015
Figure 16. Bearing temperature rise testing machine.
Lubricants 12 00144 g016
Figure 17. Temperature rise curve of the outer ring of the bearing.
Lubricants 12 00144 g017
Figure 18. Bearing weighing test.
Lubricants 12 00144 g018
Table 1. Structural parameters of bearings.
ParameterMeaningValueParameterMeaningValue
d Inside diameter75 mm D Outside diameter130 mm
B Width25 mm d m Bearing pitch diameter102.5 mm
f i Coefficient of curvature radius of inner raceway groove0.5097 f e Coefficient of curvature radius of outer raceway groove0.5268
D W Steel ball diameter17.462 mm N Number of steel balls11
λ Radial clearance46~71 μm E 0 The elastic modulus of steel 2.08 × 10 11   P a
C r Basic dynamic radial load rating66,000 N C or Basic static radial load rating49,500 N
Table 2. Physical parameters of the fluid–solid model.
Rings and Ball
(Bearing Steel)
Cage
(Brass)
Bearing Seat
(Grey Cast Iron)
Grease
Density (kg/m3)785083007200880
Specific heat (j/kg·k)4753854471845
Thermal conductivity (w/m·k)44.511839.20.145
Disclaimer/Publisher’s Note: The statements, opinions and data contained in all publications are solely those of the individual author(s) and contributor(s) and not of MDPI and/or the editor(s). MDPI and/or the editor(s) disclaim responsibility for any injury to people or property resulting from any ideas, methods, instructions or products referred to in the content.

